 Meng-Yu Chen
 Yue-Can Zeng
 Xi-He Zhao
94% of researchers rate our articles as excellent or good
Learn more about the work of our research integrity team to safeguard the quality of each article we publish.
Find out more
ORIGINAL RESEARCH article
Front. Cell Dev. Biol. , 15 June 2022
Sec. Cancer Cell Biology
Volume 10 - 2022 | https://doi.org/10.3389/fcell.2022.893490
Small-cell lung cancer (SCLC) is a highly proliferative, invasive lung cancer with poor prognosis. Chemotherapy is still the standard first-line treatment for SCLC, but many patients relapse due to chemoresistance. Along with advances in immunology, it is essential to investigate potential indicators of the immune response and the prognosis of SCLC. Using bioinformatics analysis, we identified 313 differentially expressed genes (DEGs) in SCLC and normal lung samples, and we found that four upregulated genes (TOP2A, CDKN2A, BIRC5, and MSH2) were associated with platinum resistance, while immune-related genes (HLA family genes) were downregulated in SCLC. Then, a prognostic prediction model was constructed for SCLC based on those genes. Immune cell infiltration analysis showed that antigen presentation was weak in SCLC, and TOP2A expression was negatively correlated with CD8+ T cells, while HLA-ABC expression was positively correlated with M1 macrophages, memory B cells, and CD8+ T cells. We also found that TOP2A was related to poor prognosis and inversely correlated with HLA-ABC, which was verified with immunohistochemical staining in 151 SCLC specimens. Our study findings indicated that TOP2A may be a potential prognosis indicator and a target to reverse the immunosuppressive tumor microenvironment of SCLC.
SCLC is a lethal type of lung cancer with poor prognosis and represents approximately 15% of all lung cancers. It is highly aggressive and has a propensity to metastasize early (Gazdar et al., 2017; Blackhall et al., 2018). For more than 30 years, platinum (cisplatin or carboplatin) and etoposide chemotherapy has been administered as the standard first-line treatment for this disease; however, most cases are observed to relapse within 1 year of initial therapy due to chemoresistance (Waqar and Morgensztern, 2017). Recent advances in immunotherapy (e.g., PD-1, PD-L1, and CTLA-4 therapies) have shown promising results for patients with SCLC. Chemotherapy is combined with immunotherapy for SCLC treatment because the disease has a high tumor mutational burden; thus, chemotherapy can stimulate tumoral antigens and increase activation of T cells, thereby enhancing immunogenicity and priming the tumor for the response to immune checkpoint inhibitor treatment (Mak et al., 2019; Hiddinga et al., 2021). IMPOWER-133, a phase III trial, demonstrated that immunotherapy (atezolizumab or durvalumab) combined with platinum–etoposide chemotherapy achieved longer progression-free survival (PFS) (6.3 vs. 5.6 months) and patient overall survival (OS) (33.5 vs. 20.4% long-term survivors for control) compared with chemotherapy alone (Horn et al., 2018). Several other phase III studies (e.g., the CASPIAN trial and KEYNOTE-604 study) found that compared with treatment by chemotherapy alone, PFS and OS were significantly prolonged when immunotherapy and platinum-based front-line chemotherapy were combined (Paz-Ares et al., 2019; Rudin et al., 2020). However, results for maintenance immunotherapy after discontinuing first-line chemotherapy in the CheckMate-451 trial were unsatisfactory (Ready et al., 2016). Similarly, results for the CheckMate-331 trial showed that nivolumab as second-line therapy did not improve outcomes compared with the use of topotecan or amrubicin (Reck et al., 2018). Therefore, identifying biomarkers that could potentially identify patients who would benefit from immunotherapy is essential.
SCLC was previously classified into two subgroups, namely, classic and variant (Gazdar et al., 1985), and later, it was grouped into neuroendocrine and non-neuroendocrine categories (Zhang et al., 2018). At present, SCLC is grouped into four subtypes based on specific transcription factors: ASCL1 (SCLC-A), NEUROD1 (SCLC-N), POU2F3 (SCLC-P), and YAP1 (SCLC-Y) (Borromeo et al., 2016; Huang et al., 2018; Rudin et al., 2019). However, a newly proposed SCLC subtype “SCLC-I,” which is characterized by high expression of immune checkpoints or human leukocyte antigens (HLAs), has been noted to be correlated with cisplatin resistance and shows improved benefits from treatment using chemotherapy combined with immunotherapy (Gay et al., 2021). Of note, a subtype of SCLC has been noted to switch to another subtype under specific conditions, for example, cisplatin treatment of xenografts developed from patients with SCLC-A (MDA-SC68 model) enables SCLC-A to switch to SCLC-I, which suggests that targeting subtype transformations could be a means of regulating the mechanisms of the immune response and acquired platinum resistance (Gay et al., 2021). However, these classifications are controversial and require further investigation (Baine et al., 2020). A better understanding of antitumor immunity is also essential in order to elucidate the underlying mechanism of cancer immunosuppression and encourage biomarker development.
Topoisomerase IIα (TOP2A) is a protein that is strongly expressed in proliferating cells, and it plays vital roles in regulating DNA replication, gene transcription, and mitosis (Tsai-Pflugfelder et al., 1988; Ali and Abd Hamid, 2016). Many studies have shown that TOP2A has the capacity to predict the sensitivity of breast cancer to anthracyclines. In addition, tumor cells with p53 mutations may exhibit high levels of TOP2A and may be more sensitive to TOP2A inhibitors (Liu et al., 2002); about 90% of patients with SCLC have p53 mutations (Delgado et al., 2005). High expression of TOP2A was reported to be associated with poor prognosis of NSCLC (Kou et al., 2020). However, only a few studies have investigated the clinical value of TOP2A expression in SCLC. Therefore, it is necessary to analyze the data of small-cell lung cancer obtained from existing databases to ascertain the clinical role of TOP2A in predicting survival outcome and immune response.
In this study, four GSE datasets [GSE6044 (Rohrbeck et al., 2008), GSE43346 (Sato et al., 2013), GSE60052 (Jiang et al., 2016), and GSE149507 (Cai et al., 2021)] were obtained from the GEO database to perform SCLC-related DEG analysis. A total number of 313 DEGs were identified in our study. Additionally, pathway enrichment and protein–protein interaction network (PPI) were conducted on the DEGs to select hub genes. Thereafter, a risk prediction score model was constructed. In addition, the clinical outcomes of different groups and correlations between genes in the model and immune-related cells were further investigated. Finally, immunohistochemistry analysis was performed to verify bioinformatics results. The study design is shown in Figure 1.
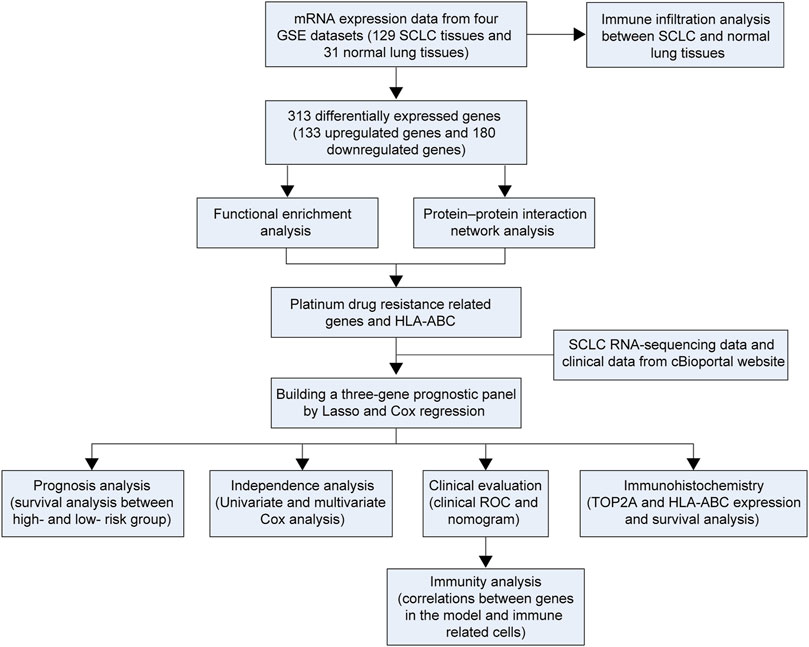
FIGURE 1. Flowchart of the study.
Four microarray expression profiles (i.e., GSE6044, GSE43346, GSE60052, and GSE149507) were obtained from the GEO database. The selected expression datasets satisfied the following criteria: 1) Studies were of human small-cell lung cancer tissues and corresponding para-cancerous tissues/normal lung tissues, 2) the number of samples included in each dataset was at least greater than 10, 3) the SCLC patients were naïve (untreated), and 4) the dataset search was limited to those studies written in English. The characteristics of the four selected datasets are shown in Table 1. For microarray data not shown in the form of log2-transformed values, log2 conversion was performed. If the data were not quantile-normalized, then the normalizeBetweenArrays method in the limma package of R was used for quantile normalization. The expression data were averaged for cases where multiple probes were mapped to one gene. Four GSE datasets were used to perform DEG identification, functional enrichment analysis, PPI network, and immune infiltration analysis in SCLC and normal lung tissue.
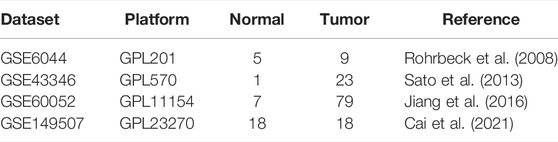
TABLE 1. Basic characteristics of four GSE datasets.
DEGs were identified using the limma package (version 3.42.2) with the empirical Bayes method (Ritchie et al., 2015). Key parameters that selected DEGs conformed to the following criteria: |log2 fold change (FC)|>1 and adjusted p < 0.05. The RobustRankAggreg package (version 1.1) was used to integrate DEGs from four selected gene profiles. Heatmaps (package: pheatmap, version 1.0.12) and volcano plots (package: ggpubr, version 0.4.0) were used to visualize gene expression patterns. The common DEGs among these four datasets were obtained by using “Venn Diagram.”
A GO analysis including biological process (BP), cellular component (CC), and molecular function (MF) was performed to better explore potential biological function of DEGs. In addition, KEGG analyses were performed on the up- and downregulated genes using the Bioconductor package “clusterProfiler” (version 3.14.3). Notably, q value (adjusted p value) < 0.05 was used as a cutoff, and only GO terms and signal pathways passing this threshold were considered significant.
To better decipher the connections between the identified DEGs, the STRING biological database was utilized to construct the original PPI network. Only those DEGs with interaction scores >0.9 could be mapped into the network (Szklarczyk et al., 2019). Cytoscape 3.8.1 was utilized for the generation and visualization of the PPI network (Smoot et al., 2011). The top thirty genes with the maximum interactions were defined as hub genes using the cytoHubba plug-in of Cytoscape software (Chin et al., 2014). In addition, the highly interconnected clusters were extracted from the PPI network using another plug-in, MCODE.
We procured SCLC RNA sequencing as well as corresponding clinical data from the cBioPortal database for the construction of a prognostic model; FPKM values were subsequently transformed into TPM values. Samples were included when both mRNA-sequencing data and corresponding survival data of an SCLC patient were accessible (77 samples). For platinum-related genes (that were obtained from functional enrichment analysis) and HLA class I genes, we performed LASSO regression analysis (ten-fold cross confirmation and p < 0.05) using R package glmnet (version 4.1.1). Then, those selected genes were utilized to generate a prognostic model for SCLC using multivariate regression analysis (package: rms; version 6.2.0).
Next, we observed the survival differences between high- and low-risk subgroups (the median value of risk score was used as a cutoff) via Kaplan–Meier analysis by using the “survive” and “survminer” R packages. Next, the 1-, 3-, and 5-year receiver operating characteristic (ROC) curves of the proposed model for SCLC in comparison to other clinicopathological factors were drawn. Besides, univariate and multivariate Cox regression analyses were implemented to show whether our proposed model had predictive value for the prognosis of SCLC. A nomogram was generated to predict 1-, 3-, and 5-year OS of SCLC patients.
In addition, a chi-square test was conducted to disclose relationships between the model and other clinicopathological characteristics by using the “ComplexHeatmap” R package (version 2.2.0). Furthermore, a scatter diagram was used to visualize the Wilcoxon signed-rank test analysis results, which revealed differences in risk scores across distinct groups of clinicopathological characteristics.
To show the independent prognostic potential of platinum resistance–related genes and genes in the proposed model (i.e., MSH2, TOP2A, BIRC5, CDKN2A, and HLA-ABC), we used survival and survminer packages to perform Kaplan–Meier analysis. Patients were clustered into two groups (high- or low-expression groups) based on the corresponding optimal cutoff value for each gene.
The immune infiltration analysis in SCLC and normal lung tissue was performed by using CIBERSORT (https://cibersort.stanford.edu), which could provide mRNA expression profiling of 22 immune cells. Notably, GSE6044 and GSE149507 only have 9 and 18 tumor samples, respectively. Given that analysis of few tumor samples may provide unreliable outcomes, we integrated four datasets to increase the total number of samples. The sva package (version 3.20) in R software (version 3.6.3; 64-bit) was applied to adjust potential batch effects. Besides, Spearman correlation analysis of the expression of the key genes (i.e., TOP2A, CDKN2A, BIRC5, MSH2, and HLA-ABC) and infiltrating immune cells was conducted by using the “ggpubr” package in the cBioPortal cohort.
Paraffin-embedded specimens were obtained from 151 patients with primary SCLC confirmed by surgery or needle biopsy between April 2013 and October 2019 at the Department of Clinical Oncology, Shengjing Hospital of China Medical University. In addition, none of patients had secondary tumors or other severe diseases, nor did they receive preoperative chemotherapy or radiotherapy. Overall survival time of individuals was assessed from the surgery date to the date of event occurrence (death or last follow-up). The last follow-up was on 19 December 2021. All patients provided informed consent before surgery.
The specific steps for the immunohistochemistry (IHC) procedure were performed strictly according to the instructions. Paraffin-embedded sections underwent xylol dewaxing and rehydration routinely, and then endogenous catalase was inactivated with 3% H2O2 solution (15 min). For better exposing antigenic sites, the sections were immersed in a pre-heated citrate buffer (95–96°C, pH 6.1) for 20 min and then blocked in 5% normal goat serum to avoid unspecific binding (15 min). The sections were then incubated with anti-TOP2A antibodies (1:100, Proteintech, United States) or anti-HLA-ABC (1:5000, Proteintech, United States) antibodies at 4°C overnight and then incubated with biotin-labeled goat anti-mouse/rabbit IgG (Zhongshanjinqiao, Beijing, China) at 37°C for 120 min. DAB (Zhongshanjinqiao, Beijing, China) was used for detection.
Three random images of each SCLC section were taken at high-power fields (×200), and Image-Pro Plus (version 6.0) was used to measure the average optical density (IOD/area). Thus, the staining index of SCLC tissues was quantified. For HLA-ABC analysis, the assessment was primarily based on the presence of membranous staining, while TOP2A staining was mainly based on intracytoplasmic or intranuclear staining. A time-dependent ROC curve was used to better ascertain the cutoff value of TOP2A and HLA-ABC (package: survivalROC, version 1.0.3).
The χ2 test was utilized to disclose associations between TOP2A, HLA-ABC, and categorical variables (SPSS, Chicago, IL, United States, version 3.6.3). Survival data of patients with SCLC were analyzed using the Kaplan–Meier method, and comparison of different survival times between groups was drawn using the log-rank test (package: survminer, version 0.4.8). Correlation analysis between TOP2A and HLA was conducted using the Pearson method (SPSS) in datasets obtained from GSE datasets and the cBioPortal website, while Spearman rank correlation was used in our own cohort (two-sided p values and p < 0.05 was considered statistically significant).
Four microarray datasets (GSE6044, GSE43346, GSE60052, and GSE149507) were used to analyze DEGs, and volcano plots of DEGs for each dataset are presented in Figures 2A–D. The overlap of these DEGs was examined using a Venn diagram (Figure 2E). Then, these DEGs were integrated using the robust rank aggregation algorithm of the RobustRankAggreg package to obtain 313 DEGs (tumor vs. normal; 133 upregulated DEGs and 180 downregulated DEGs, respectively). A heatmap of the DEGs is shown in Figure 2F. The top 10 upregulated genes were CDC20, NOL4, INSM1, INA, NUSAP1, BIRC5, UCHL1, MAD2L1, TOP2A, and RRM2, while the top 10 downregulated genes were AQP1, MSLN, SLP1, SFTPD, SFTPC, PTGDS, FOLR1, CYP4B1, ADH1B, and SCGB1A1.
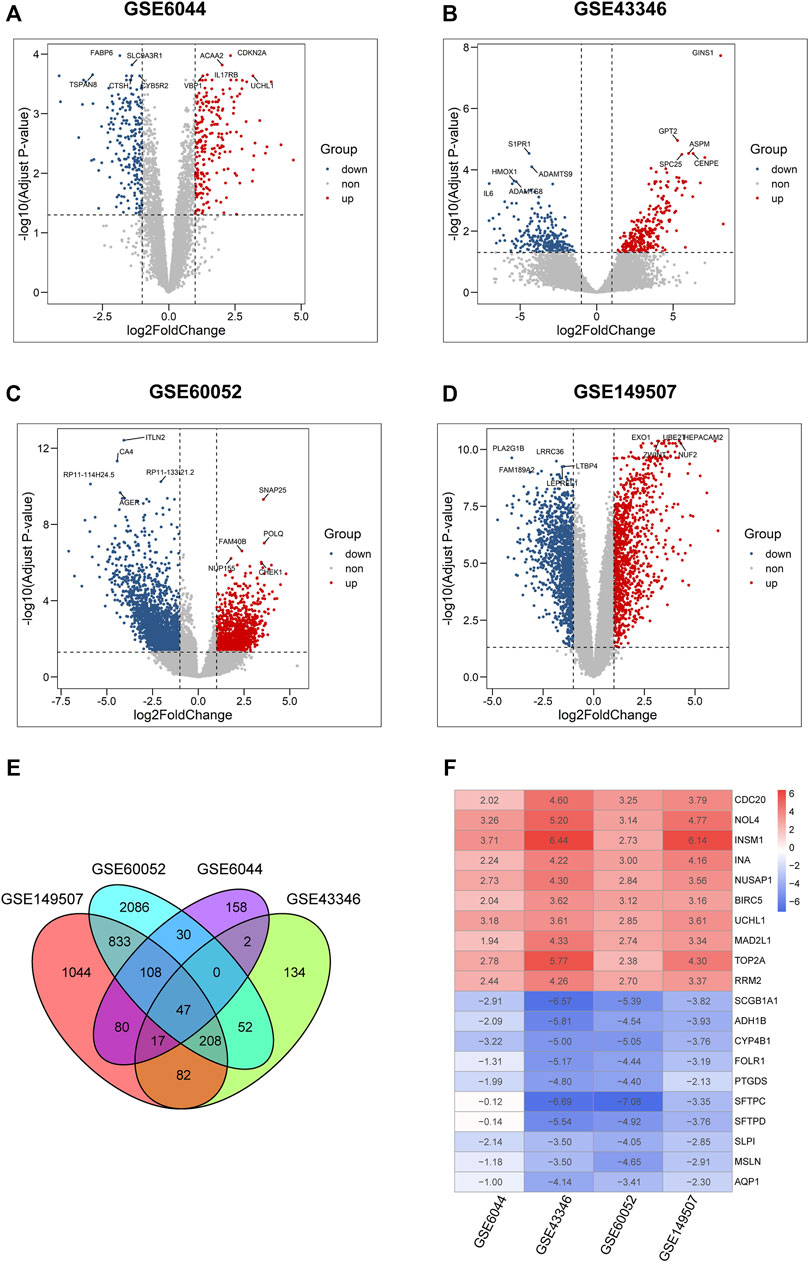
FIGURE 2. Identification of DEGs in four microarray datasets from GEO. (A–D) Volcano plots of differential expression analysis for GSE6044, GSE43346, GSE60052, and GSE149507. Plots in red, blue, and gray represent upregulated, downregulated, and non-significant genes, respectively. (E) Venn diagram of the overlapped differential expressed genes in four GSE datasets. (F) Expression heatmap of top 10 up- and down-regulated genes, each column in the table represents a Log2FC value calculated for each gene.
To shed light on the biological roles of DEGs in patients with SCLC, we performed GO and KEGG enrichment analyses for both upregulated and downregulated genes. Results of the GO analysis revealed that upregulated DEGs mainly focused on the cell mitosis process and microtubule motor activity (Figure 3A), and the KEGG analysis revealed that those genes were primarily mapped to the process related to cell cycle, DNA replication, p53 pathway, and platinum drug resistance (Figure 3C). In contrast, among the downregulated DEGs, GO terms showed significant enrichment in neutrophil-mediated immunity (Figure 3B), while KEGG analysis also showed enrichment in cytokine–cytokine receptor interaction and activation of transcription and the interleukin-17 signaling pathway (Figure 3D).
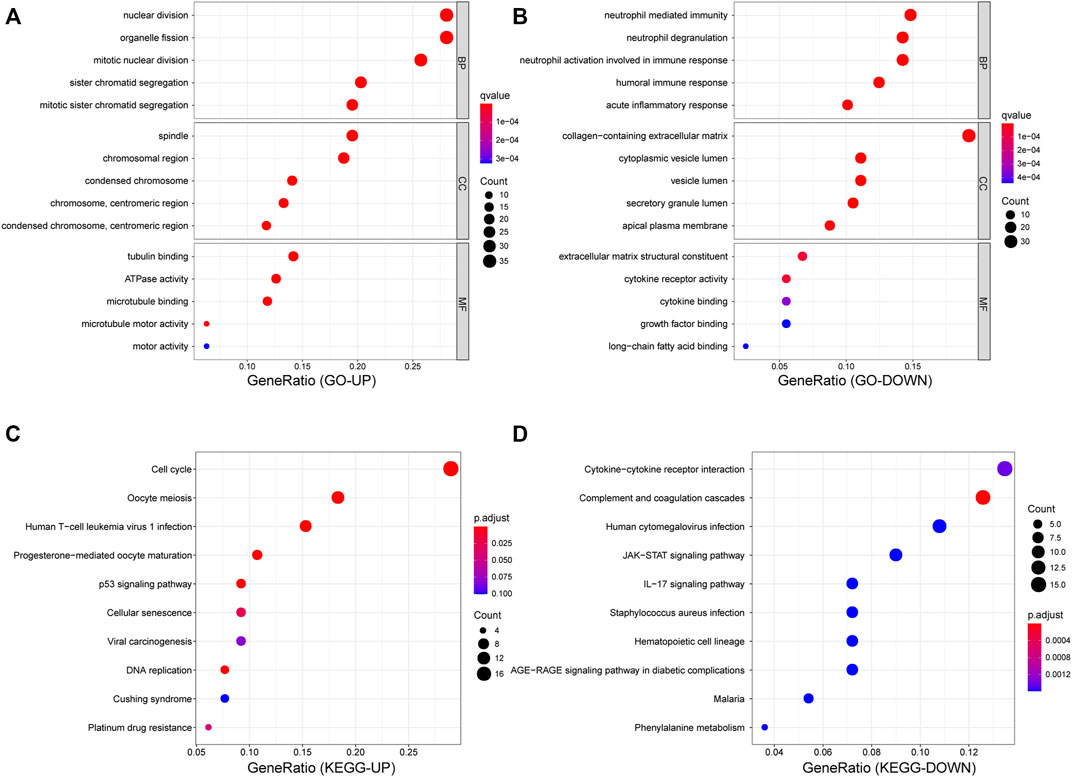
FIGURE 3. Functional enrichment analyses for DEGs. (A,B) Dot plot of GO enrichment analysis of up- and down- regulated genes. (C,D) Dot plot of KEGG enrichment analysis of up- and down-regulated genes.
As depicted in Figure 4. 313 nodes and 1,548 edges were involved in the PPI network. The top 30 hub genes were screened on the basis of connectivity degree in this network (Figure 4F). The MCODE plug-in was then optimized to identify clusters in the network; four clusters were identified using k-core = 2 (Figures 4B–E). Cluster 1 had 32 nodes and 453 edges; it was the highest scoring cluster among those identified (Figure 4B). Core genes were also screened based on functional enrichment analysis and candidate hub genes. Our KEGG analysis further investigated four platinum resistance–related genes, that is, TOP2A, CDKN2A, BIRC5, and MSH2. Among these, TOP2A and BIRC5 were included in module 1 and with 37 and 35 connections, respectively, suggesting that they potentially play critical roles in SCLC. Notably, HLA-DMA was downregulated in SCLC tissues in contrast with its expression in normal tissues (logFC = −1.7849; p = 0.018). HLA genes are known to have an important function in immune response; therefore, to further investigate the expression of HLA family genes in SCLC, we searched each GEO dataset to find neglected information. We found that HLA-E was downregulated in GSE6044; HLA-E, HLA-DQB1, HLA-DPB1, and HLA-DMA were downregulated in GSE149507; and HLA-B, HLA-DQB1, HLA-DQB2, HLA-E, HLA-DMA, HLA-DPA1, HLA-DPB1, HLA-DRA, HLA-DRB1, HLA-DRB6, and HLA-DOA were downregulated in GSE60052; in contrast, HLA-related DEGs were not found in GSE43346. In summary, TOP2A and BIRC5 were upregulated in SCLC, whereas HLA family genes were possibly downregulated in SCLC.
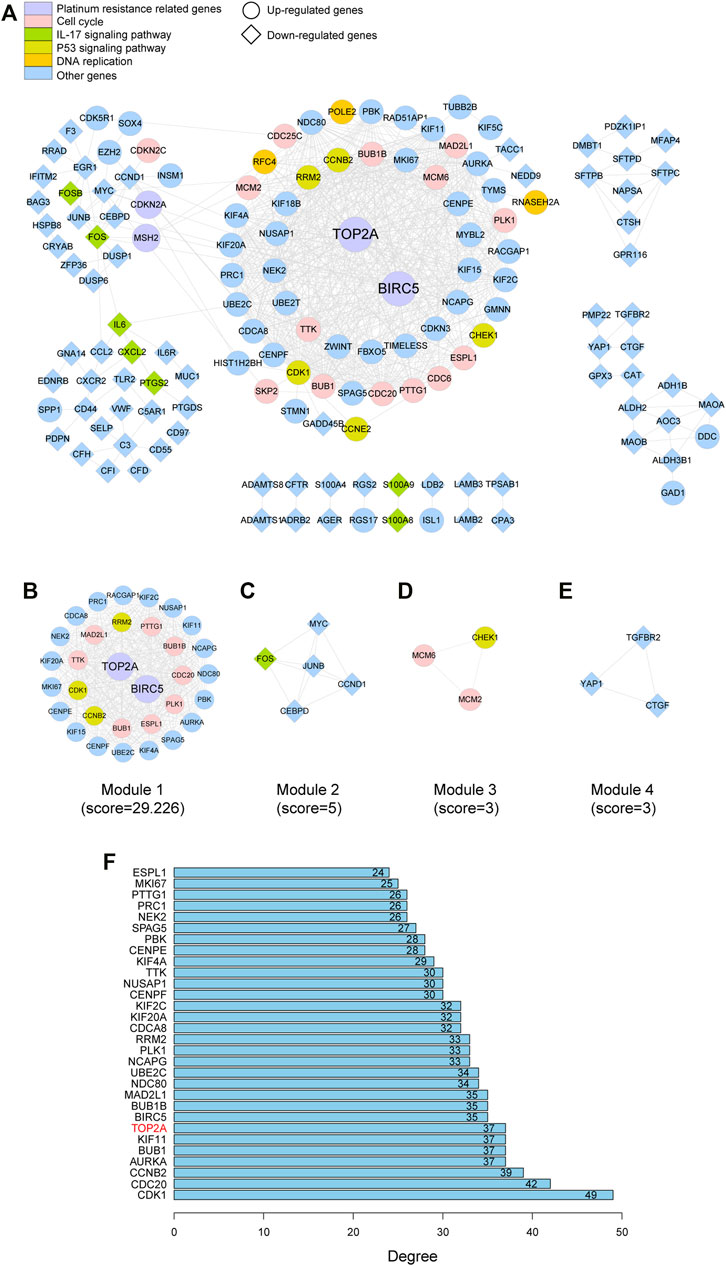
FIGURE 4. PPI network of the DEGs and hub gene identification. (A) Visualization of the PPI network of DEGs identified in samples from GSE datasets. (B–E) Network of four functional clusters that were identified by MCODE. (F) Top 30 genes with high degree calculated by cytoHubba.
We screened out five genes (i.e., TOP2A, BIRC5, CDKN2A, MSH2, and HLA-ABC) for further LASSO regression in light of the above findings. According to the optimal value of λ, the three-gene–based signature had superior predictive value (Figure 5B), and coefficients for each gene are presented in Figure 5A. Finally, a prognostic prediction panel was established. For each patient, the risk score was computed as follows:
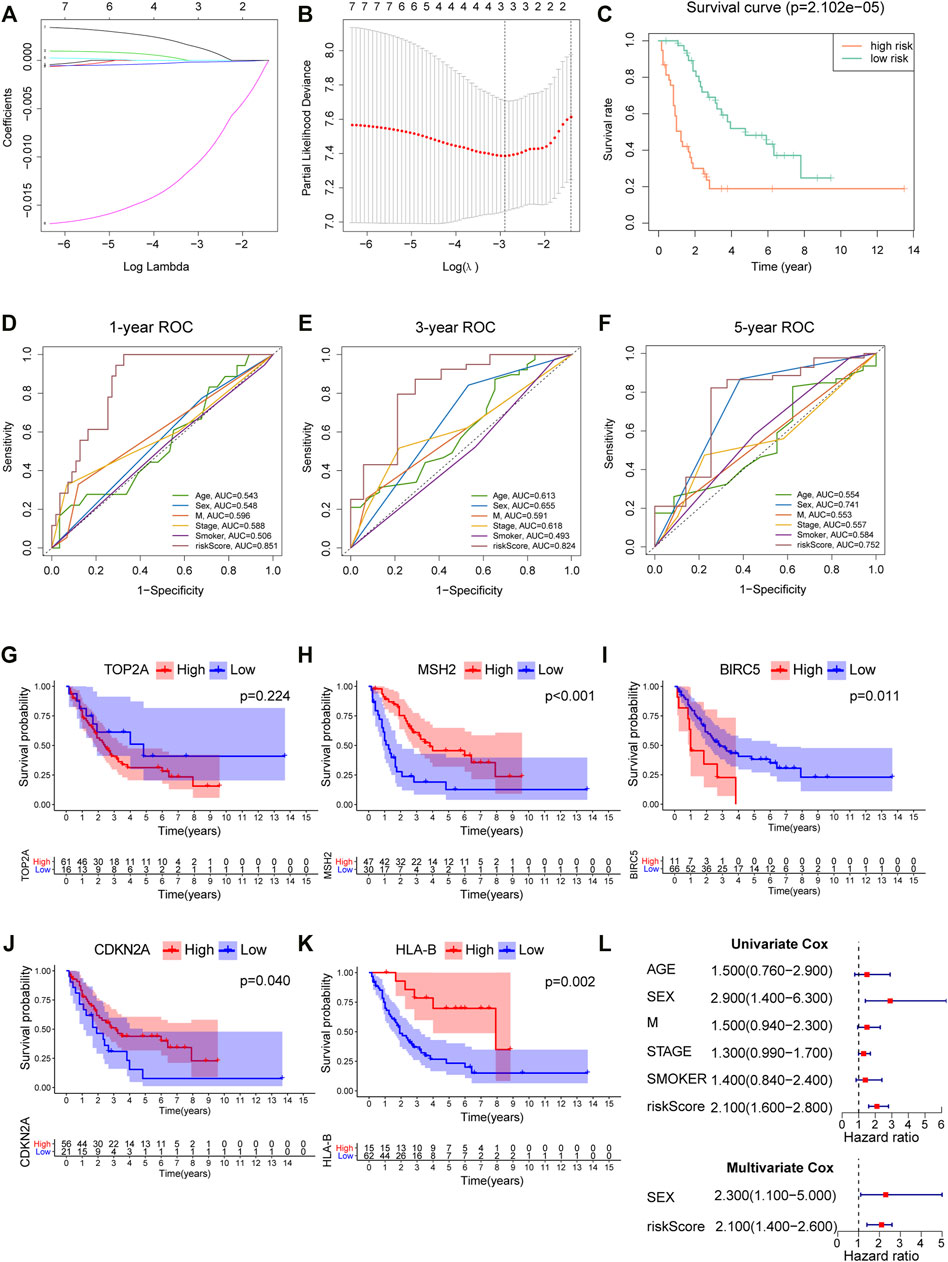
FIGURE 5. Construction and verification of a prognostic model for SCLC. (A) Coefficient patterns of the candidate 7 variables in the LASSO model. (B) Tenfold cross validation was applied to select the proximal turning parameter (λ) via minimum criteria (the 1-SE criteria) in the LASSO model. (C) Kaplan–Meier curves of 77 SCLC patients stratified by the median value of risk score. (D–F) 1-, 3-, and 5-year ROC curves of risk score, age, sex, distant metastasis, clinical stage, and smoking history in the cBioPortal cohort. (G–K) Survival analysis of platinum resistance–related genes and HLA-B in 77 SCLC patients; the median expression of each gene was used as the cutoff. (L) Forest maps of univariate and multivariate Cox regression in the cBioPortal cohort.
According to the median levels of risk score, patients were dichotomized into high- and low-risk groups. As shown in Figure 5C, patients with higher risk had significantly worse survival. Besides, our model outperformed other variables including patient age, gender, smoking, and metastasis status (Figures 5D–F), with an AUC = 0.851, 0.824, and 0.752 for 1, 3, and 5 years, respectively. In addition, survival analysis was employed to analyze platinum resistance–related genes (i.e., HLA-B, TOP2A, MSH2, BIRC5, and CDKN2A) and prognosis (Figures 5G–K). Patients with high expression of HLA-B, MSH2, and CDKN2A expression had better survival. Although p value for TOP2A was greater than 0.05, it can be seen from Figure 5G that the long-term survival of patients with high expression of TOP2A was worse than those with lower expression. Furthermore, results showed that a high risk score denoted worse prognosis, and this proposed model was predictive of outcomes in SCLC (Figure 5L).
Correlations between the model and various clinicopathological characteristics were further investigated by using the chi-square test; however, results indicated that the risk score was not significantly associated with clinicopathological factors (Figure 6A). Then, the Wilcoxon signed-rank test was performed to analyze possible discrepancy in risk score among subgroups stratified by clinicopathological characteristics. As indicated in Figures 6B–D, stage IV had a higher risk score than stage I–III. Similarity, N0–2 also showed no differences, but they had a much lower risk score than N3. Besides, distant metastasis was positively correlated with risk scores. A nomogram based on the panel and other traditional clinicopathological characteristics was constructed, as shown in Figure 7A. The calibration curve showed adequate fit of the proposed nomogram model in predicting 1-, 3-, and 5-year OS of SCLC (Figures 7B–D).
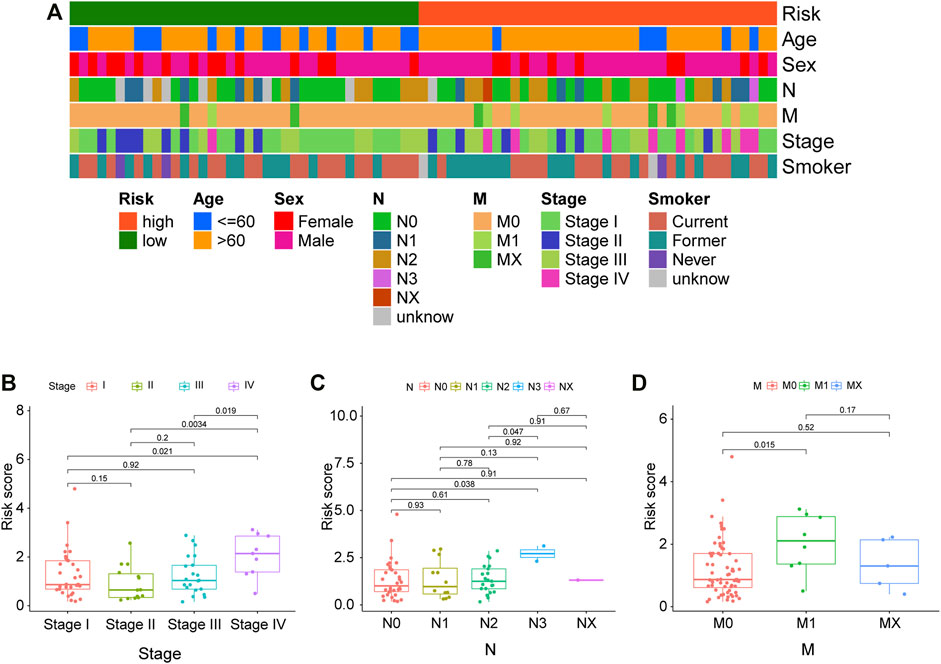
FIGURE 6. Correlations between clinical characteristics and risk score in the cBioPortal cohort. (A) The correlations between various clinical characteristics and risk score. Correlation coefficient and p values were determined by the Spearman rank correlation test. p < 0.001 = ∗∗∗, p < 0.01 = ∗∗, and p < 0.05 = ∗. (B–D) Correlations between the risk score and different tumor stages, N stage, and M stage.
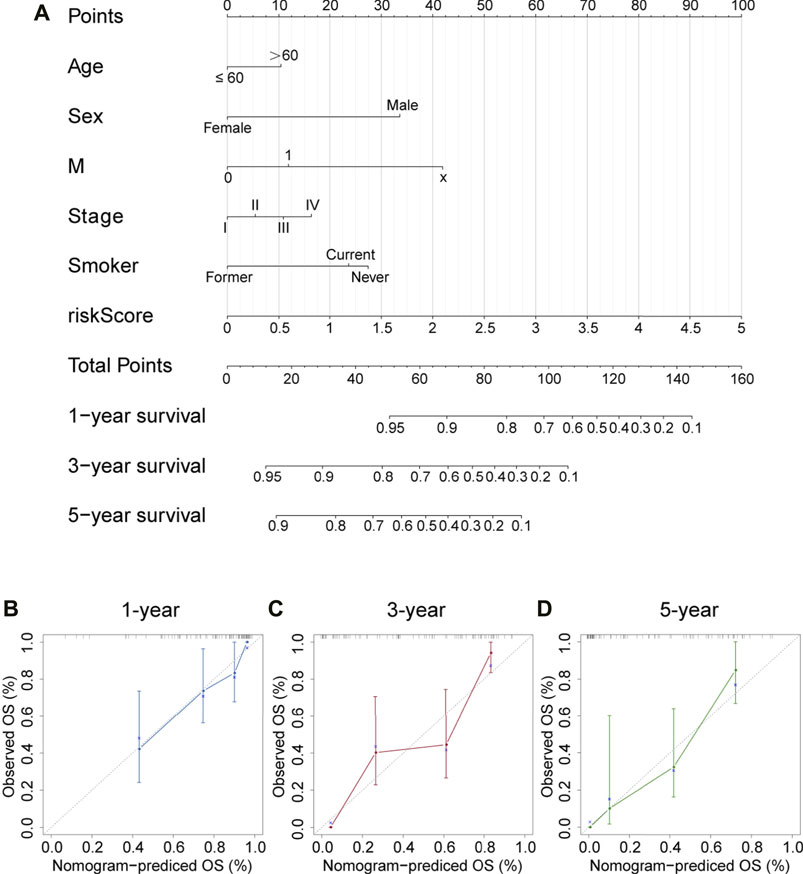
FIGURE 7. Nomogram and corresponding calibration plots. (A) A nomogram that integrated the risk score and other clinicopathological features for predicting 1-, 3-, and 5-year OS of SCLC. Scores of each variable are calculated by drawing a line vertical to the top points row, and then a total score can be obtained by summing up these scores. Subsequently, a vertical line could be projected from total points to the bottom scales to estimate the survival probability of patients. (B–D) Calibration plots for 1-, 3-, and 5-year nomogram in the cBioPortal cohort. Nomogram-predicted survival is depicted on the X-axis, and observed actual survival is plotted on the Y-axis. The 45-degree dotted line indicates a perfect prediction.
Given that the downregulated DEGs showed enrichment in immune-related pathways, immune infiltration analysis was performed in SCLC and normal samples. Interestingly, we found that SCLC tissues had a higher proportion of activated memory CD4+ T cells, T-follicular helper cells, regulatory T cells, M1 macrophages, and resting dendritic cells than that detected in normal lung tissues. In contrast, the proportion of monocytes, activated dendritic cells, resting mast cells, and neutrophils was much lower in SCLC tissues (Figure 8).
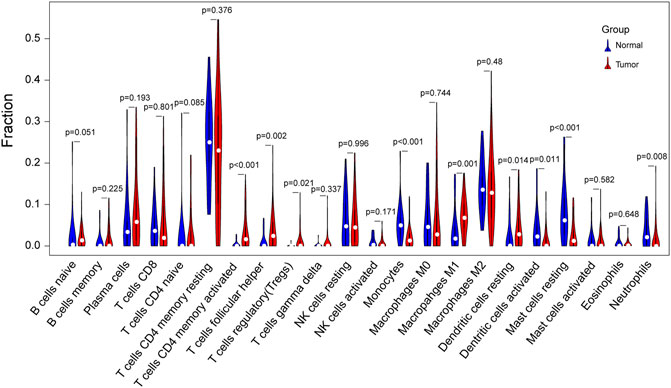
FIGURE 8. Violin plot of differences in immune cell infiltration between SCLC and normal lung tissues. Comparison of 22 infiltrated immune cells in tumor samples and normal lung tissues based on four GSE datasets. Blue color represents normal lung tissue, while red represents tumor tissue.
A lollipop plot was drawn to show correlations between expression of those key genes (i.e., TOP2A, CDKN2A, BIRC5, MSH2, and HLA-ABC) and immune-related cells. As shown in Figure 9A, TOP2A expression was negatively correlated with CD8+ T cells; HLA-A, HLA-B, and HLA-C expression had significant positive correlations with M1 macrophages, memory B cells, and CD8+ T cells. Besides, they all were inversely associated with M2 macrophages (Figures 9B–D). In addition, both HLA-A and HLA-C expression were positively correlated with M0 macrophages, while HLA-B expression was positively correlated with resting dendritic cells. However, CDKN2A, BIRC5, and MSH2 expression showed no correlations with immune cells (Supplementary Tables S1–S3).
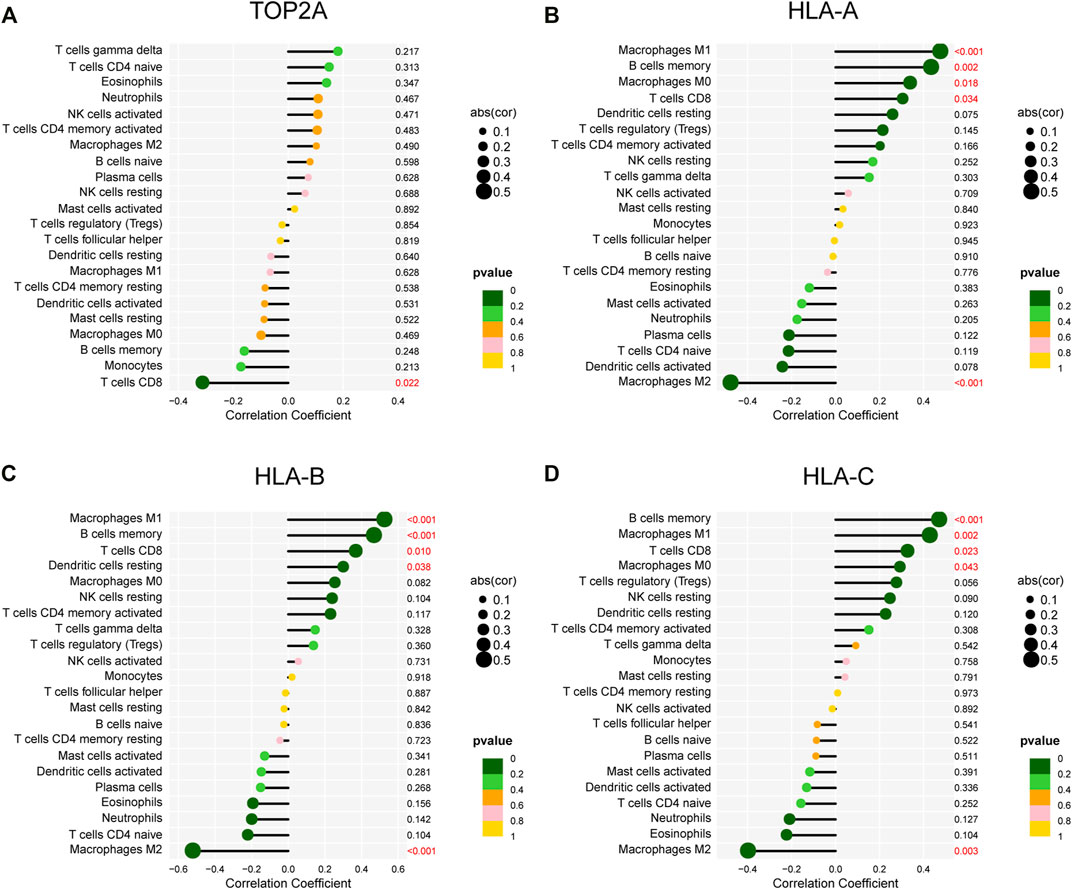
FIGURE 9. Correlations of gene expression and infiltrating immune cells. (A–D) Correlations between TOP2A, HLA-A, HLA-B, and HLA-C expression and infiltrating immune cells.
To investigate the association between TOP2A and HLA-ABC, Pearson correlation analysis was applied in GEO datasets and the cBioPortal cohort. Of note, the correlation coefficients of TOP2A with HLA-ABC were all negative (Table 2). However, statistically significant results were only found in GSE60052, which may have happened because of the large sample size of this dataset (Table 2). Notably, in our cohort, TOP2A expression was significantly inversely correlated with HLA (Table 3).
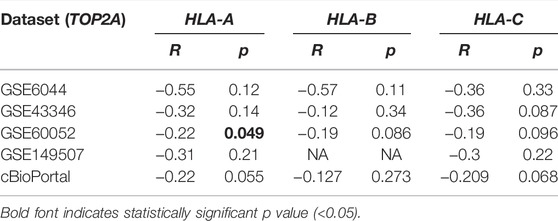
TABLE 2. Correlation between TOP2A expression and HLA-ABC expression in four GSE datasets and the cBioPortal website.
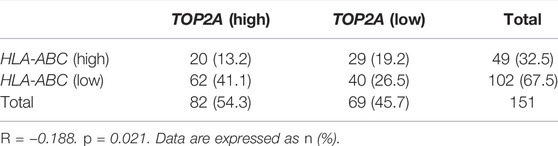
TABLE 3. Correlation between TOP2A expression and HLA-ABC expression in our own cohort.
The patient group (n = 151) comprised 105 males and 46 females, ranging in age from 37 to 79 years (mean ± SD, 61.27 ± 8.323 years old). Additionally, there were 109 patients (72.19%) who had lymph node metastases (LNM) and 104 patients (68.87%) had distant metastasis. TOP2A and HLA-ABC expression levels were analyzed semiquantitatively using the average optical density viewed in Image-Pro Plus after immunohistochemical staining. Representative pictures of IHC staining of SCLC are shown in Figure 10A, and more immunohistochemical pictures are shown in Supplementary Figure S1. Time-dependent ROC curves showed that the best critical cutoff values for TOP2A and HLA-ABC were 0.00498 and 0.00731, respectively (Figures 10C,D). The reciprocal of HLA-ABC (1/HLA-ABC) was used to improve the comparability of the ROC curves because this gene was downregulated in SCLC and may therefore be a protective factor. Thus, according to expression levels of TOP2A and HLA-ABC, patients were classified into high- or low-expression groups. Fifty-four percent of the patients had high TOP2A expression levels, while 46% of patients had low levels of TOP2A; in contrast, high and low expression of HLA-ABC was found in 32.5 and 67.5% patients, respectively. Correlations between TOP2A/HLA-ABC expression and clinicopathological characteristics of 151 patients with SCLC are shown in Table 4. However, there was no appreciable difference in age, sex, history of smoking, or lymph node metastasis between TOP2A/HLA-ABC high- and low-expression groups (p > 0.05).

FIGURE 10. Verification of TOP2A and HLA-ABC expression by immunohistochemistry in our SCLC cohort. (A) Representative immunohistochemical pictures of TOP2A and HLA-ABC in SCLC tissue sections. (B) Forest plot for univariate and multivariate Cox regression analysis. (C,D) Time-dependent receiver operating characteristic curves of TOP2A and HLA-ABC. (E,F) Kaplan–Meier survival curve for 151 SCLC patients stratified by the cutoff values of TOP2A and HLA-ABC, respectively.
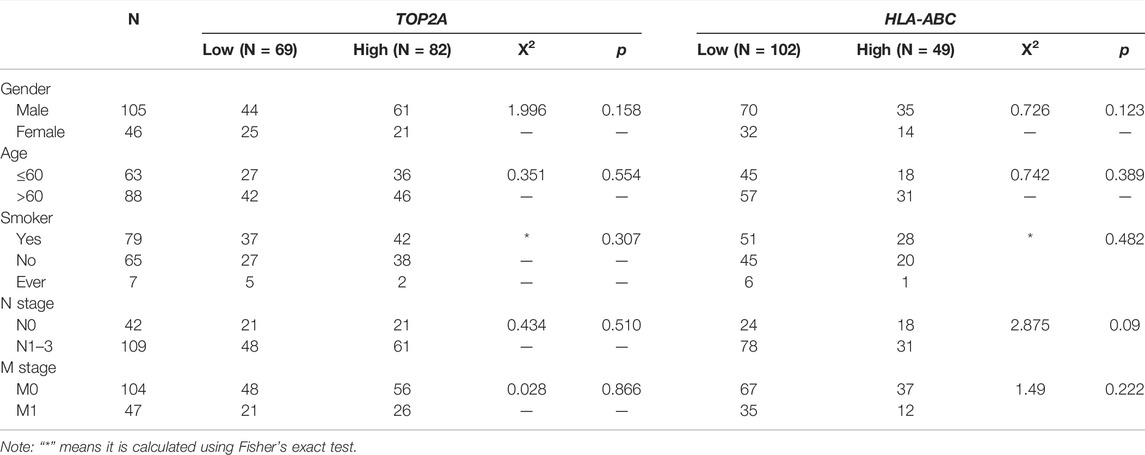
TABLE 4. Correlations between TOP2A/HLA-ABC expression and clinicopathological characteristics of 151 patients with SCLC.
Additionally, low expression of TOP2A and high expression of HLA-ABC predicted longer OS as indicated in Figures 10E,F. Univariate Cox analysis showed that LNM (HR = 3.000; p < 0.05), distant metastasis (HR = 4.500; p < 0.05), and high expression of TOP2A (HR = 1.800; p < 0.05) portended a poor prognosis, while high expression of HLA-ABC denoted a favorable prognosis. Multivariate Cox analysis showed that the risk of death was 2.1 times higher in patients with LNM than those without LNM and 3.5 times higher for patients with M1 stage than those with M0 stage. Patients with high expression of TOP2A had 1.5-fold higher mortality risk than patients with low expression, while patients with high HLA-ABC expression harbored a 0.66-fold lower risk of death. Therefore, TOP2A, HLA-ABC, lymph node metastasis, and distance can be regarded as independent prognostic factors of SCLC (Figure 10B).
Tumor typing of solid tumors (from the initial location distinction to the pathological type distinction as well as the recent molecular classification distinction) is known to be an effective method for cancer treatment. SCLC is a malignant type of cancer with obvious genetic characteristics, but targeting SCLC treatment remains challenging. Notably, the neuroendocrine types of SCLC (i.e., SCLC-A and SCLC-N) can be regarded as cold tumors, which are characterized by the infiltration of immune cells into the tumor center and the invasive margin; in contrast, non-neuroendocrine types (i.e., SCLC-Y, SCLC-P, and SCLC-I) manifest a phenotype that is more inflamed (Galon and Bruni, 2019; Haryono et al., 2019; Gay et al., 2021). Transformability between different subtypes may provide new treatment opportunities for patients with SCLC who respond poorly to immunotherapy (Lim et al., 2017; Ireland et al., 2020). Therefore, bioinformatics analysis was performed in this study to investigate underlying predictors of immunotherapy in SCLC. Data were downloaded from the GEO database and the cBioPortal website.
We identified 133 and 180 upregulated and downregulated DEGs, respectively, that were potentially associated with the development of SCLC. Notably, four upregulated DEGs were enriched in the platinum drug resistance pathway. In addition, human leukocyte antigen class I and II (HLA-I and HLA-II) were downregulated in SCLC tissues compared with normal lung tissues. According to enrichment analysis, the DEGs were enriched in DNA replication, mitotic nuclear division, and chromosome segregation, whereas downregulated genes were associated with neutrophil-mediated immune response. CIBERSOET analysis was used to delineate the immune infiltration landscape in SCLC tissues. SCLC seemed to have a pauci-immune microenvironment that was consistent with GO and KEGG analysis results. The lower proportion of monocytes, activated dendritic cells, and neutrophils in SCLC compared with that in normal lung tissues implied weak antigen-presenting capacity in SCLC. These results suggest that although SCLC had a high mutational burden, the efficacy of immunotherapy was not always sufficient even when it was combined with chemotherapy, and it is greatly affected by the interplay of tumor cells and the immune system in the tumor microenvironment. Thus, we used LASSO and multivariate Cox regression to construct a prognostic index based on four chemotherapy-related genes and HLA-ABC genes. Results showed that this model was based on the TPM value of three genes: HLA-B, MSH2, and TOP2A. Notably, the coefficients were positive for HLA-B and MSH2, whereas they were negative for TOP2A. Patients with higher risk scores had less favorable outcomes.
TOP2A expression induces the formation of covalent complexes with DNA, and produces transient double-stranded DNA breaks (DSBs), which are crucial for DNA metabolism processes including replication, chromosome condensation, and chromatid separation during mitosis (Deweese and Osheroff, 2009; Jain et al., 2013). Previous studies have suggested that TOP2A was upregulated and indicative of poor prognosis in many malignancies including lung adenocarcinoma (Kou et al., 2020), gastric cancer (Cao et al., 2017), breast cancer (Zheng et al., 2016), and prostate cancer (de Resende et al., 2013), which is noteworthy. Generally, patients with SCLC respond well to initial chemotherapy but show poor prognosis. Patients with SCLC who experience a clinical relapse (i.e., patients who are drug resistant) rarely achieve an objective response rate greater than 20% in their second-line treatment (von Pawel, 2003). Indeed, combination treatment with immunotherapy is often ineffective, especially after clinical trials of anti-PD-1 antibodies in SCLC ended with failure. This seemingly contradictory situation may actually stem from the inherent relationship between TOP2A and HLA genes. When TOP2A is upregulated, HLA expression is usually downregulated, and this was confirmed by immune infiltration results that TOP2A expression was negatively correlated with CD8+ T cells. Weakened antigen presentation leads to immune evasion and metastasis of tumor cells, which in turn leads to multi-therapeutic resistance. Inhibition of TOP2A expression alone or combined with immunotherapy may be promising treatment options for SCLC.
MSH2 is one of the DNA mismatch repair (MMR) genes, which is upregulated in many cancers including SCLC (Fujii et al., 2018). MSH2 mediates the removal of platinum–DNA adducts. However, platinum agents induce apoptosis by generating covalent platinum–DNA adducts that block DNA replication and transcription (Barry et al., 1990). Emerging evidence demonstrates that patients with MSH2 loss had a low response rate to platinum-based therapies in many malignancies, including glioma and ovarian cancer (Pabla et al., 2011; Goodspeed et al., 2019). However, more studies are needed to explore whether MSH2 can be implicated in resistance to chemotherapy in SCLC.
HLA-I is composed of three classical antigens (HLA-A, -B, and -C); it is present on the cell surface of every human cell and enables peptides derived from tumor cells to be recognized by cytotoxic T-lymphocytes (CTLs) while also playing a critical role in antitumor immunity. Cancer cells downregulate HLA-I expression by destroying the stability of β2-microglobulin, which could cause the loss of heterozygosity (LOH) of HLA-I (Challa-Malladi et al., 2011; Bernal et al., 2012). Loss of HLA-I expression often occurs in many malignancies, including SCLC; it results in resistance to the activity of HLA-restricted CTLs, which leads to T-cell–mediated immune evasion and dissemination of tumor cells (Doyle et al., 1985; Garrido et al., 2016). Chowell et al. (Chowell et al., 2018) found that LOH of HLA-I in patients was predictive of poor survival in comparison with patients without such LOH. Moreover, Rodig et al. (Rodig et al., 2018) demonstrated that loss of HLA expression might influence immune checkpoint blockade responses; specifically, the initial response to anti-CTLA-4 required MHC-I–mediated antigen presentation, whereas intact expression of tumor-specific MHC-II molecules was needed for the anti-PD-1 response in melanoma. Thus, HLA expression was positively associated with immune therapy effects.
Based on functions of TOP2A in malignant neoplasm progression and platinum resistance, and HLA-ABC expression in the immune response, the correlation between TOP2A and HLA-I was investigated. Intriguingly, we found negative correlations between TOP2A and HLA-I, and this was confirmed by our immunohistochemistry experiments. Furthermore, survival analysis based on SCLC data from the cBioPortal website showed that HLA-B was an independent indicator of good prognosis, while TOP2A might be associated with poor long-term survival of patients. Interestingly, our study indicated that low and high expression levels of TOP2A and HLA-ABC, respectively, were significantly associated with increased OS in patients with SCLC. Downregulation of TOP2A may have the potential to turn the TOP2A-positive/HLA-I–negative phenotype into the HLA-ABC–positive/TOP2A-negative phenotype, which could promote the tumor immune response. In TOP2A-positive/HLA-I–negative cases, patients with SCLC may have poor prognosis; in contrast, in TOP2A-negative/HLA-I–positive cases, patients may achieve increased survival and benefit from immunotherapy, which is in accordance with coefficients of the corresponding gene in our proposed model. Moreover, mutual transformations could occur among the various subtypes found in patients with SCLC. Gene therapy for TOP2A and HLA-ABC may enable patients with recurrence and metastasis to become treatment-sensitive and thereby benefit from chemotherapy with or without immunotherapy. Moreover, specific genomic characteristics of SCLC and corresponding individualized treatments should be focused upon in order to ultimately improve the current therapeutic landscape.
There are still some limitations to this study. First, we used only one antibody that recognizes the non-polymorphic region of HLA-I, which means that different HLA loci might be associated with different clinical characteristics. Second, our sample numbers are small due to the rarity of samples; more multicenter and larger-scale studies are required to investigate findings and the hypothesis in the current study.
Our results created a risk model based on chemotherapy-related genes and immune-related genes for SCLC patients; this model may be beneficial for evaluating SCLC patient prognosis. In addition, TOP2A was inversely correlated with HLA-ABC in SCLC, which indicated that TOP2A may be a potential predictive factor of immune response. The upregulation of TOP2A together with loss of HLA-ABC in SCLC are associated with poor prognosis, and both of them are unfavorable independent prognosticators for SCLC. Our study offers a potential target to reverse the immunosuppressive tumor microenvironment of SCLC, and provides new insight into overcoming the predicament of SCLC clinical therapy.
The datasets presented in this study can be found in online repositories. The names of the repository/repositories and accession number(s) can be found in the article/Supplementary Material.
The studies involving human participants were reviewed and approved by the ethical committees of China Medical University. The patients/participants provided their written informed consent to participate in this study.
X-HZ and Y-CZ designed the study. Y-CZ and M-YC collected patient data. X-HZ and M-YC performed immunohistochemistry analysis and analyzed the data. M-YC contributed to bioinformatics analysis and drafted the manuscript. X-HZ and Y-CZ were involved in manuscript review and revision. All authors read and approved the final manuscript.
This study was funded by National Natural Science Foundation of China (No. 81802760 and 81702402), Science and Technology Project of Liaoning (No. 20170520027), and 345 talent project of Shengjing Hospital (X-HZ, Lei Liu).
The authors declare that the research was conducted in the absence of any commercial or financial relationships that could be construed as a potential conflict of interest.
All claims expressed in this article are solely those of the authors and do not necessarily represent those of their affiliated organizations, or those of the publisher, the editors, and the reviewers. Any product that may be evaluated in this article, or claim that may be made by its manufacturer, is not guaranteed or endorsed by the publisher.
The Supplementary Material for this article can be found online at: https://www.frontiersin.org/articles/10.3389/fcell.2022.893490/full#supplementary-material
Ali, Y., and Abd Hamid, S. (2016). Human Topoisomerase II Alpha as a Prognostic Biomarker in Cancer Chemotherapy. Tumor Biol. 37, 47–55. doi:10.1007/s13277-015-4270-9
Baine, M. K., Hsieh, M.-S., Lai, W. V., Egger, J. V., Jungbluth, A. A., Daneshbod, Y., et al. (2020). SCLC Subtypes Defined by ASCL1, NEUROD1, POU2F3, and YAP1: A Comprehensive Immunohistochemical and Histopathologic Characterization. J. Thorac. Oncol. 15, 1823–1835. doi:10.1016/j.jtho.2020.09.009
Barry, M. A., Behnke, C. A., and Eastman, A. (1990). Activation of Programmed Cell Death (Apoptosis) by Cisplatin, Other Anticancer Drugs, Toxins and Hyperthermia. Biochem. Pharmacol. 40, 2353–2362. doi:10.1016/0006-2952(90)90733-2
Bernal, M., Ruiz-Cabello, F., Concha, A., Paschen, A., and Garrido, F. (2012). Implication of the β2-microglobulin Gene in the Generation of Tumor Escape Phenotypes. Cancer Immunol. Immunother. 61, 1359–1371. doi:10.1007/s00262-012-1321-6
Blackhall, F., Frese, K. K., Simpson, K., Kilgour, E., Brady, G., and Dive, C. (2018). Will Liquid Biopsies Improve Outcomes for Patients with Small-Cell Lung Cancer? Lancet Oncol. 19, e470–e481. doi:10.1016/S1470-2045(18)30455-8
Borromeo, M. D., Savage, T. K., Kollipara, R. K., He, M., Augustyn, A., Osborne, J. K., et al. (2016). ASCL1 and NEUROD1 Reveal Heterogeneity in Pulmonary Neuroendocrine Tumors and Regulate Distinct Genetic Programs. Cell Rep. 16, 1259–1272. doi:10.1016/j.celrep.2016.06.081
Cai, L., Liu, H., Huang, F., Fujimoto, J., Girard, L., Chen, J., et al. (2021). Cell-autonomous Immune Gene Expression Is Repressed in Pulmonary Neuroendocrine Cells and Small Cell Lung Cancer. Commun. Biol. 4, 314. doi:10.1038/s42003-021-01842-7
Cao, Y., Zhang, G., Wang, P., Zhou, J., Gan, W., Song, Y., et al. (2017). Clinical Significance of UGT1A1 Polymorphism and Expression of ERCC1, BRCA1, TYMS, RRM1, TUBB3, STMN1 and TOP2A in Gastric Cancer. BMC Gastroenterol. 17, 2. doi:10.1186/s12876-016-0561-x
Challa-Malladi, M., Lieu, Y. K., Califano, O., Holmes, A. B., Bhagat, G., Murty, V. V., et al. (2011). Combined Genetic Inactivation of β2-Microglobulin and CD58 Reveals Frequent Escape from Immune Recognition in Diffuse Large B Cell Lymphoma. Cancer Cell 20, 728–740. doi:10.1016/j.ccr.2011.11.006
Chin, C.-H., Chen, S.-H., Wu, H.-H., Ho, C.-W., Ko, M.-T., and Lin, C.-Y. cytoHubba: Identifying Hub Objects and Sub-networks from Complex Interactome. BMC Syst. Biol. (2014)8, S11. doi:10.1186/1752-0509-8-s4-s11
Chowell, D., Morris, L. G. T., Grigg, C. M., Weber, J. K., Samstein, R. M., Makarov, V., et al. (2018). Patient HLA Class I Genotype Influences Cancer Response to Checkpoint Blockade Immunotherapy. Science 359, 582–587. doi:10.1126/science.aao4572
de Resende, M. F., Vieira, S., Chinen, L. T. D., Chiappelli, F., da Fonseca, F. P., Guimarães, G. C., et al. (2013). Prognostication of Prostate Cancer Based on TOP2A Protein and Gene Assessment: TOP2A in Prostate Cancer. J. Transl. Med. 11, 36. doi:10.1186/1479-5876-11-36
Delgado, J., Martinez, L. M., Sánchez, T. T., Ramirez, A., Iturria, C., and González-Avila, G. (2005). Lung Cancer Pathogenesis Associated with Wood Smoke Exposure. Chest 128, 124–131. doi:10.1378/chest.128.1.124
Deweese, J. E., and Osheroff, N. (2009). The DNA Cleavage Reaction of Topoisomerase II: Wolf in Sheep's Clothing. Nucleic Acids Res. 37, 738–748. doi:10.1093/nar/gkn937
Doyle, A., Martin, W. J., Funa, K., Gazdar, A., Carney, D., Martin, S. E., et al. (1985). Markedly Decreased Expression of Class I Histocompatibility Antigens, Protein, and mRNA in Human Small-Cell Lung Cancer. J. Exp. Med. 161, 1135–1151. doi:10.1084/jem.161.5.1135
Fujii, K., Miyata, Y., Takahashi, I., Koizumi, H., Saji, H., Hoshikawa, M., et al. (2018). Differential Proteomic Analysis between Small Cell Lung Carcinoma (SCLC) and Pulmonary Carcinoid Tumors Reveals Molecular Signatures for Malignancy in Lung Cancer. Prot. Clin. Appl. 12,1800015. doi:10.1002/prca.201800015
Galon, J., and Bruni, D. (2019). Approaches to Treat Immune Hot, Altered and Cold Tumours with Combination Immunotherapies. Nat. Rev. Drug Discov. 18, 197–218. doi:10.1038/s41573-018-0007-y
Garrido, F., Aptsiauri, N., Doorduijn, E. M., Garcia Lora, A. M., and van Hall, T. (2016). The Urgent Need to Recover MHC Class I in Cancers for Effective Immunotherapy. Curr. Opin. Immunol. 39, 44–51. doi:10.1016/j.coi.2015.12.007
Gay, C. M., Stewart, C. A., Park, E. M., Diao, L., Groves, S. M., Heeke, S., et al. (2021). Patterns of Transcription Factor Programs and Immune Pathway Activation Define Four Major Subtypes of SCLC with Distinct Therapeutic Vulnerabilities. Cancer Cell 39, 346–360. e7. doi:10.1016/j.ccell.2020.12.014
Gazdar, A. F., Carney, D. N., Nau, M. M., and Minna, J. D. (1985). Characterization of Variant Subclasses of Cell Lines Derived from Small Cell Lung Cancer Having Distinctive Biochemical, Morphological, and Growth Properties. Cancer Res. 45, 2924–2930.
Gazdar, A. F., Bunn, P. A., and Minna, J. D. (2017). Small-cell Lung Cancer: what We Know, what We Need to Know and the Path Forward. Nat. Rev. Cancer 17, 725–737. doi:10.1038/nrc.2017.87
Goodspeed, A., Jean, A., and Costello, J. C. (2019). A Whole-Genome CRISPR Screen Identifies a Role of MSH2 in Cisplatin-Mediated Cell Death in Muscle-Invasive Bladder Cancer. Eur. Urol. 75, 242–250. doi:10.1016/j.eururo.2018.10.040
Haryono, M., Cho, S.-T., Fang, M.-J., Chen, A.-P., Chou, S.-J., Lai, E.-M., et al. (2019). Differentiations in Gene Content and Expression Response to Virulence Induction between Two Agrobacterium Strains. Front. Microbiol. 10, 1554. doi:10.3389/fmicb.2019.01554
Hiddinga, B. I., Raskin, J., Janssens, A., Pauwels, P., and Van Meerbeeck, J. P. (2021). Recent Developments in the Treatment of Small Cell Lung Cancer. Eur. Respir. Rev. 30, 210079. doi:10.1183/16000617.0079-2021
Horn, L., Mansfield, A. S., Szczęsna, A., Havel, L., Krzakowski, M., Hochmair, M. J., et al. (2018). First-Line Atezolizumab Plus Chemotherapy in Extensive-Stage Small-Cell Lung Cancer. N. Engl. J. Med. 379, 2220–2229. doi:10.1056/NEJMoa1809064
Huang, Y.-H., Klingbeil, O., He, X.-Y., Wu, X. S., Arun, G., Lu, B., et al. (2018). POU2F3 Is a Master Regulator of a Tuft Cell-like Variant of Small Cell Lung Cancer. Genes Dev. 32, 915–928. doi:10.1101/gad.314815.118
Ireland, A. S., Micinski, A. M., Kastner, D. W., Guo, B., Wait, S. J., Spainhower, K. B., et al. (2020). MYC Drives Temporal Evolution of Small Cell Lung Cancer Subtypes by Reprogramming Neuroendocrine Fate. Cancer Cell 38, 60–78. e12. doi:10.1016/j.ccell.2020.05.001
Jain, M., Zhang, L., He, M., Zhang, Y.-Q., Shen, M., and Kebebew, E. (2013). TOP2A Is Overexpressed and Is a Therapeutic Target for Adrenocortical Carcinoma. Endocr. Relat. Cancer 20, 361–370. doi:10.1530/erc-12-0403
Jiang, L., Huang, J., Higgs, B. W., Hu, Z., Xiao, Z., Yao, X., et al. (2016). Genomic Landscape Survey Identifies SRSF1 as a Key Oncodriver in Small Cell Lung Cancer. PLoS Genet. 12, e1005895. doi:10.1371/journal.pgen.1005895
Kou, F., Sun, H., Wu, L., Li, B., Zhang, B., Wang, X., et al. (2020). TOP2A Promotes Lung Adenocarcinoma Cells' Malignant Progression and Predicts Poor Prognosis in Lung Adenocarcinoma. J. Cancer 11, 2496–2508. doi:10.7150/jca.41415
Lim, J. S., Ibaseta, A., Fischer, M. M., Cancilla, B., O’Young, G., Cristea, S., et al. (2017). Intratumoural Heterogeneity Generated by Notch Signalling Promotes Small-Cell Lung Cancer. Nature 545, 360–364. doi:10.1038/nature22323
Liu, D., Huang, C.-l., Kameyama, K., Hayashi, E., Yamauchi, A., Sumitomo, S., et al. (2002). Topoisomerase II? Gene Expression Is Regulated by Thep53 Tumor Suppressor Gene in Nonsmall Cell Lung Carcinoma Patients. Cancer 94, 2239–2247. doi:10.1002/cncr.10450
Mak, D. W. S., Li, S., and Minchom, A. (2019). Challenging the Recalcitrant Disease-Developing Molecularly Driven Treatments for Small Cell Lung Cancer. Eur. J. Cancer 119, 132–150. doi:10.1016/j.ejca.2019.04.037
Pabla, N., Ma, Z., McIlhatton, M. A., Fishel, R., and Dong, Z. (2011). hMSH2 Recruits ATR to DNA Damage Sites for Activation during DNA Damage-Induced Apoptosis. J. Biol. Chem. 286, 10411–10418. doi:10.1074/jbc.M110.210989
Paz-Ares, L., Dvorkin, M., Chen, Y., Reinmuth, N., Hotta, K., Trukhin, D., et al. (2019). Durvalumab Plus Platinum-Etoposide versus Platinum-Etoposide in First-Line Treatment of Extensive-Stage Small-Cell Lung Cancer (CASPIAN): a Randomised, Controlled, Open-Label, Phase 3 Trial. Lancet 394, 1929–1939. doi:10.1016/s0140-6736(19)32222-6
Ready, N., Owonikoko, T. K., Postmus, P. E., Reck, M., Peters, S., Pieters, A., et al. (2016). CheckMate 451: A Randomized, Double-Blind, Phase III Trial of Nivolumab (Nivo), Nivo Plus Ipilimumab (Ipi), or Placebo as Maintenance Therapy in Patients (Pts) with Extensive-Stage Disease Small Cell Lung Cancer (ED-SCLC) after First-Line Platinum-Based Doublet Chemotherapy (PT-DC), Jco, 34, TPS8579. doi:10.1200/JCO.2016.34.15_suppl.TPS8579
Reck, M., Vicente, D., Ciuleanu, T., Gettinger, S., Peters, S., Horn, L., et al. (2018). Efficacy and Safety of Nivolumab (Nivo) Monotherapy versus Chemotherapy (Chemo) in Recurrent Small Cell Lung Cancer (SCLC): Results from CheckMate 331. Ann. Oncol. 29, x43. doi:10.1093/annonc/mdy511.004
Ritchie, M. E., Phipson, B., Wu, D., Hu, Y., Law, C. W., Shi, W., et al. (2015). Limma Powers Differential Expression Analyses for RNA-Sequencing and Microarray Studies. Nucleic Acids Res. 43, e47. doi:10.1093/nar/gkv007
Rodig, S. J., Gusenleitner, D., Jackson, D. G., Gjini, E., Giobbie-Hurder, A., Jin, C., et al. (2018). MHC Proteins Confer Differential Sensitivity to CTLA-4 and PD-1 Blockade in Untreated Metastatic Melanoma. Sci. Transl. Med. 10. doi:10.1126/scitranslmed.aar3342
Rohrbeck, A., Neukirchen, J., Rosskopf, M., Pardillos, G. G., Geddert, H., Schwalen, A., et al. (2008). Gene Expression Profiling for Molecular Distinction and Characterization of Laser Captured Primary Lung Cancers. J. Transl. Med. 6, 69. doi:10.1186/1479-5876-6-69
Rudin, C. M., Awad, M. M., Navarro, A., Gottfried, M., Peters, S., Csőszi, T., et al. (2020). Pembrolizumab or Placebo Plus Etoposide and Platinum as First-Line Therapy for Extensive-Stage Small-Cell Lung Cancer: Randomized, Double-Blind, Phase III KEYNOTE-604 Study. Jco 38, 2369–2379. doi:10.1200/jco.20.00793
Rudin, C. M., Poirier, J. T., Byers, L. A., Dive, C., Dowlati, A., George, J., et al. (2019). Molecular Subtypes of Small Cell Lung Cancer: a Synthesis of Human and Mouse Model Data. Nat. Rev. Cancer 19, 289–297. doi:10.1038/s41568-019-0133-9
Sato, T., Kaneda, A., Tsuji, S., Isagawa, T., Yamamoto, S., Fujita, T., et al. (2013). PRC2 Overexpression and PRC2-Target Gene Repression Relating to Poorer Prognosis in Small Cell Lung Cancer. Sci. Rep. 3, 1911. doi:10.1038/srep01911
Smoot, M. E., Ono, K., Ruscheinski, J., Wang, P.-L., and Ideker, T. (2011). Cytoscape 2.8: New Features for Data Integration and Network Visualization. Bioinformatics 27, 431–432. doi:10.1093/bioinformatics/btq675
Szklarczyk, D., Gable, A. L., Lyon, D., Junge, A., Wyder, S., Huerta-Cepas, J., et al. (2019). STRING V11: Protein-Protein Association Networks with Increased Coverage, Supporting Functional Discovery in Genome-wide Experimental Datasets. Nucleic Acids Res. 47, D607–D613. doi:10.1093/nar/gky1131
Tsai-Pflugfelder, M., Liu, L. F., Liu, A. A., Tewey, K. M., Whang-Peng, J., Knutsen, T., et al. (1988). Cloning and Sequencing of cDNA Encoding Human DNA Topoisomerase II and Localization of the Gene to Chromosome Region 17q21-22. Proc. Natl. Acad. Sci. U.S.A. 85, 7177–7181. doi:10.1073/pnas.85.19.7177
von Pawel, J. (2003). The Role of Topotecan in Treating Small Cell Lung Cancer: Second-Line Treatment. Lung Cancer 41 (Suppl. 4), S3–S8. doi:10.1016/s0169-5002(03)90519-8
Waqar, S. N., and Morgensztern, D. (2017). Treatment Advances in Small Cell Lung Cancer (SCLC). Pharmacol. Ther. 180, 16–23. doi:10.1016/j.pharmthera.2017.06.002
Zhang, W., Girard, L., Zhang, Y.-A., Haruki, T., Papari-Zareei, M., Stastny, V., et al. (2018). Small Cell Lung Cancer Tumors and Preclinical Models Display Heterogeneity of Neuroendocrine Phenotypes. Transl. Lung Cancer Res. 7, 32–49. doi:10.21037/tlcr.2018.02.02
Keywords: TOP2A, HLA, small-cell lung cancer, bioinformatics analysis, immune microenvironment
Citation: Chen M-Y, Zeng Y-C and Zhao X-H (2022) Chemotherapy- and Immune-Related Gene Panel in Prognosis Prediction and Immune Microenvironment of SCLC. Front. Cell Dev. Biol. 10:893490. doi: 10.3389/fcell.2022.893490
Received: 10 March 2022; Accepted: 05 May 2022;
Published: 15 June 2022.
Edited by:
Hasan Korkaya, Augusta University, United StatesReviewed by:
Xing Bian, Hefei Institutes of Physical Science (CAS), ChinaCopyright © 2022 Chen, Zeng and Zhao. This is an open-access article distributed under the terms of the Creative Commons Attribution License (CC BY). The use, distribution or reproduction in other forums is permitted, provided the original author(s) and the copyright owner(s) are credited and that the original publication in this journal is cited, in accordance with accepted academic practice. No use, distribution or reproduction is permitted which does not comply with these terms.
*Correspondence: Xi-He Zhao, eGlhb2hlMTEwNzg3NDYwQDE2My5jb20=
Disclaimer: All claims expressed in this article are solely those of the authors and do not necessarily represent those of their affiliated organizations, or those of the publisher, the editors and the reviewers. Any product that may be evaluated in this article or claim that may be made by its manufacturer is not guaranteed or endorsed by the publisher.
Research integrity at Frontiers
Learn more about the work of our research integrity team to safeguard the quality of each article we publish.