
95% of researchers rate our articles as excellent or good
Learn more about the work of our research integrity team to safeguard the quality of each article we publish.
Find out more
ORIGINAL RESEARCH article
Front. Cell Dev. Biol. , 25 April 2022
Sec. Cancer Cell Biology
Volume 10 - 2022 | https://doi.org/10.3389/fcell.2022.862493
This article is part of the Research Topic Non-Apoptotic Cell Death Mechanisms and their Therapeutic Significance View all 8 articles
 Yulian Zhang1†
 Chuanpeng Zhang1,2†
 Yanbo Yang1,3†
 Guohui Wang4
 Zai Wang5
 Jiang Liu1
 Li Zhang1,2,3Yanbing Yu1,2,3*
Objective: Gliomas are the most common primary tumors in the central nervous system with a bad prognosis. Pyroptosis, an inflammatory form of regulated cell death, plays a vital role in the progression and occurrence of tumors. However, the value of pyroptosis related genes (PRGs) in glioma remains poorly understood. This study aims to construct a PRGs signature risk model and explore the correlation with clinical characteristics, prognosis, tumor microenviroment (TME), and immune checkpoints.
Methods: RNA sequencing profiles and the relevant clinical data were obtained from the Chinese Glioma Genome Atlas (CGGA), the Cancer Genome Atlas (TCGA), the Repository of Molecular Brain Neoplasia Data (REMBRANDT), and the Genotype-Tissue Expression Project (GTEx-Brain). Then, the differentially expressed pyroptosis related genes (PRGs) were identified, and the least absolute shrinkage and selection operator (LASSO) and mutiCox regression model was generated using the TCGA-train dataset. Then the expression of mRNA and protein levels of PRGs signature was detected through qPCR and human protein atlas (HPA). Further, the predictive ability of the PRGs-signature, prognostic analysis, and stratification analysis were utilized and validated using TCGA-test, CGGA, and REMBRANDT datasets. Subsequently, we constructed the nomogram by combining the PRGs signature and other key clinical features. Moreover, we used gene set enrichment analysis (GSEA), GO, KEGG, the tumor immune dysfunction and exclusion (TIDE) single-sample GSEA (ssGSEA), and Immunophenoscore (IPS) to determine the relationship between PRGs and TME, immune infiltration, and predict the response of immune therapy in glioma.
Results: A four-gene PRGs signature (CASP4, CASP9, GSDMC, IL1A) was identified and stratified patients into low- or high-risk group. Survival analysis, ROC curves, and stratified analysis revealed worse outcomes in the high-risk group than in the low-risk group. Correlation analysis showed that the risk score was correlated with poor disease features. Furthermore, GSEA and immune infiltrating and IPS analysis showed that the PRGs signature could potentially predict the TME, immune infiltration, and immune response in glioma.
Conclusion: The newly identified four-gene PRGs signature is effective in diagnosis and could robustly predict the prognosis of glioma, and its impact on the TME and immune cell infiltrations may provide further guidance for immunotherapy.
Gliomas are the most common primary tumors in the central nervous system (CNS), accounting for 81% of intracranial malignancies (Ostrom et al., 2019). Gliomas can be categorized into four grades by according to the 2016 World Health Organization (WHO) classification, among which grade I and II belong to low-grade, grades III and IV indicate high-grade glioma (HGG) (Louis et al., 2016) Glioblastoma (GBM) is the most common type of high-grade glioma (Lara-Velazquez et al., 2017). Despite combing aggressive surgical recession, chemotherapies, and radiotherapy, the prognosis of GBM remains poor, with median overall survival (OS) of 14.6 months (Osuka and Van Meir, 2017). Moreover, the complete resection of GBM is arduous due to the high proliferative rate, heterogeneity of tumor cells, and high infiltrating abilities (Ferguson and Mccutcheon, 2018; Savage, 2018). Recently, more and more molecular markers have been identified that can be used for better diagnosis, treatment and prognostic assessment of glioma patients., including mutations in isocitrate dehydrogenase (IDH), O6-methylguanine-DNA methyltransferase (MGMT) methylation, deletion of the short arm of chromosome 1 and the long arm of chromosome 19 (1p/19q), and various signaling pathways involved in tumor suppression, proliferation, and migration (Wang et al., 2013; Molenaar et al., 2014; Zeng et al., 2015). Over the past decades, numerous therapies have been developed to treat cancers; however, few of them could effectively use in glioma. Despite the blood-brain barrier, unique structure in the CNS (Oberoi et al., 2015), glioma cells adapted various strategies to escape the immune system also play an essential role (Ghouzlani et al., 2021).
Pyroptosis is pro-inflammatory regulated cell death. It is characterized by nuclear condensation, pore formation, cellular swelling, the release of pro-inflammatory cytokines (Shi et al., 2017; Nirmala and Lopus, 2020). Pyroptosis is mediated by gasdermin (GSDM) family proteins. The most studied protein in the GSDM protein family is GSDMD. After being activated by inflammasomes, caspase-1, -4, -5, and -11 can cleave GSDMs into the gasdermin-N and gasdermin-C domains. The gasdermin-N domain (also known as the pore-forming domain) will oligomerize and form pores in the cell membrane (Rathinam and Fitzgerald, 2016). Pyroptosis was first identified in host immune defenses responses. However, supported by a growing number of studies, it gradually became a consensus that pyroptosis also plays an essential role in carcinogenesis and may be a potential anti-tumor target (Munn and Bronte, 2016; Yu et al., 2021; Zhibin Zhang et al., 2021). Pyroptosis could promote anti-tumor inflammatory responses and tumor regression; however, on the contrary, other studies found that pyroptosis may also facilitate the supportive tumor microenvironment. (Hergueta-Redondo et al., 2014; Gao et al., 2018; Wang et al., 2018; Tan et al., 2020; Wang et al., 2021a; Loveless et al., 2021). Thus, the role of pyroptosis remains inconclusive and may differ in different tumors.
Currently, the contribution of pyroptosis related genes (PRGs) as the biomarker for the diagnosis and prognosis of glioma remains unclear. Therefore, we performed a systematic study using multiple expression-level datasets to explore the functional association of PRGs in the prognosis, immune microenvironment, and the response to immunotherapy for glioma patients. This PRGs-based model can predict the prognosis of GBM patients and may further guide the clinical treatment and improve patient survival.
All data used in this study are from public datasets. The RNA sequencing data and corresponding clinical characteristics of glioma patients and RNA-seq data of normal brain tissues were obtained from a combined cohort of The Cancer Genome Atlas (TCGA) and The Genotype-Tissue Expression (GTEx) samples in UCSC Xena project (https://gtexportal.org/home/). The validation datasets were extracted from the Chinese Glioma Genome Atlas (CGGA. http://www.cgga.org.cn/), including mRNAseq_693, mRNAseq_325, and the Repository of Molecular Brain Neoplasia Data (REMBRANDT) dataset. The transcript expression in TCGA-LGG, TCGA-GBM, and GTEx-Brain was recomputed through RNA-Seq by Expectation-Maximization (RSEM) using UCSC TOIL RNA-seq. Gene expression data from CGGA and REMBRANDT were normalized and batched using the R package “limma.”
A total of 58 PRGs (listed in Supplementary Table S1) were collected from the MSigDB (https://www.gsea-msigdb.org/gsea/msigdb) and previous literature (Ju et al., 2021; Lin et al., 2021; Shao et al., 2021; Ye et al., 2021). Differentially expressed genes between gliomas and normal brain tissues was identified using “limma” package with p-value < 0.001. The differentially expressed genes (DEGs) are notated as follows: * if p < 0.05, ** if p < 0.01, and *** if p < 0.001. A Protein-protein interaction network and the Gene Ontology (GO) enrichment analysis of candidate genes were performed based on the Metascape online tool (Zhou et al., 2019).
Consensus clustering was applied to explore the connections between the expression of the PRGs and glioma subtypes by the k-means method (Hartigan and Wong, 1979). R packages “ConsensusClusterPlus” and “limma” were used to determine the number of clusters. The correlations between each cluster and clinical characteristics, including OS, were analyzed using the “survival” package. The results were presented by heatmaps and Kaplan-Meier (KM) graphs using R packages “pheatmap,” “survival,” and “survminer.”
Sequencing and clinical data from the TCGA were randomly divided into a training set and a testing set according to 1:1 via the function “createDataPartition” in the “caret” package. Univariate Cox analysis was first performed to assess the association between the expression of each PRGs and the OS of patients in the TCGA training dataset. p-value cutoff was set to 0.05. Then the least absolute shrinkage and selection operator (LASSO) analysis was performed using the R package “glmnet”. Then a prognostic risk formula was constructed by Multivariate Cox regression analysis. The forest plot was performed using the R package “survminer.” The risk scores for each patient were calculated as follows:
In addition, we accessed the IHC images for each candidate PRGs in glioma and normal tissue samples from the Human Protein Atlas database, and the staining intensity was evaluated according to the standard of HPA database (HPA, https://www.proteinatlas.org/). The Kaplan-Meier curve for each candidate PRGs was generated by using the R package “survminer” to compare the OS between the expression level of these genes.
Human cell lines HA1800, U87, T98G, U118, A172, U251, and HMC3 were purchased from ScienCell Research Laboratory, Cell Bank of the Chinese Academy of Sciences and ATCC, and cultured in Dulbecco’s modified Eagle’s medium (DMEM) medium (Invitrogen, Thermo Fisher Scientific, Inc., the United States). All the culture media was supplement by 10% fetal bovine serum (FBS) (Gibco), Penstrep (Gibco), GlutaMAX (Gibco), and MEM non-Essential Amino Acids (MEM-NEAA) (Gibco) following the instruction of the manufacturer. These cells were all cultured in an incubator with 5% CO2 at 37°C.
Total RNA from the above cell lines was extracted using Trizol (Beyotime, Shanghai, China). The mRNA concentrations were measured by NanoDrop oneC (Thermo Fisher Scientific, Inc., the United States), next cDNA was synthesized by Hifair® Ⅲ first Strand cDNA Synthesis SuperMix for qPCR(YEASEN Biotech Co., Ltd., China). Quantitative PCR was performed using QuantStudioTM 5 Real-Time PCR System with Hieff ® qPCR SYBR Green Master Mix (YEASEN Biotech Co., Ltd., China). The real-time qPCR was performed as previously described (Zhang et al., 2020a; Zhang et al., 2021d). The corresponding mRNA levels were normalized to GAPDH as an internal control by the 2−ΔΔCt method. The primers used in this study were synthesized by TsingKe biological technology (Beijing, China). The sequence of primers used in this study was listed in Supplementary Table S2.
TCGA datasets, CGGA datasets, and REMBRANDT datasets were used for internal and external validation. The risk scores were calculated for patients with glioma using the formula shown above. Patients were divided into the high- and low-risk groups using the median risk scores as the cutoff value. The time-dependent receiver operating characteristic (ROC) curve was utilized to evaluate the prediction accuracy of PRGs Signature via the “timeROC” package. The Kaplan-Meier curve was generated using the R package “survminer” to compare the OS between the high- and low-risk groups. Principal component analysis (PCA) and t-Distributed Stochastic Neighbor Embedding (t-SNE) were performed to explore and visualize the separation the low- and high-risk groups using the “Rtsne” package (Zhou et al., 2019). All these validations were used in the training and validation datasets simultaneously.
Univariate and multivariate cox regression analyses were performed for the TCGA and CGGA datasets to determine the independent prognostic factors. Next, these clinicopathologic factors were utilized to construct a nomogram to investigate the probability of 1-, 3-, and 5-year OS of patients with glioma using the “rms” package. The C-index, calibration curve, and time-dependent ROC were used to evaluate the consistency and prognostic accuracy of the nomogram.
The DEGs between the high-risk and low-risk groups were identified with the absolute value of log2FC > 1 and the FDR < 0.05. Gene Ontology (GO) enrichment and Kyoto Encyclopedia of Genes and Genomes (KEGG) pathway analysis were performed via the R package “clusterProfiler,” “org.Hs.eg.db” and “enrichplot” (Yu et al., 2012). Moreover, in TCGA and CGGA datasets, we used the c2.cp.kegg.v7.4.symbols.gmt and c5.go.v7.4.symbols.gmt for gene set enrichment analysis (GSEA) to identify the molecular mechanism that indicated a worse prognosis between the two subgroups (Subramanian et al., 2005).
To investigate the immune microenvironment of glioma, the ESTIMATE algorithm was applied to calculate the immune scores and stromal scores for each sample via the R package “estimate” (Yoshihara et al., 2013). Moreover, the scores of infiltrating immune cells and activity of immune-related pathways were quantified through Single sample gene set enrichment analysis (ssGSEA) of the “gsva” package, which contains 29 immune infiltration-related information.
Finally, spearman correlation analysis was used to access the relationship between risk scores and the expression levels of common immune checkpoints, including programmed cell death 1 (PD1), programmed cell death-ligand 1 (PD-L1), cytotoxic T-lymphocyte associated protein 4(CTLA-4), Lymphocyte Activating 3 (LAG-3), T-cell immunoglobulin and mucin domain-containing protein 3 (TIM-3), B7-H3(CD276), T-cell immunoglobulin and ITIM domain (TIGIT) (Ghouzlani et al., 2021; Yang et al., 2022) and two newly biomarkers APOBEC3B and TNFSF13 (Zhang et al., 2021a; Zhang et al., 2021c). Then, we investigated the role of PRGs signature in predicting glioma immunotherapeutic response by the tumor immune dysfunction and exclusion (TIDE) algorithm (http://tide.dfci.harvard.edu). A higher TIDE score indicates a worse response to immunotherapy (Jiang et al., 2018). Meanwhile, we use the immunophenoscore (IPS) downloaded from The Cancer Immunome Atlas (TCIA) (https://tcia.at/home) to predict immune checkpoint blockade (ICB) responses in the TCGA-GBM cohort. IPS is a reliable predictor of anti-cytotoxic T-lymphocyte antigen-4 (CTLA-4) and anti-PD-1 antibody responses (Charoentong et al., 2017). Generally, IPS are positively correlated to the ICB response. We recalculated the risk score of patients from the TCGA-GBM cohort according to the PRGs risk model and redivided them into high- and low- relative risk groups based on the median risk score.
The gene expression differences between the normal brain and glioma tissues were calculated via the Wilcoxon test. The R software (4.0.0) with corresponding packages and GraphPad Prism 8 was used for statistical analyses. p < 0.05 was considered statistically significant differences.
The workflow chart of this study is shown in Figure 1. Patients without survival data or histopathological information were excluded. Eventually, 1,137 normal brain and 1,598 glioma tissues were obtained from the GTEx, TCGA-LGG, TCGA-GBM, CGGA, and REMBRANDT datasets. The detailed clinicopathological features of included glioma patients are summarized in Table 1.
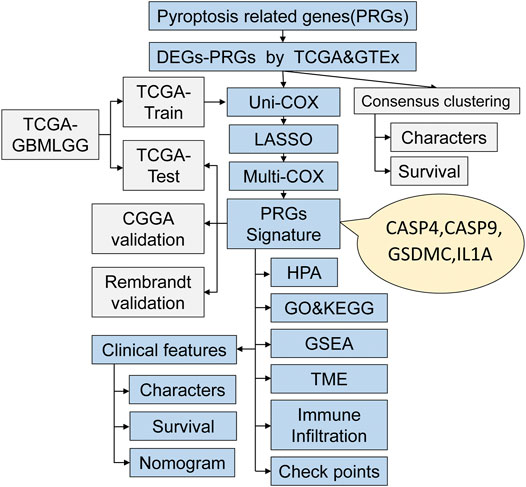
FIGURE 1. The workflow chart of this study.
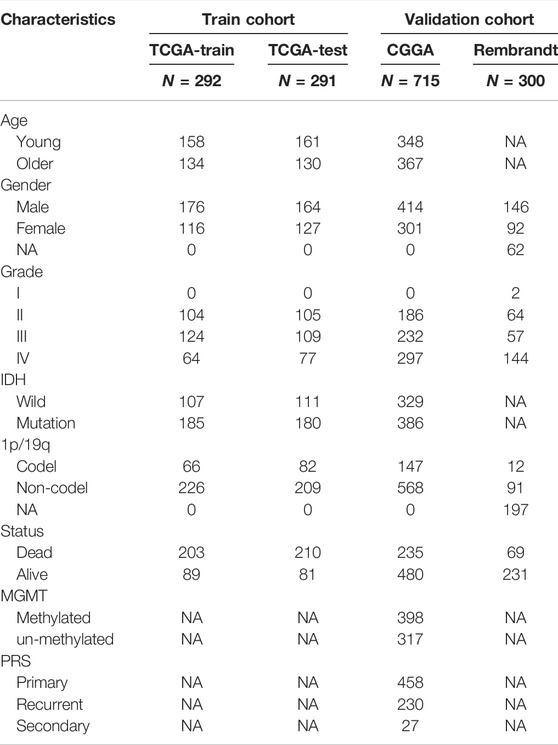
TABLE 1. Clinicopathological characteristics of glioma patients in TCGA, CGGA, and REMBRANDT datasets.
A total of 58 PRGs were collected for our analyses (Figure 2A). To further explore the interactions of these differentially expressed PRGs, we used the Metascape website to construct a PPI network. GO enrichment analysis was also performed to investigate the enriched pathways. As expected, these PRGs were involved in pyroptosis pathways (Figures 2B,C). Wilcoxon test was performed to compare the expression levels of 58 PRGs between the normal brain and glioma tissues. The results show that 57 out of 58 were significantly differentially expressed (p-value < 0.001) (Figure 2D). Three genes (NLRP2, NLRP9, and GSDMB) were downregulated, while the remaining 54 genes were upregulated in the glioma group. The RNA levels of these genes were displayed in heatmaps.
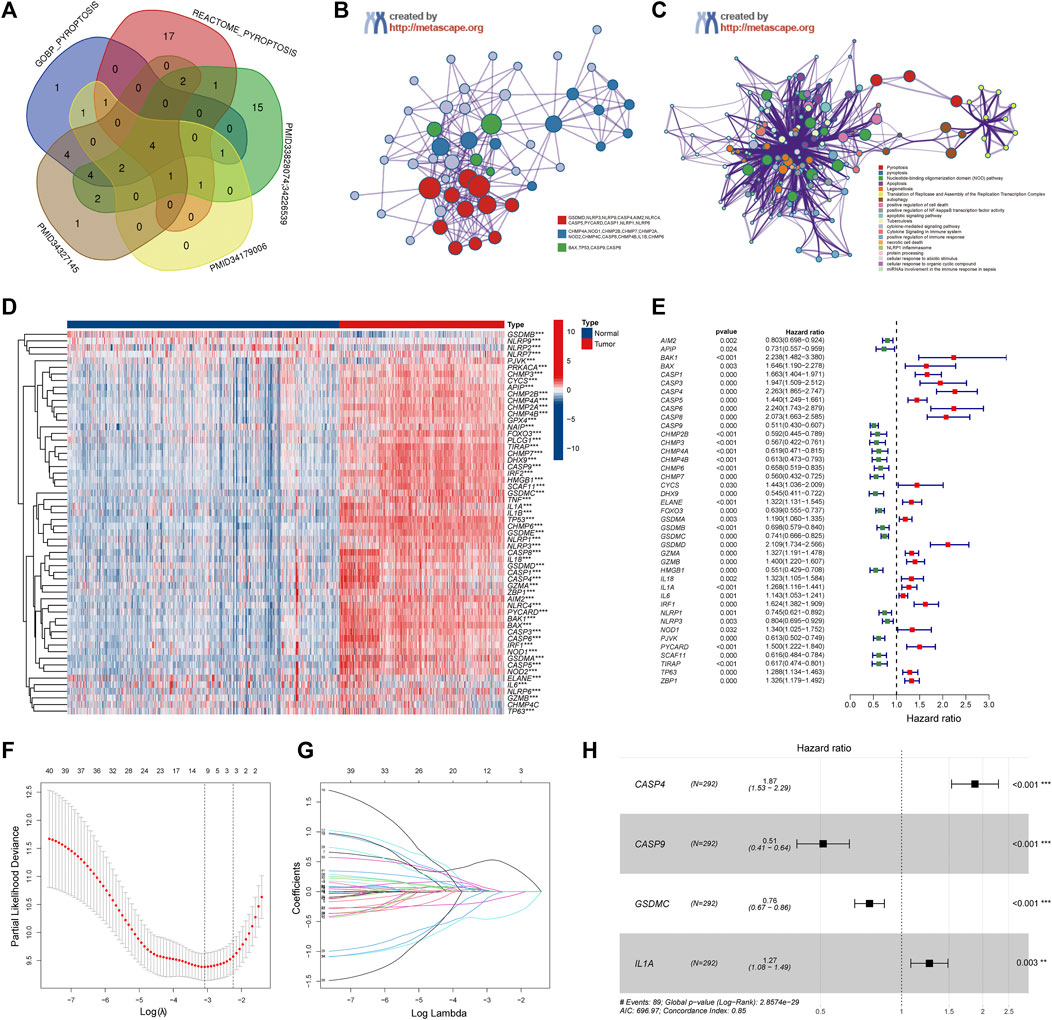
FIGURE 2. Identification of the Pyroptosis Related genes (PRGs) signature using LASSO-COX regression. (A) Venn diagram of the PRGs collected from MSigDB and different literatures. (B) Protein-Protein Interaction network was performed by Metascape website. (C) Gene Ontology enrichment analysis was performed by Metascape website. (D) Heatmap of all PRGs between the normal brain and glioma tissues. (E) Forest plot of univariate Cox regression of differential expressed PRGs. (F) The log (lambda) sequence plot of PRGs using LASSO regression. (G) The LASSO coefficient profiles of PRGs in TCGA-train dataset. (H) Forest plot of four signature genes of PRGs. LASSO, least absolute shrinkage, and selection operator; TCGA, The Cancer Genome Atlas. **p < 0.01, ***p < 0.001.
To investigate the correlation between the expression of PRGs and clinicopathological characteristics, we performed consensus cluster analysis with 583 glioma patients from the TCGA datasets (Supplementary Figure S1A). The Cumulative Distribution Function (CDF) and delta area under CDF change was utilized to determine a suitable clustering variable (k) for the optimum stability of the sample distribution (Supplementary Figures S1B,C). The patients were divided into two distinct clusters, and the OS of cluster 1 was significantly better than cluster 2 (p < 0.001) (Supplementary Figure S1D). Besides, as shown in the heatmap (Supplementary Figure S1E), except for the gender, there were significantly differences in clinicopathologic features between the two clusters, including the age, grade, IDH status, and 1p19q codeletion (p < 0.001).
Patients in the TCGA cohort were randomly divided into a training group (n = 292) and a testing group (n = 291). Univariate Cox regression analysis was performed among these 57 PRGs in the training datasets to screen prognostic genes, and 41 genes remained for further analysis (p < 0.05). Among them, 19 were protective genes (hazard ratio <1), and 22 genes were associated with increased risk (hazard ratio >1) (Figure 2E). Subsequently, the LASSO method was used to narrow down the candidate genes according to the minimum penalty parameter (λ) (Figures 2F,G). Finally, combined with Multivariate Cox regression analyses, four PRGs (CASP4, CASP9, GSDMC, IL1A) were identified as prognostic biomarkers for glioma patients. The PRGs signature risk model was formulated as: Risk score = (0.629*CASP4 exp.) + (−0.670* CASP9 exp.) + (−0.274 * GSDMC exp.) + (0.237* IL1A exp.) (Figure 2H).
We observed the relationship between the expression status of the four genes and the tumor grade and prognosis. The results suggest that high expression of CASP4 and IL1A is associated with higher WHO classification (Figures 3A,D), in contrast to CASP9 and GSDMC (Figures 3B,C). For prognosis, high expression of CASP4 and IL1A was associated with worse prognosis (Figures 3E,H), while CASP4 and GSDMC were not (Figures 3F,G). Further, we observed the mRNA expression of the four genes in different cell lines by qPCR. Compared with HA 1800 and HMC3 cell lines, the expression levels of CASP4, CASP9 and GSDMC showed an overall upward trend, and the IL1A level showed an overall downward trend in glioma cell lines (Figures 3I–L). In addition, we explored the proteins express by CASP4, CASP9, and GSDMC in glioma patients through the Human Protein Atlas database, and CASP4, CASP9 exhibited higher staining intensity in glioma than normal brain tissues (Figure 3M–O). The statistical histogram was shown in Figure 3P.
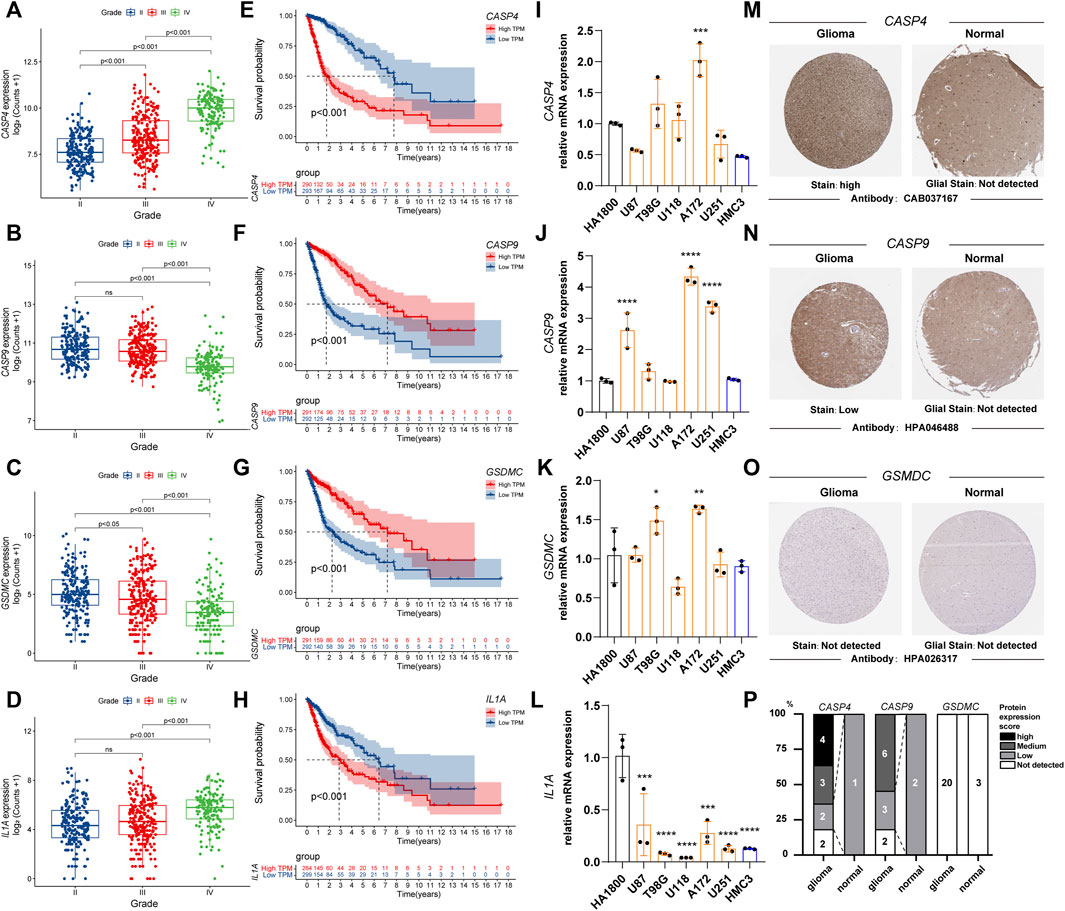
FIGURE 3. The relationship between the expression status of the PRGs signature and the tumor grade and prognosis. (A–D) Box plot of PRGs signature expression with tumor grade. (E–H) Overall survival of different PRGs signature expression in glioma. (I–L) Relative mRNA expression of PRGs signature in different cell lines by qPCR. (*p < 0.05, **p < 0.01, ***p < 0.001. ****p < 0.0001, Not labeled: no statistical significance compared to HA 1800). (M–O) Representative protein expression images of PRGs signature by the Human Protein Atlas (HPA). (P) Statistical column stacking diagram of PRGs signature protein expression in HPA. PRGs, Pyroptosis Related genes. qPCR, quantitative Polymerase Chain Reaction. PRGs, Pyroptosis Related genes.
The risk scores of each patient were calculated based on the signature constructed. Then, glioma patients were stratified into the high- and low-risk groups by median risk score. In the TCGA train group, time-dependent ROC curves were used to evaluate the sensitivity and specificity of the prognostic model, and the area under the ROC curve (AUC) for 1-, 3, - and 5-year OS was 0.893, 0.921, and 0.848, respectively (Figure 4A left). Kaplan-Meier survival curve showed that the OS of patients in the high-risk group was significantly shorter than the high-risk group (p < 0.001; Figure 4B left). PCA and t-SEN analysis revealed a satisfactory separation between different risk groups (Figures 4C,D left). The distribution of patients was presented (Figures 4E,F left). Patients in the low-risk group had a lower mortality rate and longer lifespan. The expression of these four PRGs in different groups was shown in the heatmap (Figure 4G left). CASP4 and IL1A were upregulated in the high-risk group, while CASP9 and GSDMC were downregulated. Subsequently, similar analyses were performed using TCGA-test, CGGA and Rembrandt databases (Figures 4A–G right).
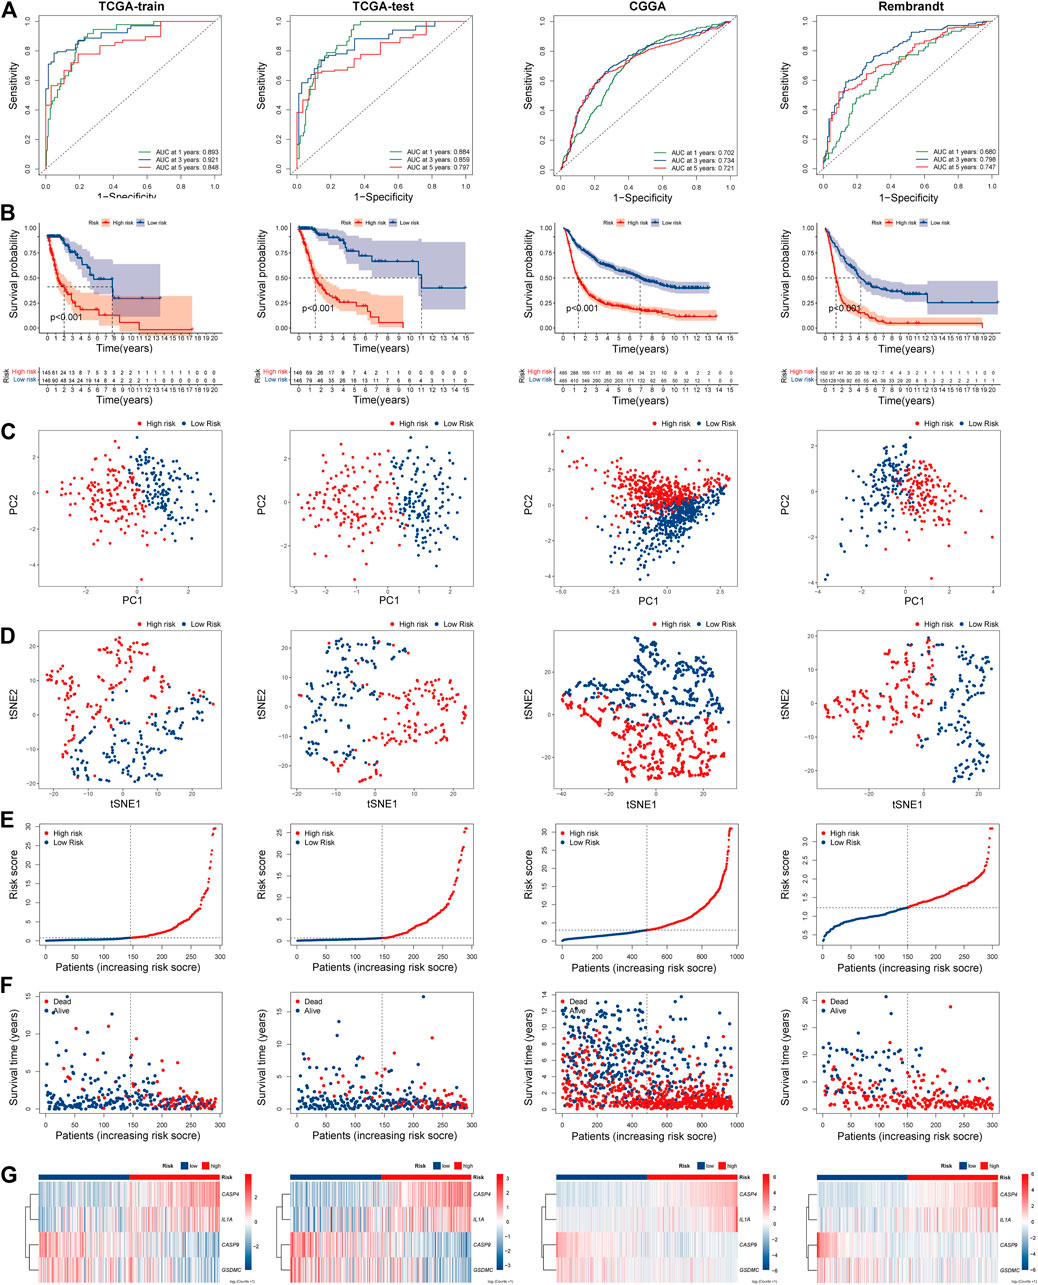
FIGURE 4. Prognostic risk model analysis of PRGs signature in TCGA-train, TCGA-test, CGGA, and Rembrandt datasets. (A) The time-dependent ROC analyses of the PRGs risk score in TCGA-train, TCGA-test, CGGA, and Rembrandt datasets. (B) Survival curve of the PRGs signature risk model in above datasets. (C) PCA analysis of the PRGs signature in above datasets. (D) t-SNE analysis of the PRGs signature in above datasets. (E) The distribution and median value of the PRGs signature risk scores in above datasets. (F) The distributions of survival status, survival time, and PRGs risk score in above datasets. (G) Heatmap of PRGs signature expression in high- and low- risk groups in above datasets. REMBRANDT, Repository of Molecular Brain Neoplasia Data. PRGs, Pyroptosis Related genes. ROC, receiver operating characteristic; TCGA, The Cancer Genome Atlas. CGGA, Chinese Glioma Genome Atlas. PCA, Principal components analysis. t-SNE, t-Distributed Stochastic Neighbor Embedding.
Next, we explored the correlation between PRGs signature and clinicopathological features of gliomas in TCGA and CGGA datasets. Significant differences were observed between the two risk subgroups regards to WHO grade (II, III, IV), age (<47, ≥47), IDH status (mutation, wild), and 1p19q codeletion in the TCGA cohort (Figure 5A). Similar analyses were performed using CGGA (Figure 5B). Subsequently, we compared the risk score across patients with different clinicopathological characteristics. For the TCGA cohort, glioma patients with the clinicopathological features of age >47 years, higher grade, IDH wild type, and 1p19q non-codeletion had significantly higher risk score levels (Figures 5C,G,H,K). In addition, no significant difference was observed between groups stratified by gender (Figure 5D). Similar results were observed in the CGGA cohort (Figures 5E,F,I,J,L,N); besides, MGMT promoter unmethylated and recurrent subgroups also had significantly higher risk scores (Figure 5M).
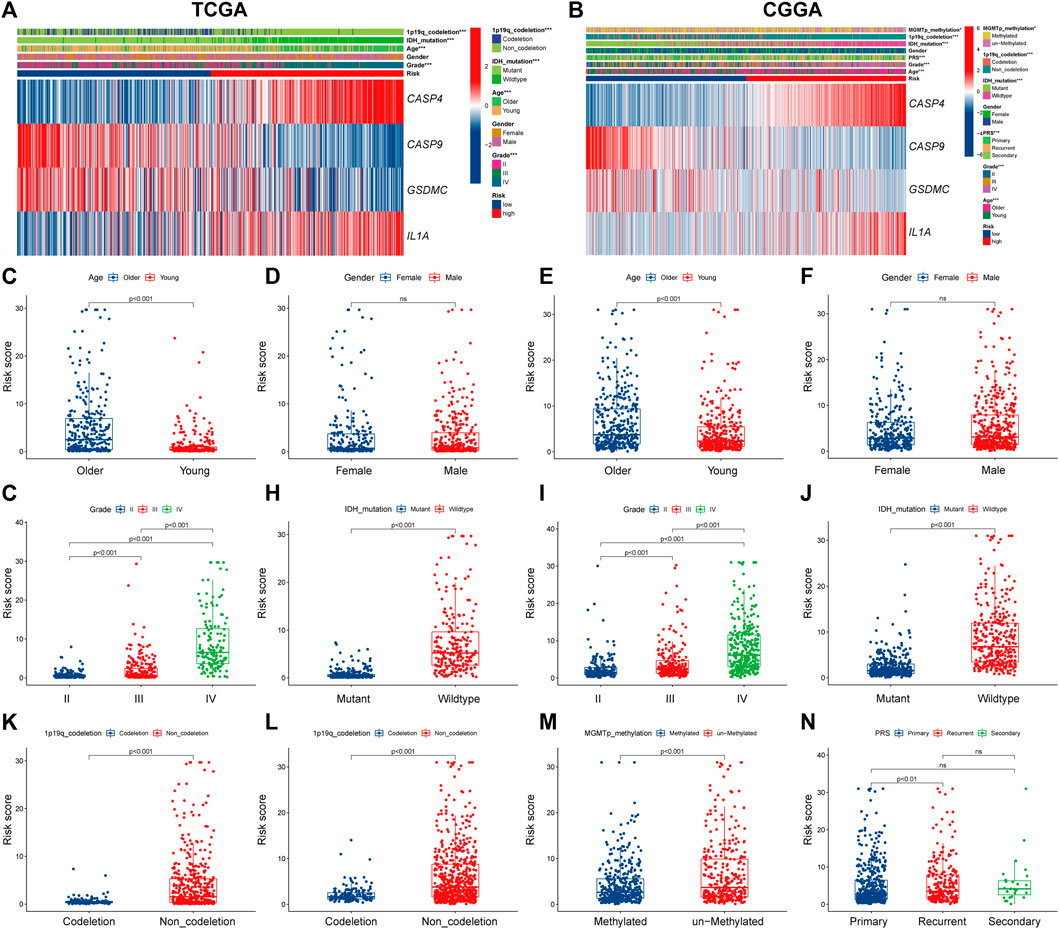
FIGURE 5. The correlation between PRGs risk score and clinicopathologic characteristics. (A,B) Heatmap of correlation between PRGs risk groups with age, gender, tumor grade, IDH status, 1p19q codeletion, and PRGs signature gene expression in TCGA dataset (A), and age, gender, tumor grade, IDH status, 1p19q codeletion, MGMT promoter methylation status, PRS type, and PRGs signature gene expression in CGGA dataset (B). (C–N) Box and scatter plot of relationship between risk score and age (C), gender (D), tumor grade (G), IDH status (H), and 1p19q codeletion (K) in TCGA dataset; and age (E), gender (F), tumor grade (I), IDH status (J), 1p19q codeletion (L), MGMT promoter methylation status (M), and PRS type (N) in CGGA dataset, respectively. PRGs, Pyroptosis Related genes. TCGA, The Cancer Genome Atlas. CGGA, Chinese Glioma Genome Atlas. IDH, isocitrate dehydrogenase. MGMT, O6-methylguanine-DNA methyltransferase. PRS, tumor type of primary recurrent or secondary.
The univariate and multivariate cox regression analyses were performed to identify PRGs signatures as independent OS-related predictors. For the TCGA cohort, Univariate Cox regression analysis demonstrated that the risk scores were associated with the OS of glioma patients (HR = 6.793, 95%CI = 4.600-10.032, p < 0.001). Multivariate Cox regression analysis revealed that the risk-score was an independent prognostic factor (HR = 2.048, 95%CI = 1.192 −3.517, p < 0.001). The results were similar in the CGGA cohort (Supplementary Figure S2A–D). Subsequently, a nomogram based on clinical characteristics, including age, WHO grade, IDH status, 1p19q codeletion, and risk score in the TCGA cohort was established (Figure 6A). The area under the ROC curve (AUC) for 1-, 3-, and 5-year OS was 0.904, 0.933, and 0.899, respectively (Figure 6B). In addition, the internal assessment showed a consistency index (C-index) of 0.866, and the calibration curve showed a satisfactory match between the actual and nomogram-predicted 1-year, 3-year, and 5-year OS probabilities (Figure 6C). The same analysis was performed in the CGGA cohort as an external evaluation. The accuracy of the nomogram in predicting 1-, 3-, and 5-year OS was 0.826, 0.873, and 0.877, respectively (Figure 6D). Additionally, the C-index was 0.744, and calibration curves show a satisfactory match between the actual and nomogram-predicted probabilities of 1-year, 3-year, and 5-year OS (Figure 6E).
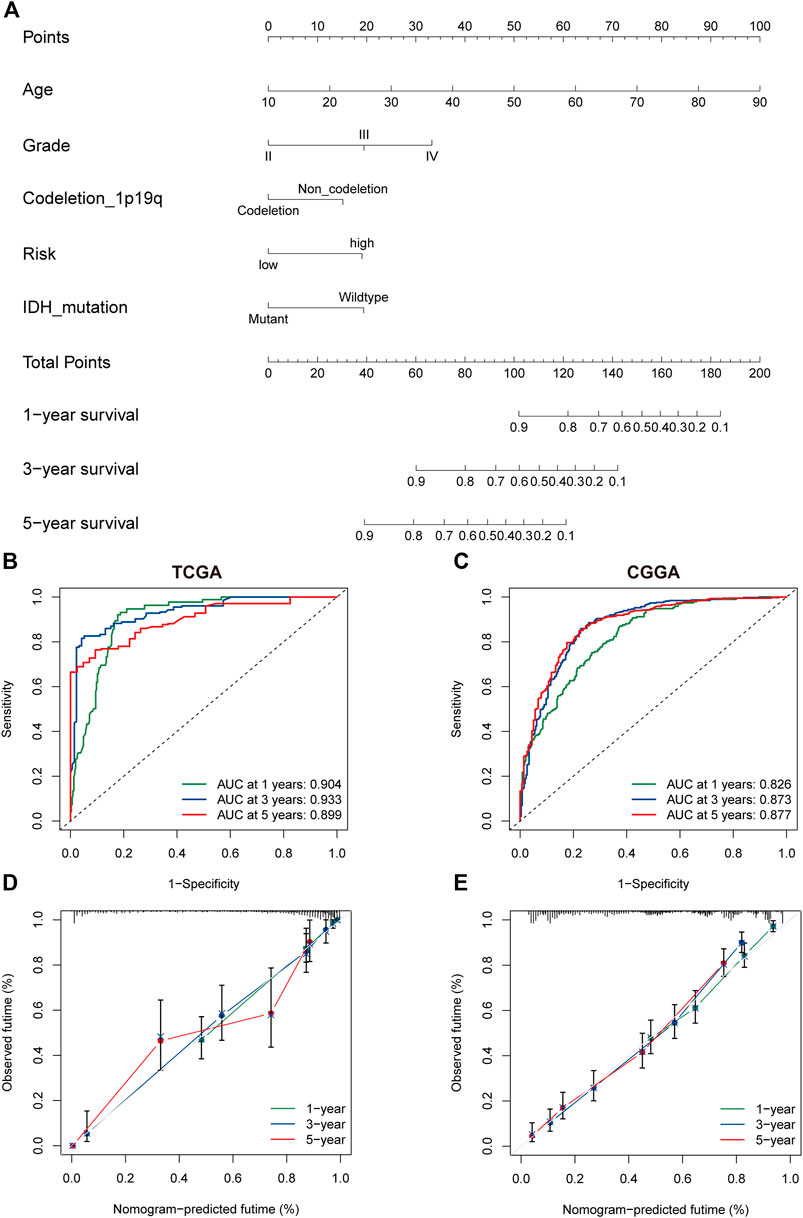
FIGURE 6. The nomogram of the PRG signature predicts survival in glioma patients. (A) The nomogram with PRGs signature risk group for the prediction of OS of glioma patients was constructed based on the TGGA dataset. BC. The time-dependent ROC analyses of the PRGs nomogram in TCGA (B), and CGGA (C). (D,E) The calibration plots for predicting 1-, 3-, and 5-year survival using TCGA (D), and CGGA (E). PRGs, Pyroptosis Related genes. TCGA, The Cancer Genome Atlas. CGGA, Chinese Glioma Genome Atlas.
To clarify the potentially functional mechanism of the PRGs and prognosis of patients with glioma, GO, and KEGG enrichment analyses were conducted to characterize the biological functions of DEGs between low- and high-risk groups. GO analyses in the TCGA cohort showed gene enrichment in trans-synaptic signaling regulation (Figure 7A), and in CGGA datasets revealed significant enrichment of immune-related biological processes, including neutrophil activation, humoral immune response, and defense response to bacterium (Figure 7B). Similarly, KEGG pathway analysis showed an enrichment of immune-related pathways in both cohorts (Supplementary Figures S3A,B). For instance, cytokine-cytokine receptor interaction and antigen processing and presentation pathway. To further verify these results, GSEA was performed in both cohorts. In the c5.go dataset, both cohorts showed significant enrichment of immune-related biological processes in the high-risk group, for instance, activation of the immune response, adaptive immune response, and adaptive immune response (Figures 7C–F). In the c2.cp.kegg dataset, the high-risk group was also significantly associated with immune-related pathways, such as cytokine-cytokine receptor interaction, JAK-STAT signaling pathway, and chemokine signaling pathway (Supplementary Figure S3C–F).
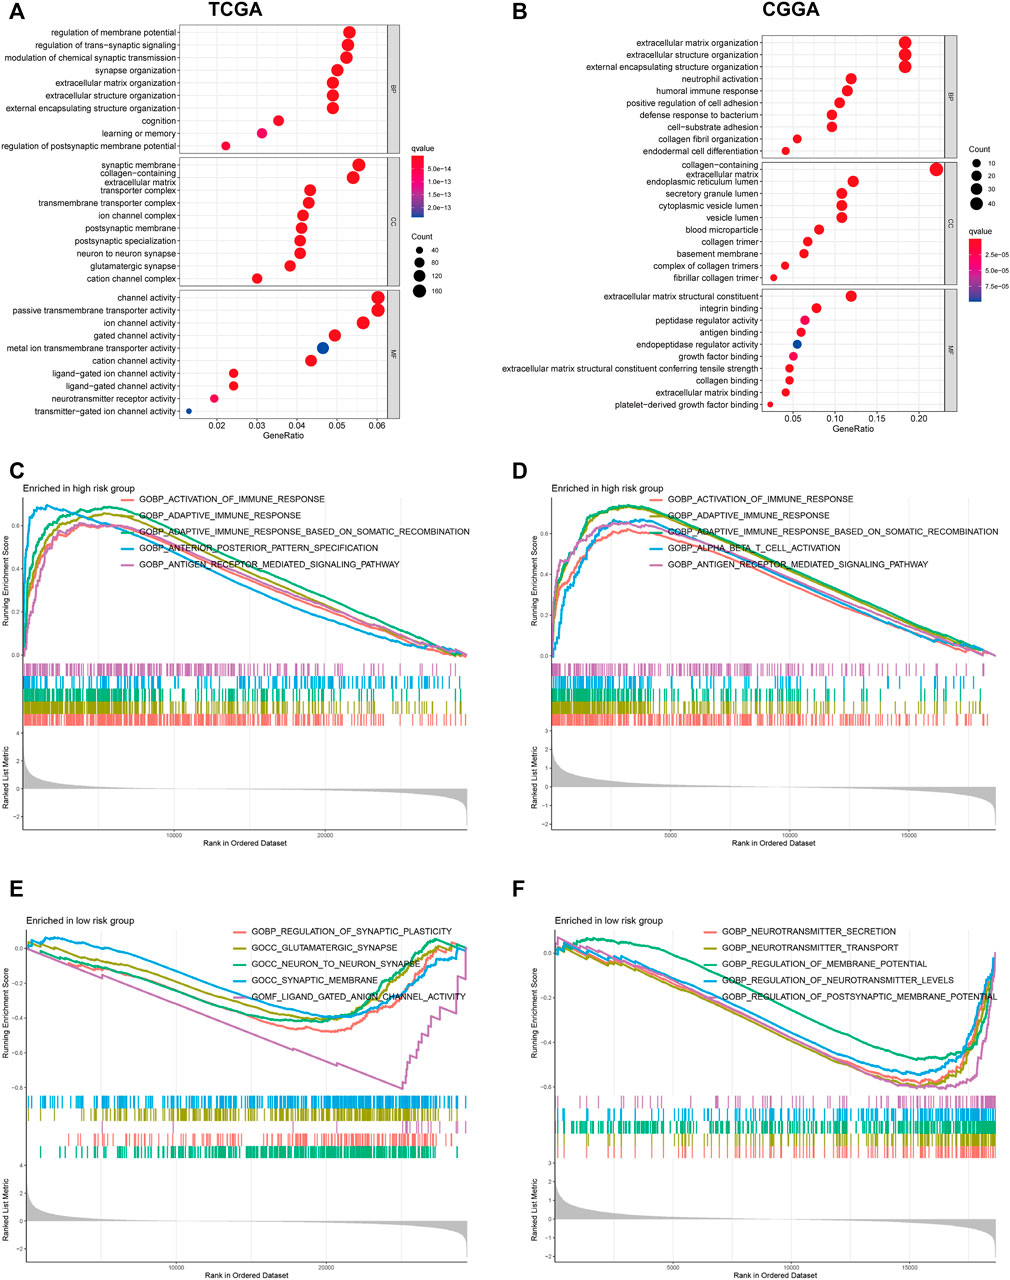
FIGURE 7. GO functional enrichment analyses between different PRGs risk groups. (A,B) Bubble graph of GO enrichment analysis between high- and low- PRGs risk group using TCGA (A) and CGGA (B). (C–F) GSEA GO analyses of different PRGs risk group in TCGA or CGGA datasets. (C): high risk, TCGA; (D): high risk, CGGA; (E): low risk, TCGA; (F): low risk, CGGA). GO, Gene Ontology. PRGs, Pyroptosis Related genes. TCGA, The Cancer Genome Atlas. CGGA, Chinese Glioma Genome Atlas. GSEA, gene set enrichment analysis.
Considering that the enrichment analysis identified multiple immune-related pathways, we further investigated the correlation between PRGs signature and immune cell infiltration in the glioma microenvironment. In both TCGA and CGGA cohorts, the high-risk group showed significantly lower tumor purity and higher immune and stromal scores than the low-risk group (Figures 8A,B). Next, we performed the ssGSEA analysis to determine the correlation between the PRGs signature and immune cell infiltration in the tumor microenvironment. In the TCGA cohort, except for the neutrophils, natural killer (NK) cells, and Th1 cells, the other 13 immune cells showed significantly higher levels of infiltration in the high-risk group (Supplementary Figure S4A). In comparison, all the 16 types of immune cells showed a higher abundance in the CGGA cohort (Supplementary Figure S4B). Moreover, the activity of 13 immune-related pathways was higher in the high-risk subgroup of both TCGA and CGGA cohorts (Supplementary Figures S4C,D). We further explored the correlation between the risk score and immune checkpoints and some newly biomarkers (PD1, PD-L1, CTLA-4, LAG-3, TIM -3, B7-H3, TIGIT, APOBEC3B, and TNFSF13). The Spearman analysis showed that the risk score was significantly correlated with all nine immunotherapy checkpoints. In the TCGA cohort, the risk score was negatively correlated with TIGIT, and the other six genes were positively correlated (Figure 8C). Meanwhile, in the CGGA cohort, all of them were positively correlated with the risk score (Figure 8D). To better elucidate the value of PRGs signature in predicting immunotherapy response, we analyzed TIDE scores in gliomas patients of TCGA. The results showed that the TIDE and dysfunction scores were lower in the high-risk group (Figures 8E,F), and exclusion scores showed the opposite trend (Figure 8G). Moreover, the responder group was positively associated with risk scores, indicating that patients in the high-risk group might have a better response to immunotherapy (Figure 8H). The immunological score could predict the anti-CTLA-4 and anti-PD-1 antibody response, which can identify determinants of tumor immunogenicity (Charoentong et al., 2017). Subsequently, we investigated this correlation of immunophenoscore in the TCGA- GBM cohort and found that risk groups in IPS-CTLA4 and IPS had no significant difference in immunophenoscore (Figures 8I,J). Whileas, IPS- PD1 and IPS-PD1-CTLA4 blocker scores were higher in the high-risk group suggesting better immunotherapeutic benefits (Figures 8K,L).
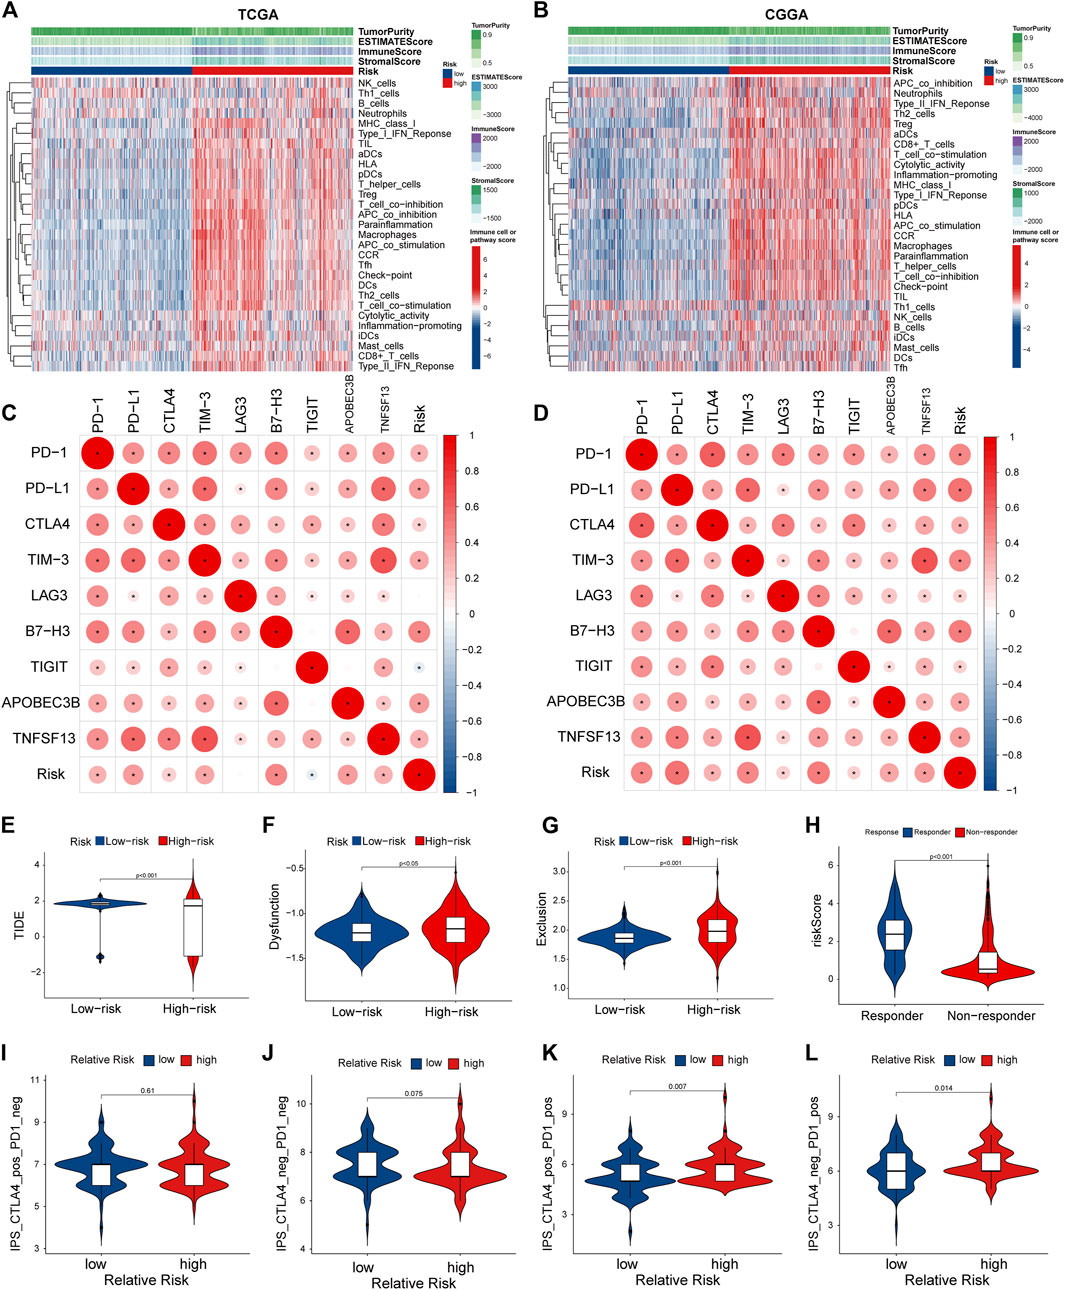
FIGURE 8. Tumor microenvironment and immunocorrelation analysis of PRGs signature risk group in glioma. (A,B) Heatmap of correlation between different risk group and different immune infiltration pattern using ssGSEA in TCGA (A) and CGGA (B). (C,D) Correlation analysis between PRGs risk score and expression levels of immune checkpoints (PD1, PD-L1, CTLA-4, LAG-3, TIM -3, B7-H3, TIGIT, APOBEC3B, and TNFSF13) in TCGA (C) and CGGA (D). (E–H) Correlation analysis between TIDE evaluation in TCGA(LGG-GBM) datasets. TIDE score (E), dysfunction score (F), Exclusion (G) and Responder (H). (I–L) Correlation analysis between immunophenoscore of anti-cytotoxic T-lymphocyte antigen-4 (CTLA-4) and anti-PD-1 blocker and Relative risk of TCGA-GBM datasets. TIDE, Tumor Immune Dysfunction and Exclusion. PRGs, Pyroptosis Related genes. TCGA, The Cancer Genome Atlas. CGGA, Chinese Glioma Genome Atlas. ssGSEA: single sample gene set enrichment analysis.
Extensive research on the mechanism of the pyroptosis pathway has led to a renewed interest in accessing the effect of pyroptosis for cancer treatment owing to its pro-inflammatory effects (Hou et al., 2021). Emerging studies have revealed that pyroptosis-related gene signatures were associated with anti-tumor immunity and could be used to predict patient prognosis in a variety of cancer types. (Ju et al., 2021; Lin et al., 2021; Shao et al., 2021; Ye et al., 2021). However, no previous study has been conducted to demonstrate the predictive value of pyroptosis-related genes in glioma. Considering the emerging role of pyroptosis in carcinogenesis (Loveless et al., 2021) and the poor prognosis of glioma, we built a new tool based on pyroptosis signatures to establish a predictive model for glioma.
In this study, we compared the expression level of 58 PRGs between glioma and normal brain tissue samples, and we found that 57 of 58 genes were differentially expressed. To investigate the prognostic value of the expression of PRGs in glioma, we performed consensus clustering, which showed that patients could be divided into two clusters based on different clinical characteristics. Then we selected 4 PRGs (CASP4, CASP9, GSDMC, IL1A) based on a signature predictive model via Univariate Cox proportional hazards regression, LASSO regression, and multivariate Cox regression. For internal and external validation datasets, the results suggest the risk model could accurately predict survival outcomes of patients with glioma. Combined with other Clinicopathological features (age, grade, IDH, 1p19q), we built a nomogram with the improved capacity to predict the overall survival rate. Functional enrichment analyses indicated the differences in immune-related biological processes between high- and low-risk groups. We further investigated the difference in tumor immune microenvironment between the two groups. The results showed that the high-risk group had lower tumor purity and higher immune and stromal scores. Immune cell infiltration analysis revealed that risk score was positively correlated with the level of immune cell and immune-related pathways. Moreover, PRGs signatures may related to the benefits of immunotherapy.
Two fundamental and several alternative pathways are associated with pyroptosis, in which, caspase-1activates the canonical inflammasome pathway, non-canonical inflammasome pathway via caspase-4/5 (or mouse caspase-11), and in the alternative pathways, the most reported one is caspase-3 (Fang et al., 2020; Loveless et al., 2021). GSDM family proteins consist of an N-terminal pore-forming domain, a C-terminal regulatory domain, and a linker region that inhibit the N-terminal domain’s lethal activity (Kuang et al., 2017). Caspases or granzymes can cleave the linker site, resulting in the N-terminal domain fragment translocating into cell membranes. Thus, the N-terminal domain triggers the oligomerization and forms β -barrel transmembrane pores, leading to cytokines released following cell lysis, such as interleukin-1 β (IL-1 β) and interleukin-18 (IL-18) (Guey et al., 2014; Ding et al., 2016). The available studies suggest that 4 PRGs we found (CASP4, CASP9, GSDMC, and IL1A) may be involved in different pathways of pyroptosis.
In the nonclassical pyroptosis pathway, human CASP-4, -5 and murine orthologues CASP-11 can be directly activated by cytosolic lipopolysaccharide (LPS) from Gram-negative bacteria or host-derived oxidized phospholipids. Activated caspase-4/5/11 then cleave GSDMD to generate biologically active GSDMD-NT, contributing to pyroptotic cell death (Shi et al., 2014; He et al., 2015; Kayagaki et al., 2015; Gao et al., 2018; Wang et al., 2018; Ahmed et al., 2019; Qiao et al., 2019). It is reported that GSDMB could bind to the CARD of caspase-4, trigger its oligomerization, and increase its enzymatic activity, thereby promoting the cleavage of GSDMD and inducing non-canonical pyroptosis (Chen et al., 2019). Our study showed that CASP4 was negatively correlated with OS and positively correlated with the WHO grade of glioma patients, suggesting that CASP4 may act as an oncogene in glioma.
CASP9 is a classical initiator of intrinsic apoptosis (Li et al., 1997). Recent studies showed that GSDME could be activated by caspase-3/-9 in lung cancer cells and melanoma (Zhou et al., 2018; Zhang et al., 2019). Mitochondrial dysfunction could trigger caspase-9 activation and subsequently cleaves and activates caspase-3. Active caspase-3 then cleaves GSDME to GSDME-NT, thus leading to pore-formation on the cell membrane, which is the hallmark for pyroptosis (Wang et al., 2021b). When GSDME is defective, cells are more prone to apoptosis. However, in cells with high GSDME expression, GSDME-mediated pyroptosis may precede apoptosis. (Wang et al., 2017).
IL-1α, a pre-stored cytokine of the IL-1family, is a canonical immune alarmin passively released during cell lysis (Monteleone et al., 2015). Our study showed that IL1A is negatively correlated with OS and positively correlated with WHO classification of glioma patients. Previous studies have demonstrated pro–IL-1α is bound to the intracellular receptor IL-1R2, which was usually processed by calpain during necrosis, and can also be cleaved to its mature form by caspase-5 and -11 in pyroptosis (Zheng et al., 2013; Wiggins et al., 2019). Batista et al. revealed that IL-1α is expressed in microglia and ex vivo IL-1α release is dependent on GSDMD, which promotes protective immunity in brain inflammation and parasite infection. (Batista et al., 2020). Under the inhibition of caspase-1, the activation of NLRP3 inflammasome induces incomplete pyroptosis and is accompanied by IL-1α release (Chan and Schroder, 2020).
Early studies found GSDMC was highly expressed in metastatic melanoma cells (Watabe et al., 2001; Miguchi et al., 2016; Wei et al., 2020). However, GSDMC was downregulated in GC and esophageal cancer cells and inhibited cell growth (Saeki et al., 2009). Recently, Hou et al. reported that GSDMC could be cleaved and activated in breast cancer cells by caspase 8, converting TNF-α-induced apoptosis to pyroptosis, leading to tumor necrosis (Hou et al., 2020). Our study showed that GSDMC is positively correlated with OS and negatively correlated with WHO classification of glioma patients, suggesting that GSDMC may act as a tumor suppressor in glioma. Considering the complex role of GSDMC in different tumors, further studies should be conducted to validate the functional mechanisms of GSDMC in glioma cell and animal models.
The immunosuppressive microenvironment and the resistance to apoptosis are significant factors contributing to the therapeutic dilemma of the tumor (Loveless et al., 2021). Cancer cell pyroptosis may promote immune cell activation and infiltration, eliciting a robust inflammatory response, thus leading to immunogenic cell death (ICD) (Zhang et al., 2020b). However, given its inflammatory feature, pyroptosis possibly induces an immunosuppressive microenvironment in some conditions, such as pathogen infection or hypoxia (Hou et al., 2020; Hou et al., 2021). The effect of pyroptosis may be determined by the complex interactions between tumor cells and the surrounding microenvironment. Previous studies have shown that therapeutic inhibition of IDO, CTLA-4, or PD-L1 in mouse glioma models significantly reduces the number of tumor-infiltrating Treg cells and substantially improves long-term survival. (Wainwright et al., 2014). Immune checkpoint blockade appears to be a promising strategy in the immunotherapy of glioma. The application of various immunotherapeutic approaches, especially combination strategies, has been shown to be efficacious in glioma (Zhang et al., 2021b; Yang et al., 2022). Currently, nanoparticles loaded with pyroptosis inducers have been shown to be effective for treating tumors in both in vivo and in vitro models and activating immunity in breast cancer (Wang et al., 2020). In our study, DEGs between different risk subgroups were enriched in many biological processes and pathways related to immune responses. Besides, we found that the high-risk group exhibited lower tumor purity and higher immune and stromal scores, a higher abundance of immunosuppressive cells such as Tregs, and higher expression levels of immune checkpoints. These results suggested that the PRGs were correlated with the immune landscape of the glioma microenvironment. Our findings may provide new ideas and targets for the immunotherapy of glioma.
Undoubtedly, some limitations must be addressed in the present study. Firstly, our current results are obtained merely in public databases, and it is necessary to validate our results in vitro and in vivo. Secondly, although bulk genomic and transcriptome analyses provide valuable insights into this study, the information obtained at the bulk level is averaged over many cells number, often masking specific subpopulations or cell states. Therefore, the relationship between glioma pyroptosis and the local immune microenvironment may require an in-depth study by techniques such as single-cell sequencing. Besides, the available samples for qPCR were not sufficient. In further work, more tissue samples is needed to reach a robust result.
This study built a prognostic model based on PRGs signature. This model exhibited high accuracy in predicting survival outcomes of glioma patients and was validated by external data sources. In addition, the PRGs signature was correlated with immune infiltration of the glioma microenvironment and was indicative of different efficacy of immunotherapy to a certain extent. These findings will offer some valuable insights for subsequent studies and clinical practice.
The datasets presented in this study can be found in online repositories. The names of the repository/repositories and accession number(s) can be found in the article/Supplementary Material.
Conceptualization, YZ and YYu; Methodology, YZ and CZ; Validation, GW, ZW, JL, and LZ; Formal analysis, YZ and CZ; Experiment, YZ, CZ, and YYa; Funding acquisition, YYu; Writing—original draft preparation, CZ, YYa, and YZ; Writing—review and editing, YZ, CZ, and YYa; Visualization, YZ and CZ; Supervision, LZ and YYu; Project administration, LZ and YYu. All authors have read and agreed to the published version of the manuscript.
This research was funded by the National Natural Science Foundation of China (Grant No. 81872062) and Joint Project of BRC-BC (Biomedical Translational Engineering Research Center of BUCT-CJFH) (XK2022-08).
The authors declare that the research was conducted in the absence of any commercial or financial relationships that could be construed as a potential conflict of interest.
All claims expressed in this article are solely those of the authors and do not necessarily represent those of their affiliated organizations, or those of the publisher, the editors and the reviewers. Any product that may be evaluated in this article, or claim that may be made by its manufacturer, is not guaranteed or endorsed by the publisher.
The Supplementary Material for this article can be found online at: https://www.frontiersin.org/articles/10.3389/fcell.2022.862493/full#supplementary-material
Ahmed, S. G., Abdelanabi, A., Doha, M., and Brenner, G. J. (2019). Schwannoma Gene Therapy by Adeno-Associated Virus Delivery of the Pore-Forming Protein Gasdermin-D. Cancer Gene Ther. 26, 259–267. doi:10.1038/s41417-018-0077-3
Batista, S. J., Still, K. M., Johanson, D., Thompson, J. A., OʼBrien, C. A., Lukens, J. R., et al. (2020). Gasdermin-D-dependent IL-1α Release from Microglia Promotes Protective Immunity during Chronic Toxoplasma Gondii Infection. Nat. Commun. 11, 3687. doi:10.1038/s41467-020-17491-z
Chan, A. H., and Schroder, K. (2020). Inflammasome Signaling and Regulation of Interleukin-1 Family Cytokines. J. Exp. Med. 217, e20190314. doi:10.1084/jem.20190314
Charoentong, P., Finotello, F., Angelova, M., Mayer, C., Efremova, M., Rieder, D., et al. (2017). Pan-cancer Immunogenomic Analyses Reveal Genotype-Immunophenotype Relationships and Predictors of Response to Checkpoint Blockade. Cel Rep. 18, 248–262. doi:10.1016/j.celrep.2016.12.019
Chen, Q., Shi, P., Wang, Y., Zou, D., Wu, X., Wang, D., et al. (2019). GSDMB Promotes Non-canonical Pyroptosis by Enhancing Caspase-4 Activity. J. Mol. Cel. Biol. 11, 496–508. doi:10.1093/jmcb/mjy056
Ding, J., Wang, K., Liu, W., She, Y., Sun, Q., Shi, J., et al. (2016). Pore-forming Activity and Structural Autoinhibition of the Gasdermin Family. Nature 535, 111–116. doi:10.1038/nature18590
Fang, Y., Tian, S., Pan, Y., Li, W., Wang, Q., Tang, Y., et al. (2020). Pyroptosis: A New Frontier in Cancer. Biomed. Pharmacother. 121, 109595. doi:10.1016/j.biopha.2019.109595
Ferguson, S. D., and Mccutcheon, I. E. (2018). Surgical Management of Gliomas in Eloquent Cortex. Intracranial Gliomas I-Surgery 30, 159–172. doi:10.1159/000464391
Gao, J., Qiu, X., Xi, G., Liu, H., Zhang, F., Lv, T., et al. (2018). Downregulation of GSDMD Attenuates Tumor Proliferation via the Intrinsic Mitochondrial Apoptotic Pathway and Inhibition of EGFR/Akt Signaling and Predicts a Good Prognosis in Non-small C-ell L-ung C-ancer. Oncol. Rep. 40, 1971–1984. doi:10.3892/or.2018.6634
Ghouzlani, A., Kandoussi, S., Tall, M., Reddy, K. P., Rafii, S., and Badou, A. (2021). Immune Checkpoint Inhibitors in Human Glioma Microenvironment. Front. Immunol. 12, 2664. doi:10.3389/fimmu.2021.679425
Guey, B., Bodnar, M., Manié, S. N., Tardivel, A., and Petrilli, V. (2014). Caspase-1 Autoproteolysis Is Differentially Required for NLRP1b and NLRP3 Inflammasome Function. Proc. Natl. Acad. Sci. U.S.A. 111, 17254–17259. doi:10.1073/pnas.1415756111
Hartigan, J. A., and Wong, M. A. (1979). Algorithm AS 136: A K-Means Clustering Algorithm. Appl. Stat. 28, 100–108. doi:10.2307/2346830
He, W.-T., Wan, H., Hu, L., Chen, P., Wang, X., Huang, Z., et al. (2015). Gasdermin D Is an Executor of Pyroptosis and Required for Interleukin-1β Secretion. Cell Res 25, 1285–1298. doi:10.1038/cr.2015.139
Hergueta-Redondo, M., Sarrió, D., Molina-Crespo, Á., Megias, D., Mota, A., Rojo-Sebastian, A., et al. (2014). Gasdermin-B Promotes Invasion and Metastasis in Breast Cancer Cells. PLoS One 9, e90099. doi:10.1371/journal.pone.0090099
Hou, J., Zhao, R., Xia, W., Chang, C.-W., You, Y., Hsu, J.-M., et al. (2020). PD-L1-mediated Gasdermin C Expression Switches Apoptosis to Pyroptosis in Cancer Cells and Facilitates Tumour Necrosis. Nat. Cel Biol 22, 1264–1275. doi:10.1038/s41556-020-0575-z
Hou, J., Hsu, J. M., and Hung, M. C. (2021). Molecular Mechanisms and Functions of Pyroptosis in Inflammation and Anti-tumor Immunity. Mol. Cel 81, 4579–4590. doi:10.1016/j.molcel.2021.09.003
Jiang, P., Gu, S., Pan, D., Fu, J., Sahu, A., Hu, X., et al. (2018). Signatures of T Cell Dysfunction and Exclusion Predict Cancer Immunotherapy Response. Nat. Med. 24, 1550–1558. doi:10.1038/s41591-018-0136-1
Ju, A., Tang, J., Chen, S., Fu, Y., and Luo, Y. (2021). Pyroptosis-Related Gene Signatures Can Robustly Diagnose Skin Cutaneous Melanoma and Predict the Prognosis. Front. Oncol. 11, 709077. doi:10.3389/fonc.2021.709077
Kayagaki, N., Stowe, I. B., Lee, B. L., O’Rourke, K., Anderson, K., Warming, S., et al. (2015). Caspase-11 Cleaves Gasdermin D for Non-canonical Inflammasome Signalling. Nature 526, 666–671. doi:10.1038/nature15541
Kuang, S., Zheng, J., Yang, H., Li, S., Duan, S., Shen, Y., et al. (2017). Structure Insight of GSDMD Reveals the Basis of GSDMD Autoinhibition in Cell Pyroptosis. Proc. Natl. Acad. Sci. U.S.A. 114, 10642–10647. doi:10.1073/pnas.1708194114
Lara-Velazquez, M., Al-Kharboosh, R., Jeanneret, S., Vazquez-Ramos, C., Mahato, D., Tavanaiepour, D., et al. (2017). Advances in Brain Tumor Surgery for Glioblastoma in Adults. Brain Sci. 7, 166. doi:10.3390/brainsci7120166
Li, P., Nijhawan, D., Budihardjo, I., Srinivasula, S. M., Ahmad, M., Alnemri, E. S., et al. (1997). Cytochrome C and dATP-dependent Formation of Apaf-1/caspase-9 Complex Initiates an Apoptotic Protease cascade. cell 91, 479–489. doi:10.1016/s0092-8674(00)80434-1
Lin, W., Chen, Y., Wu, B., Chen, Y., and Li, Z. (2021). Identification of the Pyroptosis-related P-rognostic G-ene S-ignature and the A-ssociated R-egulation axis in L-ung A-denocarcinoma. Cell Death Discov. 7, 161. doi:10.1038/s41420-021-00557-2
Louis, D. N., Perry, A., Reifenberger, G., Von Deimling, A., Figarella-Branger, D., Cavenee, W. K., et al. (2016). The 2016 World Health Organization Classification of Tumors of the central Nervous System: a Summary. Acta Neuropathol. 131, 803–820. doi:10.1007/s00401-016-1545-1
Loveless, R., Bloomquist, R., and Teng, Y. (2021). Pyroptosis at the Forefront of Anticancer Immunity. J. Exp. Clin. Cancer Res. 40, 264. doi:10.1186/s13046-021-02065-8
Miguchi, M., Hinoi, T., Shimomura, M., Adachi, T., Saito, Y., Niitsu, H., et al. (2016). Gasdermin C Is Upregulated by Inactivation of Transforming Growth Factor β Receptor Type II in the Presence of Mutated Apc, Promoting Colorectal Cancer Proliferation. PloS one 11, e0166422. doi:10.1371/journal.pone.0166422
Molenaar, R. J., Radivoyevitch, T., Maciejewski, J. P., Van Noorden, C. J. F., and Bleeker, F. E. (2014). The Driver and Passenger Effects of Isocitrate Dehydrogenase 1 and 2 Mutations in Oncogenesis and Survival Prolongation. Biochim. Biophys. Acta (Bba) - Rev. Cancer 1846, 326–341. doi:10.1016/j.bbcan.2014.05.004
Monteleone, M., Stow, J. L., and Schroder, K. (2015). Mechanisms of Unconventional Secretion of IL-1 Family Cytokines. Cytokine 74, 213–218. doi:10.1016/j.cyto.2015.03.022
Munn, D. H., and Bronte, V. (2016). Immune Suppressive Mechanisms in the Tumor Microenvironment. Curr. Opin. Immunol. 39, 1–6. doi:10.1016/j.coi.2015.10.009
Nirmala, J. G., and Lopus, M. (2020). Cell Death Mechanisms in Eukaryotes. Cell Biol Toxicol 36, 145–164. doi:10.1007/s10565-019-09496-2
Oberoi, R. K., Parrish, K. E., Sio, T. T., Mittapalli, R. K., Elmquist, W. F., and Sarkaria, J. N. (2015). Strategies to Improve Delivery of Anticancer Drugs across the Blood-Brain Barrier to Treat Glioblastoma. Neuro Oncol. 18, 27–36. doi:10.1093/neuonc/nov164
Ostrom, Q. T., Cioffi, G., Gittleman, H., Patil, N., Waite, K., Kruchko, C., et al. (2019). CBTRUS Statistical Report: Primary Brain and Other Central Nervous System Tumors Diagnosed in the United States in 2012-2016. Neuro Oncol. 21, v1–v100. doi:10.1093/neuonc/noz150
Osuka, S., and Van Meir, E. G. (2017). Overcoming Therapeutic Resistance in Glioblastoma: the Way Forward. J. Clin. Invest. 127, 415–426. doi:10.1172/jci89587
Qiao, L., Wu, X., Zhang, J., Liu, L., Sui, X., Zhang, R., et al. (2019). α‐NETA Induces Pyroptosis of Epithelial Ovarian Cancer Cells through the GSDMD/caspase‐4 Pathway. FASEB J. 33, 12760–12767. doi:10.1096/fj.201900483rr
Rathinam, V. A. K., and Fitzgerald, K. A. (2016). Inflammasome Complexes: Emerging Mechanisms and Effector Functions. Cell 165, 792–800. doi:10.1016/j.cell.2016.03.046
Saeki, N., Usui, T., Aoyagi, K., Kim, D. H., Sato, M., Mabuchi, T., et al. (2009). Distinctive Expression and Function of fourGSDMfamily Genes (GSDMA-D) in normal and Malignant Upper Gastrointestinal Epithelium. Genes Chromosom. Cancer 48, 261–271. doi:10.1002/gcc.20636
Savage, N. (2018). Searching for the Roots of Brain Cancer. Nature 561, S50–S51. doi:10.1038/d41586-018-06709-2
Shao, W., Yang, Z., Fu, Y., Zheng, L., Liu, F., Chai, L., et al. (2021). The Pyroptosis-Related Signature Predicts Prognosis and Indicates Immune Microenvironment Infiltration in Gastric Cancer. Front. Cel Dev. Biol. 9, 676485. doi:10.3389/fcell.2021.676485
Shi, J., Gao, W., and Shao, F. (2017). Pyroptosis: Gasdermin-Mediated Programmed Necrotic Cell Death. Trends Biochem. Sci. 42, 245–254. doi:10.1016/j.tibs.2016.10.004
Shi, J., Zhao, Y., Wang, Y., Gao, W., Ding, J., Li, P., et al. (2014). Inflammatory Caspases Are Innate Immune Receptors for Intracellular LPS. Nature 514, 187–192. doi:10.1038/nature13683
Subramanian, A., Tamayo, P., Mootha, V. K., Mukherjee, S., Ebert, B. L., Gillette, M. A., et al. (2005). Gene Set Enrichment Analysis: a Knowledge-Based Approach for Interpreting Genome-wide Expression Profiles. Proc. Natl. Acad. Sci. U.S.A. 102, 15545–15550. doi:10.1073/pnas.0506580102
Tan, G., Huang, C., Chen, J., and Zhi, F. (2020). HMGB1 Released from GSDME-Mediated Pyroptotic Epithelial Cells Participates in the Tumorigenesis of Colitis-Associated Colorectal Cancer through the ERK1/2 Pathway. J. Hematol. Oncol. 13, 1–11. doi:10.1186/s13045-020-00985-0
Wainwright, D. A., Chang, A. L., Dey, M., Balyasnikova, I. V., Kim, C. K., Tobias, A., et al. (2014). Durable Therapeutic Efficacy Utilizing Combinatorial Blockade against Ido, CTLA-4, and PD-L1 in Mice with Brain Tumors. Clin. Cancer Res. 20, 5290–5301. doi:10.1158/1078-0432.ccr-14-0514
Wang, Z., Bao, Z., Yan, W., You, G., Wang, Y., Li, X., et al. (2013). Isocitrate Dehydrogenase 1 (IDH1) Mutation-specific microRNA Signature Predicts Favorable Prognosis in Glioblastoma Patients with IDH1 Wild Type. J. Exp. Clin. Cancer Res. 32, 1–5. doi:10.1186/1756-9966-32-59
Wang, Y., Gao, W., Shi, X., Ding, J., Liu, W., He, H., et al. (2017). Chemotherapy Drugs Induce Pyroptosis through Caspase-3 Cleavage of a Gasdermin. Nature 547, 99–103. doi:10.1038/nature22393
Wang, W. J., Chen, D., Jiang, M. Z., Xu, B., Li, X. W., Chu, Y., et al. (2018). Downregulation of Gasdermin D Promotes Gastric Cancer Proliferation by Regulating Cell Cycle-Related Proteins. J. Dig. Dis. 19, 74–83. doi:10.1111/1751-2980.12576
Wang, Q., Wang, Y., Ding, J., Wang, C., Zhou, X., Gao, W., et al. (2020). A Bioorthogonal System Reveals Antitumour Immune Function of Pyroptosis. Nature 579, 421–426. doi:10.1038/s41586-020-2079-1
Wang, M., Chen, X., and Zhang, Y. (2021a). Biological Functions of Gasdermins in Cancer: From Molecular Mechanisms to Therapeutic Potential. Front. Cel Dev. Biol. 9, 189. doi:10.3389/fcell.2021.638710
Wang, M., Chen, X., and Zhang, Y. (2021b). Biological Functions of Gasdermins in Cancer: From Molecular Mechanisms to Therapeutic Potential. Front. Cel Dev. Biol. 9, 638710. doi:10.3389/fcell.2021.638710
Watabe, K., Ito, A., Asada, H., Endo, Y., Kobayashi, T., Nakamoto, K. i., et al. (2001). Structure, Expression and Chromosome Mapping ofMLZE, a Novel Gene Which Is Preferentially Expressed in Metastatic Melanoma Cells. Jpn. J. Cancer Res. 92, 140–151. doi:10.1111/j.1349-7006.2001.tb01076.x
Wei, J., Xu, Z., Chen, X., Wang, X., Zeng, S., Qian, L., et al. (2020). Overexpression of GSDMC Is a Prognostic Factor for Predicting a Poor Outcome in Lung Adenocarcinoma. Mol. Med. Rep. 21, 360–370. doi:10.3892/mmr.2019.10837
Wiggins, K. A., Parry, A. J., Cassidy, L. D., Humphry, M., Webster, S. J., Goodall, J. C., et al. (2019). IL‐1α Cleavage by Inflammatory Caspases of the Noncanonical Inflammasome Controls the Senescence‐associated Secretory Phenotype. Aging Cell 18, e12946. doi:10.1111/acel.12946
Yang, K., Wu, Z., Zhang, H., Zhang, N., Wu, W., Wang, Z., et al. (2022). Glioma Targeted Therapy: Insight into Future of Molecular Approaches. Mol. Cancer 21, 1–32. doi:10.1186/s12943-022-01513-z
Ye, Y., Dai, Q., and Qi, H. (2021). A Novel Defined Pyroptosis-Related Gene Signature for Predicting the Prognosis of Ovarian Cancer. Cel Death Discov. 7, 71. doi:10.1038/s41420-021-00451-x
Yoshihara, K., Shahmoradgoli, M., Martínez, E., Vegesna, R., Kim, H., Torres-Garcia, W., et al. (2013). Inferring Tumour Purity and Stromal and Immune Cell Admixture from Expression Data. Nat. Commun. 4, 2612. doi:10.1038/ncomms3612
Yu, P., Zhang, X., Liu, N., Tang, L., Peng, C., and Chen, X. (2021). Pyroptosis: Mechanisms and Diseases. Signal. Transduction Targeted Therapy 6, 1–21. doi:10.1038/s41392-021-00507-5
Yu, P., Wang, L. G., Han, Y., and He, Q. Y. (2012). ClusterProfiler: An R package for Comparing Biological Themes Among Gene Clusters. OMICS 16, 284–287.
Zeng, T., Cui, D., and Gao, L. (2015). Glioma: an Overview of Current Classifications, Characteristics, Molecular Biology and Target Therapies. Front. Biosci. (Landmark Ed. 20, 1104–1115. doi:10.2741/4362
Zhang, C.-C., Li, C.-G., Wang, Y.-F., Xu, L.-H., He, X.-H., Zeng, Q.-Z., et al. (2019). Chemotherapeutic Paclitaxel and Cisplatin Differentially Induce Pyroptosis in A549 Lung Cancer Cells via Caspase-3/GSDME Activation. Apoptosis 24, 312–325. doi:10.1007/s10495-019-01515-1
Zhang, Y., Wang, Q., Luo, N., Liu, J., Ren, H., and Shao, X. (2020a). MicroRNA-1269a Promotes Proliferation and Arrest of Apoptosis of Glioma Cells by Directly Targeting ATRX. Front. Oncol. 10, 563901. doi:10.3389/fonc.2020.563901
Zhang, Z., Zhang, Y., Xia, S., Kong, Q., Li, S., Liu, X., et al. (2020b). Gasdermin E Suppresses Tumour Growth by Activating Anti-tumour Immunity. Nature 579, 415–420. doi:10.1038/s41586-020-2071-9
Zhang, H., Chen, Z., Wang, Z., Dai, Z., Hu, Z., Zhang, X., et al. (2021a). Correlation between APOBEC3B Expression and Clinical Characterization in Lower-Grade Gliomas. Front. Oncol. 11, 370. doi:10.3389/fonc.2021.625838
Zhang, H., Dai, Z., Wu, W., Wang, Z., Zhang, N., Zhang, L., et al. (2021b). Regulatory Mechanisms of Immune Checkpoints PD-L1 and CTLA-4 in Cancer. J. Exp. Clin. Cancer Res. 40, 1–22. doi:10.1186/s13046-021-01987-7
Zhang, H., Wang, X., Wu, W., Wang, Z., Dai, Z., Hu, Z., et al. (2021c). TNFSF13 Is a Novel Onco-Inflammatory Marker and Correlates with Immune Infiltration in Gliomas. Front. Immunol. 12, 4004. doi:10.3389/fimmu.2021.713757
Zhang, Y., Wang, Q., Wang, Z., Zhang, C., Xu, X., and Xu, J. (2021d). Comprehensive Analysis of REST/NRSF Gene in Glioma and Its ceRNA Network Identification. Front. Med. (Lausanne) 8, 739624. doi:10.3389/fmed.2021.739624
Zheng, Y., Humphry, M., Maguire, J. J., Bennett, M. R., and Clarke, M. C. H. (2013). Intracellular Interleukin-1 Receptor 2 Binding Prevents Cleavage and Activity of Interleukin-1α, Controlling Necrosis-Induced Sterile Inflammation. Immunity 38, 285–295. doi:10.1016/j.immuni.2013.01.008
Zhibin Zhang, Z., Zhang, Y., and Lieberman, J. (2021). Lighting a Fire- Can We Harness Pyroptosis to Ignite Anti-tumor Immunity? Cancer Immunol. Res. 9, 2–7. doi:10.1158/2326-6066.cir-20-0525
Zhou, B., Zhang, J.-Y., Liu, X.-S., Chen, H.-Z., Ai, Y.-L., Cheng, K., et al. (2018). Tom20 Senses Iron-Activated ROS Signaling to Promote Melanoma Cell Pyroptosis. Cel Res 28, 1171–1185. doi:10.1038/s41422-018-0090-y
Keywords: pyroptosis, glioma, gene signature, prognosis, tumor microenvironment, immunity
Citation: Zhang Y, Zhang C, Yang Y, Wang G, Wang Z, Liu J, Zhang L and Yu Y (2022) Pyroptosis-Related Gene Signature Predicts Prognosis and Indicates Immune Microenvironment Infiltration in Glioma. Front. Cell Dev. Biol. 10:862493. doi: 10.3389/fcell.2022.862493
Received: 26 January 2022; Accepted: 04 April 2022;
Published: 25 April 2022.
Edited by:
Zhe-Sheng Chen, St. John’s University, United StatesReviewed by:
Yibo Fan, University of Texas MD Anderson Cancer Center, United StatesCopyright © 2022 Zhang, Zhang, Yang, Wang, Wang, Liu, Zhang and Yu. This is an open-access article distributed under the terms of the Creative Commons Attribution License (CC BY). The use, distribution or reproduction in other forums is permitted, provided the original author(s) and the copyright owner(s) are credited and that the original publication in this journal is cited, in accordance with accepted academic practice. No use, distribution or reproduction is permitted which does not comply with these terms.
*Correspondence: Yanbing Yu, eXV5YW5iaW5nMTIzQDEyNi5jb20=
†These authors have contributed equally to this work
Disclaimer: All claims expressed in this article are solely those of the authors and do not necessarily represent those of their affiliated organizations, or those of the publisher, the editors and the reviewers. Any product that may be evaluated in this article or claim that may be made by its manufacturer is not guaranteed or endorsed by the publisher.
Research integrity at Frontiers
Learn more about the work of our research integrity team to safeguard the quality of each article we publish.