
94% of researchers rate our articles as excellent or good
Learn more about the work of our research integrity team to safeguard the quality of each article we publish.
Find out more
ORIGINAL RESEARCH article
Front. Cell Dev. Biol., 19 May 2022
Sec. Cell Adhesion and Migration
Volume 10 - 2022 | https://doi.org/10.3389/fcell.2022.840066
This article is part of the Research TopicMechanobiology and the Microenvironment: Computational and Experimental ApproachesView all 8 articles
 Lowell T. Edgar1*
 Hyojin Park2
 Jessica R. Crawshaw3
 James M. Osborne3
 Anne Eichmann2,4,5
 Miguel O. Bernabeu1,6*
Angiogenesis occurs in distinct phases: initial spouting is followed by remodelling in which endothelial cells (ECs) composing blood vessels rearrange by migrating against the direction of flow. Abnormal remodelling can result in vascular malformation. Such is the case in mutation of the Alk1 receptor within the mouse retina which disrupts flow-migration coupling, creating mixed populations of ECs polarised with/against flow which aggregate into arteriovenous malformations (AVMs). The lack of live imaging options in vivo means that the collective EC dynamics that drive AVM and the consequences of mixed populations of polarity remain a mystery. Therefore, our goal is to present a novel agent-based model to provide theoretical insight into EC force transmission and collective dynamics during angiogenic remodelling. Force transmission between neighbouring agents consists of extrusive forces which maintain spacing and cohesive forces which maintain the collective. We performed migration simulations within uniformly polarised populations (against flow) and mixed polarity (with/against flow). Within uniformly polarised populations, extrusive forces stabilised the plexus by facilitating EC intercalation which ensures that cells remained evenly distributed. Excess cohesion disrupts intercalation, resulting in aggregations of cells and functional shunting. Excess cohesion between ECs prevents them from resolving diameter balances within the plexus, leading to prolonged flow reversals which exert a critical behaviour change within the system as they switch the direction of cell migration and traffic patterns at bifurcations. Introducing mixtures of cell polarity dramatically changed the role of extrusive forces within the system. At low extrusion, opposing ECs were able to move past each other; however, at high extrusion the pushing between cells resulted in migration speeds close to zero, forming traffic jams and disrupting migration. In our study, we produced vascular malformations and functional shunting with either excess cohesion between ECs or mixtures of cell polarity. At the centre of both these mechanisms are cell-cell adherens junctions, which are involved in flow sensing/polarity and must remodelling dynamically to allow rearrangements of cells during vascular patterning. Thus, our findings implicate junctional dysfunction as a new target in the treatment and prevention of vascular disease and AVMs.
Angiogenesis occurs in two distinct phases: an initial sprouting phase which establishes the primitive plexus, and a remodelling phase in which the vasculature rearranges based on signals received from blood flow. Although sprouting angiogenesis has been extensively studied for many years now, angiogenic remodelling has received much less attention in comparison. The primary driver of remodelling is endothelial cells (ECs) responding to shear stress along the lumen wall by polarising and migrating against the direction of flow, generally from regions of low shear to high (Franco et al., 2015; Georgieva et al., 2019). A vascular plexus can be considered as a stable coexistence of long low-shear distal pathways with shorter high-shear arteriovenous connections (Pries et al., 2010). Pries et al. and others have historically demonstrated that vascular adaptation and remodelling governed by shear stress alone creates “the shunt problem” in which cells prioritise short arteriovenous pathways at the expense of longer distal pathways, thereby shunting both cells and blood flow away from vital regions of tissue (Hacking et al., 1996; Pries et al., 1998; Pries et al., 2010; Edgar et al., 2021). Arteriovenous shunts (also referred to as arteriovenous malformations, or AVMs) can pathologically arise in numerous tissues including the liver (Copel et al., 2018), coronary circulation (Gatzoulis et al., 2018), lungs (Cartin-Ceba et al., 2013), and brain (Principles of Neurological Surgery, 2012), often with detrimental effects on health and mortality. In particular, AVMs in the brain are an important cause of haemorrhagic stroke, and surgical treatment options are invasive and limited (Derdeyn et al., 2017; Di Bartolomeo et al., 2021). The lack of arteriovenous shunts in healthy vasculature suggests there must be additional mechanisms beyond shear stress which regulate remodelling and prevent shunting, as originally proposed by (Pries et al., 2010). However, no unequivocal evidence of these mechanisms has been presented to date, and the exact mechanisms which promote or prevent shunt formation during vascular remodelling remain a mystery.
The activin receptor-like kinase 1 (Alk1) is an endothelial transmembrane receptor for ligands within the transforming growth factor- β (Tgfβ) superfamily and plays a crucial role in vascular development and disease (Roman and Hinck, 2017). Mutation in Alk1 results in a vascular disorder known as hereditary haemorrhagic telangiectasia (HHT, specifically HHT2 in the case of Alk1 mutation) in which patients are afflicted with AVMs throughout the body (Shovlin, 2010). It has recently been shown that induced deletion of Alk1 in capillary-venous ECs is sufficient to induce AVMs in the postnatal mouse retina (a common in vivo model of developmental angiogenesis) (Park et al., 2021). Interestingly, ECs in these Alk1 deficient mice appear to have lost proper flow-migration coupling and present as mixed populations of cells aligned either with or against blood flow. Although these AVM-producing mice present an exciting new platform for which to investigate the mechanisms governing AVM formation, the lack of live-imaging options in the postnatal mouse retina means we have little information on the collective dynamics of ECs during angiogenic remodelling, and even less on the full implications of mixed polarity populations during AVM formation. Therefore, our goal in this study is to present a novel agent-based model (ABM) for which we can supplement existing experimental efforts with theoretical insight into EC collective dynamics during angiogenic remodelling in both uniform and mixed polarity cell populations. With this model, we will demonstrate that the factors that control force transmission between individual migrating ECs exert powerful control over the remodelling outcome, capable of pushing the system from a stable vascular plexus towards formation of AVMs. Further, introducing mixed polarity populations (both ECs aligned with and against the flow) has a dramatic impact on collective migration and changes the very nature of force transmission between ECs in which factors that normally stabilise the plexus instead create traffic jams within the collective and promote vascular defects and malformation. Taken together, our findings demonstrate the crucial role of force transmission within the migrating endothelium as an important regulator of vascular development which can either prevent or promote AVM formation during angiogenic remodelling.
Induced deletion of Alk1 amongst capillary-venous ECs in Alk1f/f Mfsd2a CreERT2 mutant mice (hence referred to as Alk1 iKO) results in characteristic retinal AVMs (Figures 1A,B). Briefly, Alk1 was deleted at P4 and retinal vasculature was dissected out and fixed at P6. The endothelial lumen was fluorescently labelled via IB4 and EC nuclei via ERG. After confocal imaging, we skeletonised capillary plexuses labelled for IB4 in both Control and Alk1 iKO mice into a graph (i.e., collection of nodes and edges), and assigned each ERG labelled EC nuclei to the nearest vessel edge (with edge being defined as a portion of vessel between bifurcation points or end points). Raw image data and retinal wedge graphs for each Control and Alk1 iKO mouse can be found in Supplementary Figures S1, 2, respectively. We found that AVMs in Alk1 iKO mice consisted of a large number of cells aggregated along a single flow path, and an increase in the maximum number of cells amongst vessels compared to Control mice (Figure 1C). ECs within capillary plexuses of Control mice were also more evenly distributed compared to the wider distribution in Alk1 iKO mice, as seen via an increase in the variance in cell number amongst vessels (Figure 1D). Taken together, these results demonstrate that AVMs in Alk1 iKO mice consist of large aggregations of ECs and a skewed distribution of ECs relative to Controls. Measurements of Nucleus-to-Golgi polarity were taken relative to the direction of blood flow calculated by computational simulations. In Control mice, capillary ECs were found to be predominately polarized against the direction of blood flow (Figure 1E). However, capillary ECs in Alk1 iKO mice had a mixture of polarities with/against flow (Figure 1F). ECs within the AVMs consisted of a similar mixture of polarities with/against flow. These experimental findings pose two major questions that we will use as the basis for our study: 1) what changes in force transmission between migrating ECs cause cells to aggregate and distribute unevenly along a minority of flow pathways as seen in AVMs? And 2), what are the effects of introducing mixtures of cell polarity on EC collective dynamics and angiogenic remodelling? Due to insufficient means of live imaging EC dynamics and inference of forces transmitted between cells in the in vivo mouse retina, we aim to design a novel force-driven ABM of flow-migration coupling to elucidate and demonstrate the important role of force transmission between ECs during angiogenic remodelling and the creation of AVMs.
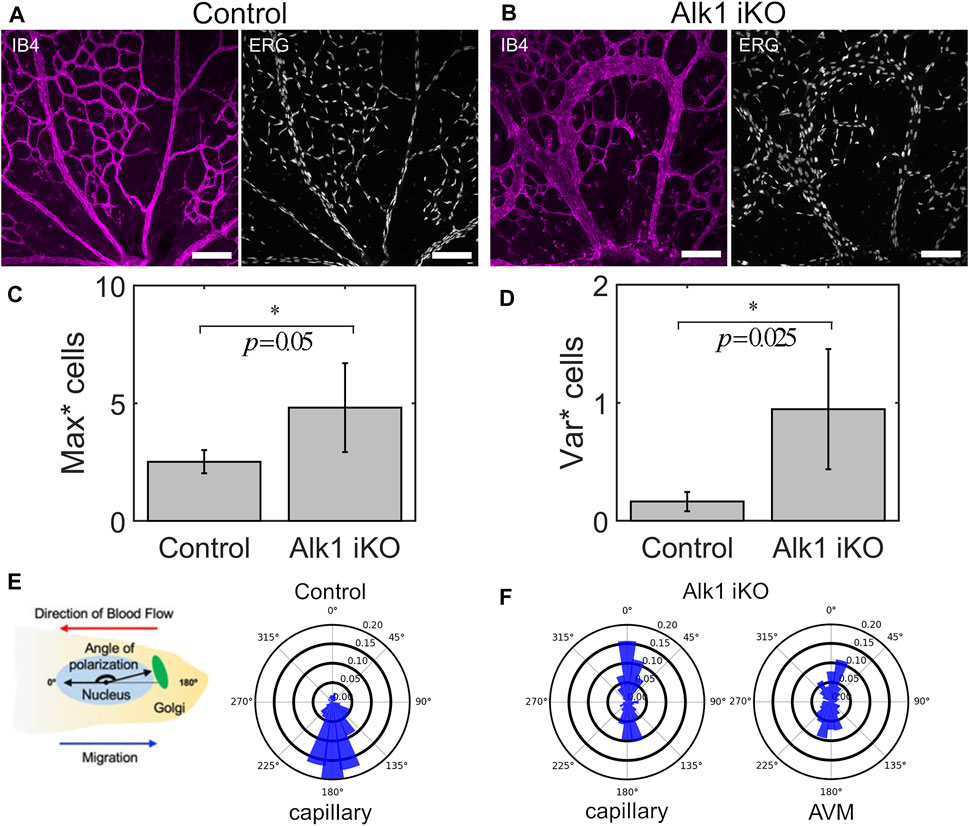
FIGURE 1. AVMs in Alk1 deficient mice consist of aggregates of ECs with mixed polarity with/against flow. (A) P6 retinal vasculature from Control mice show an even disruption of ECs throughout the capillary plexus through imaging of the endothelial lumen (IB4) and individual cell nuclei (ERG) (scale bar 100 μm). (B) Induced knockout of Alk1 signalling via tamoxifen injection at P4 in Alk1f/f Mfsd2a CreERT2 mice produces pronounced AVMs by P6. AVMs feature enlarged lumens consisting of aggregates of numerous cells. (C) By assigning cell nuclei to vessels, we find that the maximum number of cells amongst vessels is significantly higher in Alk1 deficient mice compared to Controls, demonstrating cell aggregation within AVMs. Statistical significance between measurements in Alk1 iKO plexuses vs. Control was assessed via Welch’s t-test (α = 0.05) (D) Similarly, the variance in cell number amongst vessels is significantly higher in Alk1 deficient mice compared to Controls, demonstrating the uneven distribution of cells with capillary plexuses featuring AVMs. (E) Nucleus-to-Golgi polarity was measured in individual ECs and expressed with respect to the direction of blood flow predicted via computational modelling. In Control mice, distributions of polarity angles show that cells within the capillary plexus are highly aligned against the direction of blood flow at P6. (F) In Alk1 deficient mice, we found mixed polarity with/against flow amongst cells within the capillary plexus. In particular, we found that AVMs consist of near 50/50 mix of polarity with/against flow.
ECs were represented as agents consisting of nested polarised ellipses. The inner ellipse of each agent represents the undeformed “stress-free” state of the cell. The outer ellipse, a scaling of the inner ellipse by a factor
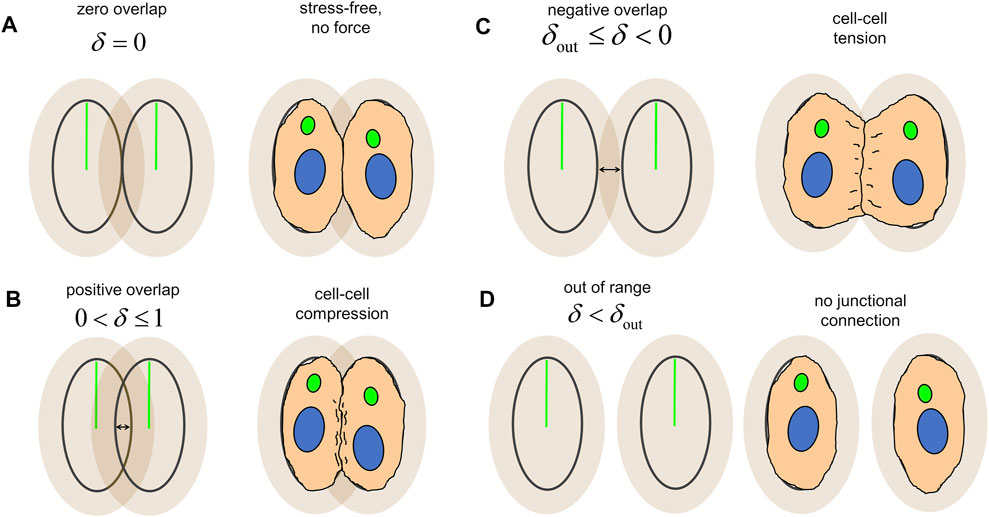
FIGURE 2. Overlap between agents, δ, produces force transmission and serves as an analogy for cellular mechanics. (A) Agents adjacent to each other at the boundary of the inner ellipse are in the “stress-free” configuration and transmit no force between one another. (B) Overlap of the inner ellipses produce an extrusive force which pushes the cells apart and represents cell-cell compression. (C) Overlap of the outer ellipses produces a cohesive force and which pulls the cells together and represents cell-cell tension. (D) Agents without overlap between their inner and outer ellipses are out of range from each other and transmit no force, indicating a lack of junctional connection between the two.
With our model, we present a novel coupling between blood flow and vascular structure via EC migration dynamics. Simulations were performed within an idealised capillary plexus domain with vessel edges of equal length arranged into a “honeycomb” pattern with characteristic length
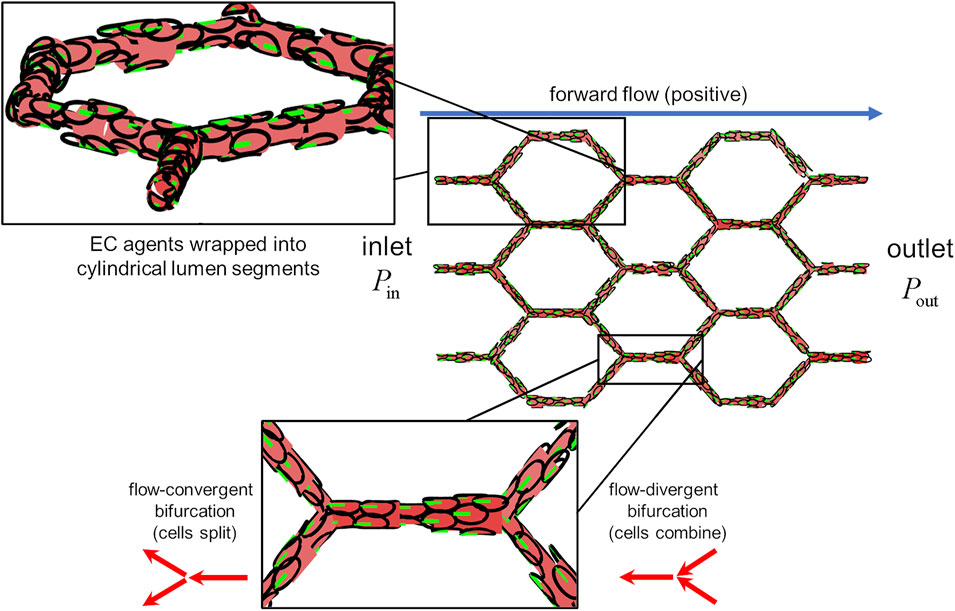
FIGURE 3. The idealised capillary plexus domain. Endothelial agents were confined to the surfaces of lumen segments, the diameter of which was determined by the number of occupant cells (upper inset). Pressure was prescribed at the inlet and outlet as to create forward flow (postive) along the +x direction. Cells align their polarity and migrate against the direction of flow (lower inset) At flow-covergent bifurcations, cells in the parent branch split evenly amongst the two child branches. At flow-divergent bifurcations, cells in the two child branches combine at the parent branch.
The first question we aim to answer in our study is: 1) what changes in force transmission between migrating ECs cause cells to aggregate and distribute unevenly along a minority of flow pathways as seen in AVMs? To answer our question, we will vary force transmission parameters and assess the impact on individual EC migration dynamics and the vascular plexus as a whole. In order to simplify our analysis, we will initially consider a uniformly polarised population of cells (against flow).
We found that EC migration dynamics were highly sensitive to force transmission between cells, even with each cell applying identical amounts of migratory force. In simulations without cohesive force (i.e.,
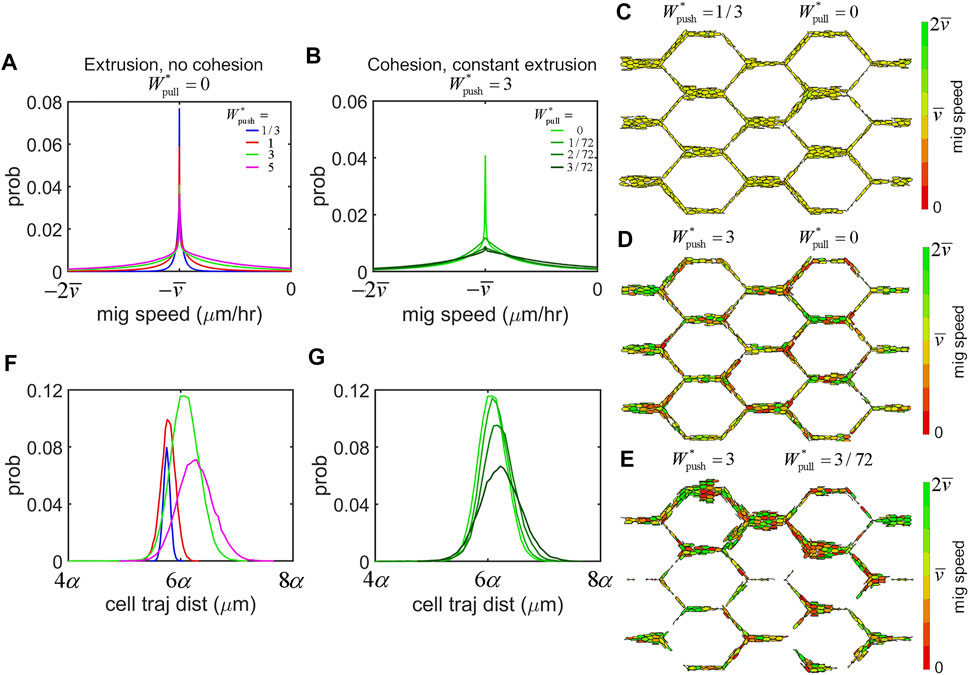
FIGURE 4. Force transmission regulates EC migration dynamics. (A) Histrogram of migration speeds amongst the cell population across all simulations were centred at the mean migration speed,
Our primary interest is to assess how force transmission between individual ECs influences the remodelling outcome as it emerges within the vascular network as a whole. In our study, we found that we could push our system from stable perfusion to shunt formation via control of a single parameter: the amount of cohesion within the system,
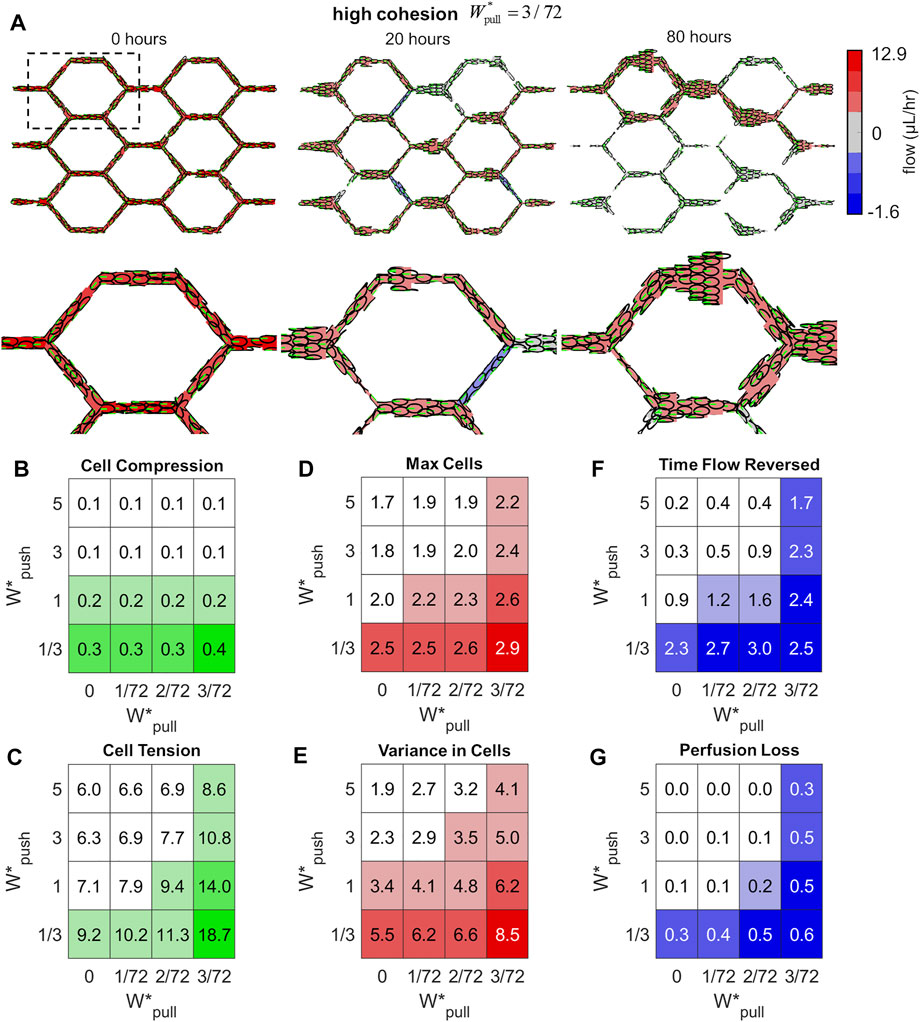
FIGURE 5. Excess cohesion promotes shunt formation. (A) Snapshots from an example simulation at high cohesion (
We defined six network-level features in order to characterise the state of the vascular network and the emergence of functional shunting during remodelling. We measured the mean Cell Compression (CC) and mean Cell Tension (CT) amongst the cell population (indicated by positive and negative overlap between agents) to assess levels of stress carried within the endothelium tissue. The idealised capillary plexus initially has cells evenly distributed throughout the plexus; any loss of this even distribution will be indicated by measurements of the Max number of Cells amongst vessels (MC) which increases if any particular vessels is growing larger than average, and the Variance in Cell number amongst vessels (VC) which increases if the distribution of cells within the plexus becomes uneven. Lastly, we calculated two features to indicate flow disruption during remodelling: changes in flow direction are indicated by the time vessels spent in Flow Reversed (FR), and Perfusion Loss was calculated as the percentage of flow pathways in which flow dropped to zero (PL). Definitions of each of these features can be found in the Methods section. In general, we found that all of our features were strongly associated with shunt formation and tended to decrease as we added extrusion to the system and increase as we added cohesion. When cells generated strong extrusive forces, they were able to effectively intercalate to reduce stress within the tissue more effectively as seen in decreased levels of Cell Compression (Figure 5B) and Cell Tension (Figure 5C); increased cohesive forces interferred with this intercalation and produced greater levels of tension between cells.
Extrusion and cohesion dramatically impacted the distribution of cells throughout the plexus during remodelling as well. Increased levels of extrusion prevented vessels from growing too large, as seen in decreased values of Max Cells (Figure 5D), and ensured that cells remained evenly distributed throughout the plexus, as seen in reduced Variance in Cells (Figure 5E). Conversely, increased cohesion produced large aggregates of cells and skewed the distribution within the plexus, as seen in increased values of Max Cells and Variance in Cells amongst vessels. Excess cohesion tended to disrupt flow and perfusion during remodelling whilst extrusion stabilised. Vessels in simulations with high cohesion experienced more prolonged episodes of flow disruption, as seen in increased Time vessel spent with Flow Reversed (Figure 5F); simulations with high extrusion experienced some flow reversal and loss but these events were short-lived in comparison. Lastly, the percentage of flow pathways which lost flow during remodelling dramatically increased with cohesion, as seen in increased Perfusion Loss (Figure 5G), whilst perfusion was stabilised with increased extrusion.
We used Pearson’s correlation coefficient to assess the overall relationship between our network-level features of shunt formation with various parameters within the model. In general, features of shunt formation were negatively correlated with
There were several additional parameters which had no impact on shunt formation within our model. The total amount of iterations spent in the intercalation scheme (needed to resolve quasi-static equalibirum amongst the cells after each migration step) tended to increase with both extrusion and cohesion; however, the Total Intercalation Iterations had no impact on shunt formation (Supplementary Figure S6). Lastly, changes in the damping coefficient in the dynamic model,
One of the most striking observations in simulations of shunt formation was the presence of prolonged flow reversals within remodelling plexuses. Flow reversals occur as changes in vessel diameter modulate the paths of least resistance. Analysis of our honeycomb plexus model via computational fluid dynamics indicate that reduction of lumen area greater than 40% relative to neighbours was sufficient to create flow reversals (Figure 6A). Additionally, we observed pronounced fluid rotation and the formation of lid driven cavity vortices during flow reversals, suggesting significant flow disruption and potentially complex shear signalling to luminal ECs (Figures 6B,C). Notably, we found flow reversals only occurred in conjunction with vessel contraction; vessel expansion did not impose flow reversals, indicating that luminal collapse is the key driver of flow reversals within the plexus during remodelling.
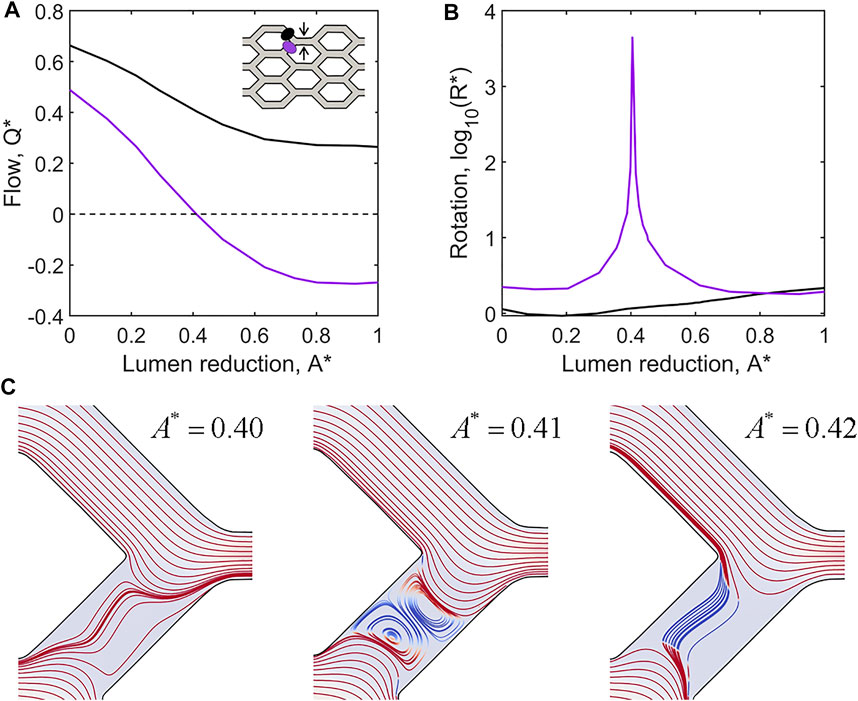
FIGURE 6. Flow reversals and rotation occur in adjacent vessels as a result of lumen reduction. (A) CFD simulations of flow within the idealised capillary plexus subject to a full collapse of the upper middle vessel pathway (as indicated by black arrows in the inset diagram). Normalised flow
Flow-mediated remodelling is driven by ECs migrating against the direction of flow. Thus, flow reversals can exert powerful control over the remodelling outcome as they impose changes on migration direction. Most importantly, flow reversals switch flow-convergent bifurcations, where EC migration paths diverge, to flow-divergent bifurcations where EC migration paths combine. Flow reversal events occurred in all our simulations as EC migration reduced lumen diameter at various locations within the plexus. Extrusive forces allow ECs to intercalate and restore lumen diameter, resolving flow reversals quickly. However, high levels of cohesion prevent ECs from intercalating as effectively and allow flow reversals to persist long enough to have drastic consequences on migration patterns at bifurcations (Figure 7). Prolonged flow reversals cause splitting ECs to instead combine, and in conjunction with high cohesion results in ECs clustering together into large aggregates along a minority of flow pathways, depleting ECs and thus perfusion from the rest of the plexus (i.e., functional shunting).
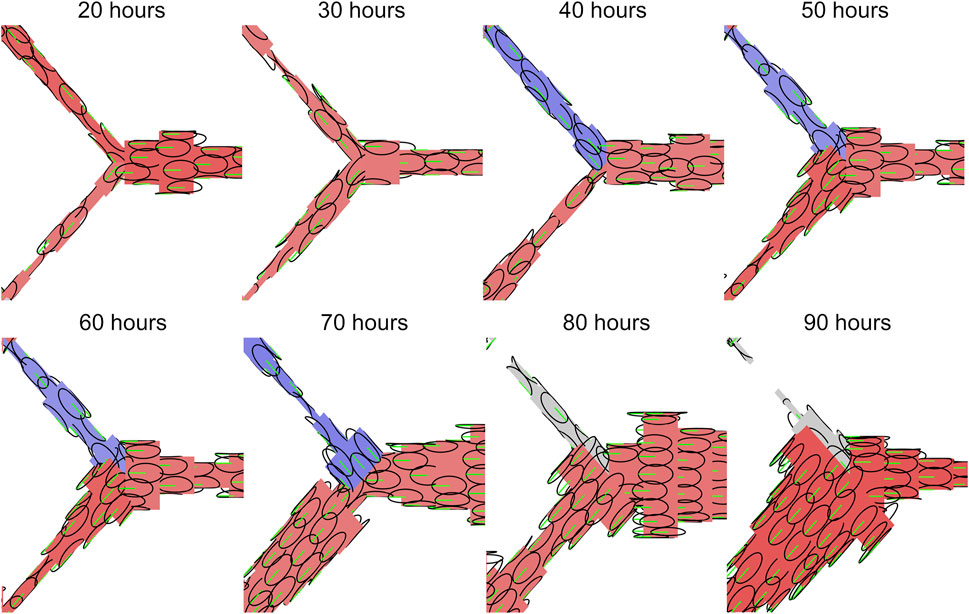
FIGURE 7. Flow reversals switch EC migration paths at vessel bifurcations. Inner ellipse of individual EC agents shown in black, polarisation and migration direction shown in green. Vessels with forward flow are displayed in red, reversed flow in blue, and no flow in grey. Flow reversals switch flow-convergent bifurcations, where EC migration paths split, to flow-divergent bifurcations where EC migration paths combine. Prolonged flow reversals gives ECs enough time to aggregate along a minority of flow paths, depleting both cells and flow from other regions of the plexus resulting the functional shunting.
One of the most profound observations upon Alk1 deletion in the postnatal mouse retina model was a switch in capillary cells from polarisation against the direction of blood flow to a mixture of polarisation with/against flow. Therefore, the second question we set out to answer in our study was: 2) what are the effects of introducing mixtures of cell polarity on EC collective dynamics and angiogenic remodelling? We created four different mixed populations of cells by randomly assigning cells to either migrate “with flow” or “against flow” at the following ratios: 0/100 (i.e., uniformly polarised against flow), 10/90, 25/75, and 50/50. We found that inserting opposingly polarised cells into the collective dramatically impacted migration dynamics and vascular morphology, even at relatively small percentages. Opposingly polarised cells tended to create “traffic jams” during migration as cells had difficulty moving past each other (Figure 8A). This difficulty seemed to increase with extrusion. While extrusion was a stabilising force during migration of uniformly polarised cells by allowing ECs to intercalate more effectively and resolve vascular malformations, in the presence of opposing polarisation extrusion had the oppose effect: instead of stabilising, extrusion tended to destabilise. At low levels of extrusion (
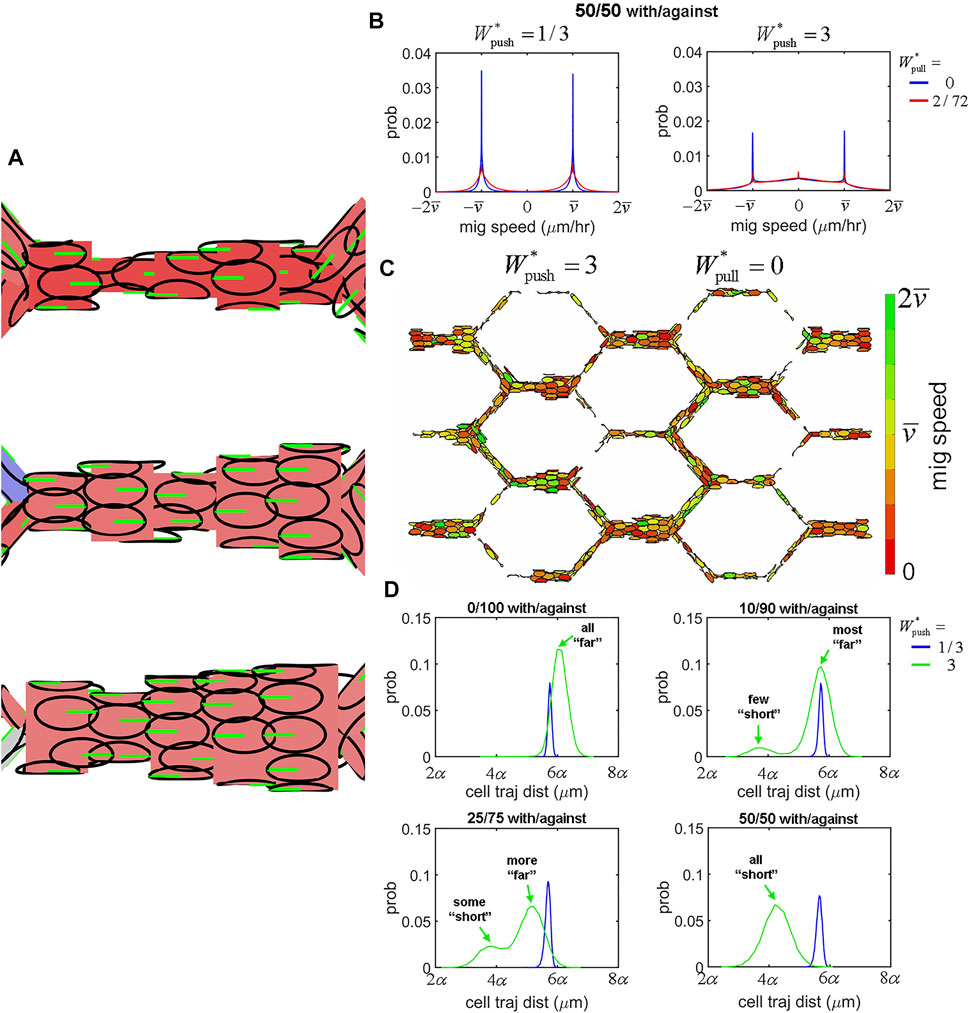
FIGURE 8. EC migration dynamics within mixed polarity populations. (A) Seeding simulations with a mixture of cells polarised either with or against flow led to difficulty for cells with opposing polarity to move past each other during migration. (B) Opposing polarisation created interference in migration at increased levels of extrusion. At low extrusion (
It would seem that the role of extrusive forces is completely changed within mixed polarity populations of cells. Extrusion, whilst normally decreasing and stabilising most of our network-level features of shunt formation, now instead increased them dramatically: Cell Tension, Max Cells, Variance in Cells, and Perfusion Loss all increased significantly with extrusion within mixed polarity populations (Supplementary Figure S9). While extrusion was negatively correlated with shunt formation in uniform polarity populations, in mixed polarity populations extrusion was instead positively correlated with shunt formation, with increasing amounts of positive correlation as the ratio of opposingly polarised cells increased (Supplementary Figure S10 top row). Cohesion remained positively correlated with shunt formation within mixed polarity populations, although it is role seems to be dramatically reduced in these cases (Supplementary Figure S10 bottom row). Lastly, we found a strong correlation between all our features in our simulations within uniform polarity populations, with special note of a strong correlation between Flow Reversals and Perfusion Loss indicating a mechanistic role for changes in flow direction in functional shunting. However, in the presence of mixed polarity populations this correlation between Flow Reversals and Perfusion Loss vanished by increasing amounts as the ratio of opposingly polarised cells increased (Supplementary Figure S11). These last findings suggest that flow reversals are not the primary mechanism for vascular malformation and instability in mixed polarity populations; instead, we believe extrusive forces in the presence of opposingly polarised cells to be the cause in these cases. In the altered case of mixed polarity amongst the cell population, such as the case found in Alk1 deletion in the mouse retina model, the once stabilising presence of cell extrusion is turned on its head and instead becomes an adversary to vascular stability and function.
With our novel computational approach, we have demonstrated the role of force transmission in the cellular mechanics driving collective migration during angiogenic remodelling and shunt formation. The parameter
All of these aspects of shunt formation were captured in aggregate behaviour of our six network-level features during parameter sensitivity analysis. In general we found that high cohesion tended to have a more disruptive effect at lower levels of extrusion, indicating that extrusive forces can work to balance out the effects of high cohesion to a certain degree. However, correlation analysis revealed a weakened role of extrusion in the face of high cohesion, indicating that extrusive forces can only do so much to counteract these effects. Interestingly, we found the highest values of our shunt features in simulations at low extrusion (
Overexpression of integrins β1, α5, and αv is a feature within AVMs in Alk1 deficient mice (Park et al., 2021). In fact, inhibition of integrins αvβ3, αvβ5, and α5β1 upon induced knockdown of Alk1 reduced AVM formation (Park et al., 2021), indicating that integrin activity plays a role in AVM formation. In our model, we produced functional shunts resembling AVMs with either excess cohesion between ECs or mixtures of cell polarity. At the centre of both these mechanisms are cell-cell adhesions, which are involved in flow sensing/polarity and must remodel dynamically to allow rearrangements of cells during vascular patterning (that is, ECs must hold each other but not too tightly (Szymborska and Gerhardt, 2018)). At first, it might not be immediately clear how the experimental observation of integrin overexpression in AVMs connect with our demonstrated role of cell-cell adhesions. However, there is an ever-increasing collection of evidence suggesting a strong linkage between cell-cell adhesion, integrin binding, and polarity in endothelial flow-migration coupling. Junctional complexes are involved in shear stress mechanosensing (Szymborska and Gerhardt, 2018), and EC polarity and orientation are regulated by VEGF signalling which also plays a role in adherens junction remodelling in the presence of shear stress (Vion et al., 2021). Nuclear-Golgi polarity is also dependent on integrin binding to ECM proteins and Cdc42 signalling (Etienne-Manneville and Hall, 2001; Tzima et al., 2003; Zovein et al., 2010). Vinculin is an important regulator of integrin-adherens crosstalk which also controls junction dynamics and EC collective behaviour, and disruption of which induces vascular malformations during angiogenesis (Mui et al., 2016; Carvalho et al., 2019; Kotini et al., 2021). Integrins β1, β3, and β5 are required for of EC barrier function (Su et al., 2012; Pulous and Petrich, 2019), which is regulated by adherens junctions between cells. Absence of αvβ3, αvβ5, and α5β1 all resulted in a loss of barrier function and integrity of ECs (Pulous and Petrich, 2019). Additionally, integrins αvβ3 and α5β1 have been found localised at cell-cell contacts (Lampugnani et al., 1991; Su et al., 2012). If an absence of these integrins results in a loss of EC cohesion, than overexpression of these integrins in Alk1 mutant ECs could result in excessive EC cohesion. Furthermore, integrins are potent regulators of YAP/TAZ (Dupont, 2016), which in turn regulate the morphology and turnover of adherens junctions (Neto et al., 2018). Alk1 deletion in ECs results in increased expression and nuclear localisation of YAP/TAZ, with high expression of YAP/TAZ as well as integrins β1, α5, and αv within AVMs (Park et al., 2021). Together, this evidence along with our modelling results suggests that induced deletion of Alk1 signalling in mutant mice results in dysfunctional cohesion between ECs in an integrin- and YAP/TAZ-dependent manner which can result in AVMs similar to the functional shunts produced in our computational model at high values of
The complement of EC cohesion are extrusive forces, scaled in our model by the parameter
Our mathematical methodology provides a novel and useful new platform for the study of endothelial tissue mechanics in flow-mediated collective migration within a multiscale perspective. In these methods, we prescribe behaviour at the cellular microscale (i.e., parameters regulating force transmission between individual ECs) and observe the emergent remodelling outcome at the tissue macroscale (i.e., the vascular plexus as a whole). Although our model of cellular mechanics via overlapping ellipses is relatively simplistic, it is capable of producing complex biomechanical constitutive behaviour at the level of the tissue continuum. The tissue constitutive model can be considered as a spatially heterogeneous material with strain energy derived from overlap between EC agents. This material exhibits tension-compression nonlinearity via the moduli
However, the work we present here still relies on simplifying assumptions necessary to make the parameter space tractable, and there are many important traits of the physical system that have yet to be considered but may prove useful additions in the future. We modelled blood as a Newtonian fluid and Poiseuille flow, but in reality blood exhibits many important attributes of non-Newtonian fluids. Specifically, the inclusion of erythrocytes within our network haemodynamics may be crucial next step, as we have previously identified an important association between erythrocyte dynamics and vascular remodelling due to plasma skimming effects (Zhou et al., 2021). Our current model also included a simplistic representation of EC flow-migration coupling as well, with agents migration governed by
In summary, we have demonstrated the important role of force transmission at cell-cell adhesions regulating flow-mediated EC collective migration during angiogenic remodelling. Excessive cohesion between migrating ECs led to aggregation and functional shunting, caused by prolonged flow reversals which change traffic patterns at vessel bifurcations. Mixed polarity within the EC population changed the nature of force transmission, with extrusion forces which normally stabilised the vasculature because a destabilising force, preventing effective migration as opposingly polarised ECs met resistance when trying to migrate past one another. Our unique computational framework provides novel insight into the collective dynamics of ECs during angiogenic remodelling not available within the confines of current in vivo experimental techniques, and should provide a useful platform for future studies in uncovering the mechanisms which may be used to prevent and treat AVMs.
We induced AVMs in mouse retinas of Mfsd2a CreERT2 mice (kindly provided by Dr Bin Zhou at University of Chinese Academy of Sciences) by induced deletion of Activin receptor-like kinase 1 (Alk1) using Alk1f/f mice (kindly provided by Dr Paul Oh at Barrow Neurological Institute). All animal experiments were performed under a protocol approved by Institutional Animal Care Use Committee of Yale University. Gene deletion was induced by intra-gastric injections with 100 μg tamoxifen (Tx, Sigma, T5648; 2.5 mg/ml) into pups at P4 (experiments hence referred to as Alk1 iKO). Tx-injected CreERT2 negative littermates were used as controls (experiments hence referred to as Controls).
Immunostaining was performing using: IB4 (IsolectinB4 10 #121412, 10 μg/ml; Life Technologies), ERG-Alexa fluor 647 (Abcam, ab196149, 1:500), GOLPH4 (#ab28049, 1:400; abcam) and DAPI (#D1306, 1:1,000; Life Technologies). The eyes of P6 pups were prefixed in 4% PFA for 8 min at room temperature. Retinas were dissected, blocked for 30 min at room temperature in blocking buffer (1% fetal bovine serum, 3% BSA, 0.5% Triton X-100, 0.01% Na deoxycholate, 0.02% sodium azide in PBS at pH 7.4) and then incubated with specific antibodies in blocking buffer overnight at 4 C. The next day, retinas were washed and incubated with IB4 and/or ERG (or DAPI) together with the corresponding secondary antibody overnight at 4 C, then washed and post-fixed with 1% PFA and mounted in fluorescent mounting medium (DAKO, USA). High-resolution pictures were acquired using Leica SP8 confocal microscope with a Leica spectral detection system (Leica TCS SP8 detector), and the Leica application suite advanced fluorescence software. After segmenting each channel corresponding to the Golgi and nuclear staining, the centroid of each organelle was determined and a vector connecting the centre of the nucleus to the centre of its corresponding Golgi apparatus was drawn. The Golgi-nucleus assignment was done automatically minimizing the distance between all the possible couples. The polarity of each cell was defined as the angle between the vector and the scratch line. An angular histogram showing the angle distribution was then generated. Circular statistics were performed using a cell polarization toolbox (https://github.com/batho2n/ec_polarization).
To measure the distribution of ECs within each experiments, we created graphs representing the vascular plexus in each experiment by skeletonising images of IB4 staining via the software tool PolNet using methods previously described (Bernabeu et al., 2018). Images were prepared and processed using Fiji (Schindelin et al., 2012), GIMP (GNU Image Manipulation Program, 2.10.12), and MATLAB (MathWorks, R2020a). Graphs were simplified to only include edges which formed an angle greater than 30°, and the capillary plexus was manually segmented out from the arteries and veins. Nuclei positions were calculated by binarizing images of Erg staining. Each nuclei was assigned to a vessel edge based on the minimum distance from the centroid to edge midpoints, yielding a dataset of cell number amongst vessel edges for each experiment. We then calculated the max cell number and variance in cell number amongst vessel edges and normalised by the mean cell number for each experiment, providing measures that were comparable to the features MC and VC in the computational data (see feature definition below). We also measured the mean edge length and total number of cells in each experiment. Statistical significance between measurements in Alk1 iKO plexuses vs. Control was assessed via Welch’s t-test (α = 0.05). Five capillary plexuses were obtained for each phenotype, and raw image data used in each can be found in Supplementary Figure S1 for the Control experiments and Supplementary Figure S2 for the Alk1 iKO experiments.
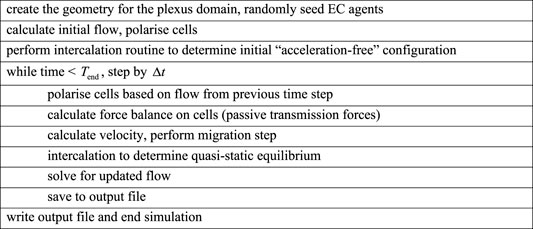
Our simulations were performed within an idealised capillary bed constructed of vessels assembled into a “honeycomb” pattern, each with equal length (α) and bifurcating at right angles. Each vessel was discretised into cylindrical segments representing the vessel lumen, the surfaces of which were seeded with an initial number of EC agents (
The simulations in this study were performed within an 3 × 3 honeycomb plexus with vessel length α = 50 μm, each discretised into five luminal segments initially seeded with
Vessel lumens are filled with a pressurised fluid (blood), with pressure
with μ an estimate of the dynamic viscosity of blood. Flow
We assigned a conservation of mass equation to each node depending on the node degree. For degree two nodes connecting segments J and K,
For degree three nodes connecting segments J, K, and L,
The final system of equations can be arranged into matrix-vector notation as
where
We simulated the endothelium as overlapping ellipses confined to the cylindrical surfaces of luminal segments. Our methods are an updated version of the overlapping spheres method previously used to model tissue mechanics (Pathmanathan et al., 2009) combined with our previous agent-based model of flow-mediated migration (Edgar et al., 2021). Agents representing ECs consisted of nested ellipses: one inner and one outer. The inner ellipse (semi-major axis A, semi-minor axis B) represents the undeformed “stress-free” configuration of the cell. The outer ellipse (semi-major axis
Fields associated with an agent are indicated by a lowercase subindex, e.g., i. The location of each EC agent (residing within luminal segment J with length
The circumferential component can also be expressed as the circumferential angle,
EC agents are also polarised and align their major axis along a polarity vector,
EC agents transmit force to one another depending on the overlap of adjacent ellipses. The overlap between cell i and neighbouring cell j,
and requires consideration of periodicity in circumferential position. Details on how we calculate the distance vector between two cells,
Supplementary Figure S12 provides a schematic of how overlap is calculated between two EC agents. The angles of intersection were defined as the angle formed between
Similarly, the inner radius of intersection for cell j are defined as
Finally, the overlap of the inner ellipses is calculated as
We also define
The force transmitted between cells,
If the inner ellipses of the agents overlap (
The parameters regulating force transmission (
which scales linearly with respect to the extrusion parameter
The amount of work required for a cell to migrate an arbitrary distance X is
If we choose
Note that the work required to break apart cell cohesion scales linearly with respect to the cohesion parameter
We implemented an overdamped dynamic model of migration to calculate the migration velocity of each EC agent,
with damping parameter
In all our simulations,
If the longitudinal component z of the new position exceeds the bounds (i.e.,
As agents move to new segments, thy may do so in a way that creates new overlap with current residents, creating spikes in velocity. In order to enforce our assumption of quasi-static equilibrium, we allow the cells to passively intercalate to an “acceleration-free” configuration after each migration step. This involves iteratively displacing the cells based on passive transmission forces only until the set of velocities amongst all cells,
and the system is deemed converged when the L2 norm of the velocity difference drops below a tolerance parameter
Information of the parameters used in our study in Table 1.

TABLE 1. Description of parameters and prescribed values.
We calculated several network-level features indicating the status of the vascular plexus to indicate the emergence of shunts during remodelling. These shunt features are based on summary statistics extracted from the set of all vessels, the set of all cells, or the set of all time points. For the sake of simplicity, the features will be defined algorithmically within this section.
The first set of features indicate the overall level of stress stored within the endothelial tissue by measuring overlap amongst the EC agents:
• Mean Cell Compression (CC)—each cell stores the sum of all negative overlap it experiences at each time point; take the mean amongst all cells for every time point; take the time-averaged across all points in time.
• Mean Cell Tension (CT)—each cell stores the sum of all positive overlap it experiences at each time point; take the mean amongst all cells for every time point; take the time-averaged across all points in time.
The next set of features indicate cell aggregation within the plexus. These features will be low if the cells remain evenly distributed throughout the plexus, and will increase if the distribution becomes skewed:
• Max Cells amongst vessels (MC)—take the max number of cells amongst all vessels (i.e., size of the largest vessel) at each time point; take the time-averaged value across time; divide by mean number of cells amongst vessels.
• Variance in Cells amongst vessels (VC)—take the variance in cell number across all vessels; take the time-averaged value across time; divide by the mean number of cells amongst vessels.
Note that with these features, the mean number of cells amongst vessels always equals
The last set of features indicate the level of flow disruption occurring during remodelling. These features either measure the amount of time vessels experience with disturbed flow (either flow reversal or flow loss), and the amount of perfusion loss within the plexus. Perfusion loss was calculated as the percentage of all possible flow paths (34 flow paths in total for the 3 × 3 honeycomb plexus) in which flow dropped to zero at some point along the path:
• Time Flow Reversed (FR)—amongst all vessels, if flow in a vessel is negative when it was positive in the previous time step, add
• Perfusion Loss (PL)—for each time point, calculate the percentage of flow paths with flow loss; take the time-average across time points.
We ran our model with 50 different random seed numbers (randomising the initial position of agents each time) at various parameter values (
We simulated the collapse of a single vessel within an ideal 3D honeycomb (3 × 3) vascular plexus (hence referred to as Vessel A, indicated by black arrows in the inset of Figure 6A) to inspect fluid behaviour upon flow reversals and determine the amount of lumen reduction required to generate a flow reversal.
Fluid domain meshes discretising the ideal vascular networks were generated using the Vascular Modelling Toolkit in Python (VMTK http://www.vmtk.org/) (Izzo et al., 2018), via the following steps: 1) First we constructed a 2D honeycomb network of nodes with the assigned vessel radius defined at each node. The radius of an open vessel (a fully patent vessel) was
We used the HemeLB software (Mazzeo and Coveney, 2008) to simulate blood flow through each network in the sequence of static meshes, allowing us to examine the dynamic changes in the fluid flow as Vessel A collapsed. HemeLB is a high-performance lattice-Boltzmann solver developed to simulate blood flow through complex static 3D vascular geometries. The lattice-Boltzmann method is built on microscopic models and discretised mesoscopic kinetic equations to recreate the dynamics of incompressible fluid flow on a regular lattice. The fluid density is calculated at each discrete point in the lattice, and update through a statistical streaming and collision process at discrete time steps with discrete velocities (Krüger et al., 2017).
We used a D3Q15 lattice, the Bhatnagar-Gross-Krook collision operator (see e.g., (Succi, 2001) for details) and the simple bound-back boundary condition. To avoid successive simulations using the same number of voxels across Vessel A, we needed to ensure the voxel size was less than the radial decrease in Vessel A between successive networks. As such, we discretised each network using a voxel size of
The radius of Vessel A was reduced in intervals of
All software and analysis tools were written in Python 3.6.8 and MATLAB R2020a. Source code (including the random seed numbers used to generate the data in this study) is available on Github at: https://github.com/ltedgar-ed/ABM_flow_migrate_angio_v2_overlapping_ellipses_release.
The animal study was reviewed and approved by the Institutional Animal Care Use Committee of Yale University.
LE designed the computational model, analysed the experimental data, primary author of manuscript. HP carried out the mouse retina experiments, analysed the experimental data. AE supervised the experiments, advised during the writing .JC performed the CFD simulations, JO supervised and advised. MB supervised the development of the computational model, advised during the writing.
This work was produced as part of the Foundation Leducq Transatlantic Network of Excellence (17 CVD 03, https://www.mdc-berlin.de/leducq-attract). JC is supported by an Australian Government Research Training Program (RTP) Scholarship. MB is supported by grants from the Engineering and Physical Sciences Research Council (EPSRC) (EP/R029598/1, EP/T008806/1), Fondation Leducq (17 CVD 03), the European Union’s Horizon 2020 research and innovation programme under grant agreement No 801423, Diabetes United Kingdom (20/0006221), Fight for Sight (5137/5138), and British Heart Foundation and The Alan Turing Institute (which receives core funding under the EPSRC grant EP/N510129/1) as part of the Cardiovascular Data Science Awards Round 2 (SP/19/9/34812).
The authors declare that the research was conducted in the absence of any commercial or financial relationships that could be construed as a potential conflict of interest.
All claims expressed in this article are solely those of the authors and do not necessarily represent those of their affiliated organizations, or those of the publisher, the editors and the reviewers. Any product that may be evaluated in this article, or claim that may be made by its manufacturer, is not guaranteed or endorsed by the publisher.
Lastly, LE would like to thank and acknowledge the help of Ylenia Giarratano for providing code to process graph data and Romain Enjalbert for the suggestion of quantifying perfusion loss by measuring flow loss along all possible flow paths within the network.
The Supplementary Material for this article can be found online at: https://www.frontiersin.org/articles/10.3389/fcell.2022.840066/full#supplementary-material
Aranjuez, G., Burtscher, A., Sawant, K., Majumder, P., and McDonald, J. A. (2016). Dynamic Myosin Activation Promotes Collective Morphology and Migration by Locally Balancing Oppositional Forces from Surrounding Tissue. MBoC 27, 1898–1910. doi:10.1091/mbc.e15-10-0744
Ayachit, U. (2015). “The ParaView Guide: Updated for ParaView Version 4.3. Full Color Version,”. Editor L. Avila Clifton (Park, NY: Kitware Inc).
Baeyens, N., and Schwartz, M. A. (2016). Biomechanics of Vascular Mechanosensation and Remodeling. MBoC 27, 7–11. doi:10.1091/mbc.E14-11-1522
Bentley, K., Franco, C. A., Philippides, A., Blanco, R., Dierkes, M., Gebala, V., et al. (2014). The Role of Differential VE-Cadherin Dynamics in Cell Rearrangement during Angiogenesis. Nat. Cell Biol 16, 309–321. doi:10.1038/ncb2926
Bernabeu, M. O., Jones, M. L., Nash, R. W., Pezzarossa, A., Coveney, P. V., Gerhardt, H., et al. (2018). PolNet: A Tool to Quantify Network-Level Cell Polarity and Blood Flow in Vascular Remodeling. Biophysical J. 114, 2052–2058. doi:10.1016/j.bpj.2018.03.032
Bernabeu, M. O., Jones, M. L., Nielsen, J. H., Krüger, T., Nash, R. W., Groen, D., et al. (2014). Computer Simulations Reveal Complex Distribution of Haemodynamic Forces in a Mouse Retina Model of Angiogenesis. J. R. Soc. Interf. 11, 20140543. doi:10.1098/rsif.2014.0543
Cartin-Ceba, R., Swanson, K. L., and Krowka, M. J. (2013). Pulmonary Arteriovenous Malformations. Chest 144, 1033–1044. doi:10.1378/chest.12-0924
Carvalho, J. R., Fortunato, I. C., Fonseca, C. G., Pezzarossa, A., Barbacena, P., Dominguez-Cejudo, M. A., et al. (2019). Non-canonical Wnt Signaling Regulates Junctional Mechanocoupling during Angiogenic Collective Cell Migration. eLife 8, e45853. doi:10.7554/eLife.45853
Copel, J. A., D’Alton, M. E., Feltovich, H., Gratacós, E., Krakow, D., Odibo, A. O., et al. (2018). Obstetric Imaging: Fetal Diagnosis and Care. Philadelphia: Elsevier.
Derdeyn, C. P., Zipfel, G. J., Albuquerque, F. C., Cooke, D. L., Feldmann, E., Sheehan, J. P., et al. (2017). Management of Brain Arteriovenous Malformations: A Scientific Statement for Healthcare Professionals from the American Heart Association/American Stroke Association. Stroke 48, e200. doi:10.1161/STR.0000000000000134
Di Bartolomeo, A., Scafa, A. K., Giugliano, M., Dugoni, D. E., Ruggeri, A. G., and Delfini, R. (2021). Ruptured Brain Arteriovenous Malformations: Surgical Timing and Outcomes—A Retrospective Study of 25 Cases. J. Neurosci. Rural Pract. 12, 004–011. doi:10.1055/s-0040-1716792
Dupont, S. (2016). Role of YAP/TAZ in Cell-Matrix Adhesion-Mediated Signalling and Mechanotransduction. Exp. Cell Res. 343, 42–53. doi:10.1016/j.yexcr.2015.10.034
Edgar, L. T., Franco, C. A., Gerhardt, H., and Bernabeu, M. O. (2021). On the Preservation of Vessel Bifurcations during Flow-Mediated Angiogenic Remodelling. Plos Comput. Biol. 17, e1007715. doi:10.1371/journal.pcbi.1007715
Etienne-Manneville, S., and Hall, A. (2001). Integrin-Mediated Activation of Cdc42 Controls Cell Polarity in Migrating Astrocytes through PKCζ. Cell 106, 489–498. doi:10.1016/S0092-8674(01)00471-8
Franco, C. A., Jones, M. L., Bernabeu, M. O., Geudens, I., Mathivet, T., Rosa, A., et al. (2015). Dynamic Endothelial Cell Rearrangements Drive Developmental Vessel Regression. Plos Biol. 13, e1002125. doi:10.1371/journal.pbio.1002125
Gatzoulis, M. A., Webb, G. D., and Daubeney, P. E. F. (2018). Diagnosis and Management of Adult Congenital Heart Disease. Third edition. Philadelphia, PA: Elsevier.
Georgieva, P. B., Marchuk, D. A., and Gerhardt, H.Leducq ATTRACT Consortium* (2019). Attract. Circ. Res. 125, 262–264. doi:10.1161/CIRCRESAHA.119.315198
Hacking, W. J., VanBavel, E., and Spaan, J. A. (1996). Shear Stress Is Not Sufficient to Control Growth of Vascular Networks: a Model Study. Am. J. Physiology-Heart Circulatory Physiol. 270, H364–H375. doi:10.1152/ajpheart.1996.270.1.H364
Hansen, C. D., and Johnson, C. R. (2005). The Visualization Handbook. Amsterdam ; Boston: Elsevier-Butterworth Heinemann.
Izzo, R., Steinman, D., Manini, S., and Antiga, L. (2018). The Vascular Modeling Toolkit: A Python Library for the Analysis of Tubular Structures in Medical Images. J. Open. Sou. Soft. 3, 745. doi:10.21105/joss.00745
Kotini, M. P., van der Stoel, M. M., Han, M. K., Kirchmaier, B., de Rooij, J., Affolter, M., et al. (2021). Vinculin Controls Endothelial Cell Junction Dynamics During Vascular Lumen Formation. SSRN J. doi:10.2139/ssrn.3832977
Krüger, T., Kusumaatmaja, H., Kuzmin, A., Shardt, O., Silva, G., and Viggen, E. M. (2017). The Lattice Boltzmann Method: Principles and Practice. 1st ed. Switzerland: Cham: Springer International Publishing : Imprint: Springer.
Lampugnani, M. G., Resnati, M., Dejana, E., and Marchisio, P. C. (1991). The Role of Integrins in the Maintenance of Endothelial Monolayer Integrity. J. Cell Biol. 112, 479–490. doi:10.1083/jcb.112.3.479
Mazzeo, M. D., and Coveney, P. V. (2008). HemeLB: A High Performance Parallel Lattice-Boltzmann Code for Large Scale Fluid Flow in Complex Geometries. Computer Phys. Commun. 178, 894–914. doi:10.1016/j.cpc.2008.02.013
Mui, K. L., Chen, C. S., and Assoian, R. K. (2016). The Mechanical Regulation of Integrin-Cadherin Crosstalk Organizes Cells, Signaling and Forces. J. Cell Sci. 129 (6), 1093–1100. doi:10.1242/jcs.183699
Neto, F., Klaus-Bergmann, A., Ong, Y. T., Alt, S., Vion, A.-C., Szymborska, A., et al. (2018). YAP and TAZ Regulate Adherens junction Dynamics and Endothelial Cell Distribution during Vascular Development. eLife. 7, e31037. doi:10.7554/eLife.31037
Park, H., Furtado, J., Poulet, M., Chung, M., Yun, S., Lee, S., et al. (2021). Defective Flow-Migration Coupling Causes Arteriovenous Malformations in Hereditary Hemorrhagic Telangiectasia. Circulation. 144, 805–822. doi:10.1161/CIRCULATIONAHA.120.053047
Pathmanathan, P., Cooper, J., Fletcher, A., Mirams, G., Murray, P., Osborne, J., et al. (2009). A Computational Study of Discrete Mechanical Tissue Models. Phys. Biol. 6, 036001. doi:10.1088/1478-3975/6/3/036001
Pries, A. R., Höpfner, M., le Noble, F., Dewhirst, M. W., and Secomb, T. W. (2010). The Shunt Problem: Control of Functional Shunting in normal and Tumour Vasculature. Nat. Rev. Cancer. 10, 587–593. doi:10.1038/nrc2895
Pries, A. R., Secomb, T. W., and Gaehtgens, P. (1998). Structural Adaptation and Stability of Microvascular Networks: Theory and Simulations. Am. J. Physiology-Heart Circulatory Physiol. 275, H349–H360. doi:10.1152/ajpheart.1998.275.2.H349
Principles of Neurological Surgery (2012). Principles of Neurological Surgery. Philadelphia, PA: Elsevier Saunders.
Pulous, F. E., and Petrich, B. G. (2019). Integrin-Dependent Regulation of the Endothelial Barrier. Tissue Barriers. 7, 1685844. doi:10.1080/21688370.2019.1685844
Rochon, E. R., Menon, P. G., and Roman, B. L. (2016). Alk1 Controls Arterial Endothelial Cell Migration in Lumenized Vessels. Development. 143, 2593–2602. doi:10.1242/dev.135392
Roman, B. L., and Hinck, A. P. (2017). ALK1 Signaling in Development and Disease: New Paradigms. Cell. Mol. Life Sci. 74, 4539–4560. doi:10.1007/s00018-017-2636-4
Rosa, A., Giese, W., Meier, K., Alt, S., Klaus-Bergmann, A., Edgar, L., et al. (2020). Wasp Controls Oriented Migration of Endothelial Cells to Achieve Functional Vascular Patterning. Development. 149 (3), dev200195 doi:10.1101/2020.09.15.296574
Schindelin, J., Arganda-Carreras, I., Frise, E., Kaynig, V., Longair, M., Pietzsch, T., et al. (2012). Fiji: an Open-Source Platform for Biological-Image Analysis. Nat. Methods. 9, 676–682. doi:10.1038/nmeth.2019
Shovlin, C. L. (2010). Hereditary Haemorrhagic Telangiectasia: Pathophysiology, Diagnosis and Treatment. Blood Rev. 24, 203–219. doi:10.1016/j.blre.2010.07.001
Su, G., Atakilit, A., Li, J. T., Wu, N., Bhattacharya, M., Zhu, J., et al. (2012). Absence of Integrin αvβ3 Enhances Vascular Leak in Mice by Inhibiting Endothelial Cortical Actin Formation. Am. J. Respir. Crit. Care Med. 185, 58–66. doi:10.1164/rccm.201108-1381OC
Succi, S. (2001). The Lattice Boltzmann Equation for Fluid Dynamics and beyond. Oxford : New York: Clarendon Press ; Oxford University Press.
Szymborska, A., and Gerhardt, H. (2018). Hold Me, but Not Too Tight-Endothelial Cell-Cell Junctions in Angiogenesis. Cold Spring Harb Perspect. Biol. 10, a029223. doi:10.1101/cshperspect.a029223
Tabibian, A., Ghaffari, S., Vargas, D. A., Van Oosterwyck, H., and Jones, E. A. V. (2020). Simulating Flow Induced Migration in Vascular Remodelling. Plos Comput. Biol. 16, e1007874. doi:10.1371/journal.pcbi.1007874
Thalgott, J. r. m., Dos-Santos-Luis, D., and Lebrin, F. (2015). Pericytes as Targets in Hereditary Hemorrhagic Telangiectasia. Front. Genet. 6, 37. doi:10.3389/fgene.2015.00037
Tzima, E., Kiosses, W. B., del Pozo, M. A., and Schwartz, M. A. (2003). Localized Cdc42 Activation, Detected Using a Novel Assay, Mediates Microtubule Organizing Center Positioning in Endothelial Cells in Response to Fluid Shear Stress. J. Biol. Chem. 278, 31020–31023. doi:10.1074/jbc.M301179200
Vion, A. C., Perovic, T., Petit, C., Hollfinger, I., Bartels-Klein, E., Frampton, E., et al. (2021). Endothelial Cell Orientation and Polarity Are Controlled by Shear Stress and VEGF Through Distinct Signaling Pathways. Front. Physiol. 11, 623769. doi:10.3389/fphys.2020.623769
Zhao, H., and Chappell, J. C. (2019). Microvascular Bioengineering: a Focus on Pericytes. J. Biol. Eng. 13, 26. doi:10.1186/s13036-019-0158-3
Zhou, Q., Perovic, T., Fechner, I., Edgar, L. T., Hoskins, P. R., Gerhardt, H., et al. (2021). Association between Erythrocyte Dynamics and Vessel Remodelling in Developmental Vascular Networks. J. R. Soc. Interf. 18, 20210113. doi:10.1098/rsif.2021.0113
Keywords: angiogenesis, angiogenic remodelling, endothelial cells, collective migration, flow-migration coupling, force transmission, migration dynamics, arteriovenous malformations
Citation: Edgar LT, Park H, Crawshaw JR, Osborne JM, Eichmann A and Bernabeu MO (2022) Traffic Patterns of the Migrating Endothelium: How Force Transmission Regulates Vascular Malformation and Functional Shunting During Angiogenic Remodelling. Front. Cell Dev. Biol. 10:840066. doi: 10.3389/fcell.2022.840066
Received: 20 December 2021; Accepted: 05 April 2022;
Published: 19 May 2022.
Edited by:
Aurélie Carlier, Maastricht University, NetherlandsReviewed by:
Elizabeth Anne Vincent Jones, KU Leuven, BelgiumCopyright © 2022 Edgar, Park, Crawshaw, Osborne, Eichmann and Bernabeu. This is an open-access article distributed under the terms of the Creative Commons Attribution License (CC BY). The use, distribution or reproduction in other forums is permitted, provided the original author(s) and the copyright owner(s) are credited and that the original publication in this journal is cited, in accordance with accepted academic practice. No use, distribution or reproduction is permitted which does not comply with these terms.
*Correspondence: Lowell T. Edgar, bG93ZWxsLmVkZ2FyQGVkLmFjLnVr; Miguel O. Bernabeu, bWlndWVsLmJlcm5hYmV1QGVkLmFjLnVr
Disclaimer: All claims expressed in this article are solely those of the authors and do not necessarily represent those of their affiliated organizations, or those of the publisher, the editors and the reviewers. Any product that may be evaluated in this article or claim that may be made by its manufacturer is not guaranteed or endorsed by the publisher.
Research integrity at Frontiers
Learn more about the work of our research integrity team to safeguard the quality of each article we publish.