- 1The First Clinical College, Zhejiang Chinese Medical University, Hangzhou, China
- 2Department of Respiration, The First Affiliated Hospital of Zhejiang Chinese Medical University, Hangzhou, China
N6-methyladenosine (m6A) modification is one of the most prevalent RNA modification forms and is an important posttranscriptional mechanism for regulating genes. In previous research, we found that m6A regulator–mediated RNA methylation modification was involved in asthma; however, the specific modified genes are not clear. In this study, we systematically evaluated the transcriptome-wide m6A methylome and m6A-modified genes in asthma. Here, we performed two high-throughput sequencing methods, methylated RNA immunoprecipitation sequencing (MeRIP-seq), and RNA sequencing (RNA-seq) to identify key genes with m6A modification in asthma. Through difference analysis, we found that 416 methylation peaks were significantly upregulated and 152 methylation peaks were significantly downregulated, and it was mainly distributed in 3′ UTR. Furthermore, compared with the control group, there were 2,505 significantly upregulated genes and 4,715 significantly downregulated genes in the asthma group. Next, through a combined analysis of transcriptome and differential peaks, 14 differentially expressed genes related to RNA methylation modification were screened. Finally, through 87 health controls and 411 asthma cases from the U-BIOPRED (Unbiased Biomarkers for the Prediction of Respiratory Disease Outcomes) program, we verified three m6A-modified key genes (BCL11A, MATK, and CD300A) and found that they were mainly distributed in exons and enriched in 3' UTR. Our findings suggested that intervening in m6A-modified genes may provide a new idea for the treatment of asthma.
Introduction
Asthma is a chronic inflammatory respiratory disease, which involves many inflammatory cells, immune cells, and cell components (Global Initiative for Asthma, 2020). It affects about 300 million people around the world and is expected to increase by one-third by 2025. It is characterized by wheezing, shortness of breath, chest tightness and/or cough, and reversible expiratory airflow restriction. These changes are usually caused by factors such as exercise, allergen or irritant exposure, weather changes, and viral respiratory infections. However, some studies have found that the incidence of asthma has certain family aggregation (Melen, 2020), and there are multiple susceptibility genes, suggesting that genetic inheritance may play an important role in the pathogenesis of asthma. Moreover, asthma has the following two characteristics in the process of onset: first, even in the same family or genetic background, the onset of its members is still random, and this randomness does not fully follow the Mendelian genetic law; and gender, heredity, and postnatal environment can affect the onset of asthma; second, whether the fetus comes on or not in adulthood is also affected by the prenatal environment, such as mother’s diet and living habits and fetal malnutrition. Several asthma susceptibility gene loci have been identified by the genome-wide association studies (GWAS). Recently (Demenais et al., 2018), an international research team including the transnational asthma genetics alliance (TAGC) found several new genomic regions with increased asthma risk. People with asthma susceptibility genes are greatly affected by environmental factors. An in-depth study of the gene–environment interaction will help to reveal the genetic mechanism of asthma.
Epigenetics plays an important role in elucidating the interaction between genes and the environment and changing the course of disease (Kabesch and Tost, 2020). It provides instructions for when, where, and how to apply genetic information (Zhang L. et al., 2020). The in-depth study on the epigenetic mechanism of asthma is conducive to investigating the relationship between genes and environmental factors and to formulating effective treatment strategies for asthma (Benincasa et al., 2021). Epigenetics mainly includes DNA methylation, RNA modification, and histone modification. N6-methyladenosine (m6A) modification is the most prevalent form of RNA modification in eukaryotic mRNA and even viral RNA (Roundtree et al., 2017; Zhao et al., 2017). m6A modification has been reported since the 1970s, but the overall distribution of the modification in RNA and its effect on gene expression regulation has been poorly understood. In 2011, the first real RNA demethylase fat mass- and obesity-associated gene (FTO) was reported, and the methylation modification of m6A was proved to be reversible, which made the study of mRNA methylation come into the eyes of scientists again (Peixoto et al., 2020). The regulatory proteins of m6A were composed of methyltransferases (writers), demethylases (erasers), and methylated reading proteins (readers) (Zaccara et al., 2019). Methyltransferases include methyltransferase-like 3 (METTL3), methyltransferase-like 4 (METTL4), and WT1-associated protein (WTAP). Their main function is to catalyze m6A modification of mRNA (Chen et al., 2019). On the contrary, the function of demethylases is to demethylate the bases that have undergone m6A modification; it includes FTO and human AlkB homolog H5 (ALKBH5) (Lan et al., 2019). Methylated reading proteins are mainly proteins of the YT521-B homology (YTH) domain family; its main function is to identify the bases that undergo m6A modification and thus activate downstream regulatory pathways such as RNA degradation and miRNA processing (Wu et al., 2019).
Abnormalities of these regulators can affect mRNA in many aspects, including structure, splicing, translation, and stability, leading to the occurrence of disease (Karthiya and Khandelia, 2020), such as pancreatic cancer (Guo et al., 2020), cervical cancer (Wang et al., 2020), and gastric cancer (Zhang B. et al., 2020). These studies suggest that the expression changes of key genes related to m6A regulators function may lead to phenotypic alteration. In addition, our previous research has shown that m6A regulator–mediated RNA methylation modification was involved in asthma (Sun et al., 2021). In this study, we will continue to investigate the relationship between m6A and asthma; we systematically evaluated the transcriptome-wide m6A methylome and m6A-modified genes in asthma by methylated RNA immunoprecipitation sequencing (MeRIP-seq) and RNA sequencing (RNA-seq).
Methods
Mouse Model
We modeled (Kianmeher et al., 2016; Liu et al., 2021) two groups of female 6-week-old BALB/C mice: asthma group and blank control group (n = 3 per group). They had the same feeding conditions and growth environment. Immunization solution: dissolve 20 mg ovalbumin (OVA) in 1 ml normal saline (NS); after OVA is completely dissolved, dilute 0.4–10 ml and mix well; and then mix it with the same volume of liquid aluminum adjuvant and place on a shaking table at 4°C for 30 min. Challenge solution: add 0.5 g OVA in 10 ml NS, fully dissolve it, and shake it on a shaking table at 4°C for 30 min. Immunization: mice were injected intraperitoneally on days 0 and 12, each with 0.2 ml, and the control group was treated with an equal volume of normal saline. Challenge: on days 18–23, the mice were atomized by ultrasound in a closed container at a dose of 10 ml once a day for 20 min. Lung tissue was taken 24 h after last atomization and immediately stored in liquid nitrogen. All experimental procedures used in this study were approved and conducted according to the Guidelines for the Care and Use of Laboratory Animal Management and Ethics Committee of Zhejiang Chinese Medical University.
Experimental Procedure
RNA extraction and MeRIP-seq were conducted by the Beijing Genomics Institute. In brief, total RNA was extracted using the TRIzol reagent (Invitrogen), and the concentration and integrity of total RNA were measured by using the Qubit RNA HS Assay kit and an Agilent 2100 Bioanalyzer (Agilent Technology), respectively. For MeRIP experiment, about 10 ug of total RNA from each sample was fragmented using 10X RNA fragmentation buffer (Invitrogen, AM8740) by incubating in a preheated thermal cycler for 10 min at 70°C. The fragmented RNA was purified by using a RNA Clean & Concentrator™ kit (Zymo, R1018). Protein A and protein G magnetic beads (Invitrogen, 10002D, 10004D) were washed twice with IP buffer (150 mM NaCl, 10 mM Tris–HCl pH 7.5, and 0.1% IGEPAL CA-630 in nuclease-free water) before incubating with 5 ug m6A antibody (Synaptic Systems) at RT for 10 min. After two washes with IP buffer, antibody–bead complexes were resuspended in 500 μl of the IP reaction mixture including fragmented total RNA, and incubated for 4 h at 4°C. The immunoprecipitated m6A RNA with protein A/G magnetic beads was then washed three times with IP buffer for 10 min each at 4°C. Then, the beads complexes were resuspended in 500 μl reagent and collected by using the RNA Clean & Concentrator™ kit. For library preparation, the MeRIP libraries comprising eluted RNA were constructed using the SMARTer Stranded Total RNA-Seq Kit version 2 (Takara/Clontech), according to the manufacturer’s protocol. In brief, the eluted m6A RNA and input RNA were directly used for first-strand cDNA synthesis without fragmentation. After that, all the following steps were based on the manufacturer of the SMARTer Stranded Total RNA-Seq Kit version 2. Libraries for IP RNA were PCR amplified for less than 16 cycles and input libraries for less than 12 cycles. All libraries were analyzed by using an Agilent 2100 Bioanalyzer (Agilent Technologies) and quantified by using real-time PCR. Finally, the different libraries were pooled according to effective concentration and target downstream data volume and then sequenced on the HiSeq platform with the PE150 sequencing strategy.
Bioinformatic Analysis
After obtaining the original offline data, we performed bioinformatics analysis. First, we used Trim Galore software (version: 0.5.0) to carry out quality control steps such as removing connector sequences and low-quality bases from the original data. The parameters used were: --stringency 4 --quality 22—clip R1 13 –clip R2 13 --length 30 --paired. Hisat2 software (version: 2.1.0) (Kim et al., 2015) was used for reading alignments, and the reference genome was from the UCSC RefSeq database. Second, the m6A-modified area was detected by exomePeak software (version: 2.1.2) (Meng et al., 2014), and the parameters used were window width = 200, sliding step = 30, fragment length = 150, and fold enrichment = 1.5. Third, the differential m6A modification was identified by the R package exomePeak; it combined the peaks of the samples to be compared, calculated the cumulative number of reads in the combined peak of each sample, standardized these reads, made two groups of samples at a comparable level, and then tested whether there was a significant difference in the number of reads between the two groups of samples within the peak. The parameters used were window width = 200, sliding step = 30, fragment length = 150, diff peak abs fold change = 2, fold enrichment = 1.5, and fragment length = 200; the differential m6A modification was analyzed by annotation, distribution statistics, and motif identification. Fourth, we used StringTie software (Pertea et al., 2016) to calculate the expression of mRNA and displayed it with TPM, where TPM = Ri/Li*(1e6/sum (Ri/Li)). For lncRNAs, we used previously published methods (Yang et al., 2017); in brief, transcripts were first assembled using StringTie (Pertea et al., 2016) to obtain all transcripts in each sample and then labeled. The coding ability of candidate lncRNAs was then predicted using CNCI (Sun et al., 2013) and CPC (Kong et al., 2007) software, and the expression of lncRNAs was standardized using TPM. For circRNA, we used find_circ (Memczak et al., 2013) and CIRCexplorer2 (Zhang et al., 2014) for identification and calculated its expression using SRPBM (Zheng et al., 2016), where SRPBM = Ri/(Rtotal*Li). After obtaining the gene expression of each sample, differential gene analysis was carried out by edgeR software, and then the real differential genes were screened by threshold. Finally, the overlap of differential m6A-associated genes and differentially expressed genes was analyzed.
Validation of Clinical Significance of Gene Expression Regulated by m6A Modification
Data for validation were obtained from U-BIOPRED (Unbiased Biomarkers for the Prediction of Respiratory Disease Outcomes) (Bigler et al., 2017), a multicenter prospective cohort study involving 16 clinical centers in 11 European countries, and downloaded from Gene Expression Omnibus datasets (https://www.ncbi.nlm.nih.gov/geo/). The serial number is GSE69683, and the sample type is blood. A total of 87 healthy controls and 411 asthma cases were selected. The platform used was the GPL13158 [HT_HG-U133_Plus_PM] Affymetrix HT HG-U133 + PM Array Plate. R software and annotation packages were used to obtain gene symbols of the dataset. The differential expression of genes between asthma cases and healthy controls was analyzed by using the Wilcoxon test, and the up/down/unchanged genes were visualized using the R package “ggplot2”. The potential m6A-modified genes in patients with asthma were identified by univariate logistic regression and were cut off by p < 0.05. The least absolute shrinkage and selection operator (LASSO) Cox regression was used for feature selection and dimension reduction (McEligot et al., 2020), and the risk scores of potential asthma-related genes were calculated for verification [we used the rms package (Zhang J. A. et al., 2020) for the nomogram plotting and the nomogramFormula package (Bi et al., 2020) to calculate total points and probabilities of nomogram]. Receiver operating characteristic (ROC) curve analysis was used to evaluate distinguishing performance. The m6A methylation peak was displayed by IGV software according to the TDF file of sequencing samples, and the minimum value of data range was set to 0 to remove those non-specific peaks and low enrichment peaks (Thorvaldsdottir et al., 2013).
Results
Data Quality Control and Comparison
The original offline data includes the splice sequences introduced during library preparation and bases with low quality. These factors will lead to fewer reads to the genome, resulting in less information, so it needs to be filtered. We used Trim Galore to control the quality of the original offline data. Q20 and Q30 in the quality control results were calculated according to the correct rate of base recognition during sequencing and were the key indicators of base quality [Calculation formula: Qphred = −10log10P (error)]. It was found that the base ratio of Q20 in the asthma group and the control group was higher than 95%, and the proportion of Q30 bases was higher than 90%, which proves that the sequencing quality of this data is good and reliable. The results are shown in Table 1. Next, we used the software hisat2 to align the clean data to the reference genome. The results are shown in Table 2.
Identification and Statistics of the m6A Enrichment Area (Peak)
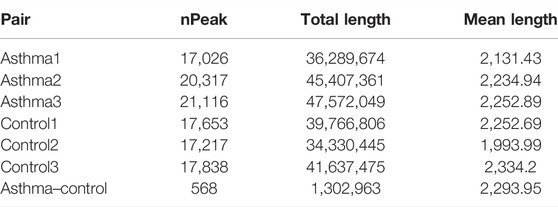
MeRIP-Seq enriched and sequenced the m6A-modified region on RNA; therefore, in the m6A-modified region, the number of reads covered by IP will be significantly higher than that of the input, thus forming a “peak.” The location of m6A modification on RNA can be obtained by detecting the location of these peaks. We used exomePeak software for peak detection. The number, total length, and average length of peaks in each group were counted. The results are shown in Table 3. The overlapping of peaks between samples was analyzed (Figures 1A,B). According to the results, the number of overlapped peaks in the asthma group was 13,481 and the number of overlapped peaks in the control group was 12,444, accounting for the majority of total peaks, which proved that the consistency of m6A modification was high. At the same time, the overlap of peak modification genes in the sample was visualized (Figures 1C,D). According to the results, the number of overlapped peak modification genes in the asthma group was 4,198, and that in the control group was 3,990.

FIGURE 1. Identification and statistics of the m6A enrichment area. (A) Number of peaks and overlapping peaks in the asthma group. (B) Number of peaks and overlapping peaks in the control group. (C) Number of peaks and overlapping peak of modified genes in asthma groups. (D) Number of peaks and overlapping peak of modified genes in control groups.
Identification and Analysis of the m6A Differential Peak
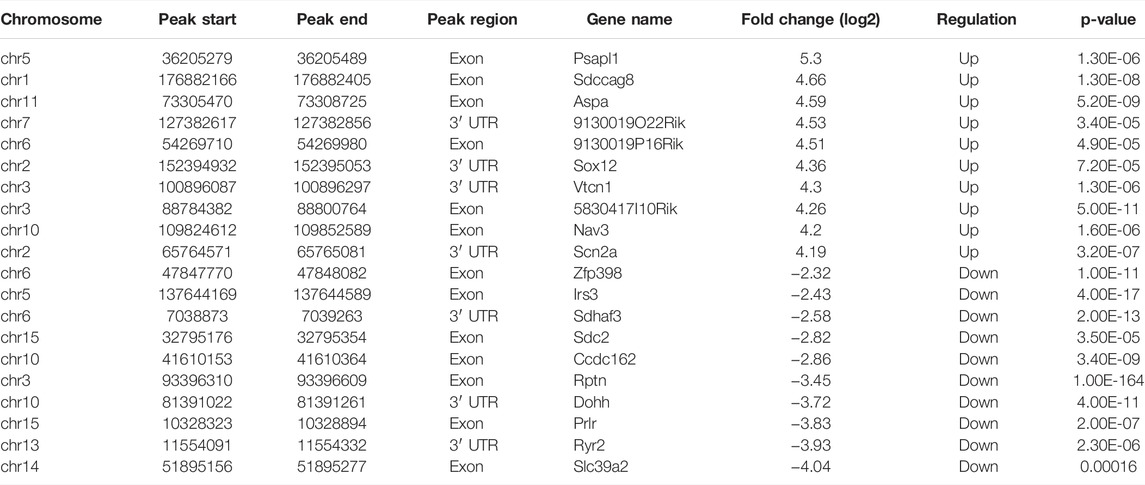
The differential m6A modification (i.e., differential peak) was identified by using the R package exomePeak, and then the differential peak was counted by the R package Chipseeker (version: 2.16.0). A total of 568 peaks were detected, including 416 m6A methylation peaks that were significantly upregulated and 152 significantly downregulated (log2-fold change was used in this experiment to represent the ratio of standardized reads between the asthma group and the control group; the value >0 indicates that m6A modification in the asthma group is higher than that in the control group and vice versa). The number, total length, and average length of differential peaks between the asthma group and the control group are shown in Table 3 and Supplementary Table S1. The results of the top 20 differently expressed peaks are shown in Table 4. Next, we counted the distribution of the m6A peak. First, we counted the distribution of differential m6A modifications on chromosomes. The statistical method is to calculate the number of differential peak coverage of each base on the chromosome and draw the figure with the statistical file. (Figure 2A). Second, we analyzed the distribution patterns of differential peaks on mRNA; we found that the differential peaks were mainly distributed on CDS and 3′ UTR, and the highest peak of distribution was at the junction of CDS and 3′ UTR (Figure 2B). Finally, to understand its specific distribution on mRNA, the number of differential peaks distributed on each gene element was counted based on the location of differential m6A. This statistic helps to understand whether the distribution of differential m6A modifications has a preference for gene elements. According to the results, we found that the differential peaks had the highest percentage of 3′ UTR distribution with 42.61% (Figure 2C).
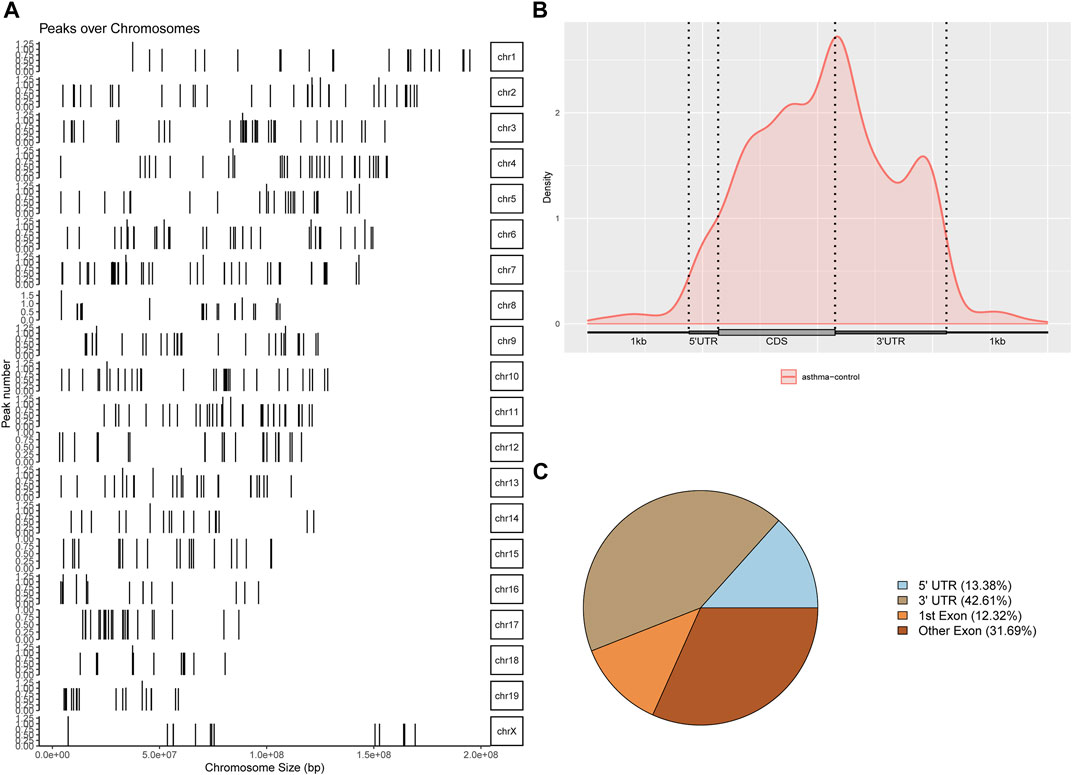
FIGURE 2. Identification and analysis of the m6A differential peak. (A) Distribution of differential m6A modifications on chromosomes. (B) Distribution patterns of differential peaks on mRNA. (C) Number of differential peaks distributed on each gene element.
Identification of Motifs in the m6A Modification Region
A motif refers to a short DNA sequence with a specific pattern. These sequences are likely to be important regulatory regions and related to biological functions. The m6A-modified sequence may have some characteristics. Therefore, the motif of the peak region was identified. We used motif analysis software HOMER (Hansen et al., 2016) to search motifs with high reliability in the peak area, and the width, p-value, and general position information of each motif in each peak sequence were obtained. The results are shown in Figure 3A. The canonical m6A motif—GGACU—was identified in the motif of the m6A-modified region in all samples of the asthma group [m6A mainly occurs on the motif of RRACH, where R = G/A; H = A/C/U (Wei et al., 2021)].

FIGURE 3. Identification of motifs in the m6A modification region and enrichment analysis of differentially m6A-modified associated genes. (A) Identification of motifs in the m6A modification region in all samples. (B) Top 20 GO enrichment analysis results of genes related to differential m6A modification. (C) Top 20 KEGG enrichment analysis results of genes related to differential m6A modification.
Enrichment Analysis of Differentially Associated m6A-Modified Genes
To investigate the biological functions of differentially m6A-modified genes, we analyzed them with Gene Ontology (GO) and Kyoto Encyclopedia of Genes and Genomes (KEGG). GO is divided into three ontologies: molecular functions (MFs), cellular components (CCs), and biological processes (BPs). Figure 3B shows the results of the GO analysis, and the enrichment table is shown in Supplementary Table S2. The most significantly enriched MF was small GTPase binding, and the most significantly enriched BP was cost chromatin modification. KEGG is a simulation of the biological system, including the molecular wiring diagram of interaction, reaction, and relationship network composed of molecular structural units of genes, proteins, and compounds, as well as the information of diseases and drugs. Figure 3C shows the results of KEGG enrichment, and the enrichment table is shown in Supplementary Table S3. We found that the signal pathway with the most significant enrichment of differentially m6A-modified genes was the Rap1 (Ras-proximate-1) signaling pathway. Rap1 is a small GTPase, a small cytosolic protein that acts as a cellular switch and is essential for efficient signal transduction (Burbach et al., 2007). The latest study found that it is associated with seasonal allergies and asthma symptoms in children (Tiwari et al., 2021). In a separate study (Hu et al., 2015), asthmatic HASM (human airway smooth muscle) cells were also found to exhibit increased constitutive direct binding of the small Rap1 GTPase-activating protein Rap1GAP to the Gi protein alpha subunit, which contributes to the synergistic promotion of Ras activation. This suggests that small GTPase binding and Rap1 signaling pathway have important roles in asthma.
Analysis of mRNA, lncRNA, and circRNA Gene Expression Levels
m6A-seq input library is equivalent to RNA-seq library, which can be used to analyze gene expression and identify differentially expressed genes. Therefore, we used it to analyze the gene expression levels of mRNA, lncRNA, and circRNA. We used the software StringTie to calculate gene expression of mRNA and then standardized it with TPM and displayed it with a density map (Figure 4A). For lncRNA, we identified 13,208 lncRNA transcripts by combining the results of two prediction software (CNCI and CPC) (Figure 4B) and then standardized the expression of lncRNA with TPM and displayed it with a density map (Figure 4C). For circRNA, due to the high false-positive rate of circRNA identification, we used two software applications (find_circ and Circexplorer2) for circRNA identification, took the intersection of the results of the two software as the final prediction result, and identified a total of six circRNA transcripts (Figure 4D). Then, SRPBM was used to calculate the expression of circRNA and display it with a density map (Figure 4E). Finally, the TPM of mRNA was analyzed by a principal component analysis (PCA) (Figure 4F), and the correlation between two samples was calculated (Figure 4G). According to the results, it can be seen that the asthma group and the control group were significantly separated.
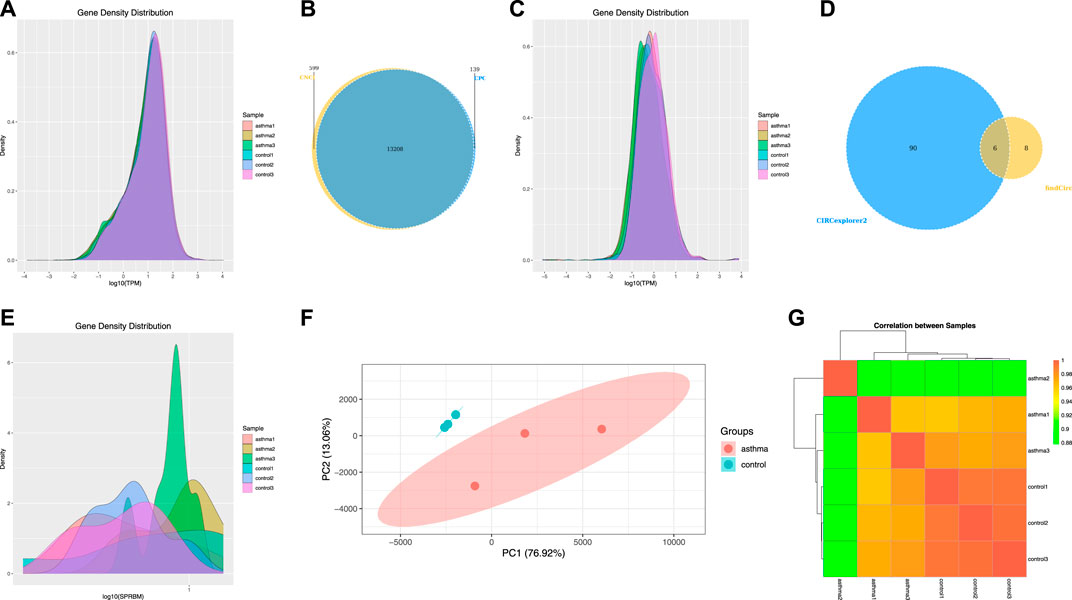
FIGURE 4. Analysis of mRNA, lncRNA, and circRNA gene expression levels. (A) Density map of the mRNA gene expression level. (B) Statistics of lncRNA transcripts. (C) Density map of the lncRNA gene expression level. (D) Statistics of circRNA transcripts. (E) Density map of the circRNA gene expression level. (F) Principal component analysis of mRNA. (G) Correlation between samples of mRNA.
Identification and Enrichment Analysis of Differentially Expressed Genes
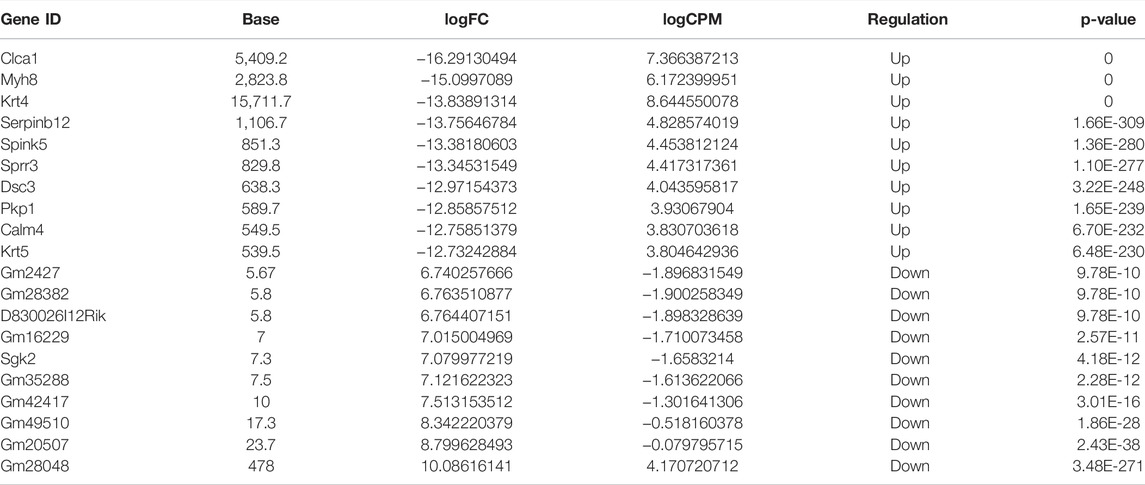
After obtaining the gene expression of each sample, the differential gene analysis was carried out between the asthma group and the control group. Because mRNA, lncRNA, and circRNA come from the same library, we combined these three RNAs for analysis when calculating differential expression, and there were 68,555 genes after combination. Next, the differentially expressed genes (DEGs) were identified by edgeR software [If the p-value < 0.05 and the absolute value of log2 (fold change) > 1, it is considered to be a DEG]. We found that compared with the control group, there were 2,505 significantly upregulated genes and 4,715 significantly downregulated genes in the asthma group (Supplementary Table S4). DEGs were displayed using MA map, volcano map, and heat map (Figures 5A–C). Table 5 shows the top 20 genes with the most differences in mRNA. Third, the DEGs were analyzed by GO and KEGG enrichment (Supplementary Tables S5, S6). The top 30 enrichment results are shown in Figures 5D,E. The most significantly enriched CC was an immunoglobulin complex, the most significantly enriched MF was immunoglobulin receptor binding, and the most significantly enriched BP was the antigen receptor-mediated signaling pathway. As for KEGG, the most significantly enriched item was the cytokine–cytokine receptor interaction. It is suggested that the DEGs are closely related to immune function.
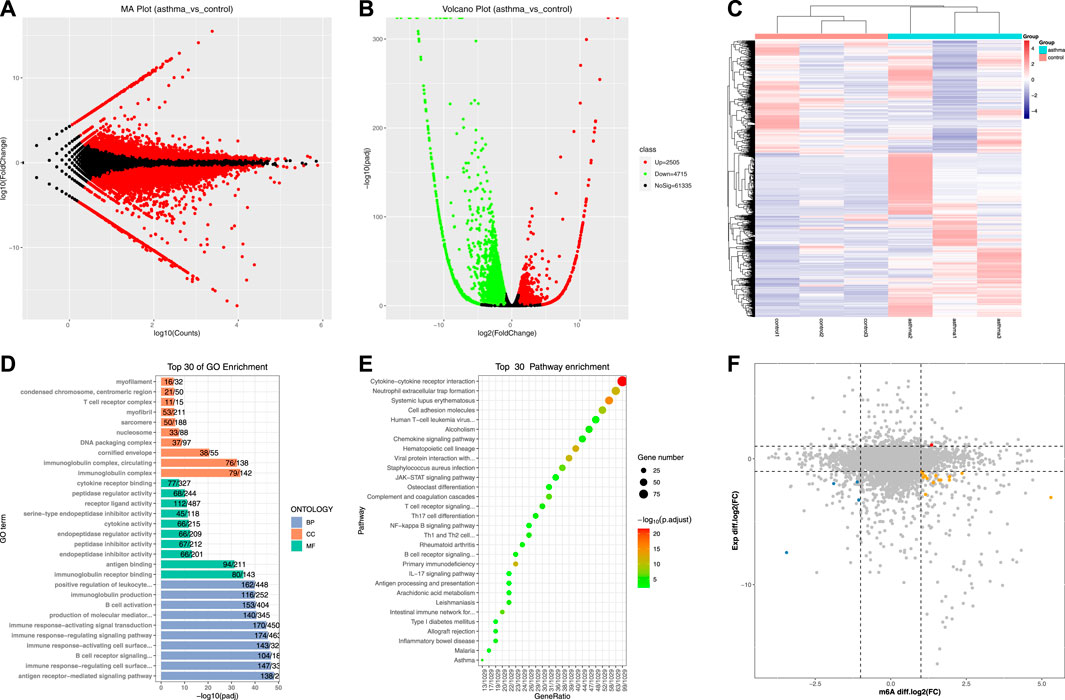
FIGURE 5. Identification and enrichment analysis of differentially expressed genes and their association with the m6A peak. (A) MA map of DEGs. (B) Volcano map of DEGs. (C) Heat map of DEGs. (D) Top 30 GO enrichment analysis results of DEGs. (E) Top 30 KEGG enrichment analysis results of DEGs. (F) Correlation analysis of differential m6A peaks and DEGs.
Correlation Analysis of Differential m6A Peaks and DEGs
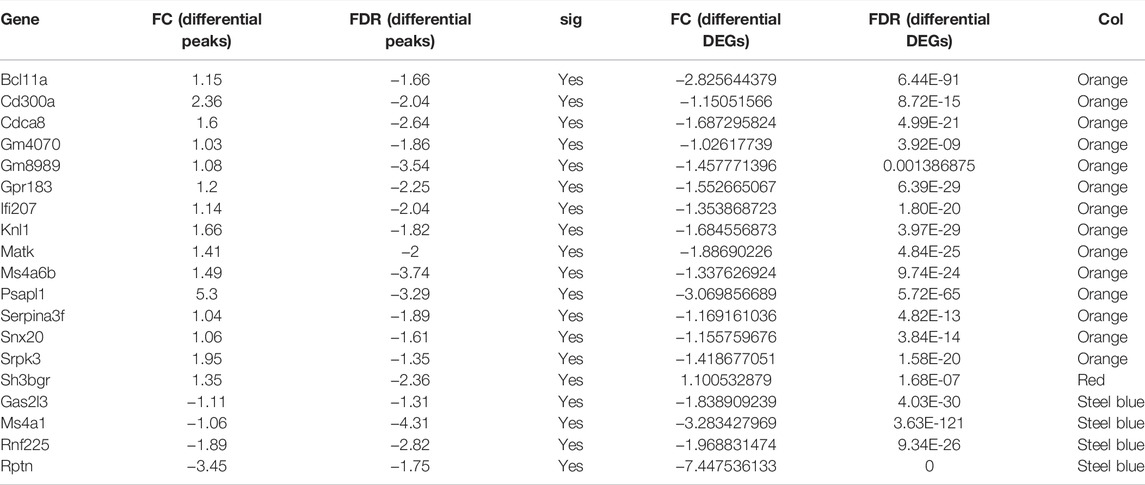
To understand the overlapping relationship between genes associated with differential m6A peak and differentially expressed genes, we carried out a series of statistics. First, the differential peaks associated with each gene (including significant and insignificant) were obtained. One gene may match with multiple peaks, and in this case, this gene will appear multiple times; there may also be no matching differential peak, in which case the gene will not appear. Second, the overlapping relationship between the genes obtained in the previous step and the differentially expressed genes was identified. We found that compared with the control group, in the asthma group, one gene with a 2-fold increase in the m6A modification level and a 2-fold increase in the expression level was shown in red, four genes with a 2-fold decrease in the m6A modification level and a 2-fold decrease in the expression level were shown in blue, and 14 genes with a 2-fold increase in the m6A modification level and a 2-fold decrease in the expression level were shown in orange. The peaks matched by these genes were all significantly different. The results are shown in Figure 5F and Table 6.
Validation of Gene Expression Regulated by m6A Modification
To evaluate the clinical significance of gene expression regulated by m6A modification, the GEO database was explored. We selected 14 genes with differentially methylated m6A peaks and simultaneous differential expression according to the correlation analysis of differential m6A peaks and DEGs (Wang et al., 2019; Zhang et al., 2021). Because there was very large interference inducible genes among these 14 genes, taking the intersection of MeRIP-seq and RNA-seq and GEO, it was found that there were eight co-expressed genes, of which three were differential, namely, BCL11A, MATK, and CD300A (Figures 6A–C). Next, we used univariate logistic regression to analyze these three genes and found that they were all potential m6A-regulated genes of asthma (Figure 7A). Third, LASSO Cox regression was used for feature selection and dimension reduction, and it was found that these three genes were all important for asthma (Figures 7B,C). At the same time, the risk scores of the three genes were compared between the asthma group and the healthy control group. It was found that the risk scores of the three genes in the asthma group were significantly higher than that in the healthy control group (p = 4e-13) (Figures 7D,E); the ROC curve also illustrated that the three genes possess a good performance in classifying patients with asthma and healthy controls (Figure 7F). Finally, the methylation peaks of BCL11A, MATK, and CD300A were visualized according to the TDF file. It was found that the methylation peaks of three key m6A-regulated genes in asthma were different from those in the control group, and they were mainly distributed in exons and enriched in 3’ UTR (Figures 8A–C).
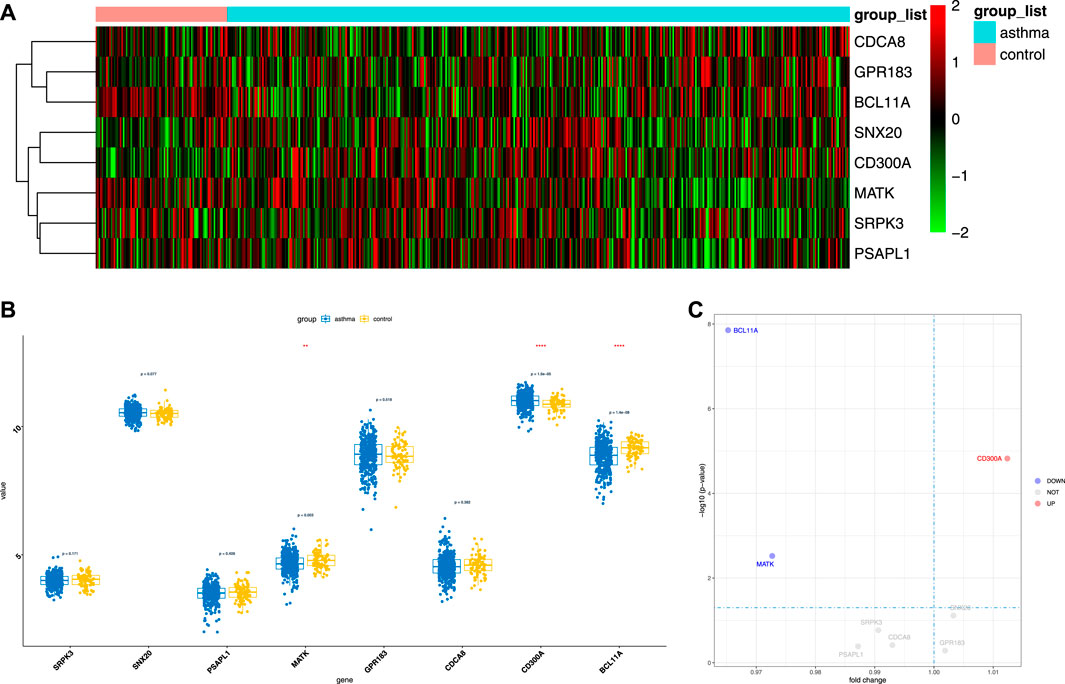
FIGURE 6. The expression of candidate m6A-regulated genes. (A,B) Heat map and boxplot demonstrated the expression differences of eight genes between asthma cases and healthy controls in the GEO database. (C) Volcano map of the expression differences of eight genes between healthy controls and asthma samples.
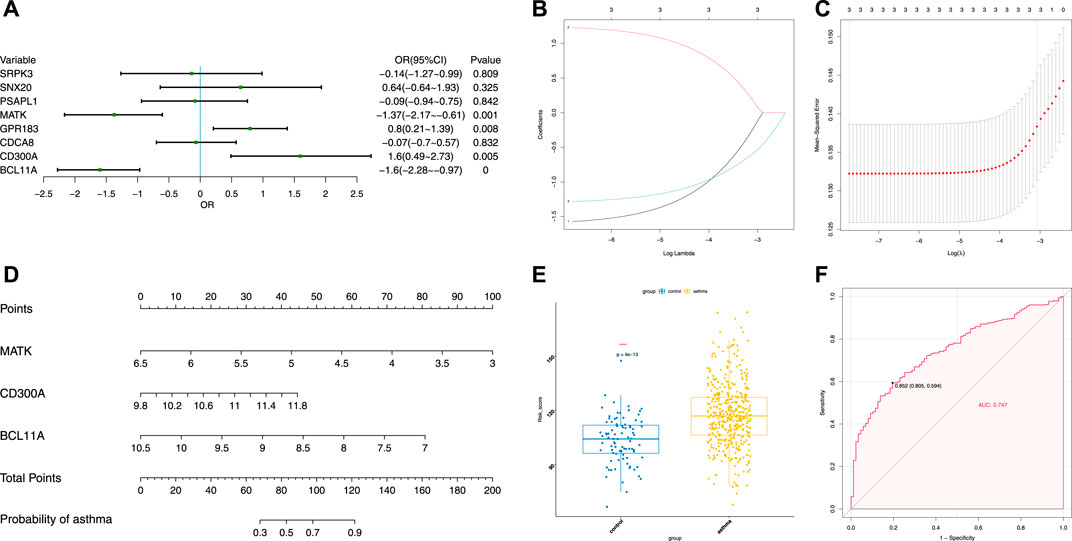
FIGURE 7. Identification of crucial genes in asthma. (A) Univariate logistic regression investigated the relationship between candidate m6A-regulated genes and asthma cases. (B) Least absolute shrinkage and selection operator (LASSO) coefficient profiles of three candidate m6A-regulated genes. (C) 10-fold cross-validation for tuning parameter selection in the LASSO regression. (D) Risk scores of three candidate m6A-regulated genes. (E) Risk distribution between healthy and asthma cases, in which asthma cases have a much higher risk score than healthy controls. (F) Discrimination ability for healthy and asthma cases by candidate m6A-regulated genes was analyzed by the ROC curve and evaluated by the AUC value.
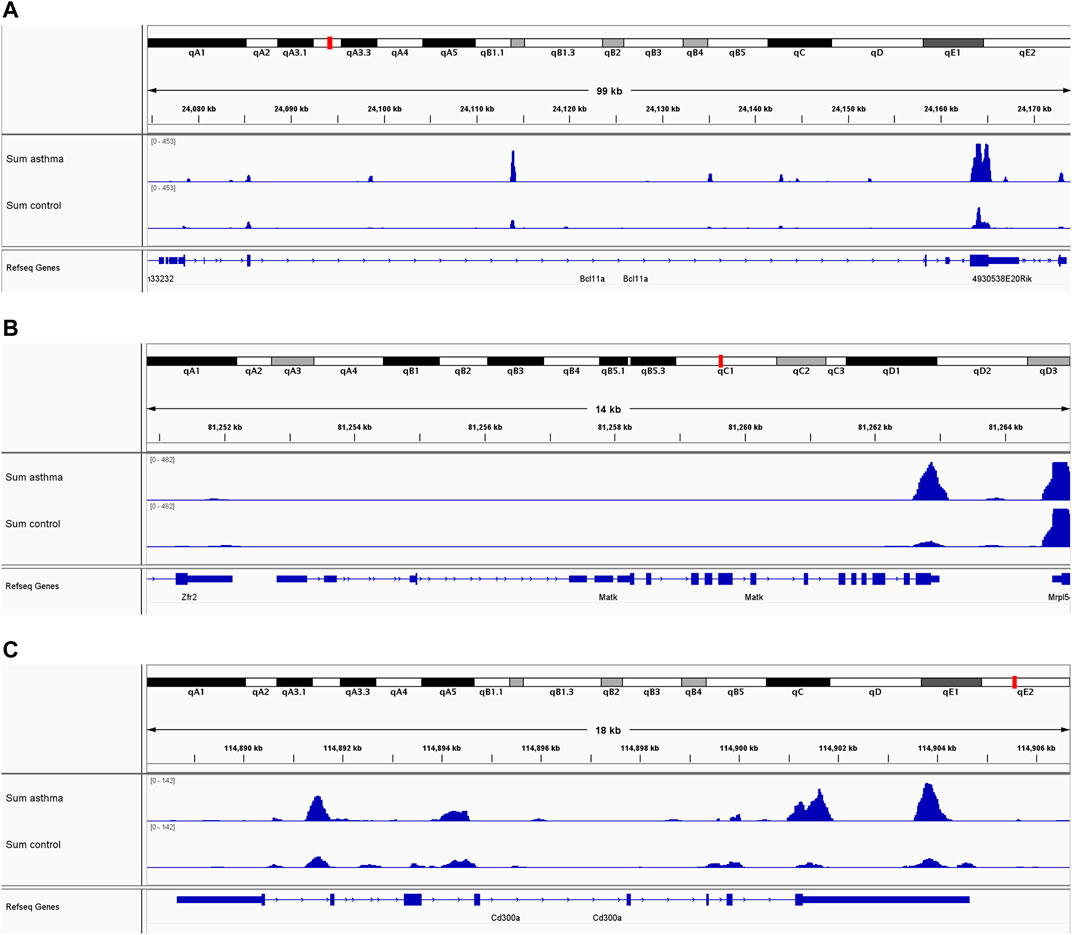
FIGURE 8. m6A methylation peaks of BCL11A, MATK, and CD300A. (A) Integrative genomics viewer (IGV) plots showing m6A-methylated peaks for BCL11A. (B) IGV plots showing m6A-methylated peaks for MATK. (C) IGV plots showing m6A-methylated peaks for CD300A. Blue boxes represent exons, and blue lines represent introns.
Discussion
Asthma is a chronic airway inflammatory disease with obvious heterogeneity and complex pathophysiological manifestations (Global Initiative for Asthma, 2020). At present, there are at least 300 million cases of asthma in the world, and the prevalence of asthma is increasing year by year. m6A RNA methylation plays an important role in regulating the expression of pathogenic genes, and abnormal m6A modification can affect RNA splicing, translocation, and translation, resulting in the occurrence of diseases. Recently (Xiong et al., 2021), the Genotype-Tissue Expression (GTEx) project reported 129 transcriptome-wide m6A profiles, covering 91 individuals and four tissues (the brain, lung, muscle, and heart). For the lung, 62 m6A quantitative trait loci (QTLs) colocalize with genome-wide association studies (GWAS) variants. Asthma-associated rs3194051 is a lung m6A QTL for immune-related interleukin-7 (IL-7) that contributes to atopic asthma, acting in bronchoalveolar lavage fluid and regulating airway eosinophilia. The results provided important insights and resources for understanding the relationship between asthma and m6A. Moreover, another study on childhood asthma found that m6A regulators also played a crucial role and screened five candidate m6A regulators (FMR1, KIAA1429, WTAP, YTHDC2, and ZC3H13) to predict the risk of childhood asthma (Xiong et al., 2021). Therefore, it is of great significance to study the relationship between asthma and m6A. In this study, a series of experiments and analyses were carried out to elucidate the transcriptome-wide m6A methylome and m6A-modified genes in asthma. This is the continuity comprehensive high-throughput transcriptome-wide analysis of m6A RNA methylation in asthma. Our study demonstrated that there were a large number of m6A modifications in asthmatic lung tissue, and further analysis showed that these modifications may play an important role in asthma by regulating gene expression.
We used the MeRIP-seq method for high-throughput sequencing of asthmatic lung tissue, and through the analysis of IP (m6A-seq library) and input (RNA-seq library), we found that there were a large number of m6A methylation peaks in the transcriptome of asthmatic lung tissue; and 568 differential peaks were detected by differential analysis, including 416 significantly upregulated and 152 significantly downregulated methylation peaks, and it was mainly distributed in 3′ UTRs. The m6A peaks were reported to be mainly concentrated in the long exons and 3′ UTRs (Dominissini et al., 2012), and our findings were consistent with this. According to the report, m6A mainly occurs on the motif of RRACH, but we found that the motif sequence of asthma was GAAUA by using Homer software, and the specific reason needs to be further studied. Next, we found that compared with the control group, there were 2,505 significantly upregulated genes and 4,715 significantly downregulated genes in the asthma group. GO and KEGG enrichment analyses showed that most of the potential functions of these genes were related to immunity, such as immunoglobulin complex and immunoglobulin receiver binding, and some pathways were known to play a vital role in asthma such as JAK-STAT (Pernis and Rothman, 2002; Chen et al., 2021), NF-κB (Edwards et al., 2009; Lertnimitphun et al., 2021), IL-17 (Silverpil and Linden, 2012; Chesne et al., 2014) signaling pathways were also enriched. Third, through the combined analysis of transcriptome and differential peak, 14 differentially expressed genes related to RNA methylation modification were screened, which were related to asthma. Finally, to evaluate the clinical significance of gene expression regulated by m6A modification, clinical samples were selected to verify the candidate gene, and it was found that there were eight co-expressed genes, of which three were differential genes, namely, BCL11A, MATK, and CD300A. We also used univariate logistic regression, LASSO Cox regression, risk scores, and ROC to analyze these three genes and found that they were all potential m6A-regulated genes of asthma, and the risk scores in asthma were also higher than those in healthy controls. In addition, the methylation peaks and distribution of BCL11A, MATK, and CD300A were visualized according to the TDF file, and we found that they were mainly distributed in exons and enriched in 3′ UTR. In conclusion, it was indicated that these three m6A-regulated genes play a crucial role in asthma and can affect the prognosis of asthma.
BCL11A (BAF chromatin remodeling complex subunit BCL11A) is a protein-coding gene. This gene encodes a C2H2 type zinc-finger protein by its similarity to the mouse Bcl11a/Evi9 protein. A GWAS of asthma symptoms in 1,246 children in the population of Salvador, Brazil, was carried out (Costa et al., 2015); they found that BCL11A is associated with hematopoietic symptoms of asthma, and it may be related to its interaction with BCL 6 and participation in hematopoietic cell differentiation. In addition, in another study of severe asthma (Hachim et al., 2021), they found that BCL11A was downregulated. MATK (megakaryocyte-associated tyrosine kinase) is a protein-coding gene too. The protein encoded by this gene can phosphorylate and inactivate Src family kinases and may play an inhibitory role in the control of T-cell proliferation. Esnault et al. (2013) performed a gene expression array analysis on sputum samples obtained following whole lung allergen challenge and on bronchoalveolar lavage cells obtained following segmental bronchoprovocation with an allergen found that MATK was an eosinophil-associated gene in sputum after whole lung allergen challenge. CD300A is an Ig-like receptor preferentially expressed on myeloid cells and mast cells, and it is located on chromosome 17 and contains cytoplasmic ITIMs, specifically, human and murine CD300A inhibits FcεRI-mediated signals in mast cells and basophils, resulting in the suppression of their degranulation. It was found that CD300A is a critical modulator of mast cells and eosinophil functions in allergic settings (Munitz et al., 2006). In addition, a recent study also demonstrated that CD300A-mediated signaling in iDCs was involved in Th2 responses induced by dead cells (Miki et al., 2015). In conclusion, these three genes are closely related to asthma in previous researches; in this study, we also confirmed that they are m6A-mediated key genes in asthma.
In summary, this study analyzed the transcriptome-wide m6A methylome and m6A-modified genes in asthma. It was suggested that m6A methylation may play a vital role in regulating the expression of asthma-related genes. Our research is the continuity study to comprehensively analyze the transcriptome-wide m6A methylome in asthma by MeRIP sequencing, which confirms the effect of m6A modification on asthma, opens up a new direction for using the m6A modification mechanism to study the pathogenesis of asthma, and encourages more scholars to carry out more research in this field.
Data Availability Statement
The datasets presented in this study can be found in online repositories. The names of the repository/repositories and accession number(s) can be found below: Bioproject ID: PRJNA778307.
Ethics Statement
The animal study was reviewed and approved by the Guidelines for the Care and Use of Laboratory Animal Management and Ethics Committee of Zhejiang Chinese Medical University, Zhejiang Chinese Medical University.
Author Contributions
DS conceived the idea, designed the experiments, and prepared the manuscript. XC modeled the animals, collected the samples, and prepared the manuscript. FS, LF, and HY analyzed the data and revised the manuscript. SZ, LZ, and KC assisted in the revision of manuscripts. ZW acquired the fund and supervised the process. All authors contributed to the article and approved the submitted version.
Funding
This work was funded by the National Natural Science Foundation of China (82174302) and National Key R&D Program of China (2018YFC2002500).
Conflict of Interest
The authors declare that the research was conducted in the absence of any commercial or financial relationships that could be construed as a potential conflict of interest.
Publisher’s Note
All claims expressed in this article are solely those of the authors and do not necessarily represent those of their affiliated organizations, or those of the publisher, the editors, and the reviewers. Any product that may be evaluated in this article, or claim that may be made by its manufacturer, is not guaranteed or endorsed by the publisher.
Acknowledgments
The authors thank the Beijing Genomics Institute for performing MeRIP-seq.
Supplementary Material
The Supplementary Material for this article can be found online at: https://www.frontiersin.org/articles/10.3389/fcell.2022.799459/full#supplementary-material
References
Benincasa, G., DeMeo, D. L., Glass, K., Silverman, E. K., and Napoli, C. (2021). Epigenetics and Pulmonary Diseases in the Horizon of Precision Medicine: a Review. Eur. Respir. J. 57 (6), 2003406. doi:10.1183/13993003.03406-2020
Bi, G., Li, R., Liang, J., Hu, Z., and Zhan, C. (2020). A Nomogram with Enhanced Function Facilitated by nomogramEx and nomogramFormula. Ann. Transl Med. 8 (4), 78. doi:10.21037/atm.2020.01.71
Bigler, J., Boedigheimer, M., Schofield, J. P. R., Skipp, P. J., Corfield, J., Rowe, A., et al. (2017). A Severe Asthma Disease Signature from Gene Expression Profiling of Peripheral Blood from U-BIOPRED Cohorts. Am. J. Respir. Crit. Care Med. 195 (10), 1311–1320. doi:10.1164/rccm.201604-0866OC
Burbach, B. J., Medeiros, R. B., Mueller, K. L., and Shimizu, Y. (2007). T-cell Receptor Signaling to Integrins. Immunol. Rev. 218, 65–81. doi:10.1111/j.1600-065X.2007.00527.x
Chen, X.-Y., Zhang, J., and Zhu, J.-S. (2019). The Role of M(6)A RNA Methylation in Human Cancer. Mol. Cancer 18 (1), 103. doi:10.1186/s12943-019-1033-z
Chen, X., Yue, R., Li, X., Ye, W., Gu, W., and Guo, X. (2021). Surfactant Protein A Modulates the Activities of the JAK/STAT Pathway in Suppressing Th1 and Th17 Polarization in Murine OVA-Induced Allergic Asthma. Lab. Invest. 101 (9), 1176–1185. doi:10.1038/s41374-021-00618-1
Chesné, J., Braza, F., Mahay, G., Brouard, S., Aronica, M., and Magnan, A. (2014). IL-17 in Severe Asthma. Where Do We Stand? Am. J. Respir. Crit. Care Med. 190 (10), 1094–1101. doi:10.1164/rccm.201405-0859PP
Costa, G. N. O., Dudbridge, F., Fiaccone, R. L., da Silva, T. M., Conceição, J. S., Strina, A., et al. (2015). A Genome-wide Association Study of Asthma Symptoms in Latin American Children. BMC Genet. 16, 141. doi:10.1186/s12863-015-0296-7
Demenais, F., Margaritte-Jeannin, P., Barnes, K. C., Cookson, W. O. C., Altmüller, J., Ang, W., et al. (2018). Multiancestry Association Study Identifies New Asthma Risk Loci that Colocalize with Immune-Cell Enhancer marks. Nat. Genet. 50 (1), 42–53. doi:10.1038/s41588-017-0014-7
Dominissini, D., Moshitch-Moshkovitz, S., Schwartz, S., Salmon-Divon, M., Ungar, L., Osenberg, S., et al. (2012). Topology of the Human and Mouse m6A RNA Methylomes Revealed by m6A-Seq. Nature 485 (7397), 201–206. doi:10.1038/nature11112
Edwards, M. R., Bartlett, N. W., Clarke, D., Birrell, M., Belvisi, M., and Johnston, S. L. (2009). Targeting the NF-Κb Pathway in Asthma and Chronic Obstructive Pulmonary Disease. Pharmacol. Ther. 121 (1), 1–13. doi:10.1016/j.pharmthera.2008.09.003
Esnault, S., Kelly, E. A., Schwantes, E. A., Liu, L. Y., DeLain, L. P., Hauer, J. A., et al. (2013). Identification of Genes Expressed by Human Airway Eosinophils after an In Vivo Allergen challenge. PLoS One 8 (7), e67560. doi:10.1371/journal.pone.0067560
Global Initiative for Asthma (2020). Global Strategy for Asthma Management and Prevention, 2020. Available at: www.ginasthma.org.pdf (Accessed April 06, 2020).
Guo, X., Li, K., Jiang, W., Hu, Y., Xiao, W., Huang, Y., et al. (2020). RNA Demethylase ALKBH5 Prevents Pancreatic Cancer Progression by Posttranscriptional Activation of PER1 in an m6A-YTHDF2-dependent Manner. Mol. Cancer 19 (1), 91. doi:10.1186/s12943-020-01158-w
Hachim, M. Y., Elemam, N. M., Ramakrishnan, R. K., Bajbouj, K., Olivenstein, R., Hachim, I. Y., et al. (2021). Wnt Signaling Is Deranged in Asthmatic Bronchial Epithelium and Fibroblasts. Front. Cel Dev. Biol. 9, 641404. doi:10.3389/fcell.2021.641404
Hansen, T. B., Venø, M. T., Damgaard, C. K., and Kjems, J. (2016). Comparison of Circular RNA Prediction Tools. Nucleic Acids Res. 44 (6), e58. doi:10.1093/nar/gkv1458
Hu, A., Diener, B. L., Josephson, M. B., and Grunstein, M. M. (2015). Constitutively Active Signaling by the G Protein βγ-Subunit Mediates Intrinsically Increased Phosphodiesterase-4 Activity in Human Asthmatic Airway Smooth Muscle Cells. PLoS One 10 (3), e0118712. doi:10.1371/journal.pone.0118712
Kabesch, M., and Tost, J. (2020). Recent Findings in the Genetics and Epigenetics of Asthma and Allergy. Semin. Immunopathol 42 (1), 43–60. doi:10.1007/s00281-019-00777-w
Karthiya, R., and Khandelia, P. (2020). m6A RNA Methylation: Ramifications for Gene Expression and Human Health. Mol. Biotechnol. 62 (10), 467–484. doi:10.1007/s12033-020-00269-5
Kianmeher, M., Ghorani, V., and Boskabady, M. H. (2016). Animal Model of Asthma, Various Methods and Measured Parameters: A Methodological Review. Iran J. Allergy Asthma Immunol. 15 (6), 445–465.
Kim, D., Langmead, B., and Salzberg, S. L. (2015). HISAT: a Fast Spliced Aligner with Low Memory Requirements. Nat. Methods 12 (4), 357–360. doi:10.1038/nmeth.3317
Kong, L., Zhang, Y., Ye, Z.-Q., Liu, X.-Q., Zhao, S.-Q., Wei, L., et al. (2007). CPC: Assess the Protein-Coding Potential of Transcripts Using Sequence Features and Support Vector Machine. Nucleic Acids Res. 35 (Web Server issue), W345–W349. doi:10.1093/nar/gkm391
Lan, Q., Liu, P. Y., Haase, J., Bell, J. L., Hüttelmaier, S., and Liu, T. (2019). The Critical Role of RNA M(6)A Methylation in Cancer. Cancer Res. 79 (7), 1285–1292. doi:10.1158/0008-5472.CAN-18-2965
Lertnimitphun, P., Zhang, W., Fu, W., Yang, B., Zheng, C., Yuan, M., et al. (2021). Safranal Alleviated OVA-Induced Asthma Model and Inhibits Mast Cell Activation. Front. Immunol. 12, 585595. doi:10.3389/fimmu.2021.585595
Liu, X., Yang, Q., Yang, M., Du, Z., Wei, C., Zhang, T., et al. (2021). Ultrasound-assisted Maillard Reaction of Ovalbumin/xylose: The Enhancement of Functional Properties and its Mechanism. Ultrason. Sonochem. 73, 105477. doi:10.1016/j.ultsonch.2021.105477
McEligot, A. J., Poynor, V., Sharma, R., and Panangadan, A. (2020). Logistic LASSO Regression for Dietary Intakes and Breast Cancer. Nutrients 12 (9), 2652. doi:10.3390/nu12092652
Melén, E. (2020). Asthma Genetics Revisited: Understanding Disease Mechanisms by Studying Ethnically Diverse Groups. Lancet Respir. Med. 8 (5), 427–429. doi:10.1016/S2213-2600(20)30044-8
Memczak, S., Jens, M., Elefsinioti, A., Torti, F., Krueger, J., Rybak, A., et al. (2013). Circular RNAs Are a Large Class of Animal RNAs with Regulatory Potency. Nature 495 (7441), 333–338. doi:10.1038/nature11928
Meng, J., Lu, Z., Liu, H., Zhang, L., Zhang, S., Chen, Y., et al. (2014). A Protocol for RNA Methylation Differential Analysis with MeRIP-Seq Data and exomePeak R/Bioconductor Package. Methods 69 (3), 274–281. doi:10.1016/j.ymeth.2014.06.008
Miki, H., Nakahashi-Oda, C., Sumida, T., and Shibuya, A. (2015). Involvement of CD300a Phosphatidylserine Immunoreceptor in Aluminum Salt Adjuvant-Induced Th2 Responses. J.I. 194 (11), 5069–5076. doi:10.4049/jimmunol.1402915
Munitz, A., Bachelet, I., and Levischaffer, F. (2006). Reversal of Airway Inflammation and Remodeling in Asthma by a Bispecific Antibody Fragment Linking CCR3 to CD300a. J. Allergy Clin. Immunol. 118 (5), 1082–1089. doi:10.1016/j.jaci.2006.07.041
Peixoto, P., Cartron, P.-F., Serandour, A. A., and Hervouet, E. (2020). From 1957 to Nowadays: A Brief History of Epigenetics. Ijms 21 (20), 7571. doi:10.3390/ijms21207571
Pernis, A. B., and Rothman, P. B. (2002). JAK-STAT Signaling in Asthma. J. Clin. Invest. 109 (10), 1279–1283. doi:10.1172/JCI1578610.1172/jci0215786
Pertea, M., Kim, D., Pertea, G. M., Leek, J. T., and Salzberg, S. L. (2016). Transcript-level Expression Analysis of RNA-Seq Experiments with HISAT, StringTie and Ballgown. Nat. Protoc. 11 (9), 1650–1667. doi:10.1038/nprot.2016.095
Roundtree, I. A., Evans, M. E., Pan, T., and He, C. (2017). Dynamic RNA Modifications in Gene Expression Regulation. Cell 169 (7), 1187–1200. doi:10.1016/j.cell.2017.05.045
Silverpil, E., and Lindén, A. (2012). IL-17 in Human Asthma. Expert Rev. Respir. Med. 6 (2), 173–186. doi:10.1586/ers.12.12
Sun, D., Yang, H., Fan, L., Shen, F., and Wang, Z. (2021). m6A Regulator‐mediated RNA Methylation Modification Patterns and Immune Microenvironment Infiltration Characterization in Severe Asthma. J. Cell. Mol. Medi 25, 10236–10247. doi:10.1111/jcmm.16961
Sun, L., Luo, H., Bu, D., Zhao, G., Yu, K., Zhang, C., et al. (2013). Utilizing Sequence Intrinsic Composition to Classify Protein-Coding and Long Non-coding Transcripts. Nucleic Acids Res. 41 (17), e166. doi:10.1093/nar/gkt646
Thorvaldsdottir, H., Robinson, J. T., and Mesirov, J. P. (2013). Integrative Genomics Viewer (IGV): High-Performance Genomics Data Visualization and Exploration. Brief. Bioinform. 14 (2), 178–192. doi:10.1093/bib/bbs017
Tiwari, A., Wang, A. L., Li, J., Lutz, S. M., Kho, A. T., Weiss, S. T., et al. (2021). Seasonal Variation in miR-328-3p and Let-7d-3p Are Associated with Seasonal Allergies and Asthma Symptoms in Children. Allergy Asthma Immunol. Res. 13 (4), 576–588. doi:10.4168/aair.2021.13.4.576
Wang, Q., Guo, X., Li, L., Gao, Z., Su, X., Ji, M., et al. (2020). N(6)-methyladenosine METTL3 Promotes Cervical Cancer Tumorigenesis and Warburg Effect through YTHDF1/HK2 Modification. Cell Death Dis 11 (10), 911. doi:10.1038/s41419-020-03071-y
Wang, Y., Zheng, Y., Guo, D., Zhang, X., Guo, S., Hui, T., et al. (2019). m6A Methylation Analysis of Differentially Expressed Genes in Skin Tissues of Coarse and Fine Type Liaoning Cashmere Goats. Front. Genet. 10, 1318. doi:10.3389/fgene.2019.01318
Wei, G., Almeida, M., Pintacuda, G., Coker, H., Bowness, J. S., Ule, J., et al. (2021). Acute Depletion of METTL3 Implicates N (6)-methyladenosine in Alternative Intron/exon Inclusion in the Nascent transcriptomeAcute Depletion of METTL3 Implicates N6-Methyladenosine in Alternative Intron/exon Inclusion in the Nascent Transcriptome. Genome Res. 31 (8), 1395–1408. doi:10.1101/gr.271635.120
Wu, F., Cheng, W., Zhao, F., Tang, M., Diao, Y., and Xu, R. (2019). Association of N6-Methyladenosine with Viruses and Related Diseases. Virol. J. 16 (1), 133. doi:10.1186/s12985-019-1236-3
Xiong, X., Hou, L., Park, Y. P., Molinie, B., Ardlie, K. G., Aguet, F., et al. (2021). Genetic Drivers of M(6)A Methylation in Human Brain, Lung, Heart and Muscle. Nat. Genet. 53 (8), 1156–1165. doi:10.1038/s41588-021-00890-3
Yang, Y., Chen, L., Gu, J., Zhang, H., Yuan, J., Lian, Q., et al. (2017). Recurrently Deregulated lncRNAs in Hepatocellular Carcinoma. Nat. Commun. 8, 14421. doi:10.1038/ncomms14421
Zaccara, S., Ries, R. J., and Jaffrey, S. R. (2019). Reading, Writing and Erasing mRNA Methylation. Nat. Rev. Mol. Cel Biol 20 (10), 608–624. doi:10.1038/s41580-019-0168-5
Zhang, B., Wu, Q., Li, B., Wang, D., Wang, L., and Zhou, Y. L. (2020). m(6)A Regulator-Mediated Methylation Modification Patterns and Tumor Microenvironment Infiltration Characterization in Gastric Cancer. Mol. Cancer 19 (1), 53. doi:10.1186/s12943-020-01170-0
Zhang, J.-A., Zhou, X.-Y., Huang, D., Luan, C., Gu, H., Ju, M., et al. (2020). Development of an Immune-Related Gene Signature for Prognosis in Melanoma. Front. Oncol. 10, 602555. doi:10.3389/fonc.2020.602555
Zhang, L., Lu, Q., and Chang, C. (2020). Epigenetics in Health and Disease. Adv. Exp. Med. Biol. 1253, 3–55. doi:10.1007/978-981-15-3449-2_1
Zhang, X.-O., Wang, H.-B., Zhang, Y., Lu, X., Chen, L.-L., and Yang, L. (2014). Complementary Sequence-Mediated Exon Circularization. Cell 159 (1), 134–147. doi:10.1016/j.cell.2014.09.001
Zhang, Z., Wang, Q., Zhang, M., Zhang, W., Zhao, L., Yang, C., et al. (2021). Comprehensive Analysis of the Transcriptome-wide m6A Methylome in Colorectal Cancer by MeRIP Sequencing. Epigenetics 16 (4), 425–435. doi:10.1080/15592294.2020.1805684
Zhao, B. S., Roundtree, I. A., and He, C. (2017). Post-transcriptional Gene Regulation by mRNA Modifications. Nat. Rev. Mol. Cel Biol 18 (1), 31–42. doi:10.1038/nrm.2016.132
Keywords: asthma, m6A, m6A-modified genes, MeRIP-seq, epigenetics
Citation: Sun D, Cai X, Shen F, Fan L, Yang H, Zheng S, Zhou L, Chen K and Wang Z (2022) Transcriptome-Wide m6A Methylome and m6A-Modified Gene Analysis in Asthma. Front. Cell Dev. Biol. 10:799459. doi: 10.3389/fcell.2022.799459
Received: 21 October 2021; Accepted: 19 April 2022;
Published: 30 May 2022.
Edited by:
Ann-Kristin Östlund Farrants, Stockholm University, SwedenReviewed by:
Sarath Chandra Janga, Indiana University-Purdue University Indianapolis, United StatesGuifeng Wei, University of Oxford, United Kingdom
Copyright © 2022 Sun, Cai, Shen, Fan, Yang, Zheng, Zhou, Chen and Wang. This is an open-access article distributed under the terms of the Creative Commons Attribution License (CC BY). The use, distribution or reproduction in other forums is permitted, provided the original author(s) and the copyright owner(s) are credited and that the original publication in this journal is cited, in accordance with accepted academic practice. No use, distribution or reproduction is permitted which does not comply with these terms.
*Correspondence: Zhen Wang, d2FuZ3poZW42MTBAc2luYS5jbg==
†These authors have contributed equally to this work
 Deyang Sun
 Xiaolu Cai
 Fenglin Shen
 Liming Fan1

