
94% of researchers rate our articles as excellent or good
Learn more about the work of our research integrity team to safeguard the quality of each article we publish.
Find out more
ORIGINAL RESEARCH article
Front. Cell Dev. Biol., 14 February 2022
Sec. Epigenomics and Epigenetics
Volume 10 - 2022 | https://doi.org/10.3389/fcell.2022.748862
This article is part of the Research TopicMetabolism and EpigeneticsView all 8 articles
 Si-si Luo1,2†
 Ke-xin Zou1,2†
 Hong Zhu3,4
 Yi Cheng3,4
 Yi-shang Yan5
 Jian-zhong Sheng5
 He-feng Huang2,3,4,5*
 Guo-lian Ding3,4*
Growing evidence suggests that adverse intrauterine environments could affect the long-term health of offspring. Recent evidence indicates that gestational diabetes mellitus (GDM) is associated with neurocognitive changes in offspring. However, the mechanism remains unclear. Using a GDM mouse model, we collected hippocampi, the structure critical to cognitive processes, for electron microscopy, methylome and transcriptome analyses. Reduced representation bisulfite sequencing (RRBS) and RNA-seq in the GDM fetal hippocampi showed altered methylated modification and differentially expressed genes enriched in common pathways involved in neural synapse organization and signal transmission. We further collected fetal mice brains for metabolome analysis and found that in GDM fetal brains, the metabolites displayed significant changes, in addition to directly inducing cognitive dysfunction, some of which are important to methylation status such as betaine, fumaric acid, L-methionine, succinic acid, 5-methyltetrahydrofolic acid, and S-adenosylmethionine (SAM). These results suggest that GDM affects metabolites in fetal mice brains and further affects hippocampal DNA methylation and gene regulation involved in cognition, which is a potential mechanism for the adverse neurocognitive effects of GDM in offspring.
Accumulating human and animal studies have revealed that the early developmental environment is closely related to the long-term health of offspring (Hanson and Gluckman, 2014). Gestational diabetes mellitus (GDM), with hyperglycemia in utero during pregnancy, has been increasing in last decade, surging from 2 to 6% in 2009 to 12–18% in 2020 (Alwan et al., 2009; Chiefari et al., 2017; Dalfrà et al., 2020). Previous studies have demonstrated that perinatal hyperglycemia could induce abnormal glucose metabolism in offspring (Ding et al., 2012; Chandna et al., 2015; Zhu and Zhang, 2016). Notably, maternal diabetes not only cause abnormal glucose tolerance and insulin secretion but also affects the development of the nervous system in offspring (Valle-Bautista et al., 2020; He et al., 2021). Both human cohort studies and experimental studies using rodent models have linked GDM with impaired cognitive abilities and decreased learning and memory in offspring (Kinney et al., 2003; Fraser et al., 2014; Bytoft et al., 2016; Daraki et al., 2017; He et al., 2017; de Sousa et al., 2019). However, the mechanisms that link GDM to the development of cognitive impairments in offspring have not been elucidated.
Intrauterine exposure to adverse environments may disrupt the normal development pattern of the fetus in the structure, physiology, and metabolism. Brain development is particularly sensitive to environmental influence during the early life stage (Lindsay et al., 2019). During the period of maternal GDM, the fetal brain was directly exposed to an intrauterine hyperglycemic environment before birth. Therefore, the offspring of GDM may also suffer from changes in brain function, behavior, and even the development of brain diseases (Aviel-Shekler et al., 2020). As a structure critical to cognitive processes, the hippocampus of the brain has been shown to undergo apoptotic cell death when subjected to hyperglycemic insult (Hami et al., 2013; Kuang et al., 2014; Haghir et al., 2017). Diabetes during pregnancy also influences the expression of genes associated with hippocampal development (Hami et al., 2013). However, the underlying mechanism of GDM-induced abnormal gene expression and regulation of the hippocampus remains obscure.
Epigenetic modifications such as DNA methylation provide a possible link between intrauterine hyperglycemia exposure early in development and cognitive disorders later in life. The status of DNA methylation is very sensitive to cell metabolism and nutritional status (Li et al., 2018; Muehlmann et al., 2020). Emerging studies have shown that metabolism influences the genomic status by regulating the enzymes for DNA methylation (Martínez-Reyes and Chandel, 2020). One carbon metabolism, composed of the folate and methionine cycle, generates universal methyl donor S-adenosyl-l-methionine (SAM), which is a substrate for DNA methyltransferases (DNMTs) (Mentch and Locasale, 2016). The tricarboxylic acid (TCA) generates metabolites that link energy pathways with epigenetic modifications. Alpha-ketoglutarate (α-KG) is a substrate for TET enzymes, flavin adenine dinucleotide (FAD) is an essential cofactor for the lysine demethylases LSD1 and LSD2 (Bartke and Schneider, 2020). Beside, succinic acid and fumaric acid can inhibit function of DNA demethylase–TETs (Martínez-Reyes and Chandel, 2020).
One of the most widely used drugs for diabetic animal model is streptozotocin (STZ), a chemical drug specifically inducing damage of β-cell of islet (Pasek and Gannon, 2013). In our present study, we established the mouse model of GDM by STZ injection of pregnant mice, which has been used in our previous studies (Ding et al., 2012; Zhu et al., 2019; Zou et al., 2021). We analyzed the ultrastructure of the hippocampus by electron microscopy. Then, we profiled the methylome and transcriptome of fetal hippocampi simultaneously to identify the key factors that were responsible for fetal cognitive dysfunction exposed to an intrauterine hyperglycemic environment. We further used a mouse model that mimicked clinical GDM and profiled the metabolome of fetal brains to explore the potential biochemicals and pathways involved in DNA methylation.
All animal protocols were approved by the Zhejiang University Animal Care and Use Committee. All experiments were performed with Institute of Cancer Research (ICR) mice. Eight-week-old virgin ICR females (n = 40) were mated with normal ICR males. Pregnancy was dated by the presence of a vaginal plug (designated day 0 [D0] of pregnancy). After a 12-h fast, the D0 females were randomly divided into a control group (Ctrl) and a GDM group. Mice in the GDM group were injected with a single intraperitoneal injection of streptozotocin (STZ; Sigma, St. Louis, MO) in 0.1 mmol/L citrate buffer (pH 4.5) at a dose of 150 mg/kg body weight. Control pregnant mice received an equal volume of citrate buffer. Blood glucose levels were measured at day 3, day 7 and day 18.5 of pregnancy via the tail vein, and diabetes was defined as a blood glucose level between 14 and 19 mmol/L as previously described (Ding et al., 2012). At embryonic day 18.5 (E18.5), the fetal mice were removed from 9 dams per group by abdominal cesarean section after immediate euthanization. Then, the meninges were carefully removed, and the hippocampi were dissected for electron microscopy (n = 4 per group) and analysis of the methylome and transcriptome (n = 3 per group) (Supplementary Figures S1A,C,D).
To further mimic the hyperglycemic environment in the middle and late trimesters of most clinical GDM, on day 6 and day 12 of pregnancy, females fasting for 8 h received an intraperitoneal injection of STZ as the late GDM group (n = 15). Pregnant females in the Ctrl group (n = 15) received an equal volume of citrate buffer. Blood glucose levels were measured via the tail vein, and diabetes was defined as a blood glucose level between 14 and 19 mmol/L (Zhu et al., 2019). At E18.5, the fetal mice brains were isolated from the dams by abdominal cesarean section after immediate euthanization. Then, untargeted metabolomics was performed on the whole brains of E18.5 fetal mice from Ctrl group (n = 7) and GDM group (n = 10) (Supplementary Figures S1B,D).
Samples (n = 4 per group) were fixed in 2.5% glutaraldehyde and postfixed with 3% osmium tetroxide (OsO4) for 2 h. The samples were dehydrated in a graded series of ethanol, embedded in Epon resin, sliced into 100 nm pieces and finally imaged with a transmission electron microscope at 80 kV (Hitachi, Japan, H7650 TEM).
Reduced representation bisulfite sequencing (RRBS) was performed in hippocampi obtained at embryonic day 18.5 from the Ctrl and GDM group (n = 3 per group) (Genergy Biotechnology Co., Ltd., Shanghai, China). Briefly, 5 μg genomic DNA was digested using the methylation-insensitive restriction enzyme MspI (New England Biolabs, Beverly, MA, United States). A Qiagen Mini Purification kit (Qiagen, Hilden, Germany) was used to purify the digested products. Then, the ends of each restriction fragment were filled in, and adenosine was added at the 3′-end. Methylated paired-end Illumina adapters were ligated to the ends of the DNA fragments using T4 DNA ligase, and fragments sized 100–200 bp were purified by agarose gel extraction. The purified fragments were treated with sodium bisulfite and then amplified by PCR. The final PCR products were sequenced on HiSeq 3,000 (Illumina Inc., San Diego, CA, United States).
Hippocampi from the Ctrl and GDM groups (n = 3 per group) were isolated from fetal mice and snap frozen in liquid nitrogen (for RNA-seq). Total RNA was isolated from hippocampi using Trizol. The purity of RNA was determined using a NanoDrop (Thermo, United States) spectrophotometer (OD260/280 is 1.8–2.2), and the integrity of RNA was assessed by electrophoresis (Tianneng, China) using agarose gel (28S:18S > 1.5). mRNA was enriched by magnetic beads with oligo (dT) and fragmented into 200 bp. RNA-seq libraries underwent 15 cycles of PCR amplification to obtain cDNA library. After RNA library construction, Qubit (Invitrogen, United States) was used to detect accurate RNA concentrations (≥500 ng/μl). Paired-end sequencing with a read length of 151 bp was conducted using the Illumina HiSeq3000 (Illumina Inc., San Diego, CA, United States) platform.
100 mg (±2%) of each sample was weighed and transferred into a 5 ml EP tube, which was prepared with 2 ml tissue extract (75% 9:1 methanol: chloroform, 25% ddH2O) (−20°C) and 3 steel beads, and then grinded for 60 s at 50 Hz in a high-throughput tissue grinder twice. Ultrasound-assisted extraction was processed at room temperature for 30 min and then the samples were put on ice for 30 min. After that, samples were centrifuged at 14,000 rpm for 20 min at 4°C and 1250 μl of the supernatant from each sample were transferred into another 2 ml centrifuge tube. Then, samples were concentrated to dry in vacuum and dissolved with 200 μl 2-chlorobenzalanine (4 ppm) 50% acetonitrile solution and the supernatant was filtered through 0.22 µm membrane to obtain the prepared samples for LC-MS. Every 20 ul of each sample was mixed as a quality control (QC) sample. The rest of the samples were used for LC-MS detection.
Chromatographic separation was accomplished in a Thermo Ultimate 3,000 system equipped with an ACQUITY UPLC® HSS T3 (150 × 2.1 mm, 1.8 μm, Waters) column maintained at 40°C. The temperature of the autosampler was 8°C. Gradient elution of analytes was carried out with 0.1% formic acid in water (C) and 0.1% formic acid in acetonitrile (D) or 5 mM ammonium formate in water (A) and acetonitrile (B) at a flow rate of 0.25 ml/min. Injection of 2 μl of each sample was performed after equilibration. An increasing linear gradient of solvent B (v/v) was used as follows: 0–1 min, 2% B/D; 1–9 min, 2–50% B/D; 9–12 min, 50–98% B/D; 12–13.5 min, 98% B/D; 13.5–14 min, 98–2% B/D; 14–20 min, 2% D-positive model (14–17 min, 2% B-negative model).
The ESI-MSn experiments were executed on a Thermo Q Exactive mass spectrometer with spray voltages of 3.8 kV and −2.5 kV in positive and negative modes, respectively. Sheath gas and auxiliary gas were set at 30 and 10 arbitrary units, respectively. The capillary temperature was 325°C. The analyzer scanned over a mass range of m/z 81–1,000 for full scan at a mass resolution of 70,000. Data-dependent acquisition (DDA) MS/MS experiments were performed with HCD scans. The normalized collision energy was 30 eV. Dynamic exclusion was implemented to remove some unnecessary information in MS/MS spectra.
RRBS data were analyzed using the R package minfi for raw data preprocessing (quality control and normalization). RRBS reads were mapped to the reference mouse genome (mm10) by Bismark (version 0.16.3). DSS V2.30.1 in R was used to detect DMLs. Differentially methylated loci (DMLs) were analyzed based on a Bayesian approach (Feng et al., 2014) and were summarized as follows: two groups were modeled according to the Bayesian stratification model, and the Wald test was applied to each locus to obtain a p-value for each CpG site. For each CpG site, a difference in methylation value between two groups ≥5% and a posteriori probability of Wald test ≥0.95, or p-value < .01 was considered to be a differentially methylated loci (DML). A methylation region was defined as a differently methylated regions (DMR) when it met the following three criteria: 1) the length of this region was at least 50 bp; 2) the region contained no less than three CpG sites; and 3) the proportion of DMLs in this region was no less than 50%. When a DMR showed no less than 50% overlap with one element of the gene, it was defined as a differentially methylated gene (DMG).
Quality control of the raw and trimmed reads of RNA-seq was performed using FastQC (v0.11.5). The STAR (2.5.3a) software package performed the task that mapped high-throughput sequencing reads to a reference genome in RNA-seq data analysis (Dobin et al., 2013). The DEseq2 package v1.16.1 in R was used to identify the differentially expressed genes (DEGs) in GDM hippocampi compared with the Ctrl group (Love et al., 2014). The t-test and Benjamini–Hochberg method were used to calculate the p-value and FDR, respectively. By using a stringent threshold and significant criteria of FDR <0.05 and >1.2-fold change or <0.833-fold change, a total of 953 DEGs were screened out.
Metabolites were identified according to their exact molecular weight and the MS/MS fragmentation pattern by a comparison with those in the online Metlin database (http://metlin.scripps.edu), MoNA (https://mona.fiehnlab.ucdavis.edu//). The mass error was 15 ppm. Score plots of orthogonal partial least-squares discriminant analysis (OPLS-DA) clearly separated the GDM group from the control group. The variable importance in projection (VIP) generated in OPLS-DA processing represented the contribution to the discrimination of each metabolite ion between groups. The t-test was used to calculate the p-value. The significantly differential metabolites were identified using the threshold of p-value < .05 and VIP ≥1. MetaboAnalyst 4.0 (www.metaboanalyst.ca) was used for metabolic pathway analysis based on the Kyoto Encyclopedia of Genes and Genomes (KEGG) database. Enrichment for each identified pathway was calculated using Fisher’s exact test and p-value < .05 was considered statistically significant.
ClusterProfiler V3.8.0 in R was used to identify and visualize the gene ontology (GO) terms and KEGG pathways enriched by the DMGs and shared genes of DEGs and DMGs. To identify the function of the aforementioned DEGs, KEGG analyses were performed by Cytoscape ClueGO (v2.5.7) and CluePedia (v1.5.7). Gene enrichment for each identified pathway was calculated using Fisher’s exact test and p-value was set to .05.
To screen for functional networks among the differentially methylated and expressed genes, we employed the Functional Networks of Tissues in Mouse (FNTM) prediction tool for mouse tissue-specific protein interactions, which integrates genomic data and prior knowledge of gene function (Goya et al., 2015). We used the hippocampus tissue database and only kept edges with a relationship confidence greater than 0.75.
An interactome network model integrating transcriptomics and metabolomics was constructed with Cytoscape MetScape (v3.1.3).
Statistical analyses of results of metabolites content were performed with GraphPad Prism (version 8.0). Statistical significance was determined by two-tailed unpaired Student’s t-test. p-value < .05 was considered statistically significant.
We used transmission electron microscopy (TEM) to examine nuclei in the CA1 region of hippocampal neural cells. In a part of neurons, the chromatin aggregated into several clumps (Figure 1D, arrows); the shape of the nucleus was irregular; and the invaginations of nucleolemma became evident indicating the shrinkage of the nuclei (Figure 1D, asterisk), suggesting that the nuclei of neural cells were impaired in the GDM group compared to the Ctrl group (Figure 1).
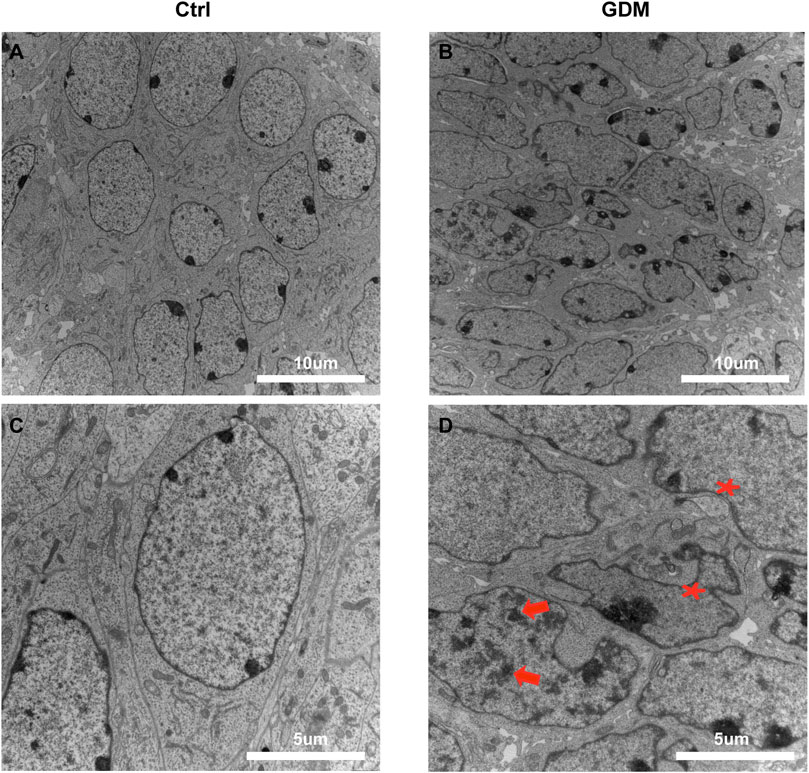
FIGURE 1. Ultrastructure of the hippocampus in fetal mice using transmission electron microscopy. (A,C) Neural cells of the fetal hippocampus via transmission electron microscopy in the Ctrl group. Scale bar, 5 μm (A); Scale bar, 2 μm (C). (B,D) Neural cells of the fetal hippocampus via transmission electron microscopy in the GDM group. Scale bar, 5 μm (B); Scale bar, 2 μm (D). In GDM group, the chromatin aggregated into several clumps (arrows); the shape of the nucleus was irregular; and the nuclei shrinkage was obvious (asterisk).
We performed RRBS to search for DMRs in GDM group vs. Ctrl group. Initial principal component analysis (PCA) of DMLs revealed a clear distinction between GDM and control samples (Supplementary Figure S2; Supplementary Table S1). The distribution of DMRs in the different functional components of the genome was illustrated in Figure 2A in the upstream 2 k (5.64%), 5′-untranslated region (5′-UTR, 1.06%), coding sequence (CDS, 11.06%), introns (37.31%), 3′-UTR (3.11%), downstream 2 k (4.4%), and other elements (37.42%) of genes. In GDM group, a total of 429 DMR-related genes had lower methylation levels, and 321 DMR-related genes had higher methylation levels (Supplementary Table S2). The top 10 hypomethylated genes (Rbm19, Tox2, Erg, Irs1, Sox5, Sorcs3, Sgol2b, Specc1, Gm5441, Ptprn2) and hypermethylated genes (Unc45bos, Unc45b, Ash1L, Olah, Serpinf2, Tmco1, Lyst, Wdr66, Gm20388, Fendrr) were shown in Figure 2B. Among them, Sox5 controls neural differentiation and genesis (Lai et al., 2008). Sorcs3 is a stronger regulator of glutamate receptor functions compared to GABAergic mechanisms in the hippocampus (Christiansen et al., 2017). The top 10 terms of the GO biological process analysis were shown in Figure 2C, among which “dendrite development,” “regulation of dendrite development,” and “synapse organization” were thought to be important for cognition, learning and memory. In addition, the top 20 pathways of KEGG enrichment were shown in Figure 2D, and some of these enriched terms were involved in “axon guidance,” “glutamatergic synapse,” and “long-term depression,” which were closely related to cognitive function.
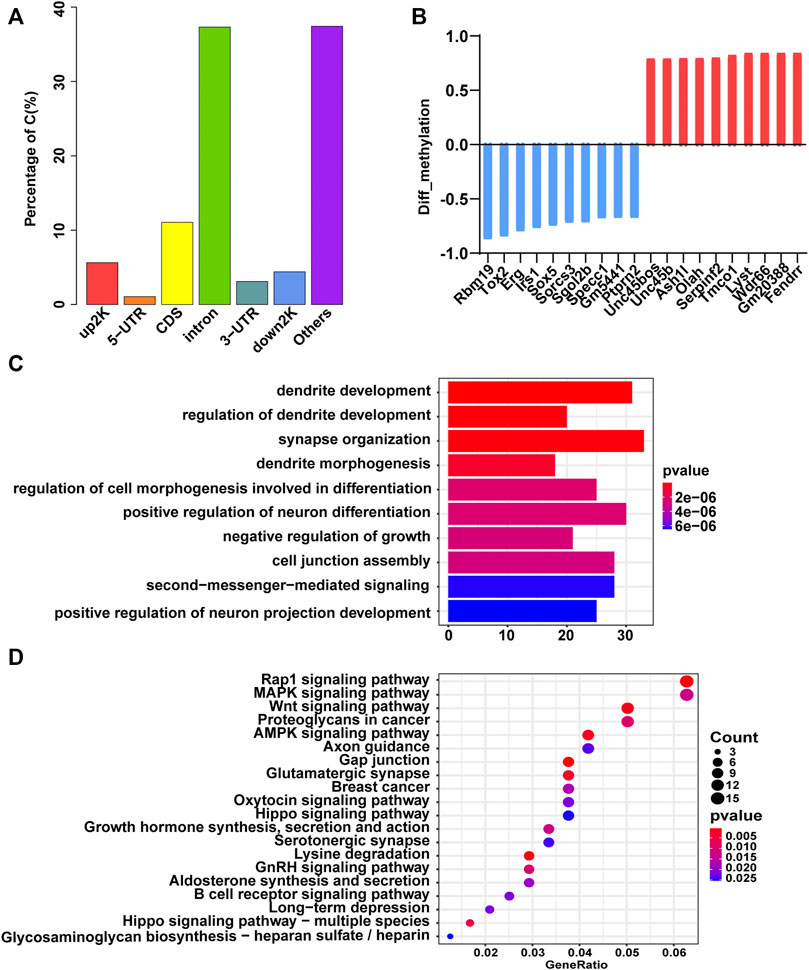
FIGURE 2. Gene methylation analysis of the GDM and control groups. (A) Bar plot of the distribution of differentially methylated loci in different components of the genome. (B) The top 10 hypomethylated (blue) and hypermethylated (red) genes. (C) GO terms of biological process enriched by DMGs. The color gradient from dark blue to dark red indicates smaller p-value. (D) Bubble plot of the top 20 Kyoto Encyclopedia of Genes and Genomes (KEGG) enrichment results of DMGs. The size of the circle corresponds gene number enriched in the pathway. The color gradient from dark blue to dark red indicates smaller p-value.
The gene expression profiles of fetal mice hippocampi at embryonic day 18.5 from the Ctrl and GDM groups were analyzed using RNA-seq. Initial principal component analysis (PCA) revealed a clear distinction between GDM and control samples (Figure 3A). By using a stringent threshold and significant criteria of FDR <0.05 and fold change >1.2, a total of 953 DEGs, including 378 up-regulated and 575 down-regulated genes, were identified in the GDM group compared to the Ctrl group (Figure 3B, Supplementary Table S3). Among the top 20 DEGs, 11 genes (Ndufaf4, Nrgn, Hap1, Sv2b, Slc12a5, Sncb, Caln1, Kcnma1, Abi1, Trim9, Shroom2) were down-regulated, and 9 genes (Hmgb2, Kctd20, H1f0, Rnf13, Atg7, Knstrn, Csnk1g1, Crk, Gm26786) were up-regulated (Figure 3C). Nrgn is expressed exclusively in the brain, particularly in dendritic spines and has been implicated in hippocampal plasticity. Hap1 depletion impaired postnatal neurogenesis in the dentate gyrus (DG) of the hippocampus (Xiang et al., 2015). Sv2b has been shown to be involved in the regulation of synaptic vesicle exocytosis and plays a role in neuronal excitability (Stout et al., 2019). Caln1 participates in the regulation of trans-synaptic signaling (Reshetnikov et al., 2020).
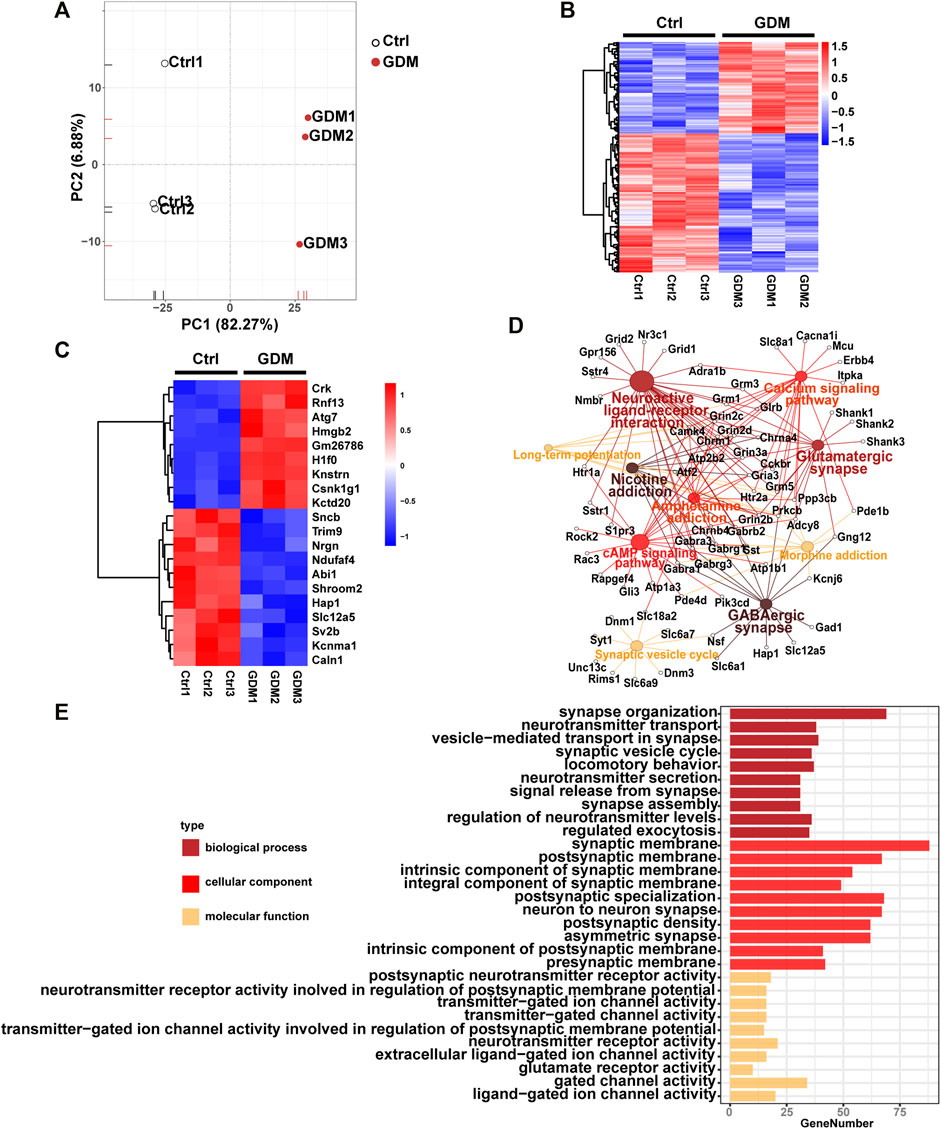
FIGURE 3. Gene expression analysis of the GDM and control groups. (A) Supervised PCA of DEGs. (B) Hierarchically clustered heatmap of DEGs. Data are expressed as Z score-normalized values of FPKM. The color gradient from dark blue to dark red in the heatmap indicates increasing transcript levels. (C) The top 10 down-regulated and up-regulated genes. Data are expressed as Z score-normalized values of FPKM. The color gradient from dark blue to dark red in the heatmap indicates increasing transcript levels. (D) Top 10 Kyoto Encyclopedia of Genes and Genomes (KEGG) pathways of DEGs. The solid circle represents the enriched pathway. The open circle represents genes enriched in the KEGG pathways. A larger size of a solid cycle means more enriched genes. The deeper color of the solid cycle represents a lower p value. (E) Gene ontology (GO) enrichment of DEGs, including BP (biological process), CC (cellular component), and MF (molecular function).
Functional enrichment analysis identified KEGG pathways including “GABAergic synapse,” “neuroactive ligand-receptor interaction,” “glutamatergic synapse,” “cAMP signaling pathway,” “synaptic vesicle cycle” and “long-term potentiation” related to brain cognition. The top 10 KEGG pathways were illustrated in Figure 3D. In addition, GO analysis revealed that the terms “synapse organization,” “neurotransmitter transport,” “signal release from synapse,” “neuron to neuron synapse” and “postsynaptic neurotransmitter receptor activity” were enriched (Figure 3E).
We further identified DNA methylation changes linked to gene expression differences in fetal mice hippocampi in the GDM group compared with the Ctrl group. A Venn diagram was constructed to illustrate 43 shared genes of the methylome and transcriptome (Figure 4A). A scatter diagram of the 4-quadrant plots showed that 16 genes (Cdipt, Mfhas1, Slc7a14, Gm38393, Pcdha6, Paqr9, Rexo2, Tbc1d30, Akap6, Kcnf1, Sv2c, Arhgap26, Ank1, Arhgap23, Shank2, Sez6l) were identified as hypermethylated and down-regulated, and 9 genes (Thtpa, Sema5b, Lima1, Gse1, Tmem98, Mpped2, Peg12, Mcm10, Mid1) were hypomethylated and up-regulated in the GDM group. The other 18 genes did not show a canonical association of gene expression and methylation status (Figure 4B).
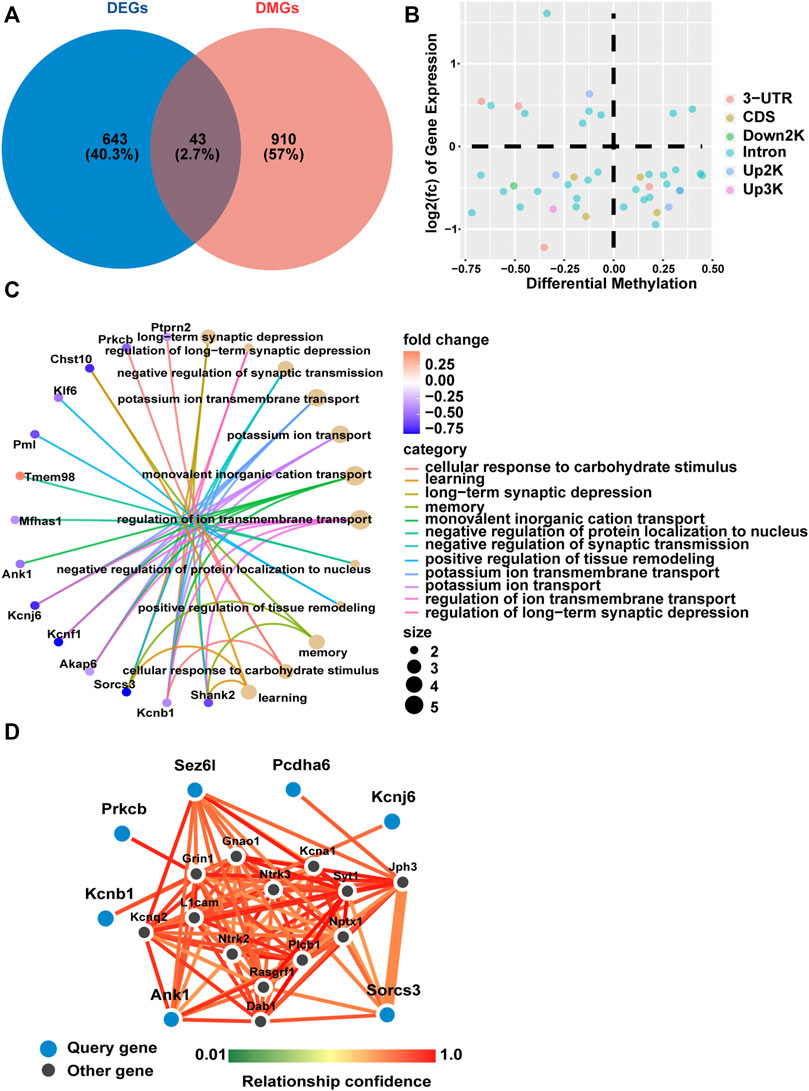
FIGURE 4. Gene expression and methylation co-analysis. (A) Venn diagram illustrating the overlap of differentially expressed genes and differentially methylated genes. (B) Relationship of transcriptomic (y-axis) and methylation (x-axis) profiling based on overlapping genes of DEGs and DMGs. Different colors represent different methylated positions in gene elements. (C) Gene ontology (GO) enrichment analysis of biological process (BP) based on shared genes of RNA-seq and RRBS. The color gradient from dark purple to dark pink in the heatmap indicates fold change of DEGs. The bubble size is related to the impact of the pathway. (D) Network analysis based on differentially methylated and differentially expressed genes with a relationship confidence greater than 0.75. Larger blue circles indicate candidate genes identified from our analysis, and smaller black circles denote imputed interacting genes in the hippocampus.
GO analysis showed that the above overlapping genes were mainly enriched in “long-term synaptic depression,” “negative regulation of synaptic transmission” and “learning and memory” (Figure 4C). Functional enrichment analysis identified 17 KEGG pathways that were significantly different between the GDM and Ctrl groups. The top 10 KEGG pathways included “GABAergic synapse,” “glutamatergic synapse,” “serotonergic synapse” and “dopaminergic synapse,” mainly relating to information transfer and cognition (Supplementary Figure S3).
Among all 43 genes that were differentially methylated and expressed, we obtained the seven most functionally connected predicted interactor genes visualized using the FNTM tool (Pcdha6, Ank1, Sez6l, Kcnb1, Kcnj6, Prkcb, Sorcs3) (Figure 4D), all of which were down-regulated in transcriptome profiling. These genes are involved in synapse signal transmission, such as Kcnj6 and Prkcb, and function in cognition, such as Ank1, Kcnb1 and Sorcs3.
The UPLC-MS-based metabolic profiling method was performed to explore the potential biochemicals involved in the epigenetic regulation of the GDM group. The GDM group could be distinguished from the Ctrl group in the OPLS-DA score plot in both positive and negative ionization modes, which suggested that intrauterine hyperglycemia could induce distinct changes in fetal brain metabolites (Figures 5A,B).
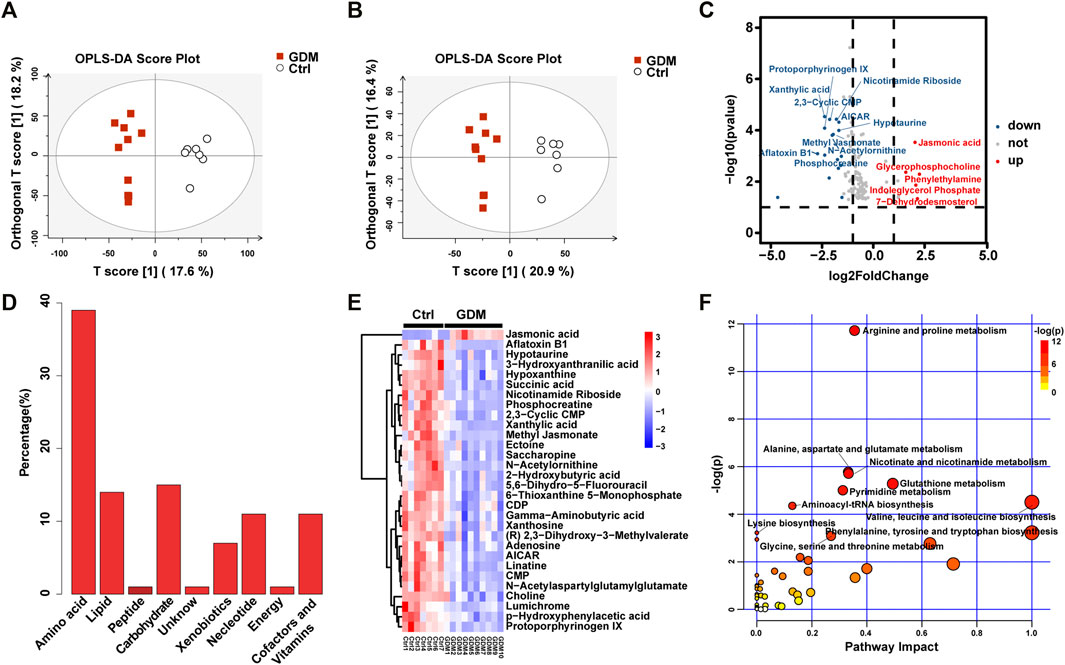
FIGURE 5. Metabolite analysis of the GDM and control groups. (A) Orthogonal partial least squares discriminant analysis (OPLS-DA) in positive and (B) negative ion mode was utilized to display the variance of the samples. (C) The volcano indicates the changes in fetal brain metabolite profiles. Metabolites up-regulated or down-regulated by |log2FoldChange| > 1.5 are shown in red and blue, respectively. (D) Bar plot of classification of the detected metabolites into major functional classes. (E) Heatmap presentation of the top 30 differential metabolites in fetal brains. (F) Different metabolic pathways in GDM fetal brains. Each bubble represents a metabolic pathway. The bubble size is related to the impact of the pathway and color (varying from yellow to red) means the metabolites are in the data with different levels of significance.
In total, 123 significantly differential metabolites were identified in fetal brain tissues using the threshold of p < .05 and VIP ≥ 1, of which 8 up-regulated and 115 down-regulated in GDM group (Supplementary Table S4). Metabolites determined under the condition of |log2FoldChange| > 1.5 are shown in Figure 5C. Differential metabolites were in various classes, including “amino acid” (39%), “nucleotide” (11%), “carbohydrate” (15%), “lipid” (14%), “cofactors and vitamins” (11%), “xenobiotics” (7%), “peptide” (1%) and “energy” (1%) (Figure 5D). The top 30 metabolites included nicotinamide riboside, AICAR, gamma-aminobutyric acid, 2-hydroxybutyric acid, methyl jasmonate, choline, 3-hydroxyanthranilic acid and adenosine, most of which were related to cognition (Figure 5E). Further target metabolic pathways were screened out according to enrichment analysis (p value < .05) and pathway topological analysis (impact value >0.10). A total of 51 metabolic pathways were altered in response to intrauterine hyperglycemia, including “cysteine and methionine metabolism,” “citrate cycle (TCA cycle),” “pantothenate and CoA biosynthesis,” and “one carbon pool by folate,” (Figure 5F, Supplementary Table S5). In the GDM fetal brains, metabolites related to epigenetic modification were significantly down-regulated, including betaine, fumaric acid, L-methionine, succinic acid, 5-methyltetrahydrofolic acid, and S-adenosylmethionine (SAM) (Figure 6).
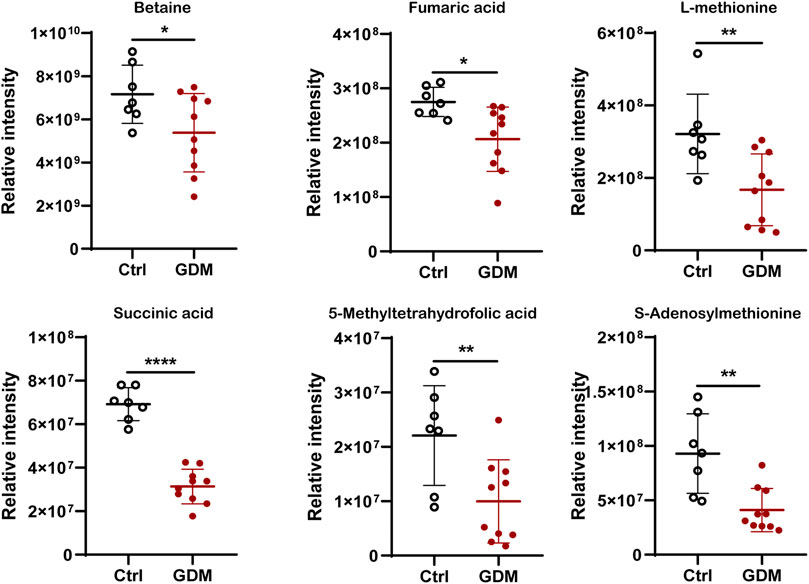
FIGURE 6. Comparison of the intensity of representative metabolites related to epigenetic modification between the control and GDM groups. *p < .05 vs. Control; **p < .01 vs. Control; ** **p < .0001 vs. Control.
An interactome network model integrating the transcriptome and metabolome was generated, which connected pathways via gene-metabolite interactions. Analysis of this interactome network demonstrated that several critical metabolic processes were altered in the brains of GDM fetal mice, including “TCA cycle,” “tryptophan metabolism,” “tyrosine metabolism” (Figure 7). Other pathways included “purine metabolism,” and “urea cycle” and “metabolism of arginine, proline, glutamate, aspartate and asparagine” (Supplementary Figures S4, S5). The DEGs and differential metabolites associated with these pathways are presented in Table 1. Predicted genes were mostly belong to gene families such as cytochromeP450 family, which was likely to play roles in “tryptophan metabolism” and “tyrosine metabolism.” Predicted compounds such as citrate, succinyl-CoA in TCA cycle may interact with input compound and genes and co-mediate cognition disorder in GDM offspring. The results suggested that amino acid metabolism and TCA cycle may be the key processes associated with cognition of GDM offspring.
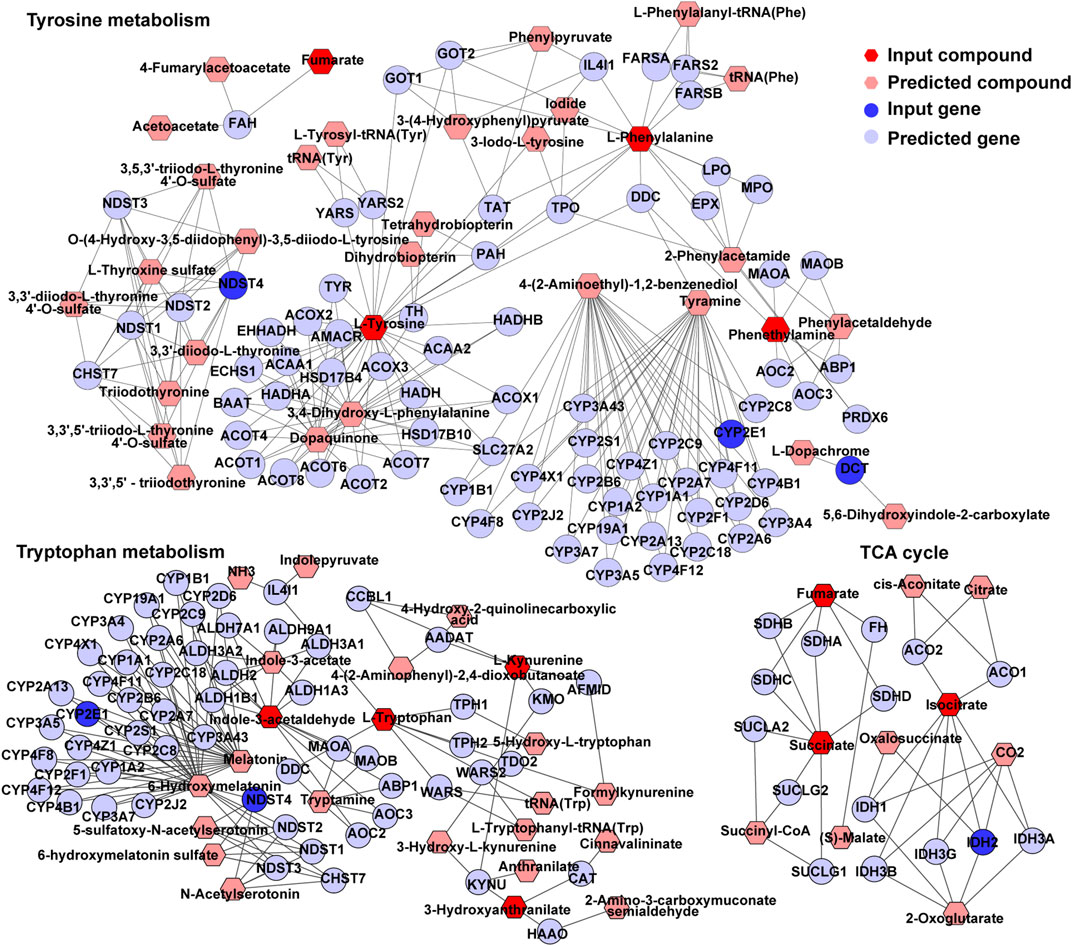
FIGURE 7. TCA cycle, tryptophan metabolism, and tyrosine metabolism in visual representation of the interaction between the transcriptome and metabolome. Dark blue circles represent differentially expressed genes; light blue circles represent inferred gene; dark red hexagons represent significantly changed metabolites; light red hexagons represent inferred metabolite; gray lines represent protein-protein or protein-metabolite interactions.
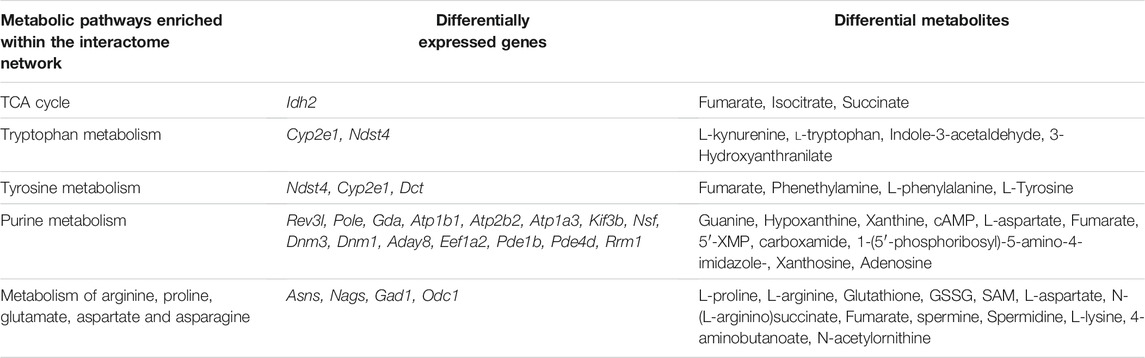
TABLE 1. Metabolic pathways identified in the interactome network, incorporating gene transcription and metabolite profiles.
The cognitive deficits of GDM offspring have been investigated for years in both epidemiological and experimental studies (Huerta-Cervantes et al., 2020; De Sousa, 2021). To explore the potential molecular mechanism, we are the first to profile the methylome and transcriptome simultaneously in the hippocampi of fetal GDM mice. Genomic and bioinformatic analysis showed that in the GDM group, differentially methylated and expressed genes were enriched in neural signal transmission of the synapse and cognitive function. We further performed a metabolome analysis of GDM fetal mice brains and found differential metabolites involved in one-carbon metabolism (including SAM, betaine, L-methionine and 5-methyltetrahydrofolic acid) and the TCA cycle (including succinic acid and fumaric acid) that affect DNA methylation modification.
The hippocampus has long been considered serving a critical function in cognition. Diabetes-induced cognitive impairment shows the ultrastructural of hippocampus (Liu et al., 2020). Neuronal degeneration and nucleus shrinkage in the hippocampus were also found in mice with d-galactose-induced cognitive dysfunction (Tu et al., 2018). Our ultrastructural data of hippocampi in fetal mice indicated irregular nucleus shapes and obvious nucleus shrinkage, which may be related to hippocampal deficits, indicating neurodegeneration in the central nervous system of GDM fetuses. This change may be one of the explanations of behavioral dysregulation in GDM offspring in previous studies.
It has been shown that maternal diabetes induces oxidative stress and reactive oxygen species (ROS) accumulation, which in turn alter the DNA methylation status in the early embryo (Li et al., 2005; Giacco and Brownlee, 2010). However, changes in DNA methylation in the fetal hippocampus of GDM have not been reported. In our study, the enrichment analysis of DMGs suggested changes in synapse signal transmission in the hippocampi of the GDM group. Methylome profiling revealed that the top DMGs were mostly involved in cognition and synapse changes. Previous study showed down-methylation of Irs1 in patients with cognition disorder; Sox5, as a transcription factor, is a critical modulator of neurite outgrowth (Naudet et al., 2018); Sorcs3 controls the proper positioning and mobility of glutamate receptors in the postsynaptic density, which is crucial to synaptic function and plasticity (Christiansen et al., 2017); and Specc1 has a strong link to cognitive abilities by remodeling small GTPases in the cytoskeleton (Maroteaux et al., 2012). Ash1L is a kind of histone methyltransferase. The mutation or loss of Ash1L may cause autistic-like behaviors (Satterstrom et al., 2020; Gao et al., 2021); and low expression of Serpinf2 is related to Alzheimer’s disease (De Jager et al., 2014). Fendrr has been proven to be significantly increased in the brains of diabetes patients (Wang et al., 2021). The development of the nervous system is under the strict control of a number of signal transduction pathways, which are often interconnected. The enrichment analysis of DMGs suggested changes in synapse signal transmission in the hippocampi of the GDM group. Previous studies revealed that dendrite development and its plasticity regulation subserve cognitive functions in the brain (Forrest et al., 2018).
The top DEGs have particular roles in cognition and neurodevelopment. Nrgn can modulate synaptic plasticity by encoding neurogranin, and a decrease in neurogranin leads to cognitive deficiency (Hwang et al., 2021). Knockdown of Hap1 promotes specification of supernumerary axons in primary hippocampal neurons and promotes disorders of cognition (Mejia et al., 2013). Hap1 was enriched in the “GABAergic synapse” in the KEGG pathway of DEGs. The reduced expression of Slc12a5 plays a key role in neurodevelopmental delay (Hinz et al., 2019). Trim9 deletion alters the morphogenesis of developing and hippocampal neurons and impairs spatial learning and memory (Winkle et al., 2016). In our data, those genes displayed an identical down-regulated trend. The function of these DEGs includes regulation of synapse organization and neurotransmitter transport, which is consistent with the result of hippocampal transcriptome in adult offspring of GDM in our previous study (Zou et al., 2021). This suggests that the effects of intrauterine hyperglycemia on the fetal hippocampus will continue into adulthood.
By overlapping the sequencing results of the methylome and transcriptome, we identified genes such as Shank2, Ank1, Sez6l and Sema5b, which were differentially methylated and expressed in the fetal hippocampus of GDM as factors that may contribute to the cognitive deficits caused by intrauterine hyperglycemia. Shank2 was hypermethylated and down-regulated. A previous study showed that mutant mice carrying Shank2 deletions exhibited behavioral defects (Monteiro and Feng, 2017); overexpression of full-length Sema5b in hippocampal neurons reduced synapse number (O’Connor et al., 2009). Functionally connected predicted interactor genes were all down-regulated in transcriptome profiling, including 3 hypermethylated genes (Pcdha6, Ank1, Sez6l) and 4 hypomethylated genes (Kcnb1, Kcnj6, Prkcb, Sorcs3). Pcdha6 showed decreased expression in psychiatric illness (Srikanth et al., 2018). Methylome profiling implicates hypermethylation of Ank1 in Alzheimer’s disease (Lunnon et al., 2014). Sez6 has been shown to influence synapse numbers and dendritic morphology, and Sez6 TKO mice have impaired motor learning and negatively affected motor coordination (Nash et al., 2020; Qiu et al., 2021).
These changes highlight the importance of epigenetic regulation in environmentally induced diseases affecting neurocognition. DNA methylation refers to the transfer of the methyl group provided by SAM to the 5-position carbon atom of cytosine (Su et al., 2016). In GDM fetal brains, metabolomic analysis data showed decreased levels of SAM, indicating the mechanism of DNA methylation alteration induced by intrauterine hyperglycemia. Emerging studies have shown that metabolites can regulate DNA methylase activity. Metabolomics identified six down-regulated metabolites, fumaric acid, betaine, L-methionine, succinic acid, 5-methyltetrahydrofolic acid, and SAM, which may influence the methyl donor pool. One-carbon metabolism links the maternal environment with epigenetic regulation and early development (James et al., 2018). Betaine functions primarily as a methyl donor substrate in one-carbon metabolism to convert homocysteine to methionine by betaine homocysteine methyltransferase (BHMT), which is critical for embryonic and fetal development. Methionine then converts to SAM, the universal methyl donor for DNA and protein methylation processes that are essential for epigenetic gene regulation (Zhao et al., 2017). 5-Methyltetrahydrofolate was used as a methyl donor to catalyze the remethylation of homocysteine to methionine (Froese et al., 2019). Additionally, succinate and fumarate can compete with α-ketoglutarate in the active site of TETs, inhibiting their function (Hitchler and Domann, 2012). Thus, decreased succinate and fumarate could also lead to hypomethylation of the DNA. Additionally, our present study just showed a greater number of genes with hypomethylation in the fetal hippocampus exposed to GDM, the global DNA methylation status should be validated by the other technologies in the future research.
In addition to affecting methylation status, some metabolites may directly induce cognitive dysfunction in GDM fetal offspring. Succinic acid decreased in mice with a deterioration of spatial learning and memory (Ning et al., 2018). Nicotinamide riboside was reported to be beneficial for hippocampal neurodevelopment (Ear et al., 2019). AICAR can improve cognition in young and aged mice (Kobilo et al., 2014). GABA, a necessary neurotransmitter, alters cognitive dysfunctions in depression and other brain disorders (Prévot and Sibille, 2021). Methyl jasmonate may be useful in conditions associated with memory dysfunctions or age-related cognitive decline (Eduviere et al., 2015). Choline is a micronutrient and a methyl donor that is required for normal brain growth and development and produces profound benefits on cognition (Velazquez et al., 2019).
The interactome network of the transcriptome and metabolomics showed changes in amino acid metabolism, TCA cycle and purine metabolism. Previous study showed pathways involved in the metabolism of amino acids and tricarboxylic acid cycle (TCA) were enriched in metabolites whose levels were higher in the neonatal brains (Chen et al., 2021). Amino acids are vital for proper neurodevelopment, as they comprise the most abundant neurotransmitters in the brain and act as neurotransmitter precursors and neurotrophic factors, which induce synaptogenesis and neuronal proliferation (Martínez García et al., 2018). Evidence has accumulated in the last decades pointing to a contribution of purines to brain development including embryonic neurogenesis, migration of principal neurons and interneurons, guidance for neuronal connectivity, synaptogenesis and synaptic stability/elimination (Rodrigues et al., 2019). Thus, the change of amino acid metabolism, TCA cycle and purine metabolism will be associated with dysfunction of brain development. This result built a latent relationship of differential metabolites and DEGs in the pathway and provided a new sight into the molecular mechanism of cognitive dysfunction in GDM, which deserve further attention in our future research.
Our study provides novel experimental evidence about the adverse effects of intrauterine hyperglycemia of GDM on fetal hippocampus, combined with our previous study of cognition in GDM adult offspring, revealing that the fetal brain is very sensitive to intrauterine metabolic disorders. Although our findings were generated in mouse model, it is important to recognize that if exposed to maternal GDM environment, the long-term health follow-ups and lifestyle interventions are necessary to the offspring. Meanwhile, the findings indicate that the most important and effective way to reduce the risk of offspring is to detect and intervene metabolic abnormalities in earlier pregnancy period, and eliminate the risk factors of gestational diabetes. The main limitations of this study are the small sample size. Despite the consistency within the group, which is probably enough to garner some key information, in the future research more sample are needed to validate the findings. The potential mechanism between metabolites and epigenetic regulation is worth further study.
Our findings suggest the underlying mechanism for the developmental change of fetal hippocampus exposed to maternal gestational diabetes. GDM exposure induced hippocampal nucleus shrinkage in the CA1 area and changed gene methylation and expression of the hippocampus, as well as metabolites in the brain. Mechanistically, our data provide novel evidence that intrauterine hyperglycemia exposure alters methylation status, which may be affected by brain metabolism, and leads to gene changes contributing to cognitive disorders in GDM offspring.
Publicly available datasets were analyzed in this study. This data can be found here: Metabolomics: www.ebi.ac.uk/metabolights/MTBLS3181 RRBS: https://www.ncbi.nlm.nih.gov/sra/PRJNA731602 RNA-seq: https://www.ncbi.nlm.nih.gov/sra/PRJNA731601.
The animal study was reviewed and approved by Zhejiang University Animal Care and Use Committee.
G-lD conceived the study. G-lD and H-fH designed research. S-sL, K-xZ, HZ, YC, and G-lD performed research. S-sL, HZ, and G-lD analyzed the data. S-sL, K-xZ, and G-lD interpreted the data. S-sL and G-lD wrote the manuscript. All authors substantially contributed to this study.
The work was supported by the National Key Research and Development Plan (2021YFC2701102), National Natural Science Foundation of China (81971458 and 82088102), Shanghai Frontiers Science Center of Reproduction and Development, the Innovative Research Team of High-level Local Universities in Shanghai, and the Strategic Collaborative Research Program of the Ferring Institute of Reproductive Medicine, Ferring Pharmaceuticals and Chinese Academy of Sciences (FIRMA180309). The study was also supported by CAMS Innovation Fund for Medical Sciences (CIFMS) (No. 2019-I2M-5-064) and Collaborative Innovation Program of Shanghai Municipal Health Commission (2020CXJQ01).
The authors declare that the research was conducted in the absence of any commercial or financial relationships that could be construed as a potential conflict of interest.
All claims expressed in this article are solely those of the authors and do not necessarily represent those of their affiliated organizations, or those of the publisher, the editors and the reviewers. Any product that may be evaluated in this article, or claim that may be made by its manufacturer, is not guaranteed or endorsed by the publisher.
The Supplementary Material for this article can be found online at: https://www.frontiersin.org/articles/10.3389/fcell.2022.748862/full#supplementary-material
Supplementary Figure S1 | Experimental study design. (A) A hyperglycemic environment lasted throughout pregnancy, and the hippocampus was isolated from the fetus at embryonic day 18.5. (B) A hyperglycemic environment appeared in the middle and late trimesters of most clinical GDM cases, and brains were isolated from the fetus at embryonic day 18.5. (C) Maternal glucose levels at day 3, day 7 and day 18.5 of pregnancy in the first model. (D) Cross-talk of the methylome and transcriptome from the hippocampus and metabolomics from the brain.
Supplementary Figure S2 | Supervised PCA of DMLs revealed a clear distinction between GDM and control samples.
Supplementary Figure S3 | Kyoto Encyclopedia of Genes and Genomes (KEGG) enrichment analysis based on shared genes of RNA-seq and RRBS. The color gradient from dark purple to dark pink in the heatmap indicates fold change of DEGs. The bubble size is related to the impact of the pathway.
Supplementary Figure S4 | Purine metabolism in visual representation of the interaction between the transcriptome and metabolome.
Supplementary Figure S5 | Urea cycle and metabolism of arginine, proline, glutamate, aspartate and asparagine in visual representation of the interaction between the transcriptome and metabolome.
Alwan, N., Tuffnell, D. J., and West, J. (2009). Treatments for Gestational Diabetes. Cochrane database Syst. Rev. 2009 (3), CD003395. doi:10.1002/14651858.CD003395.pub2
Aviel-Shekler, K., Hamshawi, Y., Sirhan, W., Getselter, D., Srikanth, K. D., Malka, A., et al. (2020). Gestational Diabetes Induces Behavioral and Brain Gene Transcription Dysregulation in Adult Offspring. Transl Psychiatry 10 (1), 412. doi:10.1038/s41398-020-01096-7
Bartke, T., and Schneider, R. (2020). You Are what You Eat - How Nutrition and Metabolism Shape the Genome through Epigenetics. Mol. Metab. 38, 100987. doi:10.1016/j.molmet.2020.100987
Bytoft, B., Knorr, S., Vlachova, Z., Jensen, R. B., Mathiesen, E. R., Beck-Nielsen, H., et al. (2016). Long-term Cognitive Implications of Intrauterine Hyperglycemia in Adolescent Offspring of Women with Type 1 Diabetes (The EPICOM Study). Diabetes care 39 (8), 1356–1363. doi:10.2337/dc16-0168
Chandna, A. R., Kuhlmann, N., Bryce, C. A., Greba, Q., Campanucci, V. A., and Howland, J. G. (2015). Chronic Maternal Hyperglycemia Induced during Mid-pregnancy in Rats Increases RAGE Expression, Augments Hippocampal Excitability, and Alters Behavior of the Offspring. Neuroscience 303, 241–260. doi:10.1016/j.neuroscience.2015.06.063
Chen, S., Lee, J., Truong, T. M., Alhassen, S., Baldi, P., and Alachkar, A. (2021). Age-Related Neurometabolomic Signature of Mouse Brain. ACS Chem. Neurosci. 12 (15), 2887–2902. doi:10.1021/acschemneuro.1c00259
Chiefari, E., Arcidiacono, B., Foti, D., and Brunetti, A. (2017). Gestational Diabetes Mellitus: an Updated Overview. J. Endocrinol. Invest. 40 (9), 899–909. doi:10.1007/s40618-016-0607-5
Christiansen, G. B., Andersen, K. H., Riis, S., Nykjaer, A., Bolcho, U., Jensen, M. S., et al. (2017). The Sorting Receptor SorCS3 Is a Stronger Regulator of Glutamate Receptor Functions Compared to GABAergic Mechanisms in the hippocampus. Hippocampus 27 (3), 235–248. doi:10.1002/hipo.22689
Dalfrà, M. G., Burlina, S., Del Vescovo, G. G., and Lapolla, A. (2020). Genetics and Epigenetics: New Insight on Gestational Diabetes Mellitus. Front. Endocrinol. 11, 602477. doi:10.3389/fendo.2020.602477
Daraki, V., Roumeliotaki, T., Koutra, K., Georgiou, V., Kampouri, M., Kyriklaki, A., et al. (2017). Effect of Parental Obesity and Gestational Diabetes on Child Neuropsychological and Behavioral Development at 4 Years of Age: the Rhea Mother-Child Cohort, Crete, Greece. Eur. Child. Adolesc. Psychiatry 26 (6), 703–714. doi:10.1007/s00787-016-0934-2
De Jager, P. L., Srivastava, G., Lunnon, K., Burgess, J., Schalkwyk, L. C., Yu, L., et al. (2014). Alzheimer's Disease: Early Alterations in Brain DNA Methylation at ANK1, BIN1, RHBDF2 and Other Loci. Nat. Neurosci. 17 (9), 1156–1163. doi:10.1038/nn.3786
De Sousa, R. A. L. (2021). Animal Models of Gestational Diabetes: Characteristics and Consequences to the Brain and Behavior of the Offspring. Metab. Brain Dis. 36 (2), 199–204. doi:10.1007/s11011-020-00661-9
de Sousa, R. A. L., de Lima, E. V., da Silva, T. P., de Souza, R. V., Figueiredo, C. P., Passos, G. F., et al. (2019). Late Cognitive Consequences of Gestational Diabetes to the Offspring, in a New Mouse Model. Mol. Neurobiol. 56 (11), 7754–7764. doi:10.1007/s12035-019-1624-0
Ding, G.-L., Wang, F.-F., Shu, J., Tian, S., Jiang, Y., Zhang, D., et al. (2012). Transgenerational Glucose Intolerance with Igf2/H19 Epigenetic Alterations in Mouse Islet Induced by Intrauterine Hyperglycemia. Diabetes 61 (5), 1133–1142. doi:10.2337/db11-1314
Dobin, A., Davis, C. A., Schlesinger, F., Drenkow, J., Zaleski, C., Jha, S., et al. (2013). STAR: Ultrafast Universal RNA-Seq Aligner. Bioinformatics (Oxford, England) 29 (1), 15–21. doi:10.1093/bioinformatics/bts635
Ear, P. H., Chadda, A., Gumusoglu, S. B., Schmidt, M. S., Vogeler, S., Malicoat, J., et al. (2019). Maternal Nicotinamide Riboside Enhances Postpartum Weight Loss, Juvenile Offspring Development, and Neurogenesis of Adult Offspring. Cel Rep. 26 (4), 969–983. doi:10.1016/j.celrep.2019.01.007
Eduviere, A. T., Umukoro, S., Aderibigbe, A. O., Ajayi, A. M., and Adewole, F. A. (2015). Methyl Jasmonate Enhances Memory Performance through Inhibition of Oxidative Stress and Acetylcholinesterase Activity in Mice. Life Sci. 132, 20–26. doi:10.1016/j.lfs.2015.04.007
Feng, H., Conneely, K. N., and Wu, H. (2014). A Bayesian Hierarchical Model to Detect Differentially Methylated Loci from Single Nucleotide Resolution Sequencing Data. Nucleic Acids Res. 42 (8), e69. doi:10.1093/nar/gku154
Forrest, M. P., Parnell, E., and Penzes, P. (2018). Dendritic Structural Plasticity and Neuropsychiatric Disease. Nat. Rev. Neurosci. 19 (4), 215–234. doi:10.1038/nrn.2018.16
Fraser, A., Almqvist, C., Larsson, H., Långström, N., and Lawlor, D. A. (2014). Maternal Diabetes in Pregnancy and Offspring Cognitive Ability: Sibling Study with 723,775 Men from 579,857 Families. Diabetologia 57 (1), 102–109. doi:10.1007/s00125-013-3065-z
Froese, D. S., Fowler, B., and Baumgartner, M. R. (2019). Vitamin B 12 , Folate, and the Methionine Remethylation Cycle-Biochemistry, Pathways, and Regulation. J. Inher. Metab. Disea 42 (4), 673–685. doi:10.1002/jimd.12009
Gao, Y., Duque-Wilckens, N., Aljazi, M. B., Wu, Y., Moeser, A. J., Mias, G. I., et al. (2021). Loss of Histone Methyltransferase ASH1L in the Developing Mouse Brain Causes Autistic-like Behaviors. Commun. Biol. 4 (1), 756. doi:10.1038/s42003-021-02282-z
Giacco, F., and Brownlee, M. (2010). Oxidative Stress and Diabetic Complications. Circ. Res. 107 (9), 1058–1070. doi:10.1161/CIRCRESAHA.110.223545
Goya, J., Wong, A. K., Yao, V., Krishnan, A., Homilius, M., and Troyanskaya, O. G. (2015). FNTM: a Server for Predicting Functional Networks of Tissues in Mouse. Nucleic Acids Res. 43 (W1), W182–W187. doi:10.1093/nar/gkv443
Haghir, H., Hami, J., Lotfi, N., Peyvandi, M., Ghasemi, S., and Hosseini, M. (2017). Expression of Apoptosis-Regulatory Genes in the hippocampus of Rat Neonates Born to Mothers with Diabetes. Metab. Brain Dis. 32 (2), 617–628. doi:10.1007/s11011-017-9950-2
Hami, J., Sadr-Nabavi, A., Sankian, M., Balali-Mood, M., and Haghir, H. (2013). The Effects of Maternal Diabetes on Expression of Insulin-like Growth Factor-1 and Insulin Receptors in Male Developing Rat hippocampus. Brain Struct. Funct. 218 (1), 73–84. doi:10.1007/s00429-011-0377-y
Hanson, M. A., and Gluckman, P. D. (2014). Early Developmental Conditioning of Later Health and Disease: Physiology or Pathophysiology? Physiol. Rev. 94 (4), 1027–1076. doi:10.1152/physrev.00029.2013
He, A., Zhang, Y., Yang, Y., Li, L., Feng, X., Wei, B., et al. (2017). Prenatal High Sucrose Intake Affected Learning and Memory of Aged Rat Offspring with Abnormal Oxidative Stress and NMDARs/Wnt Signaling in the hippocampus. Brain Res. 1669, 114–121. doi:10.1016/j.brainres.2017.05.022
He, X.-J., Dai, R.-X., Tian, C.-Q., and Hu, C.-L. (2021). Neurodevelopmental Outcome at 1 Year in Offspring of Women with Gestational Diabetes Mellitus. Gynecol. Endocrinol. 37 (1), 88–92. doi:10.1080/09513590.2020.1754785
Hinz, L., Torrella Barrufet, J., and Heine, V. M. (2019). KCC2 Expression Levels Are Reduced in post Mortem Brain Tissue of Rett Syndrome Patients. Acta Neuropathol. Commun. 7 (1), 196. doi:10.1186/s40478-019-0852-x
Hitchler, M. J., and Domann, F. E. (2012). Redox Regulation of the Epigenetic Landscape in Cancer: a Role for Metabolic Reprogramming in Remodeling the Epigenome. Free Radic. Biol. Med. 53 (11), 2178–2187. doi:10.1016/j.freeradbiomed.2012.09.028
Huerta-Cervantes, M., Peña-Montes, D. J., Montoya-Pérez, R., Trujillo, X., Huerta, M., López-Vázquez, M. Á., et al. (2020). Gestational Diabetes Triggers Oxidative Stress in Hippocampus and Cerebral Cortex and Cognitive Behavior Modifications in Rat Offspring: Age- and Sex-dependent Effects. Nutrients 12 (2), 376. doi:10.3390/nu12020376
Hwang, H., Szucs, M. J., Ding, L. J., Allen, A., Ren, X., Haensgen, H., et al. (2021). Neurogranin, Encoded by the Schizophrenia Risk Gene NRGN, Bidirectionally Modulates Synaptic Plasticity via Calmodulin-dependent Regulation of the Neuronal Phosphoproteome. Biol. Psychiatry 89 (3), 256–269. doi:10.1016/j.biopsych.2020.07.014
James, P., Sajjadi, S., Tomar, A. S., Saffari, A., Fall, C. H. D., Prentice, A. M., et al. (2018). Candidate Genes Linking Maternal Nutrient Exposure to Offspring Health via DNA Methylation: a Review of Existing Evidence in Humans with Specific Focus on One-Carbon Metabolism. Int. J. Epidemiol. 47 (6), 1910–1937. doi:10.1093/ije/dyy153
Kinney, B. A., Rabe, M. B., Jensen, R. A., and Steger, R. W. (2003). Maternal Hyperglycemia Leads to Gender-dependent Deficits in Learning and Memory in Offspring. Exp. Biol. Med. (Maywood) 228 (2), 152–159. doi:10.1177/153537020322800204
Kobilo, T., Guerrieri, D., Zhang, Y., Collica, S. C., Becker, K. G., and van Praag, H. (2014). AMPK Agonist AICAR Improves Cognition and Motor Coordination in Young and Aged Mice. Learn. Mem. 21 (2), 119–126. doi:10.1101/lm.033332.113
Kuang, H., Sun, M., Lv, J., Li, J., Wu, C., Chen, N., et al. (2014). Hippocampal Apoptosis Involved in Learning Deficits in the Offspring Exposed to Maternal High Sucrose Diets. J. Nutr. Biochem. 25 (9), 985–990. doi:10.1016/j.jnutbio.2014.04.012
Lai, T., Jabaudon, D., Molyneaux, B. J., Azim, E., Arlotta, P., Menezes, J. R. L., et al. (2008). SOX5 Controls the Sequential Generation of Distinct Corticofugal Neuron Subtypes. Neuron 57 (2), 232–247. doi:10.1016/j.neuron.2007.12.023
Li, R., Chase, M., Jung, S.-K., Smith, P. J. S., and Loeken, M. R. (2005). Hypoxic Stress in Diabetic Pregnancy Contributes to Impaired Embryo Gene Expression and Defective Development by Inducing Oxidative Stress. Am. J. Physiol. Endocrinol. Metab. 289 (4), E591–E599. doi:10.1152/ajpendo.00441.2004
Li, W., Li, Z., Li, S., Wang, X., Wilson, J., and Huang, G. (2018). Periconceptional Folic Acid Supplementation Benefit to Development of Early Sensory-Motor Function through Increase DNA Methylation in Rat Offspring. Nutrients 10 (3), 292. doi:10.3390/nu10030292
Lindsay, K. L., Buss, C., Wadhwa, P. D., and Entringer, S. (2019). The Interplay between Nutrition and Stress in Pregnancy: Implications for Fetal Programming of Brain Development. Biol. Psychiatry 85 (2), 135–149. doi:10.1016/j.biopsych.2018.06.021
Liu, Z., Dai, X., Zhang, H., Shi, R., Hui, Y., Jin, X., et al. (2020). Gut Microbiota Mediates Intermittent-Fasting Alleviation of Diabetes-Induced Cognitive Impairment. Nat. Commun. 11 (1), 855. doi:10.1038/s41467-020-14676-4
Love, M. I., Huber, W., and Anders, S. (2014). Moderated Estimation of Fold Change and Dispersion for RNA-Seq Data with DESeq2. Genome Biol. 15 (12), 550. doi:10.1186/s13059-014-0550-8
Lunnon, K., Smith, R., Hannon, E., De Jager, P. L., Srivastava, G., Volta, M., et al. (2014). Methylomic Profiling Implicates Cortical Deregulation of ANK1 in Alzheimer's Disease. Nat. Neurosci. 17 (9), 1164–1170. doi:10.1038/nn.3782
Maroteaux, G., Loos, M., van der Sluis, S., Koopmans, B., Aarts, E., van Gassen, K., et al. (2012). High-throughput Phenotyping of Avoidance Learning in Mice Discriminates Different Genotypes and Identifies a Novel Gene. Genes, Brain Behav. 11 (7), 772–784. doi:10.1111/j.1601-183X.2012.00820.x
Martínez García, R. M., Jiménez Ortega, A. I., López Sobaler, A. M., and Ortega, R. M. (2018). Nutrition Strategies that Improve Cognitive Function. Nutr. Hosp. 35 (Spec No6), 16–19. doi:10.20960/nh.2281
Martínez-Reyes, I., and Chandel, N. S. (2020). Mitochondrial TCA Cycle Metabolites Control Physiology and Disease. Nat. Commun. 11 (1), 102. doi:10.1038/s41467-019-13668-3
Mejia, L. A., Litterman, N., Ikeuchi, Y., de la Torre-Ubieta, L., Bennett, E. J., Zhang, C., et al. (2013). A Novel Hap1-Tsc1 Interaction Regulates Neuronal mTORC1 Signaling and Morphogenesis in the Brain. J. Neurosci. 33 (46), 18015–18021. doi:10.1523/JNEUROSCI.2290-13.2013
Mentch, S. J., and Locasale, J. W. (2016). One-carbon Metabolism and Epigenetics: Understanding the Specificity. Ann. N.Y. Acad. Sci. 1363, 91–98. doi:10.1111/nyas.12956
Monteiro, P., and Feng, G. (2017). SHANK Proteins: Roles at the Synapse and in Autism Spectrum Disorder. Nat. Rev. Neurosci. 18 (3), 147–157. doi:10.1038/nrn.2016.183
Muehlmann, A. M., Bliznyuk, N., Duerr, I., Yang, T. P., and Lewis, M. H. (2020). Early Exposure to a Methyl Donor Supplemented Diet and the Development of Repetitive Motor Behavior in a Mouse Model. Dev. Psychobiol 62 (1), 77–87. doi:10.1002/dev.21914
Nash, A., Aumann, T. D., Pigoni, M., Lichtenthaler, S. F., Takeshima, H., Munro, K. M., et al. (2020). Lack of Sez6 Family Proteins Impairs Motor Functions, Short-Term Memory, and Cognitive Flexibility and Alters Dendritic Spine Properties. Cereb. Cortex. 30 (4), 2167–2184. doi:10.1093/cercor/bhz230
Naudet, N., Moutal, A., Vu, H. N., Chounlamountri, N., Watrin, C., Cavagna, S., et al. (2018). Transcriptional Regulation of CRMP5 Controls Neurite Outgrowth through Sox5. Cell. Mol. Life Sci. 75 (1), 67–79. doi:10.1007/s00018-017-2634-6
Ning, X., Li, B., Ku, T., Guo, L., Li, G., and Sang, N. (2018). Comprehensive Hippocampal Metabolite Responses to PM2.5 in Young Mice. Ecotoxicology Environ. Saf. 165, 36–43. doi:10.1016/j.ecoenv.2018.08.080
O'Connor, T. P., Cockburn, K., Wang, W., Tapia, L., Currie, E., and Bamji, S. X. (2009). Semaphorin 5B Mediates Synapse Elimination in Hippocampal Neurons. Neural Dev. 4, 18. doi:10.1186/1749-8104-4-18
Pasek, R. C., and Gannon, M. (2013). Advancements and Challenges in Generating Accurate Animal Models of Gestational Diabetes Mellitus. Am. J. Physiol. Endocrinol. Metab. 305 (11), E1327–E1338. doi:10.1152/ajpendo.00425.2013
Prévot, T., and Sibille, E. (2021). Altered GABA-Mediated Information Processing and Cognitive Dysfunctions in Depression and Other Brain Disorders. Mol. Psychiatry 26 (1), 151–167. doi:10.1038/s41380-020-0727-3
Qiu, W. Q., Luo, S., Ma, S. A., Saminathan, P., Li, H., Gunnersen, J. M., et al. (2021). The Sez6 Family Inhibits Complement by Facilitating Factor I Cleavage of C3b and Accelerating the Decay of C3 Convertases. Front. Immunol. 12, 607641. doi:10.3389/fimmu.2021.607641
Reshetnikov, V. V., Kisaretova, P. E., Ershov, N. I., Shulyupova, A. S., Oshchepkov, D. Y., Klimova, N. V., et al. (2020). Genes Associated with Cognitive Performance in the Morris Water Maze: an RNA-Seq Study. Sci. Rep. 10 (1), 22078. doi:10.1038/s41598-020-78997-6
Rodrigues, R. J., Marques, J. M., and Cunha, R. A. (2019). Purinergic Signalling and Brain Development. Semin. Cel Develop. Biol. 95, 34–41. doi:10.1016/j.semcdb.2018.12.001
Satterstrom, F. K., Kosmicki, J. A., Wang, J., Breen, M. S., De Rubeis, S., An, J. Y., et al. (2020). Large-Scale Exome Sequencing Study Implicates Both Developmental and Functional Changes in the Neurobiology of Autism. Cell 180 (3), 568–584.e23. doi:10.1016/j.cell.2019.12.036
Srikanth, P., Lagomarsino, V. N., Pearse, R. V., Liao, M., Ghosh, S., Nehme, R., et al. (2018). Convergence of Independent DISC1 Mutations on Impaired Neurite Growth via Decreased UNC5D Expression. Transl Psychiatry 8 (1), 245. doi:10.1038/s41398-018-0281-9
Stout, K. A., Dunn, A. R., Hoffman, C., and Miller, G. W. (2019). The Synaptic Vesicle Glycoprotein 2: Structure, Function, and Disease Relevance. ACS Chem. Neurosci. 10 (9), 3927–3938. doi:10.1021/acschemneuro.9b00351
Su, X., Wellen, K. E., and Rabinowitz, J. D. (2016). Metabolic Control of Methylation and Acetylation. Curr. Opin. Chem. Biol. 30, 52–60. doi:10.1016/j.cbpa.2015.10.030
Tu, D. G., Chang, Y. L., Chou, C. H., Lin, Y. L., Chiang, C. C., Chang, Y. Y., et al. (2018). Preventive Effects of Taurine Against D-galactose-induced Cognitive Dysfunction and Brain Damage. Food Funct 9 (1), 124–133. doi:10.1039/c7fo01210a
Valle-Bautista, R., Márquez-Valadez, B., Fragoso-Cabrera, A. D., García-López, G., Díaz, N. F., Herrera-López, G., et al. (2020). Impaired Cortical Cytoarchitecture and Reduced Excitability of Deep-Layer Neurons in the Offspring of Diabetic Rats. Front. Cel Dev. Biol. 8, 564561. doi:10.3389/fcell.2020.564561
Velazquez, R., Ferreira, E., Knowles, S., Fux, C., Rodin, A., Winslow, W., et al. (2019). Lifelong Choline Supplementation Ameliorates Alzheimer's Disease Pathology and Associated Cognitive Deficits by Attenuating Microglia Activation. Aging cell 18 (6), e13037. doi:10.1111/acel.13037
Wang, L.-Q., Zheng, Y.-Y., Zhou, H.-J., Zhang, X.-X., Wu, P., and Zhu, S.-M. (2021). LncRNA-Fendrr Protects against the Ubiquitination and Degradation of NLRC4 Protein through HERC2 to Regulate the Pyroptosis of Microglia. Mol. Med. 27 (1), 39. doi:10.1186/s10020-021-00299-y
Winkle, C. C., Olsen, R. H. J., Kim, H., Moy, S. S., Song, J., and Gupton, S. L. (2016). Trim9 Deletion Alters the Morphogenesis of Developing and Adult-Born Hippocampal Neurons and Impairs Spatial Learning and Memory. J. Neurosci. 36 (18), 4940–4958. doi:10.1523/JNEUROSCI.3876-15.2016
Xiang, J., Yan, S., Li, S.-H., and Li, X.-J. (2015). Postnatal Loss of Hap1 Reduces Hippocampal Neurogenesis and Causes Adult Depressive-like Behavior in Mice. Plos Genet. 11 (4), e1005175. doi:10.1371/journal.pgen.1005175
Zhao, N., Yang, S., Hu, Y., Dong, H., and Zhao, R. (2017). Maternal Betaine Supplementation in Rats Induces Intergenerational Changes in Hepatic IGF-1 Expression and DNA Methylation. Mol. Nutr. Food Res. 61 (8), 1600940. doi:10.1002/mnfr.201600940
Zhu, H., Chen, B., Cheng, Y., Zhou, Y., Yan, Y.-S., Luo, Q., et al. (2019). Insulin Therapy for Gestational Diabetes Mellitus Does Not Fully Protect Offspring from Diet-Induced Metabolic Disorders. Diabetes 68 (4), 696–708. doi:10.2337/db18-1151
Zhu, Y., and Zhang, C. (2016). Prevalence of Gestational Diabetes and Risk of Progression to Type 2 Diabetes: a Global Perspective. Curr. Diab Rep. 16 (1), 7. doi:10.1007/s11892-015-0699-x
Keywords: gestational diabetes mellitus, fetal mouse brain, hippocampus, metabolomics, DNA methylation, transcriptomics
Citation: Luo S-s, Zou K-x, Zhu H, Cheng Y, Yan Y-s, Sheng J-z, Huang H-f and Ding G-l (2022) Integrated Multi-Omics Analysis Reveals the Effect of Maternal Gestational Diabetes on Fetal Mouse Hippocampi. Front. Cell Dev. Biol. 10:748862. doi: 10.3389/fcell.2022.748862
Received: 28 July 2021; Accepted: 19 January 2022;
Published: 14 February 2022.
Edited by:
Indrabahadur Singh, German Cancer Research Center (DKFZ), GermanyReviewed by:
Bonnie Alberry, McGill University, CanadaCopyright © 2022 Luo, Zou, Zhu, Cheng, Yan, Sheng, Huang and Ding. This is an open-access article distributed under the terms of the Creative Commons Attribution License (CC BY). The use, distribution or reproduction in other forums is permitted, provided the original author(s) and the copyright owner(s) are credited and that the original publication in this journal is cited, in accordance with accepted academic practice. No use, distribution or reproduction is permitted which does not comply with these terms.
*Correspondence: He-feng Huang, aHVhbmdoZWZnQGZ1ZGFuLmVkdS5jbg==; Guo-lian Ding, ZGluZ2d1b2xpYW5AZnVkYW4uZWR1LmNu
†These authors have contributed equally to this work
Disclaimer: All claims expressed in this article are solely those of the authors and do not necessarily represent those of their affiliated organizations, or those of the publisher, the editors and the reviewers. Any product that may be evaluated in this article or claim that may be made by its manufacturer is not guaranteed or endorsed by the publisher.
Research integrity at Frontiers
Learn more about the work of our research integrity team to safeguard the quality of each article we publish.