
94% of researchers rate our articles as excellent or good
Learn more about the work of our research integrity team to safeguard the quality of each article we publish.
Find out more
ORIGINAL RESEARCH article
Front. Cell Dev. Biol., 26 September 2022
Sec. Stem Cell Research
Volume 10 - 2022 | https://doi.org/10.3389/fcell.2022.1010114
This article is part of the Research TopicNeurocyte-endotheliocyte Crosstalk-mediated Tissue RegenerationView all 4 articles
Rheumatoid arthritis (RA) has a high incidence and adverse effects on patients, thus posing a serious threat to people’s life and health. However, the underlying mechanisms regarding the development of RA are still elusive. Herein, we aimed to evaluate the RA-associated molecular mechanisms using the scRNA-seq technique. We used the GEO database to obtain scRNA-seq datasets for synovial fibroblasts (SFs) from RA cases, and the genes were then analyzed using principal component analysis (PCA) and T-Stochastic Neighbor Embedding (TSNE) analyses. Bioinformatics evaluations were carried out for asserting the highly enriched signaling pathways linked to the marker genes, and the key genes related to RA initiation were further identified. According to the obtained results, 3 cell types (0, 1, and 2) were identified by TSNE and some marker genes were statistically upregulated in cell type 1 than the other cell types. These marker genes predominantly contributed to extracellular matrix (ECM) architecture, collagen-harboring ECM, and ECM structural components, and identified as enriched with PI3K/AKT signaling cascade. Notably, fibronectin-1 (FN-1) has been identified as a critical gene that is strongly linked to the development of SFs and has enormous promise for regulating the onset of RA. Moreover, such an investigation offers novel perspectives within onset/progression of RA, suggesting that FN-1 may be a key therapeutic target for RA therapies.
Rheumatoid Arthritis (RA) is a long-term, progressive autoimmune condition affecting more than 1% of the global population, inflicting severe pain, joint distortion, and disability (Newsome and American College of Rheumatology, 2002; Guo et al., 2018; van der Woude and van der Helm-van Mil, 2018). RA can affect not only the bones and joints, but also extra-articular organs (e.g., the heart, eyes, lungs, and blood vessels) and shorten the life expectancy (Conforti et al., 2021; Figus et al., 2021). Furthermore, there are six developing stages of RA i.e., pre-RA to RA stage, and various factors including genetic, environmental, and autoimmune factors can affect RA progression (Deane and Holers, 2021). Early treatment can alleviate joint malformation and joint damage. However, due to the unknown mechanisms of RA, present treatments for RA are mostly focused on symptom relief, malformation correction, and functional rehabilitation exercise, but the overall efficacy is far from satisfactory (Radu and Bungau, 2021). Hence, it is needed to explore RA-associated critical genes and uncover more useful treatment targets for RA.
The reported studies have revealed that synovial fibroblasts (SFs) considerably contribute to the development of RA (Tsuchiya et al., 2021). Joint inflammation is often accompanied by the proliferation of SFs, which leads to synovial thickening and even joint deformity (Müller-Ladner et al., 2007). Excessive proliferation of SFs can invade articular cartilage and surrounding tissues, while locally secreting a large number of inflammatory factors, such as IL-8, IL-1β, and other cytokines into local joints. The underlined process causes the inflammation to worsen (Ritchlin, 2000). Therefore, it is important to uncover the potential mechanisms of SFs formation as well as the key hub genes in this regulation process in order to have a thorough understanding of RA initiation and the crucial genes involved.
In recent decades, several RA-associated genes have been reported (Liu et al., 2020; Wang et al., 2020). Wang et al. reported that FoxC1 and β-catenin are closely related to the function of SFs(Wang et al., 2020). Furthermore, the in vitro and in vivo investigation showed that up-regulating FoxC1 could improve SFs’ proliferative, migratory, and invading abilities (Wang et al., 2020). Moreover, the pro-inflammatory cytokines were also markedly elevated in the FoxC1-treated SFs(Wang et al., 2020). Similarly, Liu et al. demonstrated the potential therapeutic impact of pyruvate dehydrogenase kinase 4 (PDK4) in inhibiting the development of RA (Liu et al., 2020). In addition, the rapid development of RNA sequencing technology has enabled the identification of a wide range of pivotal genes linked to disease onset (Hong et al., 2020). ScRNA-seq has been attracting accumulative interest in identifying the key genes in many diseases and be potentially employed as a major technique to evaluate mechanistics within RA initiation (Slovin et al., 2021; Grandi et al., 2022; Micheroli et al., 2022).
Hence, the current study aimed to evaluate the RA-associated molecular mechanisms using the scRNA-seq technique. Herein, scRNA-seq datasets for SFs from RA patients were retrieved from the GEO database, with genes undergoing principal component analysis (PCA) and T-stochastic Neighbor Embedding (TSNE) analyses. A bioinformatics analysis was conducted to determine the highly enriched signaling pathways linked to genomic biomarkers, with the essential gene associated with the initiation of RA was also identified.
This investigation probed GEO (Gene Expression Omnibus) (https://www.ncbi.nlm.nih.gov/geo/) and selected single-cell RNA-seq of SFs in patients with RA. For additional analysis, the gene count file was obtained. Three factors were chosen for data processing: nFeature (gene quantity/cell), nCount (total quantity of all genes/cell), and percent. mt (percentage of mitochondrial gene quantity within total gene quantity/cell). Cells having nFeature >50 and percent. mt < 5% were chosen for further study since mitochondrial gene expression was commonly found low.
Computational single-cell RNA-seq (scRNA-seq) methods have been successfully applied to experiments representing a single condition, technology, or species to discover and define cellular phenotypes. In Rstudio, R package “limma”, “Seurat”, and “dplyr” were employed to conduct data normalization, PCA, and TSNE analyses, in accordance with Andrew’s guidelines (Butler et al., 2018).
DEGs evaluation, GO (Gene Ontology) and KEGG (Kyoto Encyclopedia of Genes and Genomes) analyses and visualization were carried out using the R packages “SingleR,” “org.Hs.eg.db,” “clusterProfiler,” “enrichplot,” and “ggplot2.” PPI network was constructed using Cytoscape 3.7.2 and STRING (http://string-db.org/).
GSE109449 was obtained from the GEO database and was comprised of SFs transcriptomic data from two OA4 and two OA5 patients. A total of 192 cells were obtained with information about the number of genes in RA8 and RA9. nFeature was greater than 50 in each cell, whereas nCount and percent. mt were found to be typically less than 5,000,000 and 10%, accordingly, as depicted in Figures 1A–C. Post performing correlation analysis following nCount/percent. mt/nFeature, it was observed that there was no significant association between percent. mt and nCount. However, a significant correlation was recorded between nFeature and nCount (Figures 1D,E). Such dataset outcomes shed additional light upon downregulations within mitochondria. A scatter diagram was generated for identifying upregulated genes within various cell cultures (Figure 1F), followed by selecting the top 1,000 genes for the subsequent studies.
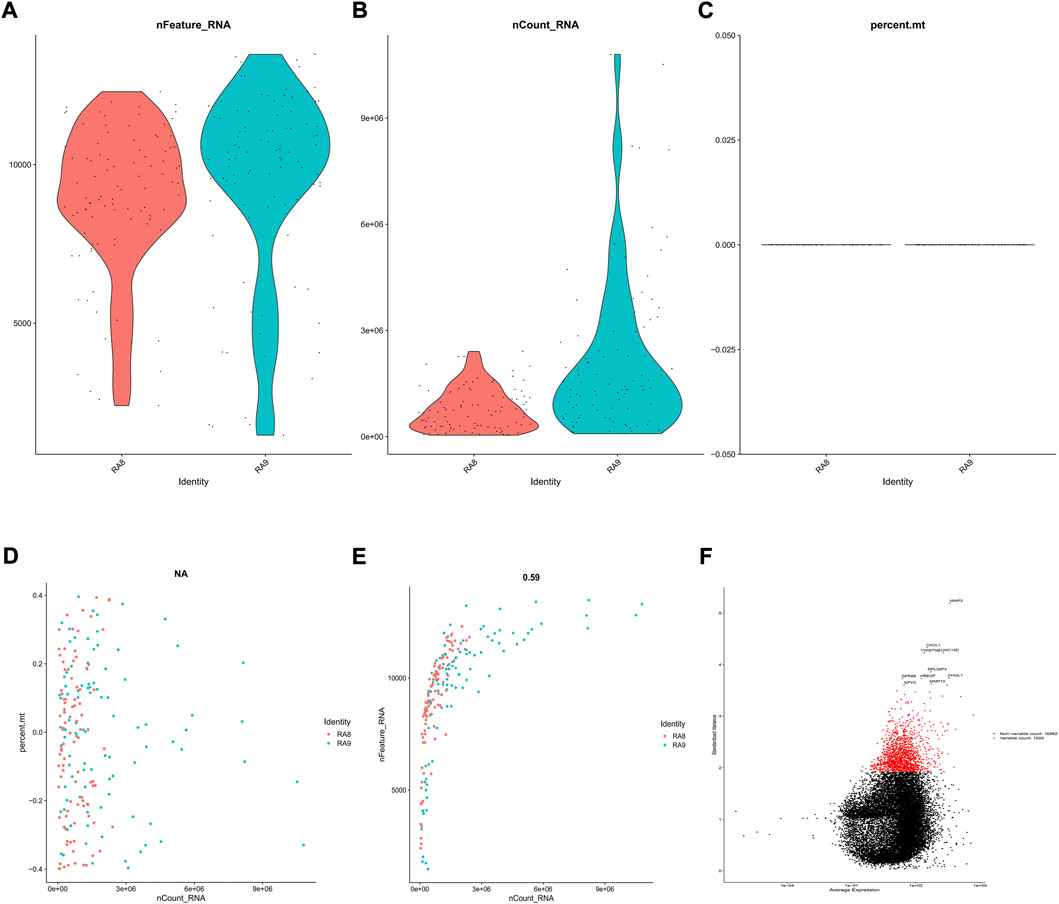
FIGURE 1. Evaluation of SFs’ scRNA-seq results. GSE109449 provided access to scRNA-seq datasets for 192 SFs obtained from two RA cases (RA8 and RA9), followed by evaluation in three aspects including (A) nFeature (B) nCount, and (C) percent. mt, as depicted within violin-plots. Next, correlation analyses were conducted on (D) nCount, percent. mt and (E) nCount and nFeature, and (F) Genes with greater expression changes in various cells were investigated using a scatter diagram. The vertical axis represents standardized variance, the abscissa represents average expression, and the red and black pots represent the top 1,000 and lower 1,000 genes, accordingly.
PCA was employed to determine the biomarker genes from a set of the top 1,000 previously analyzed genes. In addition, 20 principal components (PCs) were found. The underlined top genes in PC1-4 are shown in Figure 2. Discreteness was clearly shown within cellular spread for the top-two PCs, i.e., PC1 and PC2. The results (Figure 3A) demonstrated that dimensionality reduction and cell classification could be accomplished by PCA evaluations. Next, the cells in the underlined 20 PCs were evaluated by cluster analysis, and ultimately, three PCs, i.e., PC1, PC2, and PC3 with obvious differences, were determined (Figure 3B). By employing the TSNE analysis, the cultures within such three PCs were subsequently divided into three cell-types (i.e., type-0, type-1, and type-2), as shown in Figure 3C. Next, the genes within each type were differentially examined to identify biomarker genes (log | FC | > 0.5, p-value < 0.05). Since all three cell-types have no considerable correlation with one another, follow-up enrichment analysis was limited to genomic biomarkers that were considerably divergent across all such cell-types. Peak 10 genomic biomarkers for each cell-type were chosen in accordance with the log|FC| value in order to more accurately determine the characteristic genes with notable expression patterns in cells. Expression of all 30 biomarker genes was normalized and visualized using Seurat 3.0 (https://satijalab.org/seurat/), and 14 marker genes with significantly different expressions were then evaluated (Figure 4A). Based on the statistical evaluation, 10 biomarker genes (including, ITGB8, CXCL1, MMP3, PRG4, MMP1, SEMA3A, CRTAC1, TIMP3, GPR1, and FN-1) in type-1 cells were considerably more abundant in comparison to type-2 cells (Figure 4B). Next, expression profiles for 10 biomarker genes within type-0, type-1, and type-2 cells were isolated for visualization analysis, which revealed that type-1 cells had marked upregulation for 10 genes in comparison to remaining cell-types (Figure 5 and Figure 6). In view of these results, genomic biomarkers within TSNE type-1 had markedly divergent expression in comparison to other gene types. Furthermore, among these genes, features related to SF growth were more abundantly present.
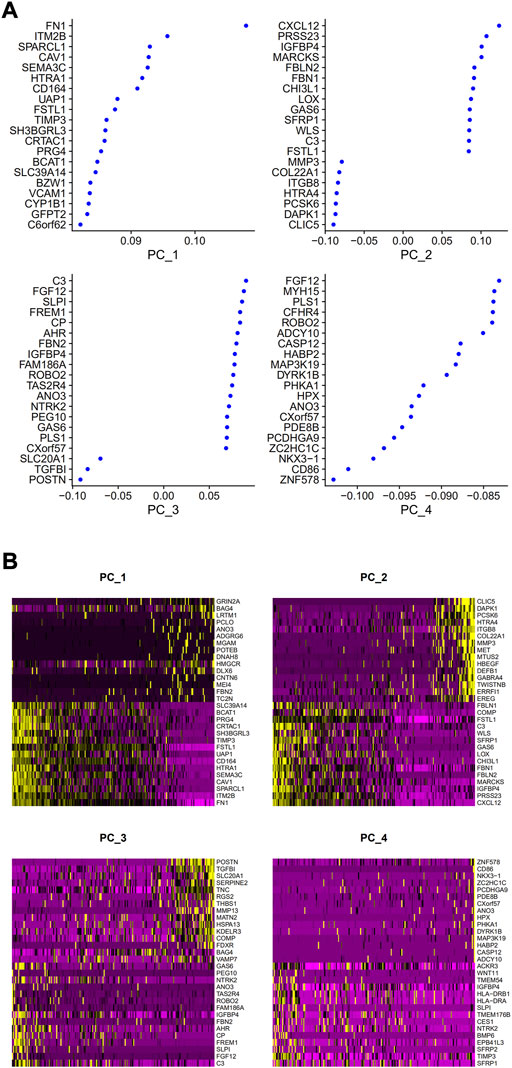
FIGURE 2. Top genes in PC1, 2, 3, 4. (A) Correlation coefficient data. (B) Data regarding gene expression.
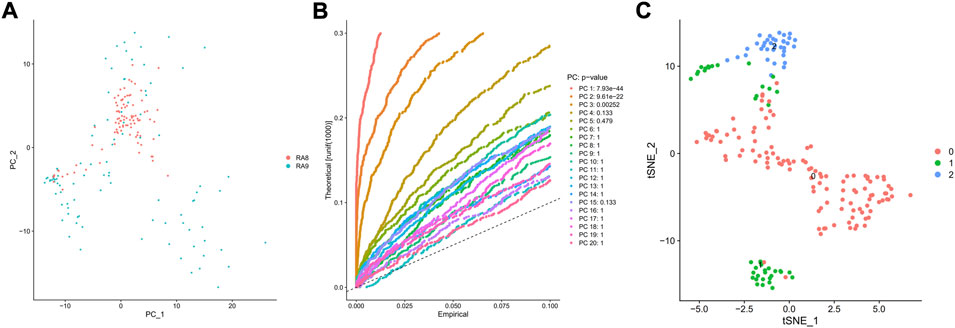
FIGURE 3. PCA and TSNE evaluations. (A) PCA was used to examine the 1,000 variant genes that had previously been screened, and 20 PCs were ultimately found. (B) The clustering of the 20 PCs was performed, and 3 PCs with the most considerable variations were evaluated. A theoretical value is represented by the vertical axis, whereas an empirical value is represented by the abscissa. The TSNE analysis was then used to successively cluster the (C) cells within such 3 PCs into three cell-types.
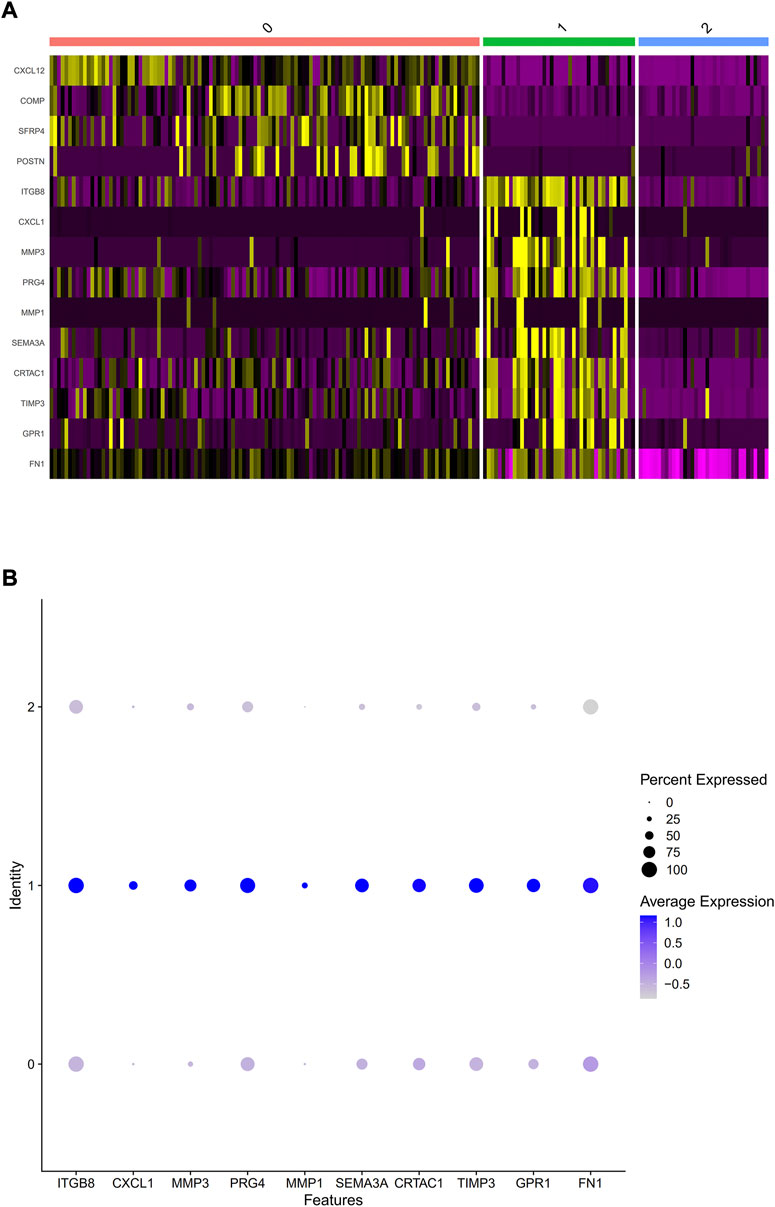
FIGURE 4. Selection of considerably divergent biomarker-genes within TSNE cell-types. (A) A heatmap was used to show differing gene dysregulations within three cell-types, whereby which purple and yellow color depicts downregulated and upregulated genes, accordingly. The abscissa indicates cells of types 0, 1, and 2, while vertical-axis displays normalized biomarkers for three cell-types employing Seurat 3.0. (B) The expression data for ten marker genes in type 1 cells.
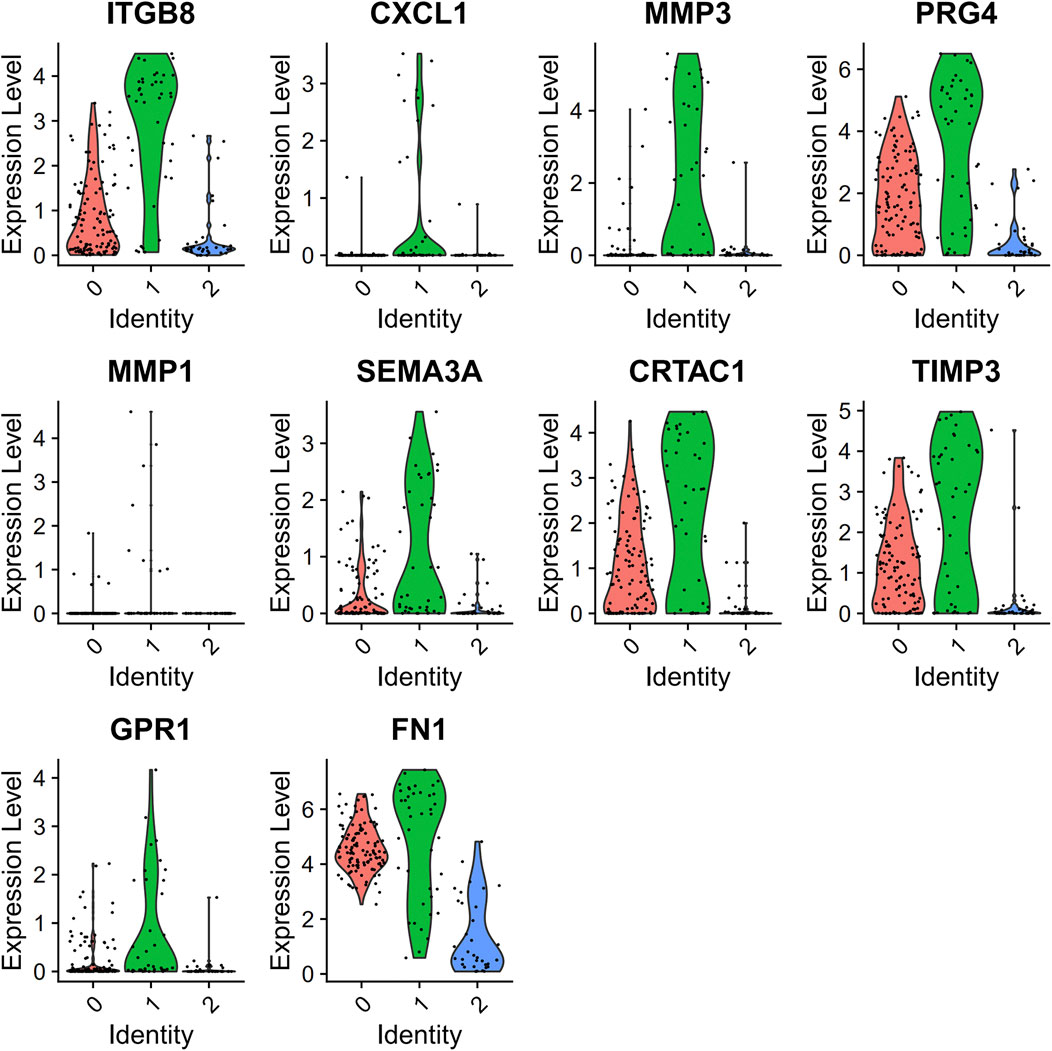
FIGURE 5. Data regarding 10 marker genes of type 1. Expression analysis within type-1 cultures, with red and green, indicates low- and high-expression, accordingly.
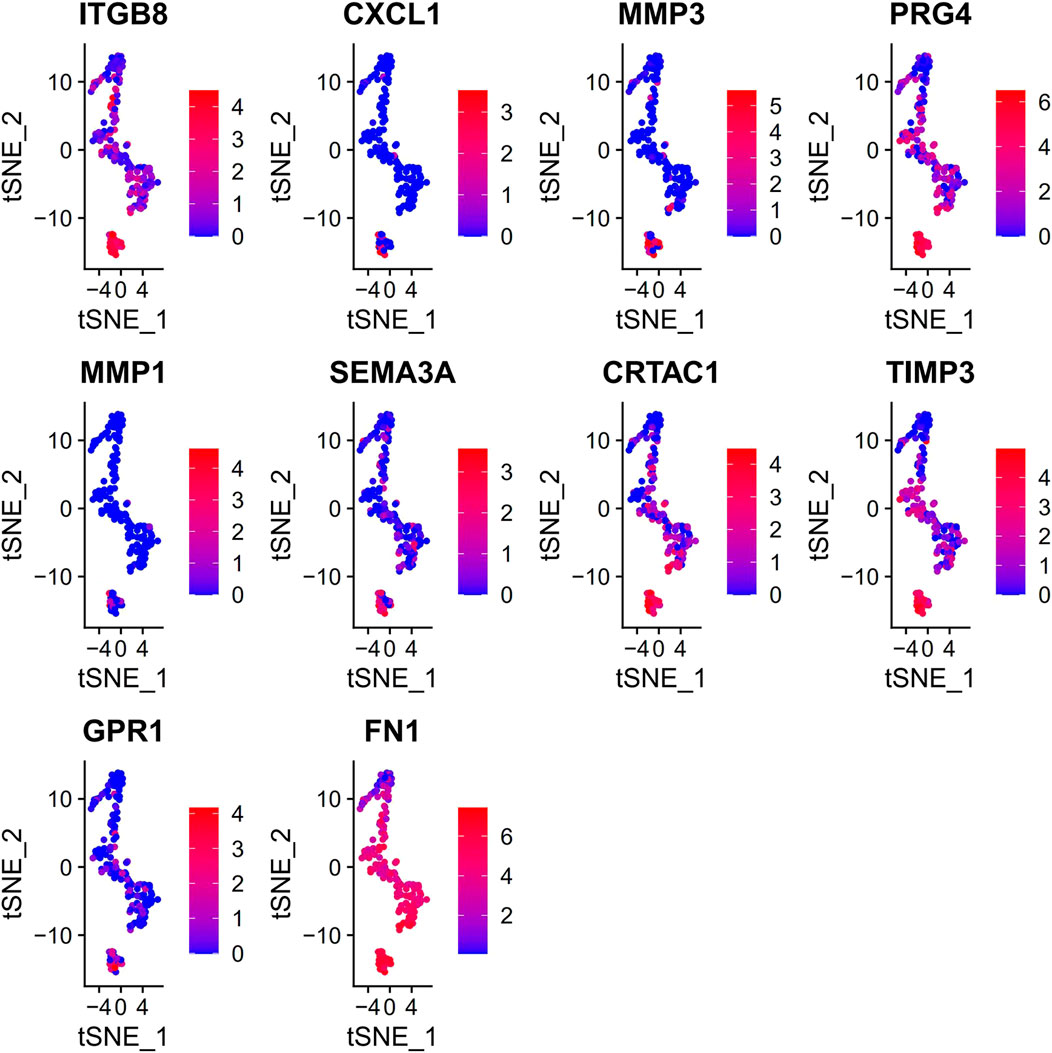
FIGURE 6. Information details of 10 marker genes of type 1. Evaluation of the underlined genes in three types of cells, with abscissa and the vertical axis indicating cell types and expression levels, accordingly.
The cell type-1 biomarker genes were subjected to GO and KEGG analysis. The findings showed that genes in type-1 cells were primarily active in ECM architecture, and cell-adhesion molecular-binding (Figure 7A). In addition, they were enriched in PI3K/AKT signaling cascade, relaxin signaling cascade, axon guidance, and focal adhesion cascade, proteoglycans in the cascades associated with various carcinomas, AGE-RAGE signaling cascade in diabetic complications, RA cascade, Protein digestion, and absorption cascade, ECM-receptor interaction and TNF signal transduction cascades (Figure 7B).
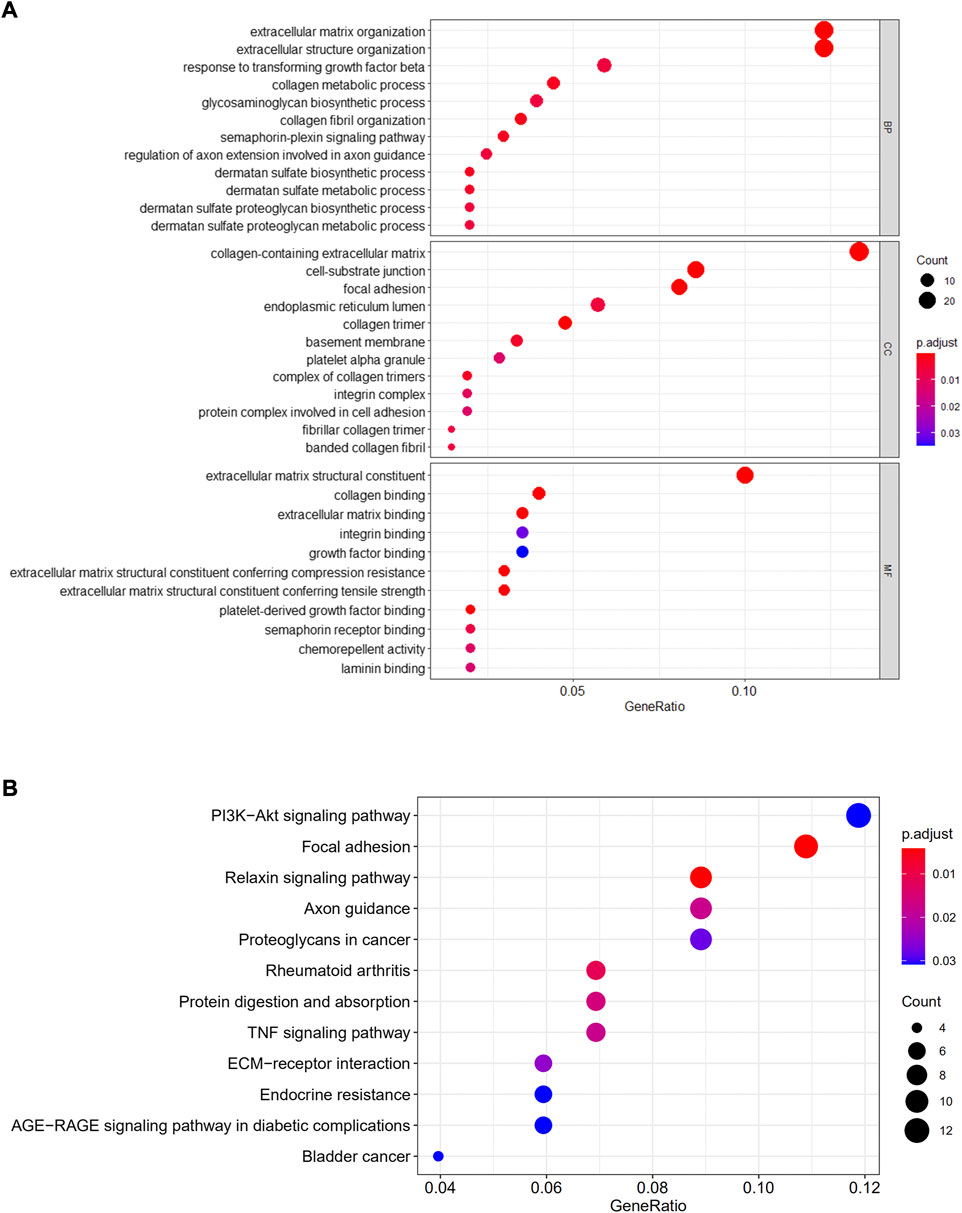
FIGURE 7. GO/KEGG enrichment analyses. GO (A) and KEGG (B) were performed for evaluating functional enrichments gene cascades within cell-type-1.
The STRING database (https://string-db.org/) was employed for map biomarker genes in cell type-1 to a PPI network. The underlined biomarker genes displayed a specific linkage with some genes in the network, indicating that they may influence SFs through reciprocal adjustment (Figure 8A). It was revealed that FN-1 has the highest number of nodes (Figure 8B). So, it could affect the growth of SF, which would have a considerable influence on the occurrence of RA.
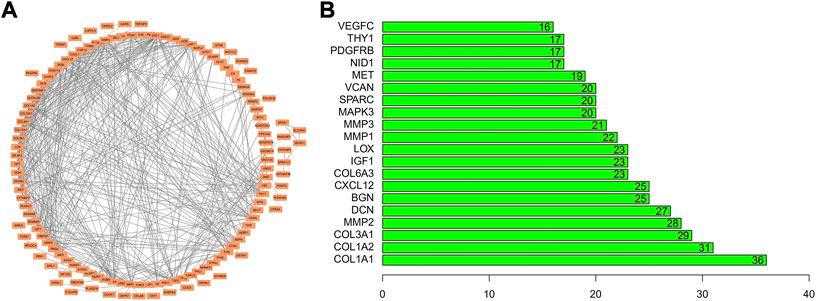
FIGURE 8. Development of PPI network/pivotal gene evaluations. Biomarkers for TSNE cell-type-1 were applied upon (A) PPI network and assessed (B) through quantifying nodes. Abscissa is displayed as the node quantity.
RA is a long-term, widespread autoimmune condition, mainly impacting synovial joint membranes. It is also related to socioeconomic consequences, premature deaths, and increased impairment. However, the molecular mechanisms underlying the onset and progression of RA remain unknown. ScRNA-seq is a new method for sequencing the genome, transcriptome, and epigenome at the level of a single cell, enabling the detection of heterogeneous information from mixed samples that are not accessible by traditional sequencing (Hwang et al., 2018). In recent years, scRNA-seq has undergone significant advancements, and researchers now have the valuable opportunity to analyze the scRNA-seq datasets for sequenced samples from public repositories, thereby facilitating investigation of essential hub genes and signaling cascades from multidimensional perspectives (Ginhoux et al., 2022; Song et al., 2022). Herein, the gene analysis of SFs from RA patients was carried out using GSE109449 available in GEO. A total of 192 SFs from two RA patients’ scRNA-seq data were obtained using GEO, with cells implicated within such process examined using nFeature, nCount, and percent. mt. Additionally, the top 1,000 genes among the various cells with high expression aside from in mitochondria were asserted.
PCA is a popular technique for data analysis that uses a linear transformation to break down the original data into a set of linearly independent representations of each dimension. This technique can be used to isolate the data’s key feature components and is frequently employed to reduce the dimensionality of highly dimensional data (Zhou and Troyanskaya, 2021). In this study, TSNE analysis and PCA were both used for the top 1,000 genes. The important genes related to RA onset were further revealed by bioinformatic analysis, which was used to pinpoint the highly enriched signaling pathways connected to the marker genes. Three cell types (0,1, and 2) were identified by TSNE and some marker genes were found to be statistically upregulated in cell type 1 than the other cell types. These marker genes were highly enriched in the PI3K/AKT signaling cascade, which has previously been well-documented as being closely related to the functional activation of SFs, as well as in the organization of ECM, ECM containing collagen, and ECM structural components (Wang et al., 2018; Su et al., 2019).
Noticeably, FN-1 was verified as a crucial gene closely associated with the growth of SFs and has huge potential for regulation of RA initiation. FN-1, an ECM protein produced by fibroblasts, was previously found to be involved in the pathological changes in many tissues (Liu et al., 2019; Baik et al., 2022). Furthermore, emerging evidence has revealed that FN-1 is closely related to RA initiation and development (Przybysz et al., 2007; van Beers et al., 2012; Xu et al., 2021). In recently published studies, a systematic investigation of the functions, pathways, and networks of the genes related to RA was carried out. The findings showed that FN-1 is one of the hub genes in regulating the effectiveness of methotrexate treatment for RA patients (Wang et al., 2021). In the present study, FN-1 was identified as one of the most crucial genes related to RA initiation via a multiple analysis based on the scRNA-seq technique. Recently, there is a increasing number of evidence indicating that PI3K/AKT signaling affect the proliferation and oxidative stress of multiple cells. Interestingly, the role of this signaling on autoimmune inflammation in the synovial fibroblasts of RA is further reported (Hao et al., 2021). It was showed that antioxidant glutathione (GSH) could suppress the expressions of IL-6, IL-1β and other inflammatory factors, acting as an inflammatory suppressor by downregulating the secretion of reactive oxygen species and PI3K/AKT signaling in synovial fibroblasts. This study provides a new evidence for explaining the prominent role of PI3K/AKT signaling in mediation the development of RA in the future.
Taken together, a multiple analysis was conducted upon scRNA-seq datasets for SFs in RA patients. The obtained results revealed that RA initiation-related genes were mainly enriched in ECM organization, collagen-harboring ECM, ECM structural constituent, and PI3K/AKT signaling cascade. In addition, FN-1 was identified as the key gene in the regulation of RA initiation, providing new light on OA pathophysiology and facilitating the identification of a possible therapeutic target for RA.
Publicly available datasets were analyzed in this study. This data can be found here: https://www.ncbi.nlm.nih.gov/geo/query/acc.cgi?acc = GSE109449.
JY and YZ analyzed the data and wrote the paper. JL and XY searched and collected the data from GEO. LL and HZ supervised the study. Hongmou Zhao contributed the idea of this study.
The authors would like to thank all the reviewers who participated in the review and MJEditor (www.mjeditor.com) for their linguistic assistance during the preparation of this manuscript.
The authors declare that the research was conducted in the absence of any commercial or financial relationships that could be construed as a potential conflict of interest.
All claims expressed in this article are solely those of the authors and do not necessarily represent those of their affiliated organizations, or those of the publisher, the editors and the reviewers. Any product that may be evaluated in this article, or claim that may be made by its manufacturer, is not guaranteed or endorsed by the publisher.
Baik, J. E., Park, H. J., Kataru, R. P., Savetsky, I. L., Ly, C. L., Shin, J., et al. (2022). TGF‐β1 mediates pathologic changes of secondary lymphedema by promoting fibrosis and inflammation. Clin. Transl. Med. 12, e758. doi:10.1002/ctm2.758
Butler, A., Hoffman, P., Smibert, P., Papalexi, E., and Satija, R. (2018). Integrating single-cell transcriptomic data across different conditions, technologies, and species. Nat. Biotechnol. 36, 411–420. doi:10.1038/nbt.4096
Conforti, A., Di Cola, I., Pavlych, V., Ruscitti, P., Berardicurti, O., Ursini, F., et al. (2021). Beyond the joints, the extra-articular manifestations in rheumatoid arthritis. Autoimmun. Rev. 20, 102735. doi:10.1016/j.autrev.2020.102735
Deane, K. D., and Holers, V. M. (2021). Rheumatoid arthritis pathogenesis, prediction, and prevention: An emerging paradigm shift. Arthritis Rheumatol. 73, 181–193. doi:10.1002/art.41417
Figus, F. A., Piga, M., Azzolin, I., McConnell, R., and Iagnocco, A. (2021). Rheumatoid arthritis: Extra-articular manifestations and comorbidities. Autoimmun. Rev. 20, 102776. doi:10.1016/j.autrev.2021.102776
Ginhoux, F., Yalin, A., Dutertre, C. A., and Amit, I. (2022). Single-cell immunology: Past, present, and future. Immunity 55, 393–404. doi:10.1016/j.immuni.2022.02.006
Grandi, F., Caroli, J., Romano, O., Marchionni, M., Forcato, M., and Bicciato, S. (2022). PopsicleR: A R package for pre-processing and quality control analysis of single cell RNA-seq data. J. Mol. Biol. 434, 167560. doi:10.1016/j.jmb.2022.167560
Guo, Q., Wang, Y., Xu, D., Nossent, J., Pavlos, N. J., and Xu, J. (2018). Rheumatoid arthritis: Pathological mechanisms and modern pharmacologic therapies. Bone Res. 6, 15. doi:10.1038/s41413-018-0016-9
Ting Hao, W. T., Huang, L., Pan, W., and Ren, Y., L. (2021). Antioxidant glutathione inhibits inflammation in synovial fibroblasts via PTEN/PI3K/AKT pathway: An in vitro study. Arch. Rheumatol. 37, 212–222. doi:10.46497/ArchRheumatol.2022.9109
Hong, M., Tao, S., Zhang, L., Diao, L. T., Huang, X., Huang, S., et al. (2020). RNA sequencing: New technologies and applications in cancer research. J. Hematol. Oncol. 13, 166. doi:10.1186/s13045-020-01005-x
Hwang, B., Lee, J. H., and Bang, D. (2018). Single-cell RNA sequencing technologies and bioinformatics pipelines. Exp. Mol. Med. 50, 1–14. doi:10.1038/s12276-018-0071-8
Liu, G., Cooley, M. A., Jarnicki, A. G., Borghuis, T., Nair, P. M., Tjin, G., et al. (2019). Fibulin-1c regulates transforming growth factor-β activation in pulmonary tissue fibrosis. JCI Insight 4, e124529. doi:10.1172/jci.insight.124529
Liu, D., Fang, Y., Rao, Y., Tan, W., Zhou, W., Wu, X., et al. (2020). Synovial fibroblast-derived exosomal microRNA-106b suppresses chondrocyte proliferation and migration in rheumatoid arthritis via down-regulation of PDK4. J. Mol. Med. 98, 409–423. doi:10.1007/s00109-020-01882-2
Micheroli, R., Elhai, M., Edalat, S., Frank-Bertoncelj, M., Bürki, K., Ciurea, A., et al. (2022). Role of synovial fibroblast subsets across synovial pathotypes in rheumatoid arthritis: A deconvolution analysis. RMD Open 8, e001949. doi:10.1136/rmdopen-2021-001949
Müller-Ladner, U., Ospelt, C., Gay, S., Distler, O., and Pap, T. (2007). Cells of the synovium in rheumatoid arthritis. Synovial fibroblasts. Arthritis Res. Ther. 9, 223. doi:10.1186/ar2337
Newsome, G., and American College of Rheumatology, (2002). Guidelines for the management of rheumatoid arthritis 2002 update. J. Amer Acad. Nurse Pract. 14, 432–437. doi:10.1111/j.1745-7599.2002.tb00072.x
Przybysz, M., Borysewicz, K., Szechinski, J., and Katnik-Prastowska, I. (2007). Synovial fibronectin fragmentation and domain expressions in relation to rheumatoid arthritis progression. Rheumatology 46, 1071–1075. doi:10.1093/rheumatology/kem067
Radu, A. F., and Bungau, S. G. (2021). Management of rheumatoid arthritis: An overview. Cells 10, 2857. doi:10.3390/cells10112857
Ritchlin, C. (2000). Fibroblast biology. Effector signals released by the synovial fibroblast in arthritis. Arthritis Res. 2, 356–360. doi:10.1186/ar112
Slovin, S., Carissimo, A., Panariello, F., Grimaldi, A., Bouché, V., Gambardella, G., et al. (2021). Single-cell RNA sequencing analysis: A step-by-step overview. Methods Mol. Biol. 2284, 343–365. doi:10.1007/978-1-0716-1307-8_19
Song, Z., Gao, P., Zhong, X., Li, M., Wang, M., and Song, X. (2022). Identification of five hub genes based on single-cell RNA sequencing data and network pharmacology in patients with acute myocardial infarction. Front. Public Health 10, 894129. doi:10.3389/fpubh.2022.894129
Su, C. M., Hu, S. L., Sun, Y., Zhao, J., Dai, C., Wang, L., et al. (2019). Myostatin induces tumor necrosis factor‐α expression in rheumatoid arthritis synovial fibroblasts through the PI3K-Akt signaling pathway. J. Cell. Physiology 234, 9793–9801. doi:10.1002/jcp.27665
Tsuchiya, H., Ota, M., and Fujio, K. (2021). Multiomics landscape of synovial fibroblasts in rheumatoid arthritis. Inflamm. Regen. 41, 7. doi:10.1186/s41232-021-00157-8
van Beers, J. J., Willemze, A., Stammen-Vogelzangs, J., Drijfhout, J. W., Toes, R. E., and M Pruijn, G. J. (2012). Anti-citrullinated fibronectin antibodies in rheumatoid arthritis are associated with human leukocyte antigen-DRB1 shared epitope alleles. Arthritis Res. Ther. 14, R35. doi:10.1186/ar3744
van der Woude, D., and van der Helm-van Mil, A. (2018). Update on the epidemiology, risk factors, and disease outcomes of rheumatoid arthritis. Best Pract. Res. Clin. Rheumatology 32, 174–187. doi:10.1016/j.berh.2018.10.005
Wang, S., Wang, L., Wu, C., Sun, S., and Pan, J. H. (2018). E2F2 directly regulates the STAT1 and PI3K/AKT/NF-κB pathways to exacerbate the inflammatory phenotype in rheumatoid arthritis synovial fibroblasts and mouse embryonic fibroblasts. Arthritis Res. Ther. 20, 225. doi:10.1186/s13075-018-1713-x
Wang, J., Wang, Y., Zhang, H., Chang, J., Lu, M., Gao, W., et al. (2020). Identification of a novel microRNA-141-3p/Forkhead box C1/β-catenin axis associated with rheumatoid arthritis synovial fibroblast function in vivo and in vitro. Theranostics 10, 5412–5434. doi:10.7150/thno.45214
Wang, Q., Fan, Z., Li, J., Fu, L., Yan, L., and Yang, B. (2021). Systematic analysis of the molecular mechanisms of methotrexate therapy for rheumatoid arthritis using text mining. Clin. Exp. Rheumatol. 39, 829–837. doi:10.55563/clinexprheumatol/y562nj
Xu, J., Zhang, M. Y., Jiao, W., Hu, C. Q., Wu, D. B., Yu, J. H., et al. (2021). Identification of candidate genes related to synovial macrophages in rheumatoid arthritis by bioinformatics analysis. Ijgm 14, 7687–7697. doi:10.2147/IJGM.S333512
Keywords: rheumatoid arthritis, scrna-seq, fibronectin-1, synovial fibroblasts, cell function
Citation: Yang J, Zhang Y, Liang J, Yang X, Liu L and Zhao H (2022) Fibronectin-1 is a dominant mechanism for rheumatoid arthritis via the mediation of synovial fibroblasts activity. Front. Cell Dev. Biol. 10:1010114. doi: 10.3389/fcell.2022.1010114
Received: 02 August 2022; Accepted: 07 September 2022;
Published: 26 September 2022.
Edited by:
Yuan Xiong, Huazhong University of Science and Technology, ChinaReviewed by:
Li Lu, Huazhong University of Science and Technology, ChinaCopyright © 2022 Yang, Zhang, Liang, Yang, Liu and Zhao. This is an open-access article distributed under the terms of the Creative Commons Attribution License (CC BY). The use, distribution or reproduction in other forums is permitted, provided the original author(s) and the copyright owner(s) are credited and that the original publication in this journal is cited, in accordance with accepted academic practice. No use, distribution or reproduction is permitted which does not comply with these terms.
*Correspondence: Hongmou Zhao, emhhb2hvbmdtb3VAeGl5aS5lZHUuY24=
†These authors have contributed equally to this work
Disclaimer: All claims expressed in this article are solely those of the authors and do not necessarily represent those of their affiliated organizations, or those of the publisher, the editors and the reviewers. Any product that may be evaluated in this article or claim that may be made by its manufacturer is not guaranteed or endorsed by the publisher.
Research integrity at Frontiers

Learn more about the work of our research integrity team to safeguard the quality of each article we publish.