
94% of researchers rate our articles as excellent or good
Learn more about the work of our research integrity team to safeguard the quality of each article we publish.
Find out more
ORIGINAL RESEARCH article
Front. Cell Dev. Biol., 31 January 2022
Sec. Cell Death and Survival
Volume 9 - 2021 | https://doi.org/10.3389/fcell.2021.812422
This article is part of the Research TopicImplications of ferroptosis-related genes to the genetics of cancer developmentView all 17 articles
 Yonghua Cai1†
 Xianqiu Liang1†Zhengming Zhan1†
 Yu Zeng1Jie Lin1
 Anqi Xu1Shuaishuai Xue1Wei Xu1Peng Chai1Yangqi Mao1
 Zibin Song1
 Lei Han1
 Jianqi Xiao2*
 Ye Song1,3*Xian Zhang1*
Background: Gliomas are highly lethal brain tumors. Despite multimodality therapy with surgery, radiotherapy, chemotherapy, and immunotherapy, glioma prognosis remains poor. Ferroptosis is a crucial tumor suppressor mechanism that has been proven to be effective in anticancer therapy. However, the implications of ferroptosis on the clinical prognosis, chemotherapy, and immune checkpoint inhibitor (ICI) therapy for patients with glioma still need elucidation.
Methods: Consensus clustering revealed two distinct ferroptosis-related subtypes based on the Cancer Genome Atlas (TCGA) glioma dataset (n = 663). Subsequently, the ferroptosis-related gene prognostic index (FRGPI) was constructed by weighted gene co-expression network analysis (WGCNA) and “stepAIC” algorithms and validated with the Chinese Glioma Genome Atlas (CGGA) dataset (n = 404). Subsequently, the correlation among clinical, molecular, and immune features and FRGPI was analyzed. Next, the temozolomide sensitivity and ICI response for glioma were predicted using the “pRRophetic” and “TIDE” algorithms, respectively. Finally, candidate small molecular drugs were defined using the connectivity map database based on FRGPI.
Results: The FRGPI was established based on the HMOX1, TFRC, JUN, and SOCS1 genes. The distribution of FRGPI varied significantly among the different ferroptosis-related subtypes. Patients with high FRGPI had a worse overall prognosis than patients with low FRGPI, consistent with the results in the CGGA dataset. The final results showed that high FRGPI was characterized by more aggressive phenotypes, high PD-L1 expression, high tumor mutational burden score, and enhanced temozolomide sensitivity; low FRGPI was associated with less aggressive phenotypes, high microsatellite instability score, and stronger response to immune checkpoint blockade. In addition, the infiltration of memory resting CD4+ T cells, regulatory T cells, M1 macrophages, M2 macrophages, and neutrophils was positively correlated with FRGPI. In contrast, plasma B cells and naïve CD4+ T cells were negatively correlated. A total of 15 potential small molecule compounds (such as depactin, physostigmine, and phenacetin) were identified.
Conclusion: FRGPI is a promising gene panel for predicting the prognosis, immune characteristics, temozolomide sensitivity, and ICI response in patients with glioma.
Gliomas, including low grade (LGG, World Health Organization grades I–II) and high grade (HGG, World Health Organization grades III–IV), are the most common and lethal solid tumors of all brain cancers (Louis et al., 2016; Aldape et al., 2019). The annual incidence of gliomas is approximately six out of 100,000 individuals worldwide (Weller et al., 2021). Current glioma multimodal therapy includes surgery, radiotherapy, chemotherapy, and immunotherapy. Studies have identified IDH1 mutations, 1p19q chromosome deletions, and O-6-Methylguanine-DNA Methyltransferase (MGMT) epigenetic alterations as specific targets for enhancing treatment response, improving survival, and personalizing anticancer therapeutics (Nagashima et al., 2016). However, the overall prognosis remains poor, especially for glioblastomas, the most fatal of gliomas, which have 14.6 months of median survival (Tan et al., 2020). Additionally, there is 2- to 4-fold longer median survival in patients with IDH1 mutant glioma compared to those with IDH1 wild-type glioma (Yan et al., 2009; Nagashima et al., 2016).
Immune checkpoint inhibitors (ICI) have transformed the cancer treatment landscape, significantly improving survival (Brahmer et al., 2015; Larkin et al., 2015; Motzer et al., 2015; Bellmunt et al., 2017). Several studies have been conducted on immune-based therapy for gliomas, specifically for glioblastomas (Khasraw et al., 2020; Maire et al., 2020). Research has shown that standard therapies, including surgery, radiotherapy, and chemotherapy, may have immunosuppressive effects, further emphasizing opportunities to target the immune response for novel therapies (Lim et al., 2018). However, the initial results for trials of ICI, predominantly anti-PD-1/PD-L1 and anti-CTLA-4, have been disappointing, and a phase III trial of nivolumab versus bevacizumab for recurrent glioblastoma did not demonstrate any meaningful benefits (Lim et al., 2018; Jackson et al., 2019; McGranahan et al., 2019; Reardon et al., 2020). Temozolomide, an imidazotetrazine prodrug alkylating agent, is an oral chemotherapeutic drug that crosses the blood–brain barrier and is widely used in patients with glioma (Friedman et al., 2000). Although temozolomide is traditionally considered to have a direct antitumor effect, many studies have confirmed its immunomodulatory properties (Karachi et al., 2018). However, approximately 55% of the patients with glioblastoma present with temozolomide resistance because of high MGMT expression (Hegi et al., 2005; Donson et al., 2007; van Nifterik et al., 2010). The evasion of apoptosis is, to a large extent, one of the main obstacles leading to poor therapeutic effects in malignant glioma. Thus, bypassing apoptosis resistance is a promising approach to overcome this problem (Gong et al., 2019; Tang et al., 2021).
Ferroptosis is a non-apoptotic cell death mechanism defined as iron-dependent regulated necrosis induced by membrane rupture mediated by excessive lipid peroxidation (Chen et al., 2021; Jiang et al., 2021). Ferroptosis has been proven to be a crucial tumor suppressor mechanism and may influence chemotherapy effects by triggering immune responses (Angeli et al., 2019). Many studies have shown that the expression of ferroptosis-related genes (including GPX4, SLC7A11, and ACSL4) is associated with sensitivity to temozolomide in glioma cells (Hu et al., 2020). In addition, T cells and interferon-gamma (IFN-γ) sensitize cancer cells to ferroptosis. Subsequently, the damage-associated molecular patterns (such as high mobility group box 1, HMGB1) released by cancer cells undergoing ferroptosis may induce cancer cell immunogenicity. This suggests that the role of ferroptosis in cancer therapy has synergistic potential with immunotherapy (Angeli et al., 2019; Liang et al., 2019; Llabani et al., 2019; Stockwell and Jiang, 2019; Wen et al., 2019; Tang et al., 2020). Ferroptosis-resistant cancer cells do not respond to PD-L1 inhibitors, and the suppression of ferroptosis prevents gaining benefits from PD-L1 inhibitors (Wang et al., 2019). Direct evidence of the link between ferroptosis and antitumor immunity was not evident until Wang et al. demonstrated that immunotherapy-activated CD8+ T cells suppressed tumor growth by sensitizing tumors to ferroptosis via IFN-γ (Wang et al., 2019; Tang et al., 2020). In vitro culture with low cystine and in vivo data showed that ferroptosis was involved in T-cell-mediated cancer immunity (Wang et al., 2019). Moreover, Liu et al. developed the ferroptosis potential index (FPI) to explore the functional roles of ferroptosis in various cancers, revealing that ferroptosis was associated with survival, the immune system, and chemotherapy resistance (Liu et al., 2020). Unfortunately, there is no ferroptosis-related potential prognostic marker that can simultaneously predict immune characteristics, temozolomide sensitivity, and the response of glioma to ICI.
In this study, we focused on the effects of ferroptosis on the immune characteristics of glioma and aimed to find markers that can accurately predict survival and ICI response of all patients with glioma. We screened hub ferroptosis-related genes (FRGs) by consistency analysis, WGCNA, and “stepAIC” algorithms to construct a ferroptosis-related gene prognostic index (FRGPI). We examined the prognostic predictive ability of FRGPI and characterized its molecular and immune profiles. We then predicted the sensitivity of patients with different FRGPI to temozolomide via the Genomics of Drug Sensitivity in Cancer (GDSC) database and the “pRRophetic” algorithms. Furthermore, we explored the relationship between the FRGPI and ICI responses through “TIDE” algorithms and verified it in an ICI therapy cohort.
RNA sequencing (RNA-seq) and the corresponding complete clinical information for patients with glioma were retrieved from The Cancer Genome Atlas (TCGA) dataset (Version: 28.0, https://portal.gdc.cancer.gov/) and the Chinese Glioma Genome Atlas (CGGA) dataset (2021 Feb, http://www.cgga.org.cn/index.jsp) (Zhao et al., 2021). The main study was conducted using TCGA dataset (n = 663, including 248 LGG, 414 HGG, 1 unknown), and the CGGA dataset (n = 404, including 130 LGG and 274 HGG) was used for validation of the FRGPI for prognosis. The data of normal tissue samples were obtained from TCGA (n = 5), CGGA (n = 20), and GTEx (n = 2,642) (Version: 8.0, https://gtexportal.org/home/datasets). The gene-level transcription values were normalized to fragments per kilobase million (FPKM) and further transformed to log2 (FPKM+1) for downstream analysis. In addition, we used the “ComBat” function in the “sva” R package for the batcheffect within TCGA and GTEx datasets. Both somatic mutation data and copy number alteration data were obtained from TCGA database. The baseline clinical characteristics of glioma patients are shown in Supplementary Table 1. Twenty-four FRGs (Supplementary Table 2) were identified according to previously published literature (Liu et al., 2020). A total of 173 FRGs (Supplementary Table 3) were acquired from FerrDb (Version:1.0, http://www.zhounan.org/ferrdb/) (Zhou and Bao, 2020). A total of 1,793 IRGs (Supplementary Table 4) were obtained from ImmPort (https://www.immport.org/home) (Bhattacharya et al., 2018).
Human glioma cell lines U87-MG (HTB-14) and T98G (CRL-1690) were purchased from American Type Culture Collection (ATCC, Manassas, VA, United States). Human glioma cell lines were cultured in Dulbecco’s modified Eagle’s medium (DMEM; 06-1055-57-1A, Biological Industries) supplemented with 10% fetal bovine serum (FBS; 04-001-1A, Biological Industries) at 37°C with 5% CO2. The sources of all the cell lines were identified and verified by STR profiling. No mycoplasma contamination was detected in any of the cell lines by MycoSEQ™ Mycoplasma Real-Time PCR Detection Kit (ThermoFisher, 4460623).
We used a CCK-8 kit (Beyotime, C0039) to measure the proliferation of U87-MG and T98G cells. First, we measured the IC50 of erastin, a ferroptosis activator. A total of 1 × 10³ cells (100 μl per well) were cultured in four replicate wells of a 96-well plate in a medium containing 10% FBS for 24 h. Then, erastin at different concentrations (0, 5, 10, 20, and 40 μmol/L) was added to a 96-well plate and divided into five groups (with an equal volume of DMSO added to the blank control group). Finally, the CCK-8 reagent (10 μl) was added to 90 μl DMEM to generate a working solution, of which 100 μl was added per well and incubated for 2 h. We performed this assay for 24 and 48 h after adding erastin. In U87-MG group, IC50 of erastin is 14.49 uM while 16.57 uM in T98 group. We then identified the influence of erastin on the proliferation ability of two glioma cell lines by adding different concentrations of temozolomide. All operations are roughly the same as the previous steps. The cells seeded in 96-well plates and were allowed to grow for 24 h. Then gradient concentrations of temozolomide and IC50 concentrations of erastin were added together in a 96-well plate. The drug concentrations of erastin (IC50 of U87 and T98G) at 24 h were too high, and this meant more DMSO had to be added, which had large impact on cell viability and proliferation both in the experimental and control groups and affected the accuracy of the experiment. Therefore, we chose 48 h as a reasonable drug treatment time. After 48 h, a 1:9 CCK reagent to DMEM was made and 100 µl of this solution was added to each well and incubated for 2 h.
The subcellular distribution of proteins encoded by GPX4, FSP1, GCH1, and DHODH in human cell lines and their protein expression levels were investigated by confocal microscopy immunofluorescence (ICC-IF) and immunohistochemistry staining using the Human Protein Atlas database (Version: 21.0, https://www.proteinatlas.org/).
The number of unsupervised classes in TCGA-Glioma dataset was estimated and validated based on the mRNA expression profiles of 24 FRGs (Supplementary Table 2) and 94 ferroptosis suppressors (Supplementary Table 5) using the consensus clustering method by the “ConsesusClusterPlus” R package.
Mutation data were downloaded and visualized using the “maftools” R package to identify the somatic mutation landscape of patients with gliomas from TCGA database in distinct ferroptosis-related subtypes (Mayakonda et al., 2018). The immuneScore, stromalScore, and ESTIMATE score for each patient were calculated via the “estimate” R package (Yoshihara et al., 2013) and patients were divided into high and low immuneScore and stromalScore groups (based on the score above and below the median value, respectively). To make reliable immune infiltration estimations, we utilized the “immunedeconv” R package, which integrates six state-of-the-art algorithms, including TIMER, xCell, MCP-counter, CIBERSORT, EPIC, and quanTIseq (Sturm et al., 2019).
Gene set enrichment analysis (GSEA) was conducted using the hallmark gene set “h.all.v7.2.symbols.gmt” between two ferroptosis-related subtypes using the “GSEA” R package. Gene set variation analysis (GSVA) was performed with the “GSVA” R package to compute a ssGSEA score of each functional pathway in each patient with glioma. The pathways with nominal p-value < 0.05, and false discovery rate (FDR) < 0.05, were considered significantly enriched.
Differentially expressed genes (DEGs) with FDR < 0.05 and |Fold Change (FC)| ≥ 1 were identified among different clusters and groups using the “limma” R package and visualized using volcano plots and heatmaps. Weighted gene co-expression network analysis (WGCNA) (Langfelder and Horvath, 2008) was performed using the “WGCNA” R package (networkType = “unsigned”, minModuleSize = 30) to identify modules associated with ferroptosis (correlation coefficient > 0.50 and p-value < 0.05 were set as the inclusion criterion). Protein–protein interaction (PPI) analysis was performed using STRING database (https://string-db.org/). The FRGPI was established using the “stepAIC” algorithm in the “MASS” R package, and the model with the lowest Akaike Information Criterion (AIC) value was then chosen as the best model to yield the FRGPI equation with the coefficient multiplied by mRNA expression. According to this equation, the FRGPI of each patient was calculated separately for the training and validation cohorts. Subsequently, the patients were divided into high and low FRGPI groups, and the median value of the FRGPI score was set as the cut-off point. Principal component analysis (PCA) was performed using these signature genes. Univariate and multivariate Cox regression analyses were performed to identify the appropriate terms to build the nomogram. A forest plot was used to show the p-value, hazard ratio (HR), and 95% confidence interval (CI) of each variable through the “forestplot” R package. The nomogram was built based on the multivariate cox proportional hazards analysis (“p-value < 0.05” was set as the inclusion criterion) through the “rms” R package to predict the 1-, 3-, and 5-year overall survival (OS).
The FPI, which can be used to represent the potential level of ferroptosis based on transcriptome data, was computed for each sample according to previously published literature (Liu et al., 2020). Tumor mutational burden (TMB) score, microsatellite instability (MSI) score, and two independent stemness indices (mRNA expression-based stemness index, mRNAsi, and DNA methylation-based stemness index, mDNAsi) were calculated according to previously defined methods (Bonneville et al., 2017; Chalmers et al., 2017; Malta et al., 2018).
The sensitivity of each patient to temozolomide was estimated using the GDSC database (https://www.cancerrxgene.org/). The estimated half-maximal inhibitory concentration (IC50) was quantified via the “pRRophetic” R package. The potential ICI response was predicted using the TIDE algorithm (Jiang et al., 2018). Furthermore, one immunotherapy cohort (metastatic urothelial cancer treated with atezolizumab, IMvigor210 cohort) (Mariathasan et al., 2018) was included to validate the tumor response to PD-L1 blockade.
The DEGs (Supplementary Table 9) with FDR < 0.05 and |FC| ≥ 1 were identified as high- and low-FRGPI groups by the “limma” R package, and the function enrichment terms of DEGs were acquired from the STRING database (https://string-db.org/). Based on these DEGs, candidate small molecular drugs and mechanisms of action were defined using the connectivity map database (CMap, http://portals.broadinstitute.org/cmap/) (Lamb et al., 2006) and CMap mode-of-action analysis.
All statistical analyses were conducted using R software (version 4.0.2). The normality of the variables was tested using the Shapiro-Wilk normality test. For comparisons of two normally distributed groups, statistical analysis was performed using unpaired t-tests, and for non-normally distributed variables, statistical analysis was performed using the Wilcoxon rank-sum test. For comparisons of three or more groups, Kruskal-Wallis tests or one-way ANOVA were used as nonparametric or parametric methods, respectively. Correlations between normally distributed variables were assessed using Pearson’s correlation test, while correlations between non-normally distributed variables were assessed using Spearman’s correlation test. A p-value < 0.05, and |correlation coefficient |(R)| > 0.30 were considered as statistically significant. Kaplan–Meier curves for OS were presented between different subgroups, and OS comparisons were performed using the log-rank test. The receiver operating characteristic (ROC) curve was used to assess the prognosis classification performance of the FRGPI model, and the area under the curve (AUC) was calculated using the “timeROC” R package. All statistical p values were two-sided, with p < 0.05 considered statistically significant.
GPX4, FSP1, GCH1, and DHODH are key genes involved in cell ferroptosis defense (Zheng and Conrad, 2020; Mao et al., 2021). Immunofluorescence and confocal microscopy showed that GPX4 was mainly located in nucleoplasm and mitochondria, DHODH was located in the mitochondria, GCH1 was located in nucleoplasm and cytosol, and FSP1 was located in cytosol (Figures 1A–D). The analysis of mRNA expression profiles of glioma samples and non-tumor brain tissues provided evidence that GPX4, FSP1, and DHODH were highly expressed in tumoral tissue compared to that in non-tumor brain tissues (Figure 1E and Supplementary Figures 1A,B). Additionally, the expression of GCH1 and FSP1 increased with increasing malignancy of the tumor (Figure 1E); GPX4, FSP1, and GCH1 were highly expressed in patients with glioma and wild-type IDH1 compared to mutant IDH1 (Figure 1F). GPX4, FSP1, and GCH1 were highly expressed, while DHODH expression was low in patients with gliomas with a 1p19q non-codeletion compared to those with a 1p19q codeletion (Figure 1G). Immunohistochemistry (IHC) demonstrated that the four genes were highly expressed at the protein level in gliomas compared to non-tumor brain tissues (Supplementary Figures 1C,D). The CCK-8 assay results showed that ferroptosis induction by erastin inhibited proliferation and enhanced the sensitivity of U87MG and T98G cells to temozolomide (Figures 1H–K). These data indicate that ferroptosis played an important role in the maintenance, progression, and treatment of gliomas.
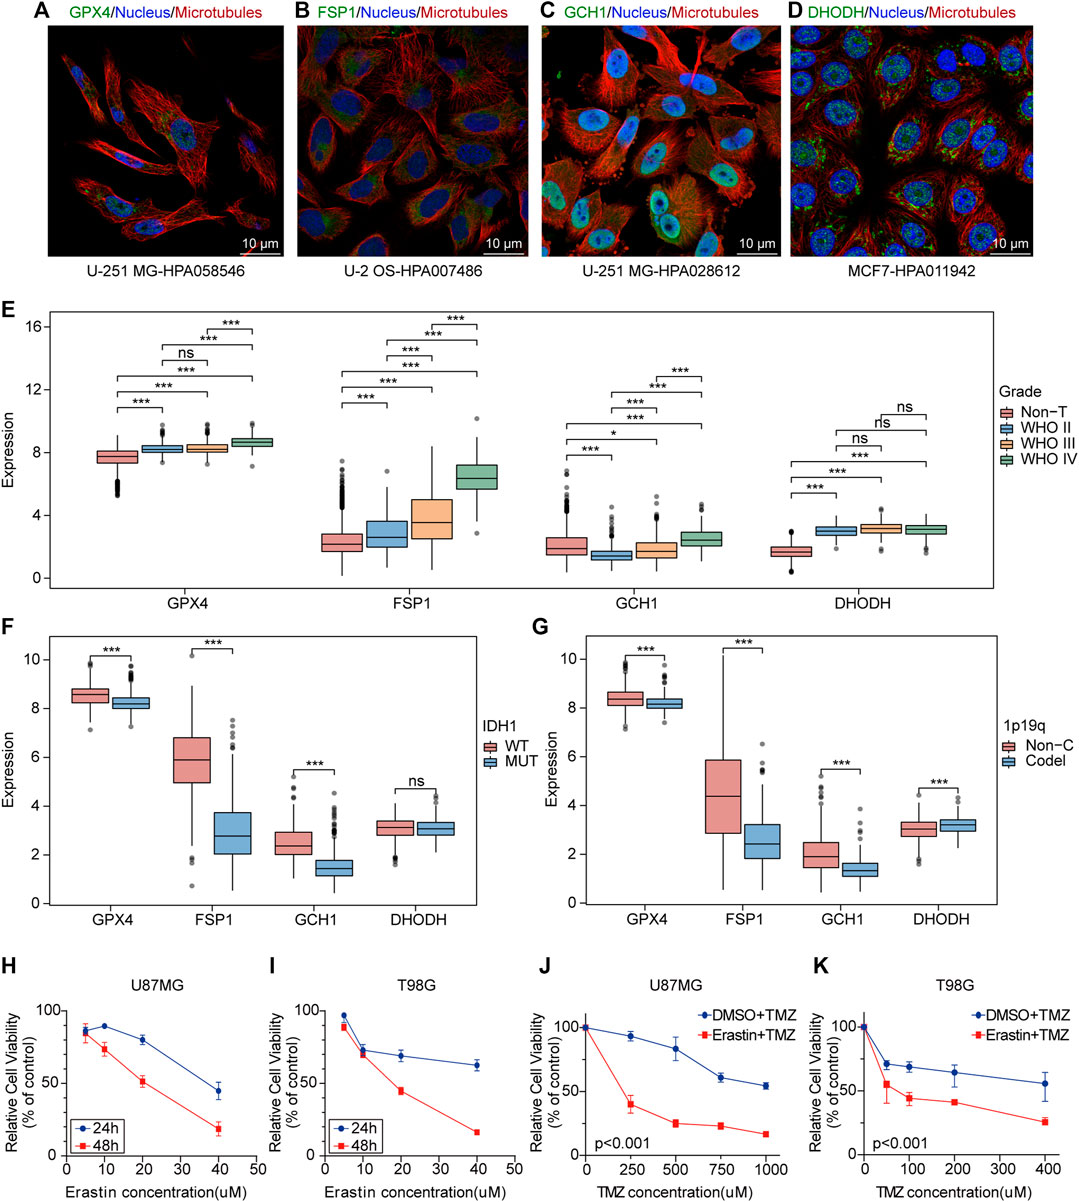
FIGURE 1. Ferroptosis plays an potential biological role in the progression and treatment of glioma. (A–D) Confocal immunofluorescence staining for GPX4, DHODH, GCH1, FSP1 in cell lines from HPA database. Green, antibody; blue, nucleus; red, microtubules. (E–G) Boxplots of GPX4, GCH1, FSP1 and DHODH expression in different grade, IDH1-status and 1p19q-codeletion-status glioma samples from TCGA database. ns, no significance; *p < 0.05; **p < 0.01; ***p < 0.001. (H,I) The cell viability of U87MG and T98G cells transfected with erastin was evaluated by the CCK-8 assays in 24 and 48 h. Five technical repeats were performed for two biological repeats. (G,K) The cell viability of U87MG and T98G cells transfected with erastin and temozolomide was evaluated by the CCK8 assays in 48 h. Five technical repeats were performed for two biological repeats.
We collected 24 FRGs according to Liu et al. (2020). Spearman correlation analysis indicated a significant correlation between the mRNA expression of FRGs and PDL-L1/CTAL4 (Figure 2A). Most FRGs were highly expressed in glioma tissues compared to non-tumor brain tissues, as shown in Figure 2B. The patients with glioma were divided into two ferroptosis-related subtypes (C1 and C2) by performing consistency analysis based on FRGs mRNA expression profiles (Figure 2C). The OS for patients in C1 was shorter than that for patients in C2 (Figure 2D). GPX4, GCH1, FSP1, and DHODH were expressed at higher levels in patients in C1 than in C2 (Figure 2E). The expression of FRGs and clinical features of the two subtypes were then compared (Figure 3A). The C1 group mainly contained patients with glioma over 60 years of age, preferentially associated with a high WHO grade and glioblastoma (Figures 3B–E). The oncoplot displaying the somatic landscape showed that IDH1, TP53, ATRX, and CIC mutation frequencies in C2 were higher than in C1, but PTEN and EGFR in C1 were higher than in C2 (Figures 3F,G). A total of 22 immune cell infiltration scores of each sample were estimated using the CIBERSORT algorithm. The scores of resting and activated memory CD4+ T cells, CD8+ T cells, regulatory T cells (Tregs), neutrophils, memory B cells, M0 macrophages, M1 macrophages, M2 macrophages, activated myeloid dendritic cells, and activated mast cells in the samples of C1 were higher than those of C2. However, the activated NK cell, resting mast cell, monocyte, naïve B cell, plasma B cell, and naïve CD4+ T cell scores in the samples of C1 were lower than in those in C2 (Figure 4A). The percentage of tumor-infiltrating immune cells in each sample is shown in Figure 4B. The ESTIMATE algorithm showed that the immuneScore and stromalScore in the samples of C1 were higher than those of C2 (Figures 4C,D). To elucidate the underlying regulatory mechanisms leading to the difference between the two ferroptosis subtypes in glioma, GSEA was performed. Our data indicated that PI3K_AKT_MTOR_SIGNALING, MTORC1_SIGNALING, GLYCOLYSIS, HYPOXIA, and APOPTOSIS were mainly enriched in the C1 group but were not enriched in the C2 group (Figure 4E). These results suggest that distinct differences in the clinical, genomic, and immune infiltration characteristics of ferroptosis-related subtypes were divided by the expression of 24 FRGs.
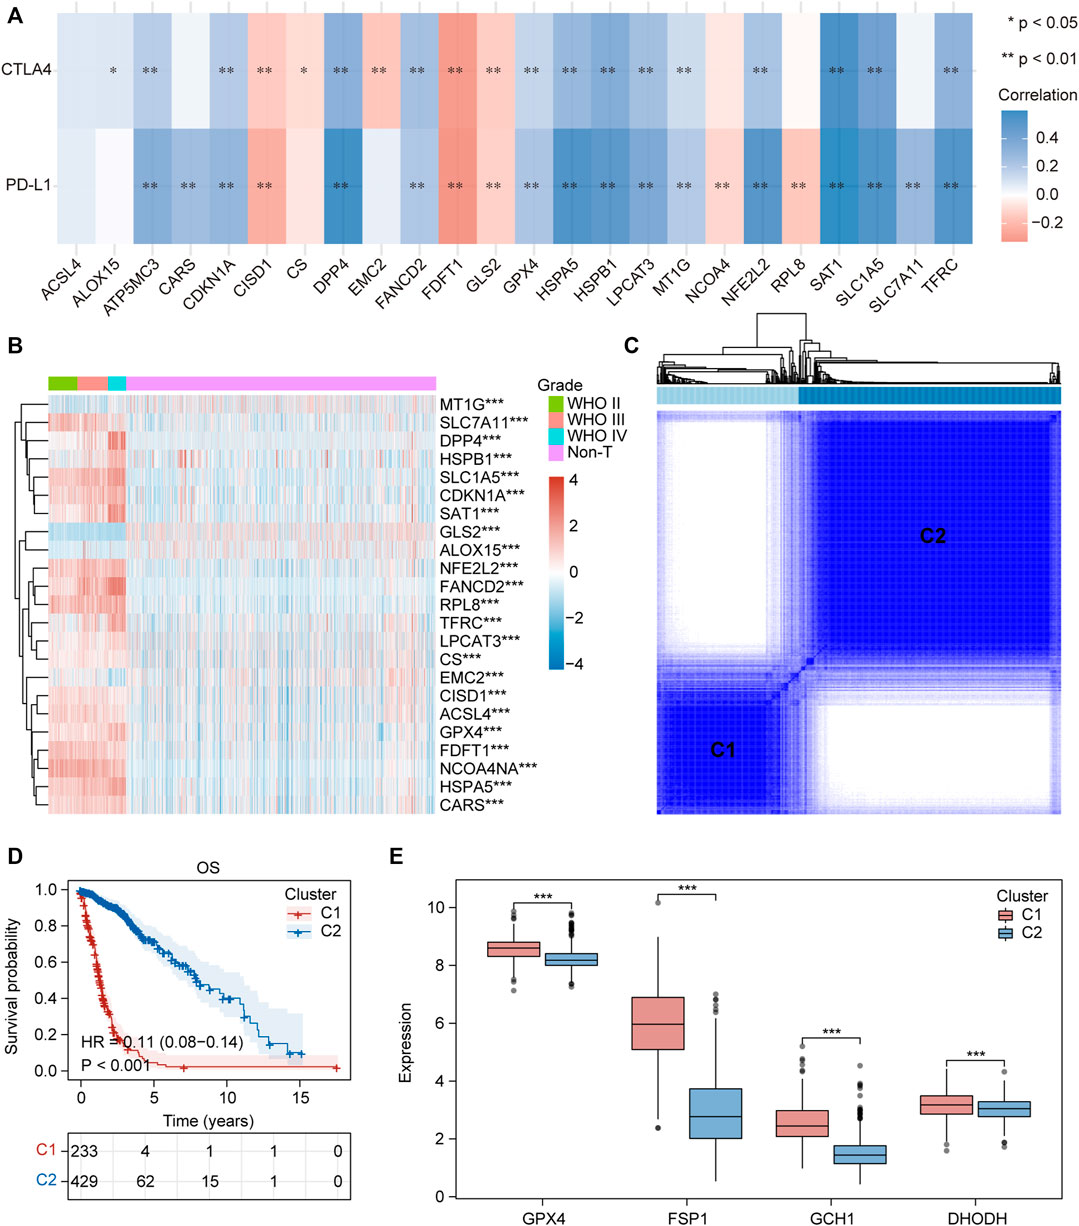
FIGURE 2. Two ferroptosis-related subtypes were identified based on the expression profile of FRGs. (A) Correlation heatmap between 24 FRGs expression and PDL-L1/CTAL4. Blue, positive correlation; red, negative correlation. *p < 0.05, **p < 0.01. (B) Heatmap depicted the FRGs expression profile landscape in gliomas of TCGA database. Red, high expression, blue, low expression. (C) Consensus clustering matrix for k = 2. (D) Kaplan–Meier analysis of patients in the two different ferroptosis-related subtypes. (E) Boxplots of GPX4, GCH1, FSP1 and DHODH expression level in the two different ferroptosis-related subtypes. ns, no significance; *p < 0.05; **p < 0.01; ***p < 0.001.
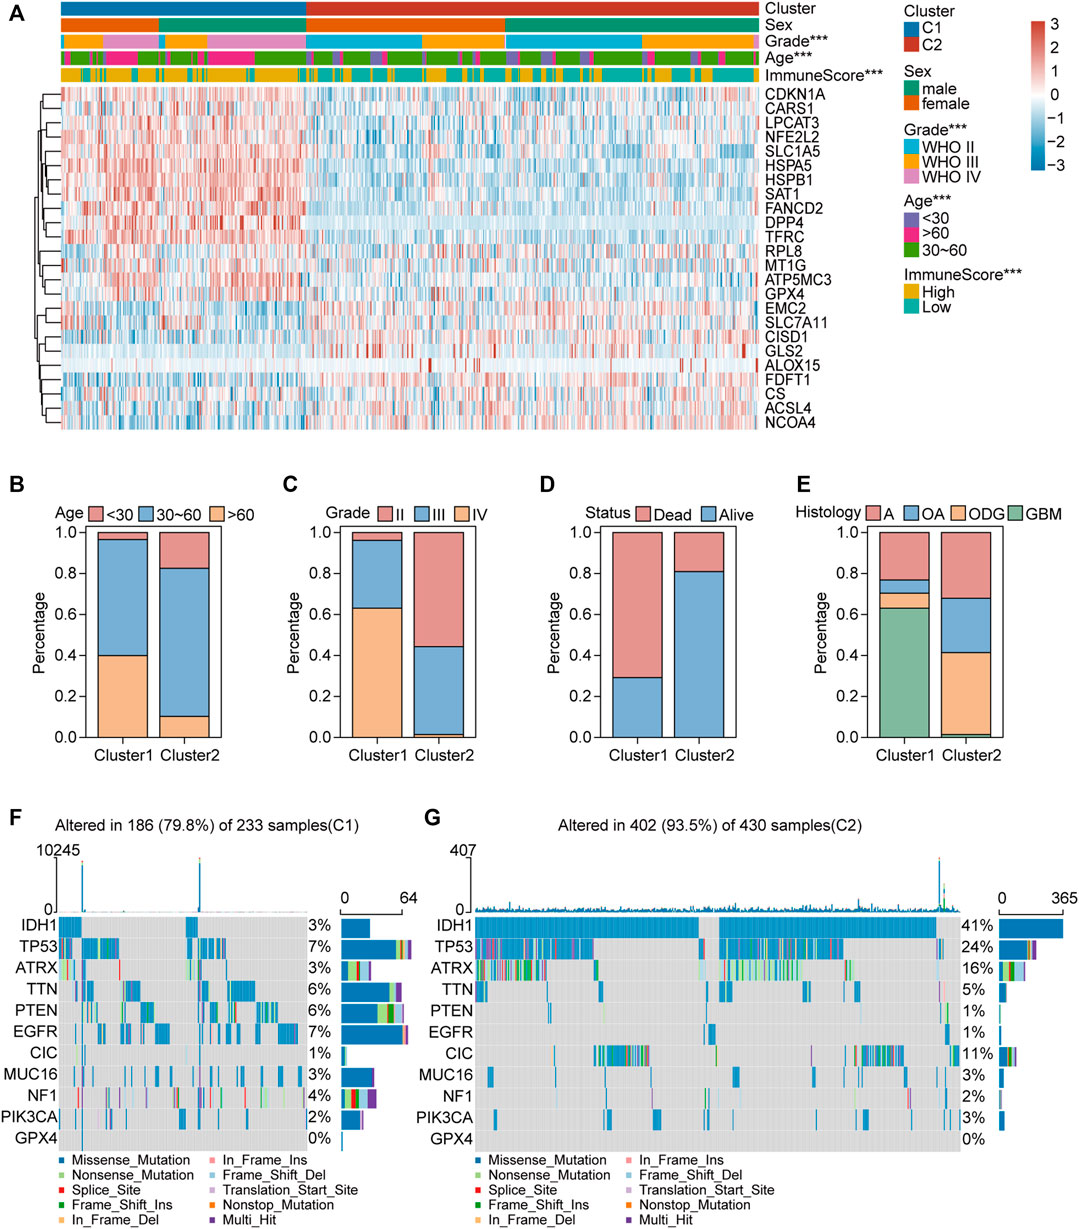
FIGURE 3. Clinical features and somatic landscapes of two ferroptosis-related subtypes. (A) Heatmap visualized the distribution of sex, age, grade, immuneScore between the two ferroptosis-related subtypes. *p < 0.05; **p < 0.01; ***p < 0.001. (B–E) Histograms depicted the differences of age, grade, status and histology between two ferroptosis-related subtypes. (F,G) Oncoplot displaying the somatic landscape of glioma cohort of two ferroptosis-related subtypes. Genes are ordered by their mutation frequency, and samples are ordered according to disease histology as indicated by the annotation bar (bottom). Side bar plot shows log10 transformed Q-values estimated by MutSigCV. Landscape of mutation profiles in OC samples. Mutation information of each gene in each sample was shown in the waterfall plot, where different colors with specific annotations at the bottom meant the various mutation types. The bar plot above the legend exhibited the number of mutation burden.
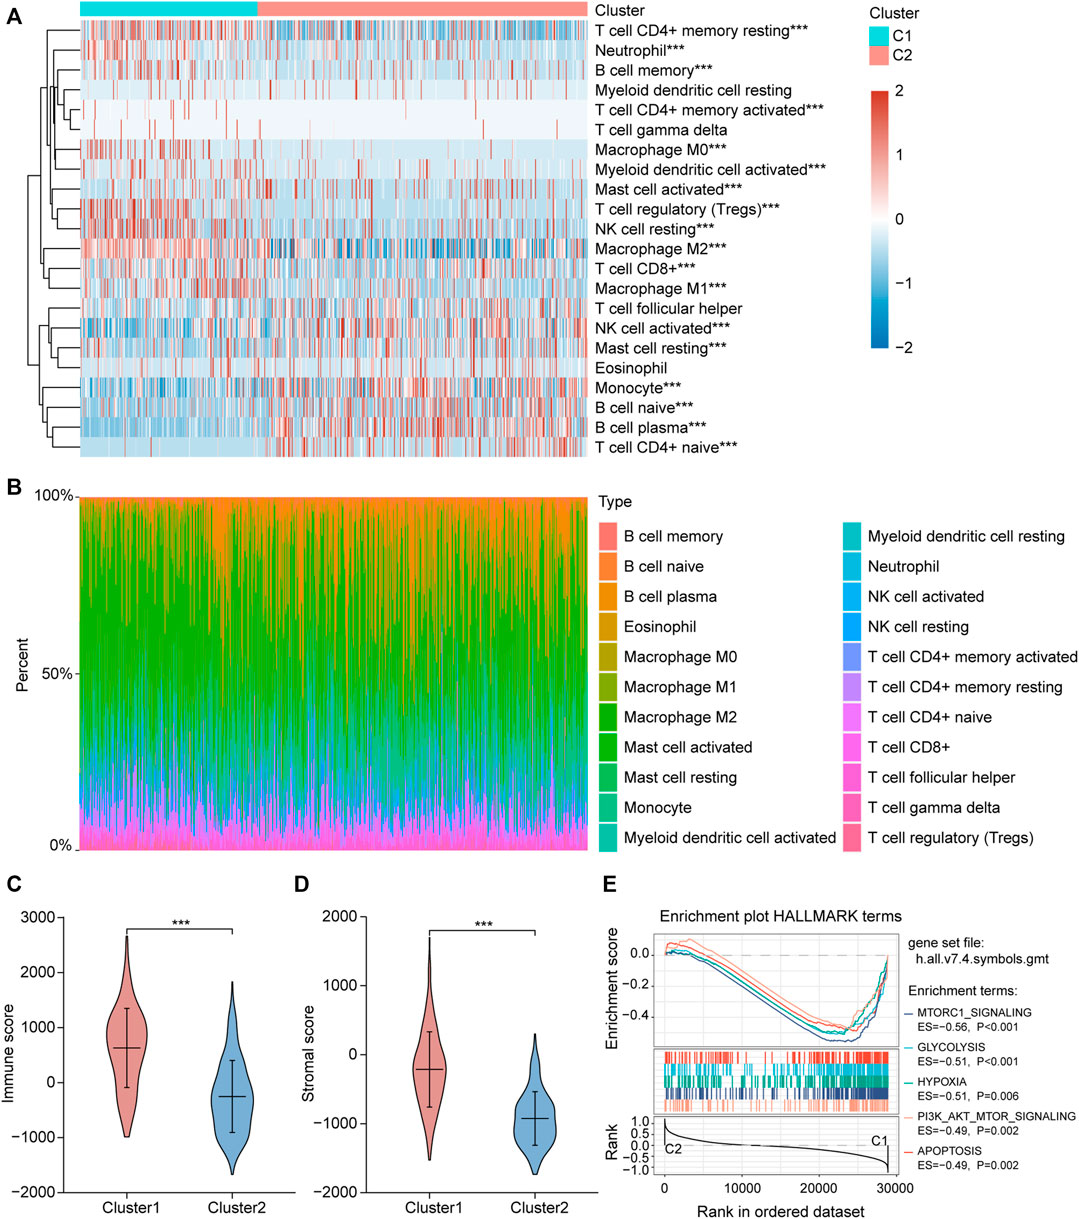
FIGURE 4. Different immune cell infiltration between two ferroptosis-related subtypes. (A) Immune cell score heat map, where different colors represent the expression trend in each sample between two ferroptosis-related subtypes. *p < 0.05, **p < 0.01, ***p < 0.001. (B) The percentage abundance of tumor infiltrating immune cells in each sample, with different colors and different types of immune cells. The abscissa represents the sample, and the ordinate represents the percentage of immune cell content in a single sample. (C,D) Violin plots of the immuneScore and stromalScore between the two ferroptosis-related subtypes. *p < 0.05, **p < 0.01, ***p < 0.001. (E) The enrichment plots of representative Gene Set Enrichment Analysis (GSEA) results. ES, enrichment score.
To verify this hypothesis, consistency analysis was performed based on 94 ferroptosis suppressors that have been verified in humans and dividing the sample into ferroptosis subgroups (including G1 and G2; Supplementary Figure 2A). Survival analysis revealed that patients in G2 had longer OS than those in G1 (Supplementary Figure 2B). The differences in immuneScore, stromalScore, and tumor-infiltrating immune cell scores between G1 and G2 were similar to the differences between C1 and C2 (Supplementary Figures 2C–E).
Differential expression gene analysis was performed between C1 and C2 or G1 and G2, and the DEGs (Supplementary Tables S6, S7) expression heatmap is shown in Figure 5A and Supplementary Figure 3A. WGCNA was performed to divide all protein-coding genes into 10 modules (Supplementary Figure 3B), of which the one most related to ferroptosis-related subtypes and tumor immunity was the blue module (Figure 5B). Then, 173 FRGs were acquired from the FerrDb database, and 1,793 IRGs were obtained from the ImmPort database. Furthermore, FRGs, IRGs, DEGs, and genes in the blue module (Supplementary Table 8) were intersected, and seven hub genes (JUN, TNFAIP3, NOX4, HMOX1, SOCS1, CYBB, and TFRC), related to both ferroptosis and tumor immunity, were obtained (Figure 5C). The protein-protein interaction network of the seven hub genes is shown in Supplementary Figure 3C. The seven hub genes were used to develop the FRGPI model in TCGA training set using the stepAIC algorithm. The optimal model equation was yielded using four factors (HMOX1, TFRC, JUN, and SOCS1) with the lowest AIC (Figure 5D):
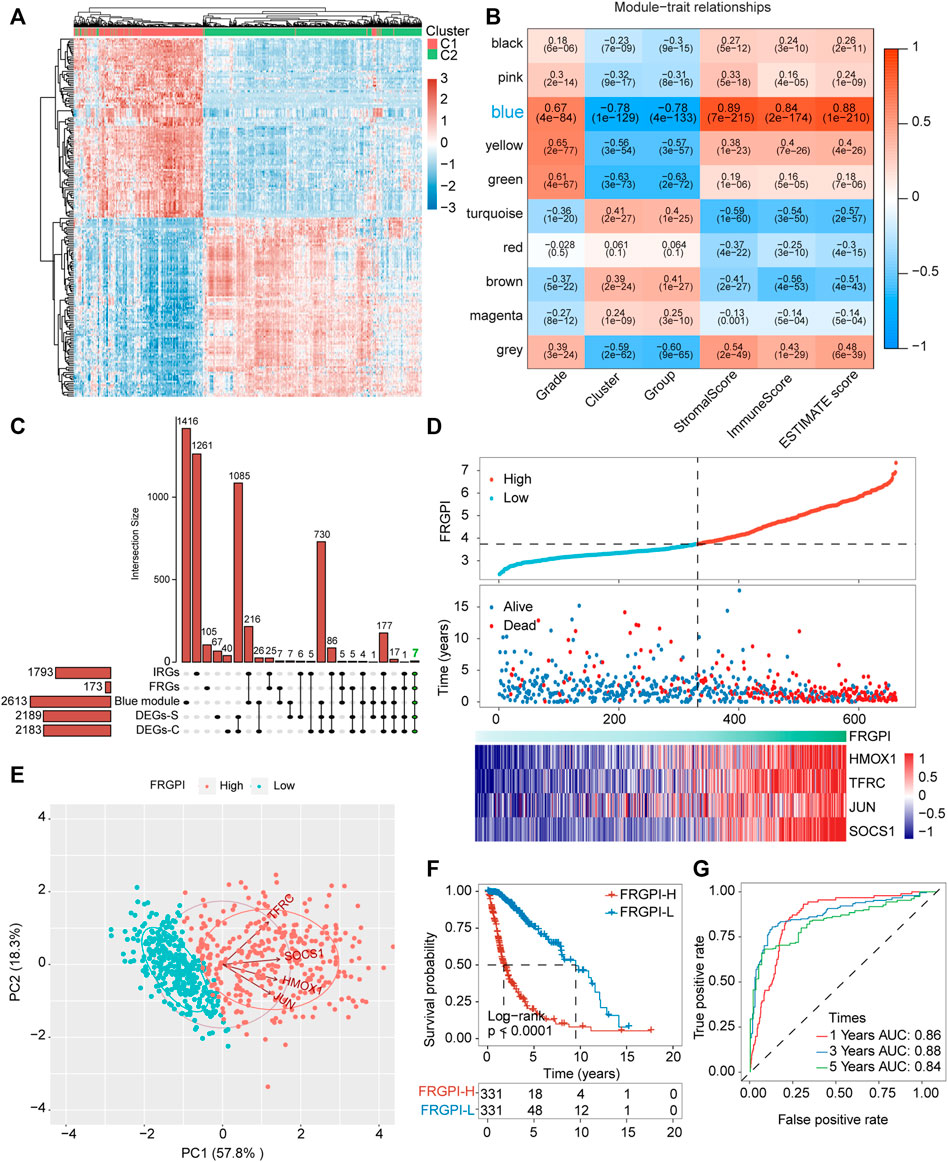
FIGURE 5. FRGPI was developed based on FRGs for glioma. (A) Differential gene expression heat map, where different colors represent expression trends in different tissues. Due to the large number of differential genes, the 50 up-regulated genes and 50 down-regulated genes with the largest differential changes are shown here. (B) Correlation of weighted gene correlation network analysis (WGCNA) modules with ferroptosis-related subtypes and immuneScore. (C) Upset plot for DEGs between the two ferroptosis-related subtypes, DEGs between the two ferroptosis-related subgroups, FRGs, IRGs and genes in blue module. IRGs, immune-related genes. (D) FRGPI, survival outcome and HMOX1, TFRC, JUN and SOCS1 expression profiles of each sample are shown. (E) Principal component analysis (PCA) plot of glioma samples based on HMOX1, TFRC, JUN and SOCS1 expression profiles. (F) Kaplan–Meier analysis of glioma patients with low or high FRGPI. (G) ROC curves predicted prognostic value of FRGPI in glioma patients.
The model was verified in the CGGA validation set (Supplementary Figure 4A). PCA verified that patients with glioma in TCGA training set or the CGGA validation set could be divided into high and low FRGPI groups, respectively (Figure 5E; Supplementary Figure 3D). Compared with low FRGPI, patients with glioma and a high FRGPI had a worse OS (Figure 5F; Supplementary Figure 4B), with a high predictive accuracy of FRGPI for OS (TCGA training set: 1 year AUC: 0.86, 3 years AUC: 0.88, 5 years AUC: 0.84; CGGA validation set: 1 year AUC: 0.60, 3 years AUC: 0.70, 5 years AUC: 0.70) (Figure 5G and Supplementary Figure 4C). Univariate and multivariate Cox regression analyses indicated that FRGPI was a variable independent of other clinical factors, including age, grade, IDH1 status, and 1p19q codeletion status (Figures 6A,B). Additionally, the prediction accuracy of FRGPI was highly stable in different clinical character groups, including <45 and >45-year age group, LGG (grade I–II gliomas are classified as LGG in the TCGA database) and GBM (grade IV gliomas) groups, IDH1-WT and IDH1-Mut groups, 1p19q non-codel group, except in 1p19q codel group, in TCGA training set (Supplementary Figures 5A–H), and these results were verified again in the CGGA validation set (Supplementary Figures 5I–P). A nomogram was developed based on the multivariate Cox proportional hazards analysis results to precisely calculate the prognostic total risk points for an individual (Figure 6C). The calibration curve showed that the predicted 1-, 3-, and 5-year survival probabilities by the nomogram were close to the actual survival probability (Figure 6D).
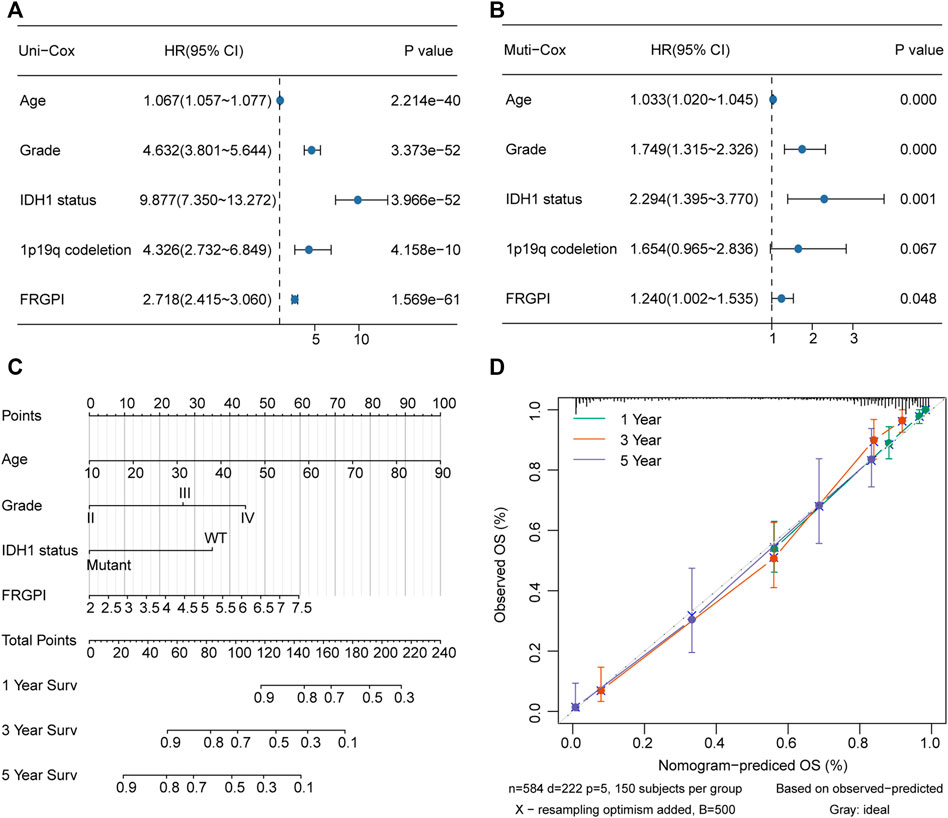
FIGURE 6. Nomogram was constructed to calculated prognostic risk score for individual. (A,B) Hazard ratio and p-value of constituents involved in univariate and multivariate Cox regression for FRGPI, age, grade, IDH1 status and 1p19q codeletion in TCGA glioma samples. (C) Nomogram to predict the 1-, 3- and 5-year OS of glioma patients. (D) Calibration curve indicated that predicted 1-, 3- and 5-year survival rates were close to the actual survival rates. The gray dashed diagonal line represents the ideal nomogram, and the green line, red line and blue line represent the 1-, 3- and 5-y observed nomograms.
The expression of TFRC, JUN, HMOX1, and SOCS1 and the clinicopathologic features between the two FRGPI groups were compared. TFRC, JUN, HMOX1, and SOCS1 were highly expressed in the high FRGPI group. Most of the patients with glioma in C1, with high WHO grade or high immuneScore, were distributed in the high FRGPI group (Figure 7A). The Sankey diagram fully summarized the association between FRGPI, ferroptosis-related subtypes, clinical characteristics, and prognostic signature (Figure 7B). In addition, GSVA was conducted to assess potential changes in pathway activity, and the results showed that most of the pathways associated with cancer progression were activated in patients with glioma with high FRGPI (Figure 7C). The FPI was established to model ferroptosis levels by Liu et al. We found that FRGPI was positively correlated with FPI (Figure 8A), which implied that FRGPI could also be associated with antitumor immunity and intrinsic immune escape in glioma. Spearman correlation test was conducted between FRGPI and stromalScore, immuneScore, the expression of PD-L1, TMB score, and MSI score (Figures 8B–F). FRGPI positively correlated with the stromalScore (Spearman: r = 0.670, p < 0.001), immuneScore (Spearman: r = 0.670, p < 0.001), PD-L1 expression (Spearman: r = 0.650, p < 0.001), and TMB score (Spearman: r = 0.440, p < 0.001), but negatively correlated with MSI score (Spearman: r = –0.410, p < 0.001). Previous research has indicated potential associations between the tumor immune microenvironment and cancer cell stemness (Saygin et al., 2019). We calculated stemness indices (mRNAsi and mDNAsi) for each glioma sample according to Malta et al. (2018), and found that FRGPI was negatively correlated with the mRNAsi score (Spearman: r = –0.520, p < 0.001, Figure 8G), but positively correlated with the mDNAsi score (Spearman: r = 0.560, p < 0.001, Figure 8H). Twenty-two immune cell infiltration scores of the different FRGPI groups were compared, and the correlation between FRGPI and each immune infiltrating cell score was calculated using the Spearman correlation test (Figure 8I). The scores of resting memory T cells CD4+ (Spearman: r = 0.37, p < 0.001), regulatory T cells (Spearman: r = 0.33, p < 0.001), M1 macrophages (Spearman: r = 0.31, p < 0.001), M2 macrophages (Spearman: r = 0.36, p < 0.001), and neutrophils (Spearman: r = 0.34, p < 0.001) were positively correlated with FRGPI, while the scores of plasma B cell (Spearman: r = –0.55, p < 0.001), and naïve T cell CD4+ (Spearman: r = –0.46, p < 0.001) were negatively correlated with FRGPI. These results indicate that FRGPI was associated with antitumor immunity and intrinsic immune escape in glioma. The GSVA results (Supplementary Figures 3E,F) showed FRGPI was highly correlated with PI3K_AKT_MTOR_SIGNALING (Spearman: r = 0.660, p < 0.001) and MTORC1_SIGNALING (Spearman: r = 0.810, p < 0.001).
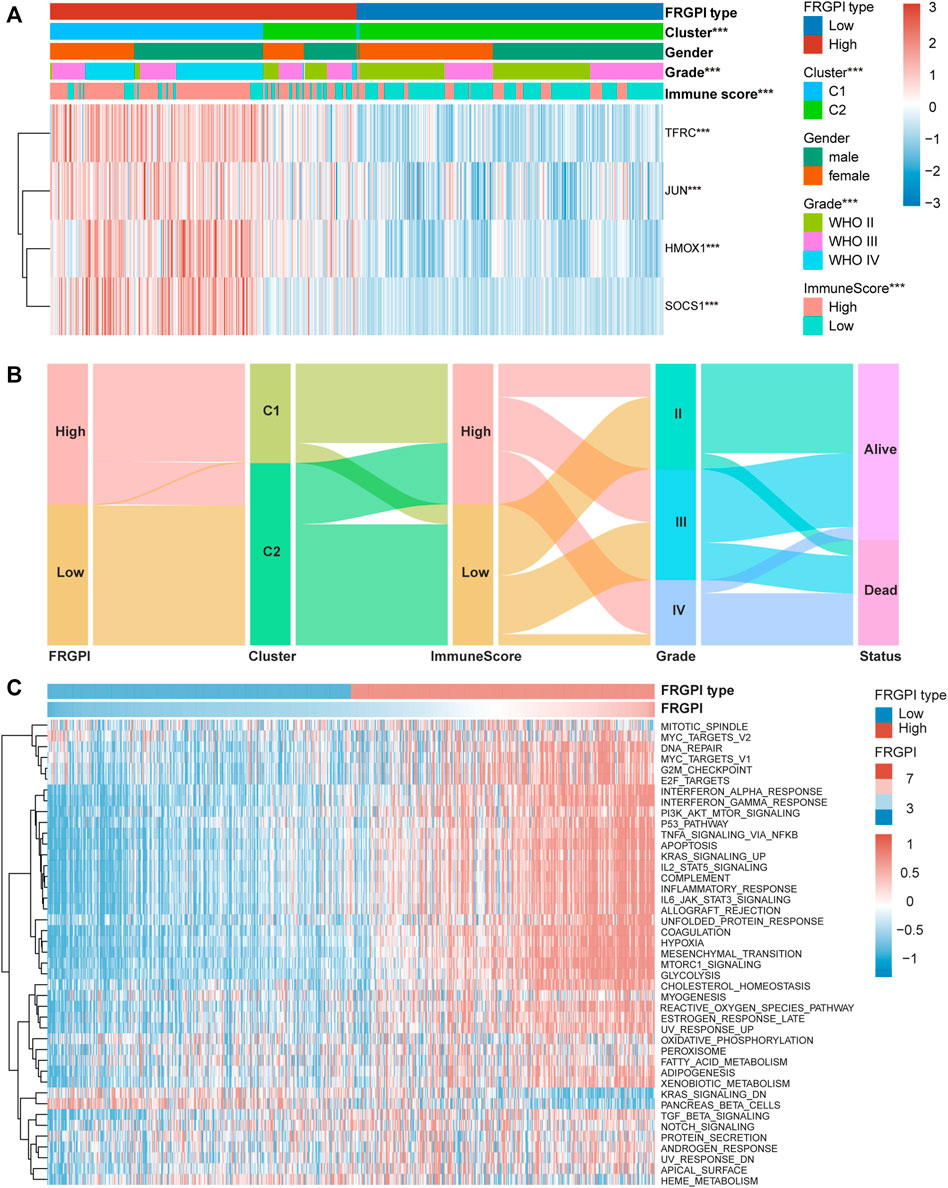
FIGURE 7. High FRGPI is associated with glioma progression. (A) Heatmap showed that ferroptosis-related subtypes, grade and immuneScore were significantly associated with FRGPI. *p < 0.05; **p < 0.01; ***p < 0.001. (B) The relationship between FRGPI, ferroptosis-related subtypes, immuneScore, grade and survival status in glioma patients was illustrated by the Sankey diagram. (C) Heatmap of Gene set variation analysis (GSVA) results between High and Low FRGPI groups.
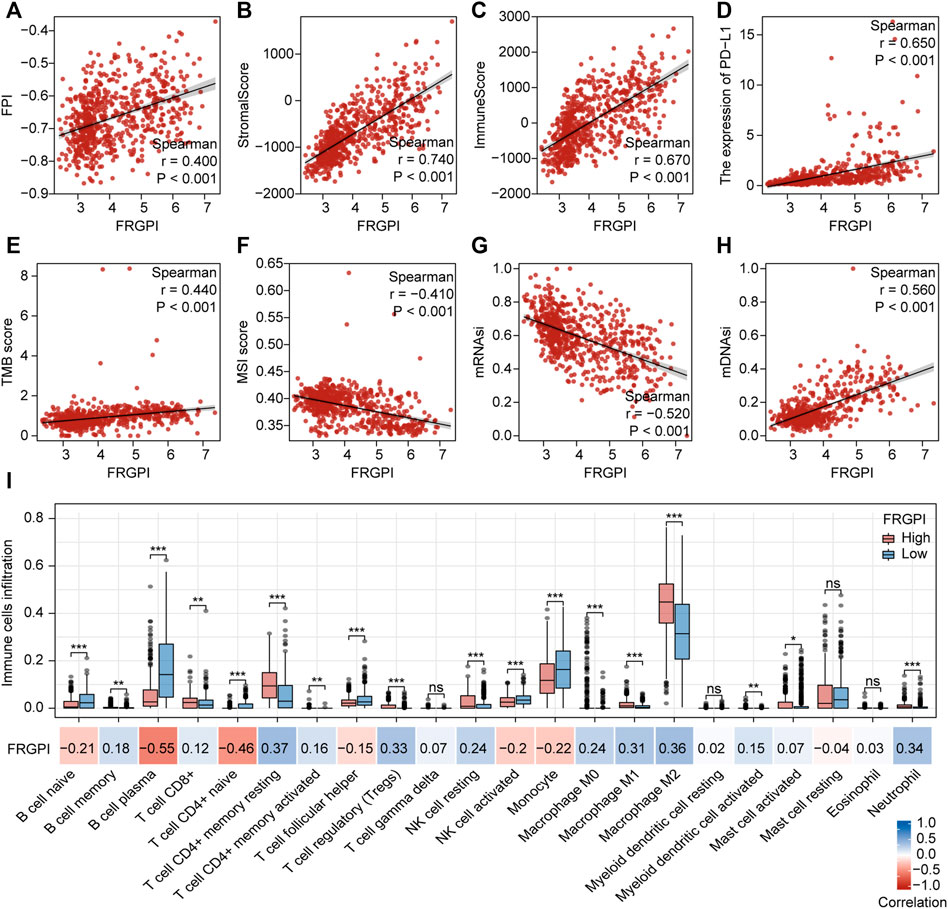
FIGURE 8. Anti-tumor immunity and intrinsic immune escape associated with FRGPI. Spearman correlation coefficients and associated p-value of FRGPI with (A) FPI, (B) stromalScore, (C) immuneScore, (D) the expression of PD-L1, (E) TMB score, (F) MSI score, (G) mRNAsi, (H) mDNAsi are shown. r, Spearman coefficient; ns, no significance; *p < 0.05; **p < 0.01; ***p < 0.001. (I) Different immune cell infiltration between high and low FRGPI group, and the correlation between FRGPI and immune cells infiltration. ns, no significance; *p < 0.05; **p < 0.01; ***p < 0.001; blue, positive correlation; red, negative correlation.
Next, we explored the role of FRGPI in the treatment of glioma. We investigated if FRGPI predicts the sensitivity of gliomas to temozolomide chemotherapy. Our data suggested that the estimated IC50 of temozolomide in the high FRGPI group was significantly lower than that in the low FRGPI group (Figure 9A), and FRGPI was negatively correlated with the IC50 of temozolomide (Spearman: r = –0.180, p < 0.001; Figure 9B), suggesting that patients with glioma and high FRGPI were more sensitive to temozolomide therapy. Then, the correlation between FRGPI and the sensitivity of immunotherapy for glioma was explored. The potential ICI response was predicted using the TIDE algorithm. Our data suggested that the proportion of people responding to ICI therapy in the low FRGPI group was greater than that of the high FRGPI group (Figure 9C), and the “TURE-responder” group had significantly lower FRGPI than the “FALSE-responder” group (Figure 9D). The low FRGPI group had significantly lower TIDE scores than the high FRGPI group (Figure 9E), and FRGPI was positively correlated with the TIDE score (Spearman: r = 0.300, p < 0.001; Figure 9F), indicating that patients with low FRGPI had better response and efficacy to ICI therapy. In addition, we verified the reliability of FRGPI in predicting the benefit of immunotherapy in patients with urothelial cancer who received anti-PD-L1 immunotherapy in IMvigor210 cohorts. The low FRGPI group had a longer survival time after anti-PD-L1 therapy than the high FRGPI group (Figure 9G), and the complete response (CR)/partial response (PR) group had lower FRGPI than the stable disease (SD)/progressive disease (PD) group (Figure 9H). The ROC curve suggested that FRGPI combined with neoantigen and TMB could predict the benefit of anti-PD-L1 therapy more accurately (complex, AUC = 0.74; Figure 9I). The IC2+ level group, TC2+ level group, and inflamed phenotypes had the lowest FRGPI in terms of PD-L1 expression level in immune cells (IC level), PD-L1 expression level in tumor cells (TC level), and immune phenotype, respectively (Figures 9J–L). The above results indicate that patients with glioma and low FRGPI could be more sensitive to ICI therapy, especially anti-PD-1 therapy.
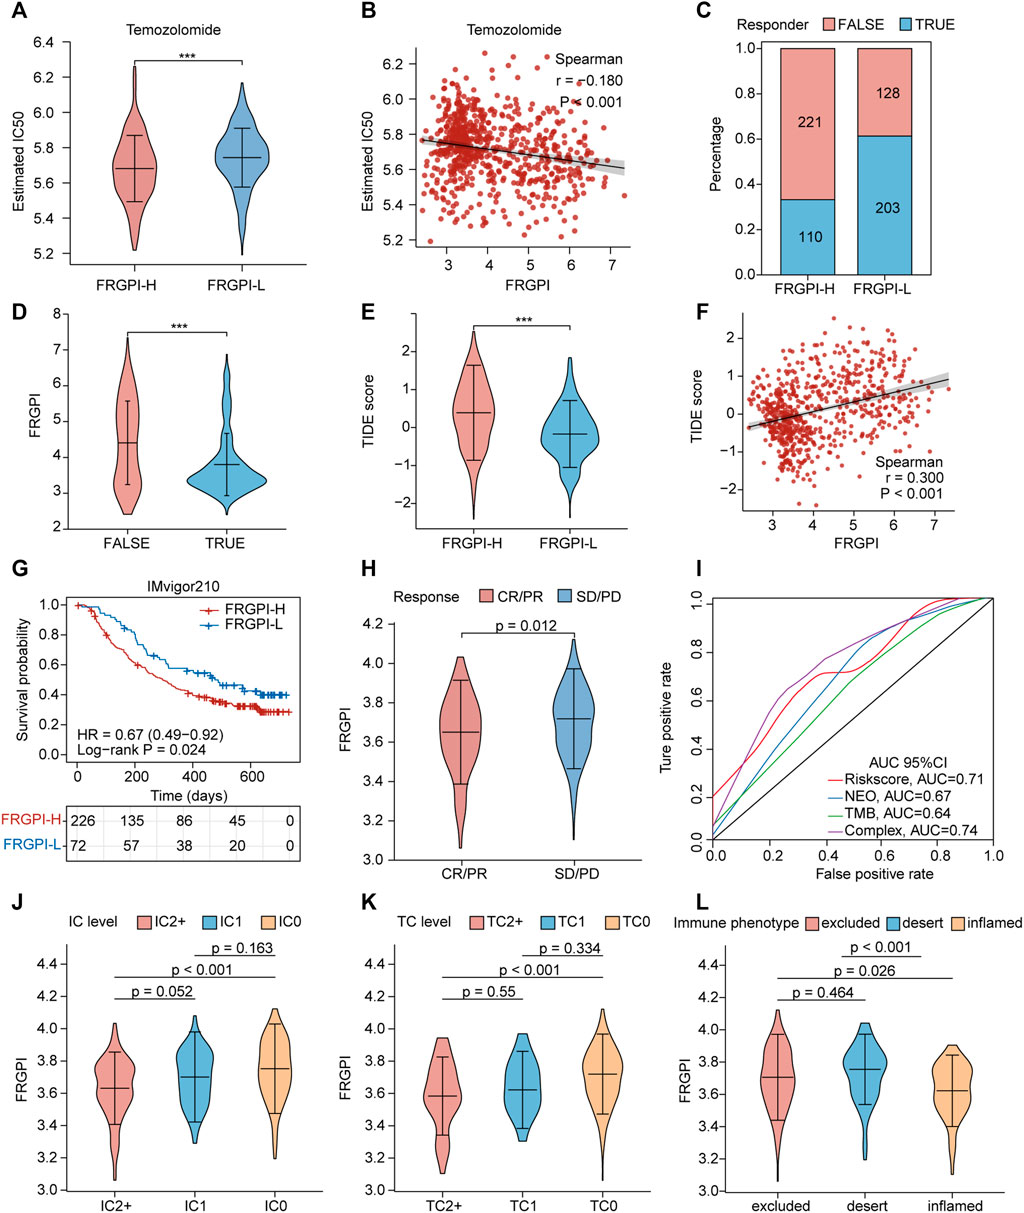
FIGURE 9. FRGPI is predictive of temozolomide sensitivity and ICI response in glioma. (A) Different estimated temozolomide IC50 between high and low FRGPI group. (B) The spearman correlation between FRGPI and estimated temozolomide IC50. The ICI response of each patient in high and low FRGPI group was predicted by TIDE algorithm, (C) stacked histogram showed the distribution of “TURE” or “FALSE” responder in high and low FRGPI group; (D,E) Violin plots showed the FRGPI level of “TURE”- and “FALSE”-responder group, and the different TIDE score between high- and low-FRGPI group. (F) The spearman correlation between FRGPI and TIDE score. (G) Kaplan–Meier curves showing overall survival in patients with low or high FRGPI in the anti-PD-L1 cohort. (H) The distribution of FRGPI in distinct anti-PD-L1 clinical response groups. (I) Roc curves showing predicting value of FRGPI, neoantigen (NEO), TMB and complex (FRGPI combined with NEO and TMB) group for anti-PD-L1 therapy response. CR, complete response; PD, disease progression, PR, partial response; SD, stable disease. (J–L) Distribution of the FRGPI in distinct IC-level, TC-level and immune-phenotype group respectively in the anti-PD-L1 cohort. IC-level, PD-L1 expression level on immune cells; TC-level, PD-L1 expression level on tumor cells.
The DEGs between the high and low FRGPI groups were further analyzed to identify potential small molecule compounds for glioma treatment. Consequently, 263 DEGs (Supplementary Table 9) were identified, including 184 upregulated and 79 downregulated genes (Supplementary Figure 3G). Functional enrichment analysis revealed that the DEGs were mainly enriched in response to cytokines, cytokine-mediated signaling pathways, cytokine signaling in the immune system, innate immune system, and phagosomes (Figure 10A; Supplementary Table 10). The DEGs were uploaded to the CMap database, and the underlying mechanisms of drug action were analyzed. As shown in Figure 10B, a total of 15 potential small molecule compounds (such as depactin, physostigmine, and phenacetin) and 15 drug action mechanisms (such as HDAC inhibitor, acetylcholinesterase inhibitor, cyclooxygenase inhibitor) were identified, which provide a reference to search for potential drugs for the treatment of glioma.
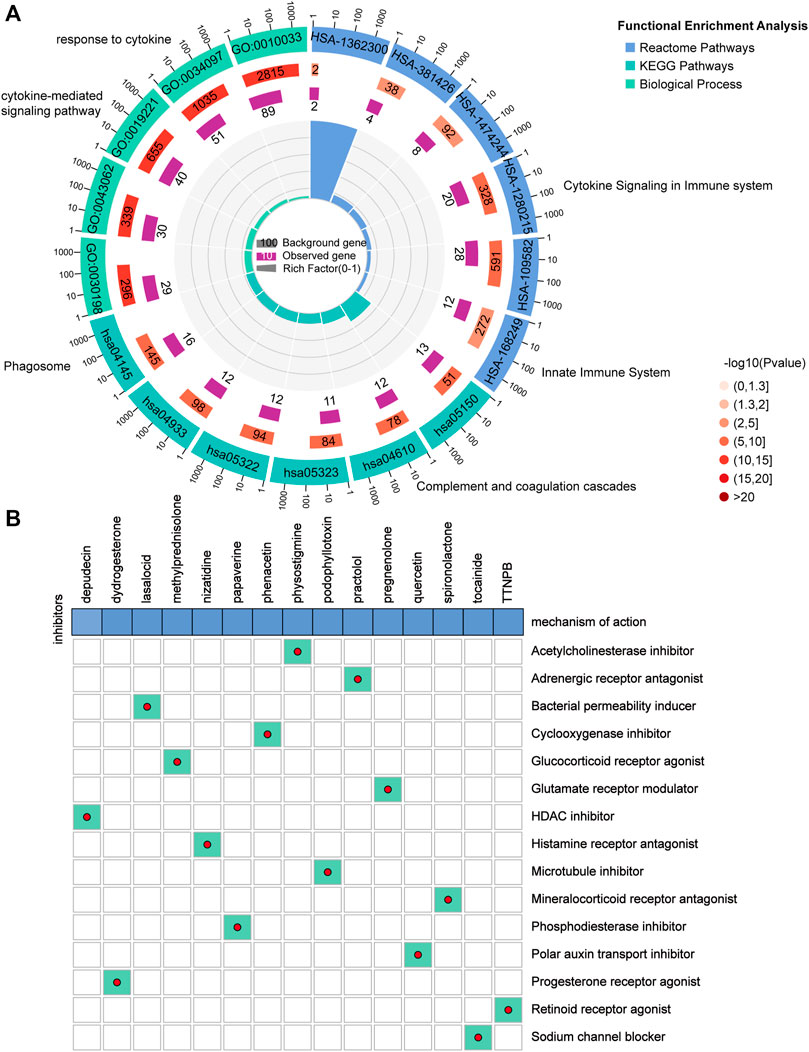
FIGURE 10. Potential small molecule compounds based on PRGPI. (A) Function enrichment analysis results of 263 DEGs between the high and low FRGPI groups. (B) Candidate small molecular drugs and mechanisms of action were discovered based on FRGPI. The abscissa represents the drugs, and the ordinate represents drug mechanisms of action.
In this study, we successfully developed a ferroptosis-related gene prognostic index (FRGPI) to predict the sensitivity to temozolomide and the response to ICI therapy in patients with glioma. We comprehensively analyzed the role of FRGPI to identify different clinicopathological, molecular, and immune characteristics of patients with glioma that could improve treatment selection. From a new perspective of ferroptosis and glioma immune microenvironment regulation, our study can be used for more effective chemotherapy, immunotherapy, and targeted therapy plans for glioma.
Studies identified at least three major ferroptosis defense mechanisms have been identified in cells. Glutathione peroxidase 4 (GPX4) protects cells from ferroptosis by specifically catalyzing lipid peroxides in a glutathione-dependent manner (Seibt et al., 2019). Ferroptosis suppressor protein 1 (FSP1), locating on the cell membrane, prevents lipid peroxidation on the cell membrane and thus inhibiting ferroptosis by reducing ubiquinone (CoQ) to dihydroubiquinone (CoQH2) (Bersuker et al., 2019; Doll et al., 2019). Guanosine triphosphate cyclic hydrolase (GCH1), a rate-limiting enzyme for the synthesis of tetrahydrobiopterin (BH4), counteracts ferroptosis in a GPX4-independent manner (Kraft et al., 2020; Soula et al., 2020). Until Mao et al. discovered a new inhibitor of ferroptosis, dihydrowhey dehydrogenase (DHODH), which is independent of the classical GPX4 signaling pathway, and discovered the way of ferroptosis based on mitochondrial lipid peroxidation for the first time (Mao et al., 2021). Mao et al. proposed that there are at least three different subcellular localization of ferroptosis defense systems in cells: GPX4 in cytoplasm and mitochondria, FSP1 in plasma membrane, and DHODH in mitochondria, among which DHODH and GPX4 are the two main suppressors to defense against ferroptosis in mitochondrial (Mao et al., 2021). Tran et al. have demosrated GCH1 has an obvious ascending trend with grade increase, and plays a role in promoting progression in GBM (Tran et al., 2018), suggesting that GCH1 may play a more important role in high-grade glioma, while its role in low-grade glioma needs further discussion in the future. Our analysis showed that GPX4, FSP1, GCH1, and DHODH were more highly expressed in tumor tissue than in non-tumor brain tissue, especially in high-grade, IDH1 wild type, 1p19q non-codeletion gliomas, suggesting that glioma cells had a strong potential to resist ferroptosis. Identifying markers that could affect tumor immunity and ferroptosis status for the construction of FRGPI is pivotal. First, based on the expression profiles of FRGs, patients in TCGA cohort with glioma were divided into two ferroptosis-related subtypes (C1 and C2) with distinct differences in molecular and immune characteristics. GPX4, FSP1, GCH1, and DHODH were significantly upregulated in the patients of C1, implying that C1 represented a ferroptosis-suppressive status. Some genetic aberrations in glioma have been known for years, such as IDH1, TP53, MGMT, EGFR, ATRX, PTEN, AND CIC (Siegal, 2015; Weissmann et al., 2018; Ghosh et al., 2019). Our results showed that IDH1, TP53, ATRX, and CIC mutation frequencies in C2 were higher than in C1, but PTEN and EGFR in C1 were higher than in C2, suggesting that mutation frequencies of those genes may lead to different ferroptosis status. The patients in C1 had a worse overall prognosis than those in C2, indicating that identifying subtypes with different ferroptosis statuses had clinical prognostic implications. We then utilized WGCNA to identify candidate genes related to ferroptosis status and immunity. Afterward, we applied the “stepAIC” algorithm to construct the FRGPI based on four genes (HMOX1, TFRC, JUN, and SOCS1). The FRGPI proved to be an independent ferroptosis-related prognostic biomarker for glioma, with better survival in patients with FRGPI-low and worse survival in patients with FRGPI-high in both TCGA and CGGA cohorts.
FRGPI comprises four genes, HMOX1, TFRC, JUN, and SOCS1. Heme oxygenase 1 (HMOX1), a membrane-bound enzyme that cleaves the heme ring at the alpha-methene bridge to produce biliverdin, iron, and carbon monoxide, catalyzes the degradation of heme. Chang et al. discovered that HMOX1 was a key mediator of BAY 11-7085 -induced ferroptosis that operated through cellular redox regulation and iron accumulation (Chang et al., 2018). Lu et al. (2019) discovered that the overexpression of HMOX1 enhanced both erastin- and RSL-3-triggered lipid reactive oxygen species to enhance ferroptosis. Arnold et al. (2014) observed that macrophages overexpressing HMOX1 led to tumor immune suppression in pancreatic ductal adenocarcinoma. In addition, HMOX1 was also observed to be related to immune suppression in neuroblastoma (Fest et al., 2016). The transferrin receptor (TFRC) encodes a cell surface receptor necessary for cellular iron uptake by receptor-mediated endocytosis. Wu et al. (2019) indicated that upregulation of TFRC promoted ferroptosis. Crepin et al. (2010) defined a novel class of fully human anti-TFRC antibodies suitable for immunotherapy against tumors whose proliferation depended on high levels of TFRC and iron uptake, such as myeloid leukemia and acute lymphoid. Jun proto-oncogene, AP-1 transcription factor subunit (JUN, also known as c-Jun) encodes a protein that is highly similar to the viral protein and interacts directly with specific target DNA sequences to regulate gene expression. A study observed that erastin could inhibit O-GlcNAcylation of c-Jun to suppress the malignant phenotypes of liver cancer cells (Chen et al., 2019). C-Jun has been shown to be related to T-cell proliferation and PD-L1 expression (Jiang et al., 2013; Zdanov et al., 2016). The suppressor of cytokine signaling 1 (SOCS1) encodes a member of the STAT-induced STAT inhibitor, which functions downstream of cytokine receptors and takes part in a negative feedback loop to attenuate cytokine signaling. Saint-Germain et al. (2017) revealed that exogenous SOCS1 was sufficient to regulate the sensitivity of cells to ferroptosis by reducing the expression of the cystine transporter SLC7A11 and the level of glutathione. Saudemont et al. (2007) demonstrated that SOCS1 expression restored via demethylation contributed to the resistance of tumor cells to CD8+ CTL-mediated killing. In the FRGPI calculation formula, the coefficients of HMOX1, TFRC, JUN, and SOCS1 were positive. Therefore, there was a positive relationship between FRGPI, HMOX1, TFRC, JUN, and SOCS1, and they were promising therapeutic targets for glioma. Liu et al. (2020) established the ferroptosis potential index (FPI) based on 24 FRGs to explore the functional roles of ferroptosis and revealed that ferroptosis was associated with clinical features and the immune microenvironment in cancers. FRGPI was positively correlated with FPI, implying that FRGPI was a simpler and more convenient ferroptosis potential indicator in gliomas. In summary, FRGPI has been found to be a prognostic biomarker associated with cell sensitivity to ferroptosis and tumor immunity.
Screening patients with glioma who are good candidates for temozolomide chemotherapy and ICI therapy was a vital function of the FRGPI. Our data showed that patients with a high FRGPI were more sensitive to temozolomide treatment than those with a low FRGPI. Additionally, the low FRGPI group had a stronger response to ICI and better efficacy from ICI therapy than the group with a high FRGPI. Stemness, defined as the potential for self-renewal and differentiation from the cell of origin, is highly associated with tumor progression and chemoresistance (Shibue and Weinberg, 2017; Su et al., 2018; Cooper and Giancotti, 2019). Malta et al. (2018) developed stemness indexes (including mRNAsi and mDNAsi) to reveal intra-tumor molecular heterogeneity and indicated a strong relationship between immune microenvironment content and stemness. Our results showed that patients with a high FRGPI had lower mRNAsi but higher mDNAsi than those with a low FRGPI, indicating that FRGPI could affect chemoresistance and ICI response by altering tumor cell stemness. We also explored the correlation between the FRGPI and PD-L1, TMB, and MSI, which are well-known predictive biomarkers for immunotherapy. In general, PD-L1-positive cancers tended to respond to anti-PD-1/PD-L1 therapies compared to PD-L1-negative cancers (Hansen and Siu, 2016). However, our results showed that the FRGPI had a negative ICI response but was positively related to the expression of PD-L1. PD-L1 expression within the tumor microenvironment has predictive value for assessing response to anti-PD-1/PD-L1 in many studies in melanoma (Weber et al., 2017), non-small-cell lung cancer (Fehrenbacher et al., 2016), and bladder cancer (Rosenberg et al., 2016) but this was not a consistent finding (Rosenberg et al., 2016; Sharma et al., 2017). Noticeably, tumors with negative PD-L1 that escaped immune elimination were still sensitive to antibody-mediated PD-L1 inhibitors (Noguchi et al., 2017). We hypothesized that the subcellular distribution of PD-L1 in glioma tissues was more valuable than the PD-L1 expression level measured by transcriptome data. Therefore, further studies are necessary to clarify the relationship between the subcellular distribution of PD-L1 and the FRGPI. TMB and MSI have been recently evaluated as potential biomarkers for predicting ICI response in many cancer types (Bonneville et al., 2017; Yarchoan et al., 2017). Here, we found that the FRGPI had a significant correlation with TMB and MSI scores, which implied that TMB and MSI could explain why the FRGPI affected the response of patients with glioma to ICI, although there are other possible mechanisms involved in it.
The tumor immune microenvironment (TIME) is closely related to the progression, chemoresistance, and immunotherapy response (Cao and Yan, 2020; Hegde and Chen, 2020). Understanding the landscape of the TIME could help find new treatments for glioma or alter the TIME to improve the efficacy of immunotherapy. The infiltration of immune cells was distinct between the two subgroups. CD8+ T cells, resting and activated memory CD4+ T cells, regulatory T cells, resting NK cells, M0, M1, and M2 macrophages, activated myeloid dendritic cells, activated mast cells, memory B cells, and neutrophils were mainly enriched in the FRGPI-high subgroup with a worse prognosis, while naive CD4+ T cells, follicular helper T cells, activated NK cells, plasma B cells, naïve B cells, and monocytes were more common in the FRGPI-low subgroup with a better prognosis. Numerous studies have shown that dense infiltration of cytotoxic CD8+ T cells indicates a favorable prognosis (Bindea et al., 2013; Gentles et al., 2015; Fridman et al., 2017). M2 macrophages have been proven to be related to tumor growth, the development of an invasive phenotype, and are associated with a poor prognosis in breast, gastric, bladder, ovarian, and prostate cancers (Ruffell and Coussens, 2015). Conversely, M1 macrophages could signal a favorable prognosis in non-small-cell lung cancer, hepatocellular carcinoma, and ovarian and gastric cancers (Ruffell and Coussens, 2015). Our research results do not fully support these conclusions. Yin et al. found that high infiltrating levels of CD4+ T cells, B cells, CD8+ T cells, neutrophils, macrophages, and dendritic cells were all negatively correlated with the OS of lower-grade gliomas (Yin et al., 2020), which supports our study results. Considering that we did not use multiple algorithms to compare the immune cell infiltration landscape of glioma, we will further explore the relationship between the FRGPI and immune infiltration in future studies. Most importantly, the FRGPI could be of great significance for future researchers to develop an algorithm that specifically predicts the immune infiltration of glioma cells.
In addition, 184 upregulated and 79 downregulated genes were identified between the high and low FRGPI groups to explore the mechanism of action and potential small molecule compounds related to FRGPI. Functional enrichment analysis revealed that the FRGPI was significantly associated with immune-related pathways, including responses to cytokines, cytokine-mediated signaling pathways, cytokine signaling in the immune system, innate immune system, and phagosomes, which further indicated that tumor cell ferroptosis had a potential regulatory effect on tumor immunity. Finally, 15 potential small molecule compounds, such as depactin, physostigmine, and phenacetin, were predicted based on the FRGPI, which provided a reference for us to search for effective drugs to treat glioma.
Potential limitations of the present study are as follows. Firstly, a major limitation is that we use a public database rather than our own samples, so we will focus on collecting our own glioma samples to further verify the reliability of the research results. Secondly, the number of immunotherapy cohorts is limited, and it is extremely important to collect more ICI cohorts, especially for glioma, in the future. Finally, we did not explore the specific action mechanism of the FRGPI members, which will be an important direction of our future research.
In conclusion, the FRGPI is a promising ferroptosis-related prognostic biomarker. It may help in distinguishing immune and molecular characteristics and accurately predicting the clinical outcome, possible temozolomide resistance, and ICI response in glioma. Hence, it is essential to systematically evaluate the FRGPI for each patient with glioma, which might assist oncologists to make decisions to administer ferroptosis-based anticancer therapy.
The datasets presented in this study can be found in online repositories. The names of the repository/repositories and accession number(s) can be found in the article/Supplementary Material.
Studies involving human participants were reviewed and approved by Ethics Committees of Nanfang Hospital. The patients/participants provided written informed consent to participate in the study.
Research design: XZ, YS, JX. Data analysis: YC, XL, ZZ, YZ, JL, AX. Experiments: YC, XL, WX. Manuscript writing: YC, XL. Manuscript revision: XZ, YS, YC, YZ, XL, JL, WX, PC, YM, SX, ZS, LH. All authors have read and approved the final manuscript.
Science and Technology Program of Guangzhou, China (NO. 201903010048); National Nature Science Fund of China (No. 81872064); the Natural Science Fund of Guangdong Province, China (No. 2020A1515010122 and 2021A1515012465); Natural Science Fund of Heilongjiang, China (Grant NO. LH2019H124). The funders had no role in study design, data collection, data analysis, decision to publish, or preparation of the manuscript.
The authors declare that the research was conducted in the absence of any commercial or financial relationships that could be construed as a potential conflict of interest.
All claims expressed in this article are solely those of the authors and do not necessarily represent those of their affiliated organizations, or those of the publisher, the editors and the reviewers. Any product that may be evaluated in this article, or claim that may be made by its manufacturer, is not guaranteed or endorsed by the publisher.
We acknowledge TCGA database and CGGA database for providing their platform and contributors for uploading their meaningful datasets. We would like to thank Editage (www.editage.cn) for English language editing of this manuscript.
The Supplementary Material for this article can be found online at: https://www.frontiersin.org/articles/10.3389/fcell.2021.812422/full#supplementary-material
Supplementary Figure 1 | Aberrant expression of GPX4, GCH1, FSP1 and DHODH in glioma. (A,B) Boxplots of GPX4, FSP1, GCH1 and DHODH expression in different grade glioma samples in CGGA cohort. ns, no significance; *p < 0.05; **p < 0.01; ***p < 0.001. (C–F) Immunohistochemistry (IHC) staining for GPX4, FSP1, GCH1 and DHODH, respectively, in glioma and non-tumor brain tissue.
Supplementary Figure 2 | Consensus clustering based on based on the expression of 94 ferroptosis suppressors. (A) CGGA validation set were divided into two different ferroptosis-related subgroups (G1 and G2) by consensus clustering based on based on 94 ferroptosis suppressors. (B) Kaplan–Meier analysis of patients in the two different ferroptosis-related subgroups. (C) Boxplots of the immuneScore and stromalScore between the two ferroptosis-related subtypes. *p < 0.05, **p < 0.01, ***p < 0.001. (D) Immune cell score heat map, where different colors represent the expression trend in each sample between two ferroptosis-related subgroups. *p < 0.05, **p < 0.01, ***p < 0.001. (E) The percentage abundance of tumor infiltrating immune cells in each sample, with different colors and different types of immune cells. The abscissa represents the sample, and the ordinate represents the percentage of immune cell content in a single sample.
Supplementary Figure 3 | Screening and verification of the hub gene used to construct FRGPI. (A) Differential gene expression heatmap, where different colors represent expression trends in different tissues. Due to the large number of differential genes, the 50 up-regulated genes and 50 down-regulated genes with the largest differential changes are shown here. Red, up-regulated; blue, down-regulated. (B) Correlation of weighted gene correlation network analysis (WGCNA) divided all protein-coding genes into 10 modules. (C) The protein-protein interaction network of the 7 hub genes related both ferroptosis and tumor immunity. (D) Principal component analysis (PCA) plot of glioma samples based on HMOX1, TFRC, JUN and SOCS1 expression profiles in CGGA validation set. (E,F) GSVA analysis results of the relationship between FRGPI and PI3K_AKT_MTOR_SIGNALING (Spearman r = 0.660, p < 0.001) and MTORC1_SIGNALING (Spearman r = 0.810, p < 0.001).
Supplementary Figure 4 | The validation of the prognosis predicting value of FRGPI in CGGA validation set. (A) FRGPI, survival status and HMOX1, TFRC, JUN and SOCS1 expression profiles of each sample are shown. (B) Kaplan–Meier analysis of glioma patients with low or high FRGPI. (C) ROC curves validate the prognostic value of FRGPI in glioma patients (1 year AUC: 0.86, 3 years AUC: 0.88, 5 years AUC: 0.84).
Supplementary Figure 5 | The prediction accuracy of FRGPI in different clinical character groups. (A–H) The prediction accuracy of FRGPI in <45- and >45- year old group, LGG and GBM group, IDH1-WT and IDH1-Mut group, 1p19q codel and 1p19q non-codel group in TCGA training set. (I–P) The prediction accuracy of FRGPI in <45- and >45- years group, LGG and GBM group, IDH1-WT and IDH1-Mut group, 1p19q codel and 1p19q non-codel group in in CGGA validation set.
Supplementary Table 1 | The baseline clinical characteristics of glioma patients.
Supplementary Table 2 | 24 ferroptosis-related genes for consensus clustering.
Supplementary Table 3 | 173 ferroptosis-related genes list.
Supplementary Table 4 | 1793 immune-related genes list.
Supplementary Table 5 | 94 ferroptosis suppressors list.
Supplementary Table 6 | 2183 DEGs list between C1 and C2.
Supplementary Table 7 | 2189 DEGs list between G1 and G2.
Supplementary Table 8 | 2613 genes list in blue module.
Supplementary Table 9 | 263 DEGs between the high and low FRGPI groups.
Supplementary Table 10 | Function enrichment analysis results for 263 DEGs.
Aldape, K., Brindle, K. M., Chesler, L., Chopra, R., Gajjar, A., Gilbert, M. R., et al. (2019). Challenges to Curing Primary Brain Tumours. Nat. Rev. Clin. Oncol. 16, 509–520. doi:10.1038/s41571-019-0177-5
Angeli, J. P. F., Krysko, D. V., and Conrad, M. (2019). Ferroptosis at the Crossroads of Cancer-Acquired Drug Resistance and Immune Evasion. Nat. Rev. Cancer 19, 405–414. doi:10.1038/s41568-019-0149-1
Arnold, J. N., Magiera, L., Kraman, M., and Fearon, D. T. (2014). Tumoral Immune Suppression by Macrophages Expressing Fibroblast Activation Protein-α and Heme Oxygenase-1. Cancer Immunol. Res. 2, 121–126. doi:10.1158/2326-6066.cir-13-0150
Bellmunt, J., De Wit, R., Vaughn, D. J., Fradet, Y., Lee, J.-L., Fong, L., et al. (2017). Pembrolizumab as Second-Line Therapy for Advanced Urothelial Carcinoma. N. Engl. J. Med. 376, 1015–1026. doi:10.1056/nejmoa1613683
Bersuker, K., Hendricks, J. M., Li, Z., Magtanong, L., Ford, B., Tang, P. H., et al. (2019). The CoQ Oxidoreductase FSP1 Acts Parallel to GPX4 to Inhibit Ferroptosis. Nature 575, 688–692. doi:10.1038/s41586-019-1705-2
Bhattacharya, S., Dunn, P., Thomas, C. G., Smith, B., Schaefer, H., Chen, J., et al. (2018). ImmPort, toward Repurposing of Open Access Immunological Assay Data for Translational and Clinical Research. Sci. Data 5, 180015. doi:10.1038/sdata.2018.15
Bindea, G., Mlecnik, B., Tosolini, M., Kirilovsky, A., Waldner, M., Obenauf, A. C., et al. (2013). Spatiotemporal Dynamics of Intratumoral Immune Cells Reveal the Immune Landscape in Human Cancer. Immunity 39, 782–795. doi:10.1016/j.immuni.2013.10.003
Bonneville, R., Krook, M. A., Kautto, E. A., Miya, J., Wing, M. R., Chen, H. Z., et al. (2017). Landscape of Microsatellite Instability across 39 Cancer Types. JCO Precis Oncol. 1, 1–15. doi:10.1200/po.17.00073
Brahmer, J., Reckamp, K. L., Baas, P., Crinò, L., Eberhardt, W. E. E., Poddubskaya, E., et al. (2015). Nivolumab versus Docetaxel in Advanced Squamous-Cell Non-small-cell Lung Cancer. N. Engl. J. Med. 373, 123–135. doi:10.1056/nejmoa1504627
Cao, J., and Yan, Q. (2020). Cancer Epigenetics, Tumor Immunity, and Immunotherapy. Trends Cancer 6, 580–592. doi:10.1016/j.trecan.2020.02.003
Chalmers, Z. R., Connelly, C. F., Fabrizio, D., Gay, L., Ali, S. M., Ennis, R., et al. (2017). Analysis of 100,000 Human Cancer Genomes Reveals the Landscape of Tumor Mutational burden. Genome Med. 9, 34. doi:10.1186/s13073-017-0424-2
Chang, L.-C., Chiang, S.-K., Chen, S.-E., Yu, Y.-L., Chou, R.-H., and Chang, W.-C. (2018). Heme Oxygenase-1 Mediates BAY 11-7085 Induced Ferroptosis. Cancer Lett. 416, 124–137. doi:10.1016/j.canlet.2017.12.025
Chen, X., Kang, R., Kroemer, G., and Tang, D. (2021). Broadening Horizons: the Role of Ferroptosis in Cancer. Nat. Rev. Clin. Oncol. 18, 280–296. doi:10.1038/s41571-020-00462-0
Chen, Y., Zhu, G., Liu, Y., Wu, Q., Zhang, X., Bian, Z., et al. (2019). O-GlcNAcylated C-Jun Antagonizes Ferroptosis via Inhibiting GSH Synthesis in Liver Cancer. Cell Signal. 63, 109384. doi:10.1016/j.cellsig.2019.109384
Cooper, J., and Giancotti, F. G. (2019). Integrin Signaling in Cancer: Mechanotransduction, Stemness, Epithelial Plasticity, and Therapeutic Resistance. Cancer Cell 35, 347–367. doi:10.1016/j.ccell.2019.01.007
Crepin, R., Goenaga, A.-L., Jullienne, B., Bougherara, H., Legay, C., Benihoud, K., et al. (2010). Development of Human Single-Chain Antibodies to the Transferrin Receptor that Effectively Antagonize the Growth of Leukemias and Lymphomas. Cancer Res. 70, 5497–5506. doi:10.1158/0008-5472.can-10-0938
Doll, S., Freitas, F. P., Shah, R., Aldrovandi, M., Da Silva, M. C., Ingold, I., et al. (2019). FSP1 Is a Glutathione-independent Ferroptosis Suppressor. Nature 575, 693–698. doi:10.1038/s41586-019-1707-0
Donson, A. M., Addo-Yobo, S. O., Handler, M. H., Gore, L., and Foreman, N. K. (2007). MGMT Promoter Methylation Correlates with Survival Benefit and Sensitivity to Temozolomide in Pediatric Glioblastoma. Pediatr. Blood Cancer 48, 403–407. doi:10.1002/pbc.20803
Fehrenbacher, L., Spira, A., Ballinger, M., Kowanetz, M., Vansteenkiste, J., Mazieres, J., et al. (2016). Atezolizumab versus Docetaxel for Patients with Previously Treated Non-small-cell Lung Cancer (POPLAR): a Multicentre, Open-Label, Phase 2 Randomised Controlled Trial. The Lancet 387, 1837–1846. doi:10.1016/s0140-6736(16)00587-0
Fest, S., Soldati, R., Christiansen, N. M., Zenclussen, M. L., Kilz, J., Berger, E., et al. (2016). Targeting of Heme Oxygenase-1 as a Novel Immune Regulator of Neuroblastoma. Int. J. Cancer 138, 2030–2042. doi:10.1002/ijc.29933
Fridman, W. H., Zitvogel, L., Sautès–Fridman, C., and Kroemer, G. (2017). The Immune Contexture in Cancer Prognosis and Treatment. Nat. Rev. Clin. Oncol. 14, 717–734. doi:10.1038/nrclinonc.2017.101
Friedman, H. S., Kerby, T., and Calvert, H. (2000). Temozolomide and Treatment of Malignant Glioma. Clin. Cancer Res. 6, 2585–2597.
Gentles, A. J., Newman, A. M., Liu, C. L., Bratman, S. V., Feng, W., Kim, D., et al. (2015). The Prognostic Landscape of Genes and Infiltrating Immune Cells across Human Cancers. Nat. Med. 21, 938–945. doi:10.1038/nm.3909
Ghosh, M. K., Chakraborty, D., Sarkar, S., Bhowmik, A., and Basu, M. (2019). The Interrelationship between Cerebral Ischemic Stroke and Glioma: a Comprehensive Study of Recent Reports. Sig Transduct Target. Ther. 4, 42. doi:10.1038/s41392-019-0075-4
Gong, Y., Fan, Z., Luo, G., Yang, C., Huang, Q., Fan, K., et al. (2019). The Role of Necroptosis in Cancer Biology and Therapy. Mol. Cancer 18, 100. doi:10.1186/s12943-019-1029-8
Hansen, A. R., and Siu, L. L. (2016). PD-L1 Testing in Cancer: Challenges in Companion Diagnostic Development. JAMA Oncol. 2, 15–16. doi:10.1001/jamaoncol.2015.4685
Hegde, P. S., and Chen, D. S. (2020). Top 10 Challenges in Cancer Immunotherapy. Immunity 52, 17–35. doi:10.1016/j.immuni.2019.12.011
Hegi, M. E., Diserens, A.-C., Gorlia, T., Hamou, M.-F., De Tribolet, N., Weller, M., et al. (2005). MGMTGene Silencing and Benefit from Temozolomide in Glioblastoma. N. Engl. J. Med. 352, 997–1003. doi:10.1056/nejmoa043331
Hu, Z., Mi, Y., Qian, H., Guo, N., Yan, A., Zhang, Y., et al. (2020). A Potential Mechanism of Temozolomide Resistance in Glioma-Ferroptosis. Front. Oncol. 10, 897. doi:10.3389/fonc.2020.00897
Jackson, C. M., Choi, J., and Lim, M. (2019). Mechanisms of Immunotherapy Resistance: Lessons from Glioblastoma. Nat. Immunol. 20, 1100–1109. doi:10.1038/s41590-019-0433-y
Jiang, P., Gu, S., Pan, D., Fu, J., Sahu, A., Hu, X., et al. (2018). Signatures of T Cell Dysfunction and Exclusion Predict Cancer Immunotherapy Response. Nat. Med. 24, 1550–1558. doi:10.1038/s41591-018-0136-1
Jiang, X., Stockwell, B. R., and Conrad, M. (2021). Ferroptosis: Mechanisms, Biology and Role in Disease. Nat. Rev. Mol. Cell Biol 22, 266–282. doi:10.1038/s41580-020-00324-8
Jiang, X., Zhou, J., Giobbie-Hurder, A., Wargo, J., and Hodi, F. S. (2013). The Activation of MAPK in Melanoma Cells Resistant to BRAF Inhibition Promotes PD-L1 Expression that Is Reversible by MEK and PI3K Inhibition. Clin. Cancer Res. 19, 598–609. doi:10.1158/1078-0432.ccr-12-2731
Karachi, A., Dastmalchi, F., Mitchell, D. A., and Rahman, M. (2018). Temozolomide for Immunomodulation in the Treatment of Glioblastoma. Neuro Oncol. 20, 1566–1572. doi:10.1093/neuonc/noy072
Khasraw, M., Reardon, D. A., Weller, M., and Sampson, J. H. (2020). PD-1 Inhibitors: Do They Have a Future in the Treatment of Glioblastoma? Clin. Cancer Res. 26, 5287–5296. doi:10.1158/1078-0432.ccr-20-1135
Kraft, V. A. N., Bezjian, C. T., Pfeiffer, S., Ringelstetter, L., Müller, C., Zandkarimi, F., et al. (2020). GTP Cyclohydrolase 1/Tetrahydrobiopterin Counteract Ferroptosis through Lipid Remodeling. ACS Cent. Sci. 6, 41–53. doi:10.1021/acscentsci.9b01063
Lamb, J., Crawford, E. D., Peck, D., Modell, J. W., Blat, I. C., Wrobel, M. J., et al. (2006). The Connectivity Map: Using Gene-Expression Signatures to Connect Small Molecules, Genes, and Disease. Science 313, 1929–1935. doi:10.1126/science.1132939
Langfelder, P., and Horvath, S. (2008). WGCNA: an R Package for Weighted Correlation Network Analysis. BMC Bioinformatics 9, 559. doi:10.1186/1471-2105-9-559
Larkin, J., Chiarion-Sileni, V., Gonzalez, R., Grob, J. J., Cowey, C. L., Lao, C. D., et al. (2015). Combined Nivolumab and Ipilimumab or Monotherapy in Untreated Melanoma. N. Engl. J. Med. 373, 23–34. doi:10.1056/nejmoa1504030
Liang, C., Zhang, X., Yang, M., and Dong, X. (2019). Recent Progress in Ferroptosis Inducers for Cancer Therapy. Adv. Mater. 31, e1904197. doi:10.1002/adma.201904197
Lim, M., Xia, Y., Bettegowda, C., and Weller, M. (2018). Current State of Immunotherapy for Glioblastoma. Nat. Rev. Clin. Oncol. 15, 422–442. doi:10.1038/s41571-018-0003-5
Liu, Z., Zhao, Q., Zuo, Z.-X., Yuan, S.-Q., Yu, K., Zhang, Q., et al. (2020). Systematic Analysis of the Aberrances and Functional Implications of Ferroptosis in Cancer. iScience 23, 101302. doi:10.1016/j.isci.2020.101302
Llabani, E., Hicklin, R. W., Lee, H. Y., Motika, S. E., Crawford, L. A., Weerapana, E., et al. (2019). Diverse Compounds from Pleuromutilin lead to a Thioredoxin Inhibitor and Inducer of Ferroptosis. Nat. Chem. 11, 521–532. doi:10.1038/s41557-019-0261-6
Louis, D. N., Perry, A., Reifenberger, G., Von Deimling, A., Figarella-Branger, D., Cavenee, W. K., et al. (2016). The 2016 World Health Organization Classification of Tumors of the Central Nervous System: a Summary. Acta Neuropathol. 131, 803–820. doi:10.1007/s00401-016-1545-1
Lu, B., Chen, X.-b., Hong, Y.-c., Zhu, H., He, Q.-j., Yang, B., et al. (2019). Identification of PRDX6 as a Regulator of Ferroptosis. Acta Pharmacol. Sin 40, 1334–1342. doi:10.1038/s41401-019-0233-9
Maire, C. L., Mohme, M., Bockmayr, M., Fita, K. D., Riecken, K., Börnigen, D., et al. (2020). Glioma Escape Signature and Clonal Development under Immune Pressure. J. Clin. Invest. 130, 5257–5271. doi:10.1172/jci138760
Malta, T. M., Sokolov, A., Gentles, A. J., Burzykowski, T., Poisson, L., Weinstein, J. N., et al. (2018). Machine Learning Identifies Stemness Features Associated with Oncogenic Dedifferentiation. Cell 173, 338–354.e15. doi:10.1016/j.cell.2018.03.034
Mao, C., Liu, X., Zhang, Y., Lei, G., Yan, Y., Lee, H., et al. (2021). DHODH-mediated Ferroptosis Defence Is a Targetable Vulnerability in Cancer. Nature 593, 586–590. doi:10.1038/s41586-021-03539-7
Mariathasan, S., Turley, S. J., Nickles, D., Castiglioni, A., Yuen, K., Wang, Y., et al. (2018). TGFβ Attenuates Tumour Response to PD-L1 Blockade by Contributing to Exclusion of T Cells. Nature 554, 544–548. doi:10.1038/nature25501
Mayakonda, A., Lin, D.-C., Assenov, Y., Plass, C., and Koeffler, H. P. (2018). Maftools: Efficient and Comprehensive Analysis of Somatic Variants in Cancer. Genome Res. 28, 1747–1756. doi:10.1101/gr.239244.118
McGranahan, T., Therkelsen, K. E., Ahmad, S., and Nagpal, S. (2019). Current State of Immunotherapy for Treatment of Glioblastoma. Curr. Treat. Options. Oncol. 20, 24. doi:10.1007/s11864-019-0619-4
Motzer, R. J., Escudier, B., Mcdermott, D. F., George, S., Hammers, H. J., Srinivas, S., et al. (2015). Nivolumab versus Everolimus in Advanced Renal-Cell Carcinoma. N. Engl. J. Med. 373, 1803–1813. doi:10.1056/nejmoa1510665
Nagashima, H., Tanaka, K., Sasayama, T., Irino, Y., Sato, N., Takeuchi, Y., et al. (2016). Diagnostic Value of Glutamate with 2-hydroxyglutarate in Magnetic Resonance Spectroscopy for IDH1 Mutant Glioma. Neuro Oncol. 18, 1559–1568. doi:10.1093/neuonc/now090
Noguchi, T., Ward, J. P., Gubin, M. M., Arthur, C. D., Lee, S. H., Hundal, J., et al. (2017). Temporally Distinct PD-L1 Expression by Tumor and Host Cells Contributes to Immune Escape. Cancer Immunol. Res. 5, 106–117. doi:10.1158/2326-6066.cir-16-0391
Reardon, D. A., Brandes, A. A., Omuro, A., Mulholland, P., Lim, M., Wick, A., et al. (2020). Effect of Nivolumab vs Bevacizumab in Patients with Recurrent Glioblastoma: The CheckMate 143 Phase 3 Randomized Clinical Trial. JAMA Oncol. 6, 1003–1010. doi:10.1001/jamaoncol.2020.1024
Rosenberg, J. E., Hoffman-Censits, J., Powles, T., Van Der Heijden, M. S., Balar, A. V., Necchi, A., et al. (2016). Atezolizumab in Patients with Locally Advanced and Metastatic Urothelial Carcinoma Who Have Progressed Following Treatment with Platinum-Based Chemotherapy: a Single-Arm, Multicentre, Phase 2 Trial. The Lancet 387, 1909–1920. doi:10.1016/s0140-6736(16)00561-4
Ruffell, B., and Coussens, L. M. (2015). Macrophages and Therapeutic Resistance in Cancer. Cancer Cell 27, 462–472. doi:10.1016/j.ccell.2015.02.015
Saint-Germain, E., Mignacca, L., Vernier, M., Bobbala, D., Ilangumaran, S., and Ferbeyre, G. (2017). SOCS1 Regulates Senescence and Ferroptosis by Modulating the Expression of P53 Target Genes. Aging 9, 2137–2162. doi:10.18632/aging.101306
Saudemont, A., Hamrouni, A., Marchetti, P., Liu, J., Jouy, N., Hetuin, D., et al. (2007). Dormant Tumor Cells Develop Cross-Resistance to Apoptosis Induced by CTLs or Imatinib Mesylate via Methylation of Suppressor of Cytokine Signaling 1. Cancer Res. 67, 4491–4498. doi:10.1158/0008-5472.can-06-1627
Saygin, C., Matei, D., Majeti, R., Reizes, O., and Lathia, J. D. (2019). Targeting Cancer Stemness in the Clinic: From Hype to Hope. Cell Stem Cell 24, 25–40. doi:10.1016/j.stem.2018.11.017
Seibt, T. M., Proneth, B., and Conrad, M. (2019). Role of GPX4 in Ferroptosis and its Pharmacological Implication. Free Radic. Biol. Med. 133, 144–152. doi:10.1016/j.freeradbiomed.2018.09.014
Sharma, P., Retz, M., Siefker-Radtke, A., Baron, A., Necchi, A., Bedke, J., et al. (2017). Nivolumab in Metastatic Urothelial Carcinoma after Platinum Therapy (CheckMate 275): a Multicentre, Single-Arm, Phase 2 Trial. Lancet Oncol. 18, 312–322. doi:10.1016/s1470-2045(17)30065-7
Shibue, T., and Weinberg, R. A. (2017). EMT, CSCs, and Drug Resistance: the Mechanistic Link and Clinical Implications. Nat. Rev. Clin. Oncol. 14, 611–629. doi:10.1038/nrclinonc.2017.44
Siegal, T. (2015). Clinical Impact of Molecular Biomarkers in Gliomas. J. Clin. Neurosci. 22, 437–444. doi:10.1016/j.jocn.2014.10.004
Soula, M., Weber, R. A., Zilka, O., Alwaseem, H., La, K., Yen, F., et al. (2020). Metabolic Determinants of Cancer Cell Sensitivity to Canonical Ferroptosis Inducers. Nat. Chem. Biol. 16, 1351–1360. doi:10.1038/s41589-020-0613-y
Stockwell, B. R., and Jiang, X. (2019). A Physiological Function for Ferroptosis in Tumor Suppression by the Immune System. Cell Metab. 30, 14–15. doi:10.1016/j.cmet.2019.06.012
Sturm, G., Finotello, F., Petitprez, F., Zhang, J. D., Baumbach, J., Fridman, W. H., et al. (2019). Comprehensive Evaluation of Transcriptome-Based Cell-type Quantification Methods for Immuno-Oncology. Bioinformatics 35, i436–i445. doi:10.1093/bioinformatics/btz363
Su, S., Chen, J., Yao, H., Liu, J., Yu, S., Lao, L., et al. (2018). CD10+GPR77+ Cancer-Associated Fibroblasts Promote Cancer Formation and Chemoresistance by Sustaining Cancer Stemness. Cell 172, 841–856. doi:10.1016/j.cell.2018.01.009
Tan, A. C., Ashley, D. M., López, G. Y., Malinzak, M., Friedman, H. S., and Khasraw, M. (2020). Management of Glioblastoma: State of the Art and Future Directions. CA A. Cancer J. Clin. 70, 299–312. doi:10.3322/caac.21613
Tang, D., Chen, X., Kang, R., and Kroemer, G. (2021). Ferroptosis: Molecular Mechanisms and Health Implications. Cell Res 31, 107–125. doi:10.1038/s41422-020-00441-1
Tang, R., Xu, J., Zhang, B., Liu, J., Liang, C., Hua, J., et al. (2020). Ferroptosis, Necroptosis, and Pyroptosis in Anticancer Immunity. J. Hematol. Oncol. 13, 110. doi:10.1186/s13045-020-00946-7
Tran, A. N., Walker, K., Harrison, D. G., Chen, W., Mobley, J., Hocevar, L., et al. (2018). Reactive Species Balance via GTP Cyclohydrolase I Regulates Glioblastoma Growth and Tumor Initiating Cell Maintenance. Neuro Oncol. 20, 1055–1067. doi:10.1093/neuonc/noy012
van Nifterik, K. A., Van Den Berg, J., Van Der Meide, W. F., Ameziane, N., Wedekind, L. E., Steenbergen, R. D. M., et al. (2010). Absence of the MGMT Protein as Well as Methylation of the MGMT Promoter Predict the Sensitivity for Temozolomide. Br. J. Cancer 103, 29–35. doi:10.1038/sj.bjc.6605712
Wang, W., Green, M., Choi, J. E., Gijón, M., Kennedy, P. D., Johnson, J. K., et al. (2019). CD8+ T Cells Regulate Tumour Ferroptosis during Cancer Immunotherapy. Nature 569, 270–274. doi:10.1038/s41586-019-1170-y
Weber, J., Mandala, M., Del Vecchio, M., Gogas, H. J., Arance, A. M., Cowey, C. L., et al. (2017). Adjuvant Nivolumab versus Ipilimumab in Resected Stage III or IV Melanoma. N. Engl. J. Med. 377, 1824–1835. doi:10.1056/nejmoa1709030
Weissmann, S., Cloos, P. A., Sidoli, S., Jensen, O. N., Pollard, S., and Helin, K. (2018). The Tumor Suppressor CIC Directly Regulates MAPK Pathway Genes via Histone Deacetylation. Cancer Res. 78, 4114–4125. doi:10.1158/0008-5472.can-18-0342
Weller, M., Van Den Bent, M., Preusser, M., Le Rhun, E., Tonn, J. C., Minniti, G., et al. (2021). EANO Guidelines on the Diagnosis and Treatment of Diffuse Gliomas of Adulthood. Nat. Rev. Clin. Oncol. 18, 170–186. doi:10.1038/s41571-020-00447-z
Wen, Q., Liu, J., Kang, R., Zhou, B., and Tang, D. (2019). The Release and Activity of HMGB1 in Ferroptosis. Biochem. Biophysical Res. Commun. 510, 278–283. doi:10.1016/j.bbrc.2019.01.090
Wu, J., Minikes, A. M., Gao, M., Bian, H., Li, Y., Stockwell, B. R., et al. (2019). Intercellular Interaction Dictates Cancer Cell Ferroptosis via NF2-YAP Signalling. Nature 572, 402–406. doi:10.1038/s41586-019-1426-6
Yan, H., Parsons, D. W., Jin, G., Mclendon, R., Rasheed, B. A., Yuan, W., et al. (2009). IDH1andIDH2Mutations in Gliomas. N. Engl. J. Med. 360, 765–773. doi:10.1056/nejmoa0808710
Yarchoan, M., Hopkins, A., and Jaffee, E. M. (2017). Tumor Mutational Burden and Response Rate to PD-1 Inhibition. N. Engl. J. Med. 377, 2500–2501. doi:10.1056/nejmc1713444
Yin, W., Jiang, X., Tan, J., Xin, Z., Zhou, Q., Zhan, C., et al. (2020). Development and Validation of a Tumor Mutation Burden-Related Immune Prognostic Model for Lower-Grade Glioma. Front. Oncol. 10, 1409. doi:10.3389/fonc.2020.01409
Yoshihara, K., Shahmoradgoli, M., Martínez, E., Vegesna, R., Kim, H., Torres-Garcia, W., et al. (2013). Inferring Tumour Purity and Stromal and Immune Cell Admixture from Expression Data. Nat. Commun. 4, 2612. doi:10.1038/ncomms3612
Zdanov, S., Mandapathil, M., Abu Eid, R., Adamson-Fadeyi, S., Wilson, W., Qian, J., et al. (2016). Mutant KRAS Conversion of Conventional T Cells into Regulatory T Cells. Cancer Immunol. Res. 4, 354–365. doi:10.1158/2326-6066.cir-15-0241
Zhao, Z., Zhang, K. N., Wang, Q., Li, G., Zeng, F., Zhang, Y., et al. (2021). Chinese Glioma Genome Atlas (CGGA): A Comprehensive Resource with Functional Genomic Data from Chinese Gliomas. Genomics Proteomics Bioinformatics 19, 1–12. doi:10.1016/j.gpb.2020.10.005
Zheng, J., and Conrad, M. (2020). The Metabolic Underpinnings of Ferroptosis. Cell Metab. 32, 920–937. doi:10.1016/j.cmet.2020.10.011
Keywords: ferroptosis, glioma, temozolomide, immune checkpoint inhibitor, tumor microenvironment, ferroptosis-based anticancer therapy, immunotherapy
Citation: Cai Y, Liang X, Zhan Z, Zeng Y, Lin J, Xu A, Xue S, Xu W, Chai P, Mao Y, Song Z, Han L, Xiao J, Song Y and Zhang X (2022) A Ferroptosis-Related Gene Prognostic Index to Predict Temozolomide Sensitivity and Immune Checkpoint Inhibitor Response for Glioma. Front. Cell Dev. Biol. 9:812422. doi: 10.3389/fcell.2021.812422
Received: 10 November 2021; Accepted: 30 December 2021;
Published: 31 January 2022.
Edited by:
Lian Xiang Luo, Guangdong Medical University, ChinaReviewed by:
Wenchao Gu, Gunma University, JapanCopyright © 2022 Cai, Liang, Zhan, Zeng, Lin, Xu, Xue, Xu, Chai, Mao, Song, Han, Xiao, Song and Zhang. This is an open-access article distributed under the terms of the Creative Commons Attribution License (CC BY). The use, distribution or reproduction in other forums is permitted, provided the original author(s) and the copyright owner(s) are credited and that the original publication in this journal is cited, in accordance with accepted academic practice. No use, distribution or reproduction is permitted which does not comply with these terms.
*Correspondence: Xian Zhang, enhhQHNtdS5lZHUuY24=; Ye Song, c29uZ3llQHNtdS5lZHUuY24=; Jianqi Xiao, eGlqaXFpQDEyNi5jb20=
†These authors have contributed equally to this work
Disclaimer: All claims expressed in this article are solely those of the authors and do not necessarily represent those of their affiliated organizations, or those of the publisher, the editors and the reviewers. Any product that may be evaluated in this article or claim that may be made by its manufacturer is not guaranteed or endorsed by the publisher.
Research integrity at Frontiers
Learn more about the work of our research integrity team to safeguard the quality of each article we publish.