
94% of researchers rate our articles as excellent or good
Learn more about the work of our research integrity team to safeguard the quality of each article we publish.
Find out more
ORIGINAL RESEARCH article
Front. Cell Dev. Biol. , 23 December 2021
Sec. Molecular and Cellular Oncology
Volume 9 - 2021 | https://doi.org/10.3389/fcell.2021.794840
 Zhiwen Xie1†
 Lei Wu2†
 Shan Hua1†
 Yongqing Zhang1†
 Fei Shi1Min Chen1,3Sheng Zhao4Zhihong Liu1Meng Liu5*
 Juntao Jiang1,2*
Clear cell renal cell carcinomas (ccRCCs) are highly immune infiltrates, and many of them respond to immunotherapy with checkpoint inhibitors including anti-PD-L1 or anti-PD1 agents. However, the effect of immune genes on clinical outcomes in ccRCCs has not been fully studied. Here, we show in this study that an immune-associated gene panel has a prognostic value for clear cell renal cell carcinomas. We performed single-sample gene set enrichment analysis (ssGSEA) and cell type identification by estimating subsets of RNA transcripts (CIBERSORT) algorithms on patient-matched normal renal and RCC tissues to characterize two immunophenotypes and immunological characteristic subpopulations. Furthermore, LASSO Cox regression was applied to develop a novel prognosis-associated model for ccRCC patients based on an immune-gene panel. The results were verified by the Gene Expression Omnibus (GEO) dataset and coordinated with the clinicopathological characteristics of ccRCCs, along with genomic signatures. Finally, based on the above perspectives, we generated a nomogram with a high prognostic efficiency for ccRCC patients. Overall, this study offers a unique perspective that can contribute to improving the accuracy of prognosis prediction and treatment with immunotherapy.
Renal cell carcinoma (RCC) is a common tumor of the urinary system and accounts for approximately 3% of all adult cancers (Zarrabi et al., 2017), with an annual increase of more than 0.40 million newly diagnosed and 0.18 million deaths (Capitanio et al., 2019). RCC exists twice as often in men as in women, and the highest prevalence of RCC is often observed in patients in their sixties (Mulders et al., 1997). In addition, the incidence of RCC is higher in developed countries than in developing countries. The highest levels were observed in Europe, North America, and Australia, with the lowest levels being found in Africa, India, and China (Hsieh et al., 2017). Most patients are frequently diagnosed with RCC after presenting with typical symptoms, such as hematuria, flank pain, and palpable abdominal mass, thereby missing the optimal treatment time (Chevrier et al., 2017). Based on histological and cytogenetic characteristics, 80% of RCC is subclassified as clear cell renal cell carcinoma (ccRCC), which originates from nephron epithelial cells and has the highest mortality rate of all urinary tumors (McDougal et al., 2015). The prognosis of RCC remains poor. Especially for patients with advanced and metastatic disease, the 5-year survival rate is only 23% after diagnosis (Ljungberg et al., 2015). Presently, surgery is the main treatment for ccRCC, but this is correlated with a high incidence of recurrence and metastasis (Sorokin et al., 2017). Furthermore, ccRCCs are radioresistant (Bielecka et al., 2014), and more than 80% are chemoresistant (Clerici and Boletta, 2020), with agents producing a positive response only in a minority of patients. Since ccRCCs are presumed to be immunogenic (Xu et al., 2020), immunotherapy has been widely employed and shows promising clinical effects in the treatment of renal cancer. However, the rapid development of resistance during applied targeted therapy has become an increasingly challenging issue (Miao et al., 2018; Braun et al., 2020).
Currently, the clinical prognosis of ccRCC is predicted by multiple factors, including clinical, anatomical, molecular, and histological features, such as DNA methylation genes, inflammasome-related signatures, Notch signaling pathways, and RNA-binding proteins (Zhou et al., 2020). However, none of these approaches have yet improved the current prognostic systems. Nishida (Nishida et al., 2020) reported that immune genes were associated with clinical outcomes. Basically, the lack of reliable and stable prognostic markers has been a great obstacle, but immune-associated genes may provide a novel insight into this field (Qi et al., 2020).
In our study, we focused our efforts on illustrating the interaction between immunity and tumors and the predictive value of immune genes for ccRCCs. Consequently, by using machine learning–based approaches, we designed an immune-associated gene panel to predict the prognosis status of ccRCC patients and confirmed its stability and reliability in an independent dataset (Lin et al., 2020). Thus, it is hoped that this study will lead to a better understanding of a more effective diagnostic and therapeutic indicator for ccRCC patients.
We acquired transcriptomic data from public databases with clinicopathological features. TCGA-KIRC (kidney renal clear cell carcinoma) and GSE29609 (http://www.ncbi.nlm.nih.gov/geo/query/acc.cgi?acc=GSE29609) datasets were downloaded in our study (Giraldo et al., 2017). Immune-related genes were obtained from the ImmPort database (https://www.immport), and transcription factor–related genes were downloaded from the CISTROME project (http://www.cistrome.org/) (Meng et al., 2021). In addition, the tumor mutation burden (TMB) was calculated according to the number of gene mutations in each tumor sample (Li et al., 2020).
To calculate the immune score, stromal score, and estimate score, the ESTIMATE (Estimation of STromal and Immune cells in MAlignant Tumor tissues using Expression data) algorithm was applied to the TCGA-KIRC dataset with the “estimate” R package (version 1.0.13) (Yoshihara et al., 2013). The CIBERSORT (cell type identification by estimating relative subsets of RNA transcripts) algorithm was performed to evaluate the relative proportions of 22 tumor-infiltrating cells for each ccRCC patients (Newman et al., 2015).
Depending on 29 immune gene sets (Supplementary Table S3), the ssGSEA algorithm was conducted to systematically assess the immunological features with the “GSVA” (version 1.38.2), “GSEABase” (version 1.52.1), and “limma” (version 3.46.0) R packages. Then, the ssGSEA score xi for each ccRCC patient was transformed into xi’ by the equation xi’= (xi − xmin)/(xmax − xmin). In addition, hierarchical clustering analysis was performed to identify the subtypes of ccRCC patients with Euclidean distance and Ward’s linkage method (Yi et al., 2020). The t-SNE (T-distribution stochastic neighbor embedding) algorithm was employed to demonstrate the accuracy and discrimination of the subtypes of ccRCC patients with the “Rtsne” (version 0.15) package (Kobak and Berens, 2019).
Differentially expressed genes (DEGs) were isolated between the high- and low-immunity groups via the “limma” R package. Statistical differences were defined as |log2 fold change| > 0.58 and FDR <0.05. Then, the differentially expressed immunity genes (DEIGs) were the intersection of genes between DEGs and the immune gene dataset (Ritchie et al., 2015). Moreover, based on DEIGs, we performed univariate survival analysis with the “survival” (version 3.2-13) R package and considered prognostic immunity genes (PIGs) when p < 0.05.
To identify the essential signaling pathways involving DEGs, gene set enrichment analysis (GSEA, version 4.1.0) was applied to the TCGA-KIRC dataset, which demonstrated the Kyoto Encyclopedia of Genes and Genomes (KEGG) pathways that were increased in the high- and low-immunity groups, respectively. Statistical significance was defined as FDR <0.01. In addition, we obtained differentially expressed transcription factors (DETFs) by extracting the intersection of genes between DEGs and the TF dataset (Wu and Zhang, 2018).Then, correlation analysis was performed to establish the regulatory network of DETFs and PIGs by using the Pearson’s correlation coefficient. Moreover, based on the STRING (string-db.org/) database, we conducted protein–protein interaction (PPI) analysis (Wang et al., 2020).
Based on PIGs, we performed LASSO-Cox regression analysis to develop an immune gene–associated prognostic model (IGPM) for ccRCC patients (McEligot et al., 2020). The risk score of each patient was calculated according to the following formula: risk score = sum (the expression level of each gene × corresponding coefficient). According to the median risk score, we divided ccRCC patients into high- and low-risk groups. Then, Kaplan–Meier analysis and log rank tests were used to demonstrate the survival difference between the high‐ and low‐risk groups. To test the predictive capacity of the IGPM‐based risk model, the area under the time-dependent receiver operating curve (ROC) was calculated to predict the 1-year, 3-year, and 5-year survival rates of ccRCC patients. We conducted Kaplan–Meier log-rank tests and ROC analysis to demonstrate the survival difference and accuracy of the risk signature via the “timeROC” (version 0.4), “rms” (version 6.2-0), “survival” (version 3.2-13), and “survminer” (version 0.4.9) R packages. We used Pearson’s correlation or the Spearman correlation to confirm the association between the IGPM‐based risk model and clinicopathological features, TMB, immune checkpoint molecules, and immune cell infiltration via the “corrplot” (version 0.84) R package (Pesenti et al., 2019). We considered there to be a significant correlation when p < 0.05. Finally, based on the risk signature and clinicopathological features, we performed univariate and multivariate Cox regression analyses to demonstrate the independence of the risk signature. We then utilized the above characteristics to construct a nomogram and conducted ROC and calibration curve analysis (Iasonos et al., 2008) to confirm the possibility of its clinical application for the nomogram.
Total RNA were extracted from the ccRCC cell-Line 769-P and normal cell line HK-2 using TRIzol reagent (Novabio, China). Cell lines were obtained from the Chinese Academy of Sciences Committee on Type Culture Collection Cell Bank (Shanghai, China). RNA (1 mg) was reverse-transcribed to complementary DNA (cDNA) by using a PrimeScript RT kit (Novabio, China). According to the manufacturer’s manual, real-time quantitative polymerase chain reaction (RT-qPCR) was performed with gene-specific primers to determine the relative expression of genes of interest using SYBR green and was analyzed by using an ABI 7500 Real-Time PCR system (Applied Biosystems). All experiments were performed to obtain three independent measures.
Together with 29 immune gene sets, 539 tumor patient samples from the TCGA-KIRC cohort were comprehensively assessed by the ssGSEA algorithm to evaluate the immunological features (Xu et al., 2019a). Two immune subtypes, Immunity_High (Immunity_H) and Immunity_Low (Immunity_L), were divided in consonance with the ssGSEA scores and hierarchical clustering analysis (Figures 1A,B). The results of the tSNE algorithm confirmed the above classification (Figure 1C).
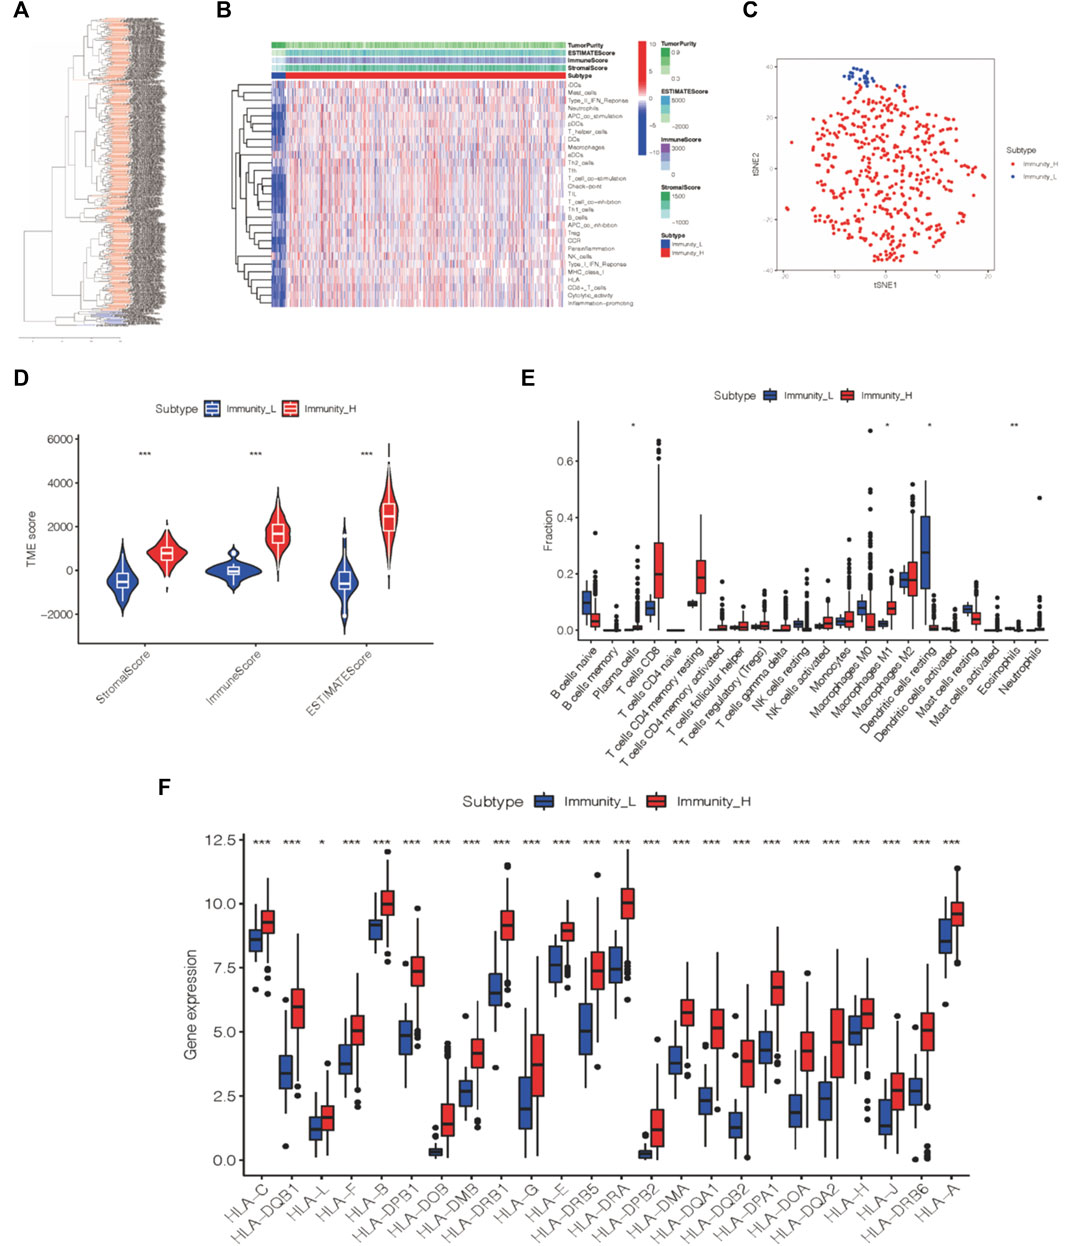
FIGURE 1. Two immune subtypes of ccRCC were established via hierarchical clustering. (A) ssGSEA results were used to generated two distinct groups via hierarchical clustering. (B) Tumor microenvironment characteristics were generated in the TCGA-KIRC cohort. (C) Immunophenotype validation via tSNE. (D) Three different immune scores of each group. (E) Immune cell infiltration degree of two immunogenic subtypes. (F) HLA-associated gene level of each of the two groups. *p < 0.05, **p < 0.01, ***p < 0.001.
The ESTIMATE algorithm was applied to analyze the tumor microenvironment characteristics of these two subtypes. We found that the Immunity_H group exhibited more scores for the stromal score, immune score, and estimate score (Wilcox test, p < 0.001) than the Immunity_L group (Figure 1D).
Likewise, the infiltration levels of plasma cells, M1 macrophages, dendritic cells, and eosinophils in the Immunity_H group also varied from those in the Immunity_L group according to the outcome of the CIBERSORT algorithm (Figure 1E). Furthermore, we analyzed the expression of HLA-related genes in each group, and the Immunity_H group expressed more HLA-related genes than the other group (Figure 1F). Thus, the two distinct immune groups of ccRCC patients displayed various features.
Based on the abovementioned immunophenotypes, we further explored the molecular features of cross-talk between tumors and immunity and their prognostic value in ccRCC patients.
We observed 4445 DEGs in the volcano map (Figure 2A). Among these DEGs, 2873 DEGs were upregulated, and 1572 DEGs were downregulated. In addition, the expression levels of these DEGs in ccRCC patients are shown in Figure 2B. Furthermore, based on the immune gene set, 581 genes were identified as DEIGs (Figure 2C). Finally, 18 PIGs were screened using a univariate Cox proportional-hazards model (Figure 2D). Of these genes in the Immunity_H subtype, 12 genes (CALCRL, NPR3, TEK, CX3CL1, AR, PDGFD, SLC40A1, PIK3R3, NR3C2, EDNRB, F2RL1, and KDR) were downregulated and six genes (PLTP, BMP1, RNASE2, SLC11A1, SAA1, and TNFSF14) were upregulated.
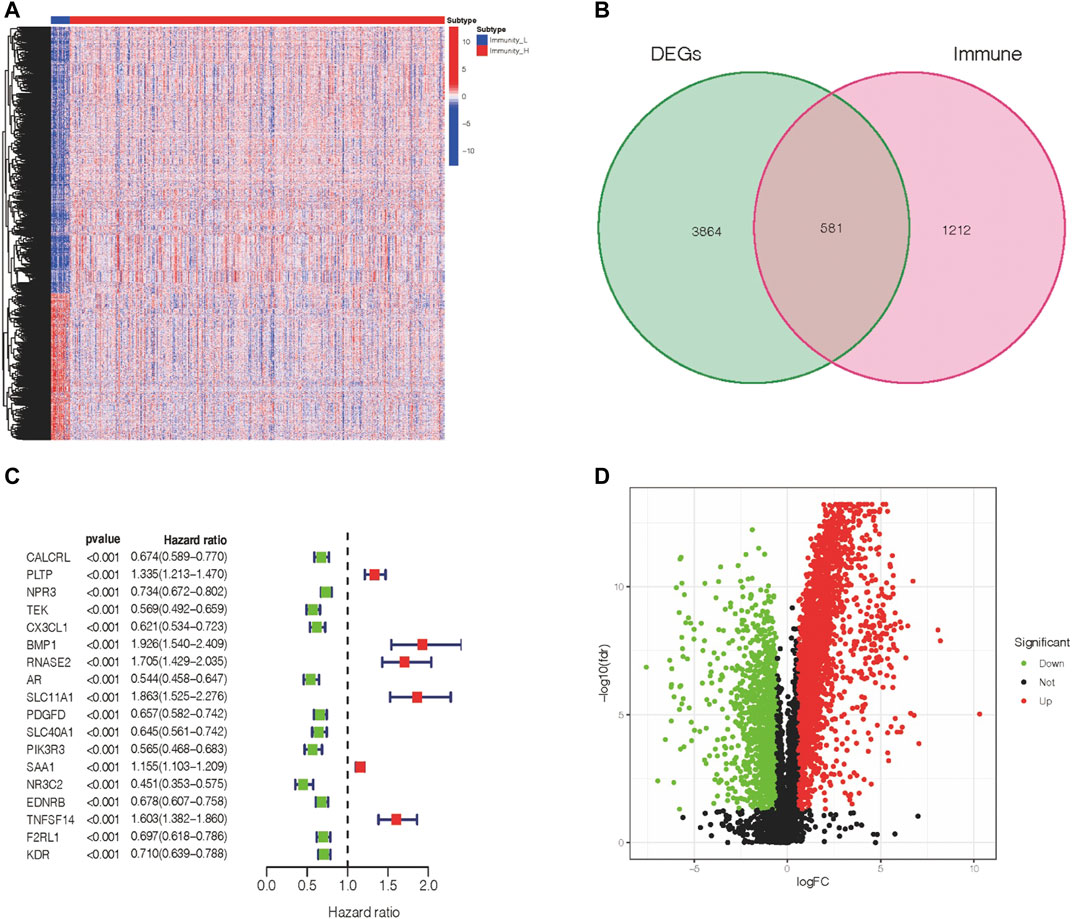
FIGURE 2. Expression of DEGs and association with the clinical outcome. (A) Differentially expressed genes within two immune groups. (B) Isolation of differentially expressed immune genes. (C) PIGs and their hazard ratios were displayed in the forest plot via univariable Cox proportional hazards analysis. (D) Fold change and the FDR value were displayed in the volcano plot.
To obtain a comprehensive evaluation of the role that immune genes play in the biological processes of ccRCC patients, we conducted GSEA to characterize the pathways in which these DEGs were engaged (Figure 3A). According to KEGG pathway analysis, melanoma, basal cell carcinoma, colorectal cancer, and cancer-related pathways were especially enriched in the Immunity_H group, while no significant pathways were enriched in the Immunity_L group. Briefly, increased activation of the immune part in the Immunity_H group (Supplementary Table S1) was positively associated with several cancer-related pathways in Immunity_H ccRCC patient samples, and it was validated by GSEA. To further clarify the underlying mechanism between immune-associated genes and the development or prognosis of ccRCC patients, we further investigated the upstream PIGs. Then, by comparing differential expression results with the CISTROME gene set, we characterized transcription factors (TFs) that are essential for the development and metastasis of ccRCC.
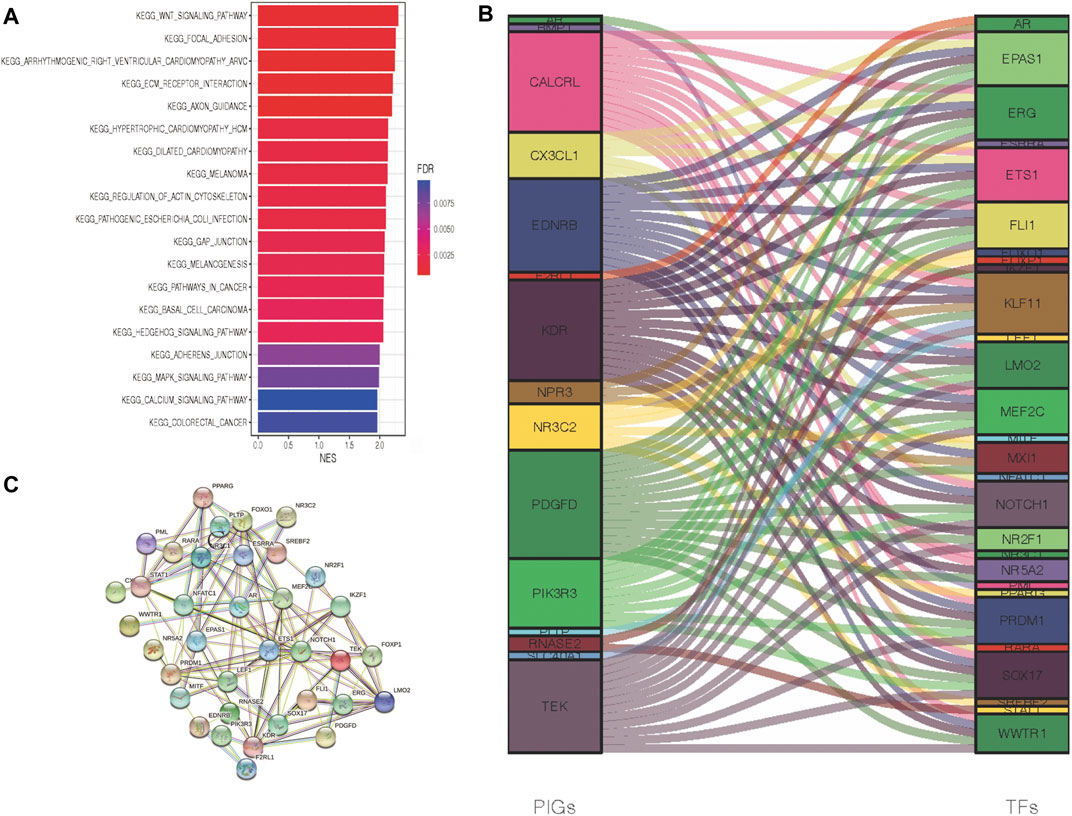
FIGURE 3. Crosstalk networks and pathway characterization between each of the two immune subtypes. (A) GSEA and KEGG analyses between DEGs of two immune subtypes. (B) TF and PIG regulatory crosstalk were displayed via an alluvial diagram. (C) PPI network between TFs and PIGs.
In the above experiments, we generated 29 upregulated transcription factors in the Immunity_H group. Subsequently, a functional network of the TF-PIGs (Figure 3B) was constructed by correlation analysis. All these TFs of ccRCC were positively associated with their interrelated PIGs (Supplementary Table S2). Finally, a PPI (protein–protein interaction) analysis was conducted to validate the TF-PIG interplay, and the presence of a strong connection between each of them was proved (Figure 3C).
First, LASSO-Cox analysis was conducted to reduce the dimensions of these PIGs. Then, to construct an immune gene–associated gene panel for prognosis prediction, we employed IGPM to design an eight-parameter formula for overall survival prediction and prognosis prediction in the TCGA-KIRC database. This risk value formula was (−0.265) * expression of TEK + (−0.019) * expression of CX3CL1 + 0.325 * expression of BMP1 + 0.152 * expression of RNASE2 + (−0.248) * expression of AR + 0.146 * expression of SLC11A1+ (−0.077) * expression of SLC40A1+ (−0.055) * expression of F2RL1 (Figures 4A,B). Additionally, we determined the risk value of ccRCC patients, and then, in accordance with the average risk value, we separated this cohort into two distinct groups: high-risk and low-risk groups (Figure 4C). The survival analysis revealed that the low-risk group had a longer survival time and exhibited a lower mortality rate than the high-risk group (Figure 4D). Meanwhile, we performed a correlation analysis, and the previous outcome confirmed that a higher risk value was associated with a decreased survival time (Figure 4E), suggesting a negative relationship between the risk value and survival time in the ccRCC cohort. Kaplan–Meier survival analysis also showed that the lower-risk group in the ccRCC cohort was related to better overall survival (Figure 4F). Moreover, we drew an ROC curve based on time to verify the stability and accuracy of this panel, and the 1-year, 2-year, and 3-year AUC values of the ROC curve were 0.790, 0.752, and 0.763, respectively (Figure 4G). Then, we sought to use the GEO database to verify the prognostic value of this panel in another independent cohort. In contrast, Kaplan–Meier survival analysis suggested that the high-risk group presented a longer survival time in the GSE29609 cohort (Figure 4H).
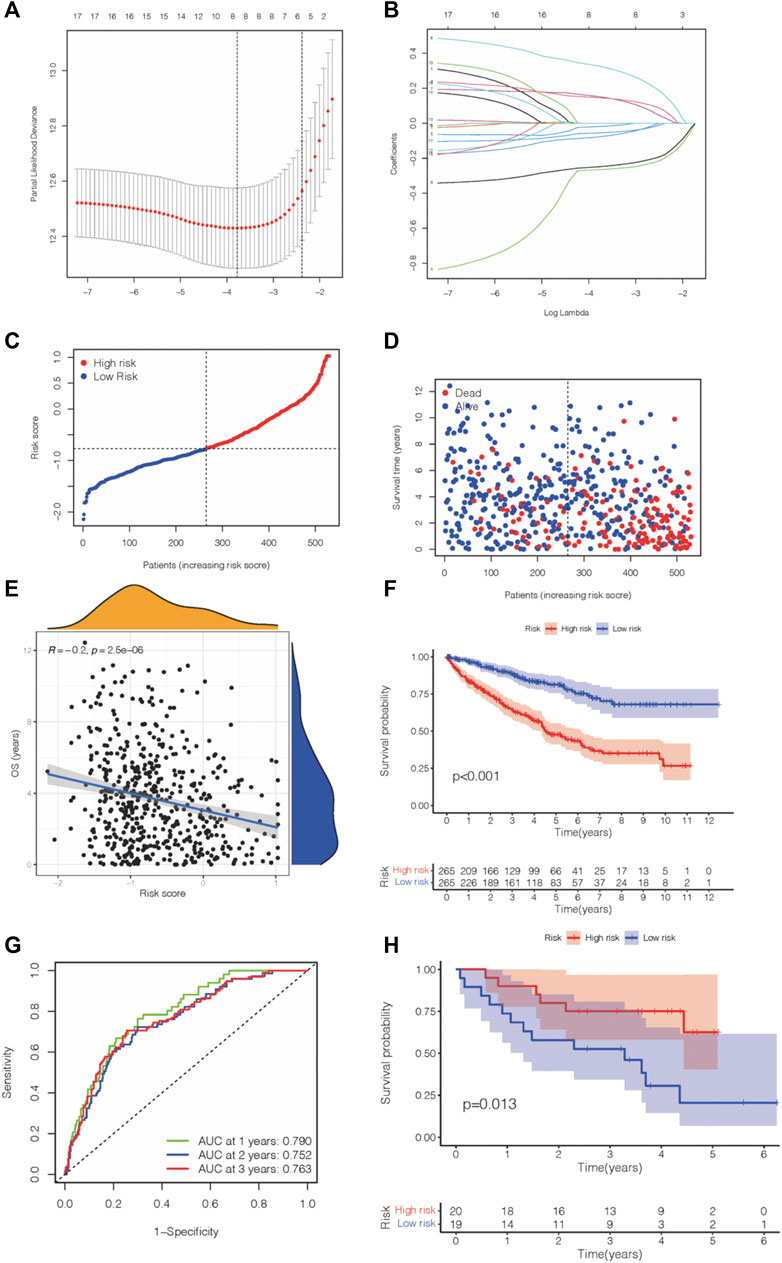
FIGURE 4. IGPM-based prognosis panel was constructed and verified. (A,B) LASSO-Cox regression analysis was applied to construct the prediction model for ccRCC prognosis. (C,D) Risk value and survival information were shown in KIRC. (E) Correlation analysis of the risk value and survival time in KIRC. (F) Kaplan–Meier survival analysis of the KIRC and gene panel. (G) The AUC score of the accuracy of the predictive prognosis panel for KIRC. (H) Kaplan–Meier survival analysis of the gene panel was conducted in GSE29609.
We then checked the relevance between this predictive gene panel and several other relevant parameters, including immune compositions, immune checkpoints, clinical characteristics, and TMB. Treg cells, resting mast cells, M1macrophages, and resting dendritic cells were correlated with the eight PIGs, proving that these immune components have the capability to influence the clinical outcomes of ccRCC patients (Figure 5A). Furthermore, CD274, an immune checkpoint–associated gene, was characterized to analyze the therapeutic value of this eight-gene panel. The expression level of CD274 was negatively related to the risk value of this model in ccRCC patients, suggesting a predictive function in treatment (Figures 5B,C). As a consequence of immune checkpoints, the high-risk group patients suffer from a poorer survival time and prognosis.
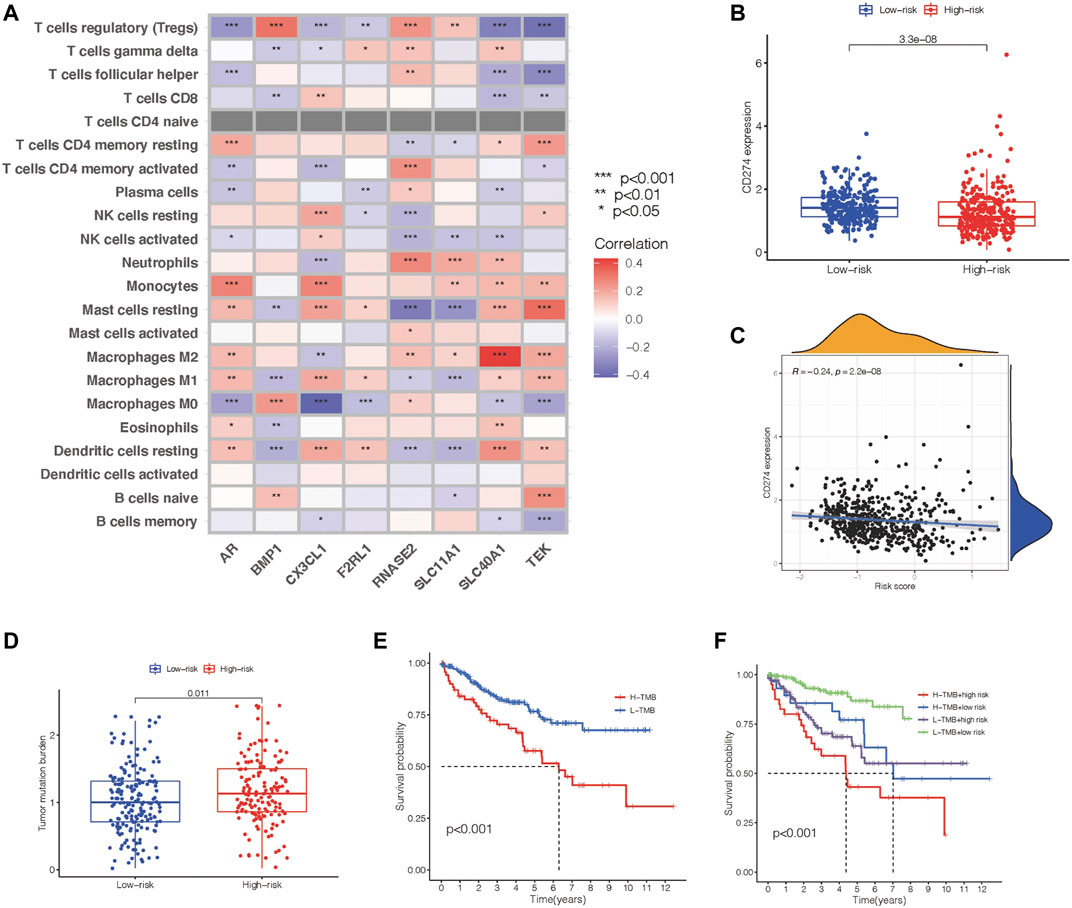
FIGURE 5. Identification of the communication between the prognosis gene panel and immune associated features. (A) Heatmap showing the relationship of the prognosis panel with immune compositions. (B) Scatter plots draw a relationship between the prognosis panel and gene expression of CD274. (C) Scatter plots draw a relationship between the prognosis panel and gene expression of CD274. (D,E) TMB of each group and their association with survival time. (F) Kaplan–Meier survival analysis of the prognosis gene panel accompanied with the TMB value.
Meanwhile, tumor mutation burden has the potential to predict the effect of immunotherapy for tumor patients. The TMB level was proven to be in accordance with the risk value of this prognostic model (Figure 5D). Nevertheless, Kaplan–Meier survival analysis revealed a negative relationship between TMB and overall survival (Figure 5E). This led us to add TMB to our previous model to construct a better tool to predict the prognosis of ccRCC patients. All ccRCC patients were divided into groups including high-risk patients with high TMB, high-risk patients with low TMB, low-risk patients with high TMB, and low-risk patients with low TMB. Kaplan–Meier survival analysis revealed that the overall survival time varied distinctly between each group, and the low-risk patients with low TMB has the longest overall survival time (Figure 5F).
The above results demonstrated that the prognostic gene panel had a strong connection with the clinical outcome. Furthermore, we employed univariate and multivariate Cox regression analyses to investigate whether this gene panel could be used as an independent factor for prognosis prediction in ccRCC patients. When combining this risk value with several clinical features, including age, gender, TNM, and molecular characteristics, we concluded that this gene panel can be used as an independent factor for prognosis prediction, as shown in Figures 6A,B. Furthermore, a more sensitive framework was constructed by using all parameters mentioned before, and the AUC value was obtained in the ROC curve, indicating a better prognostic value (Figure 6C). In the end, a nomogram was established to better predict the prognosis outcome (Figure 6D).
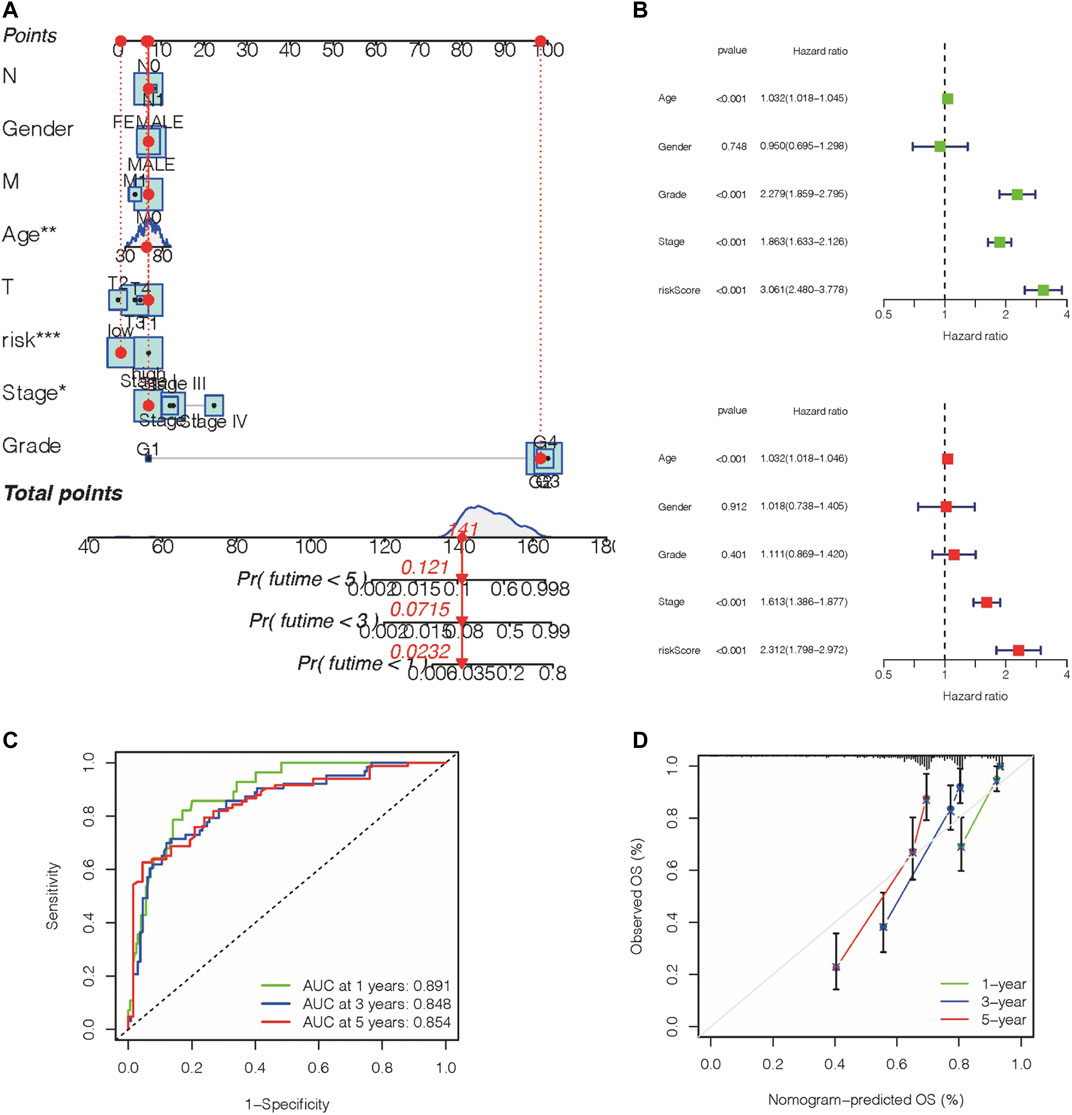
FIGURE 6. Construction of a nomogram with a predictive value for prognosis. (A,B) A nomogram was constructed based on the prognosis gene panel and other relevant features. (C) AUC value of the gene panel for 1-year, 3-year, 5-year prognosis prediction in the KIRC database. (D) Calibration plot designed for the KIRC database.
To validate the differential expression of these immune-associated prognostic genes, RT-qPCR was employed to analyze the mRNA expression in vitro. The mRNA levels of TEK, BMP1, AR, SLC11A1, SLC40A1, and F2RL1 were significantly downregulated in tumor cells compared with normal cells, and CX3CL1 and RNASE2 were upregulated in tumor cells (Figure 7). However, the mechanism of action of each gene in ccRCC requires further investigation.
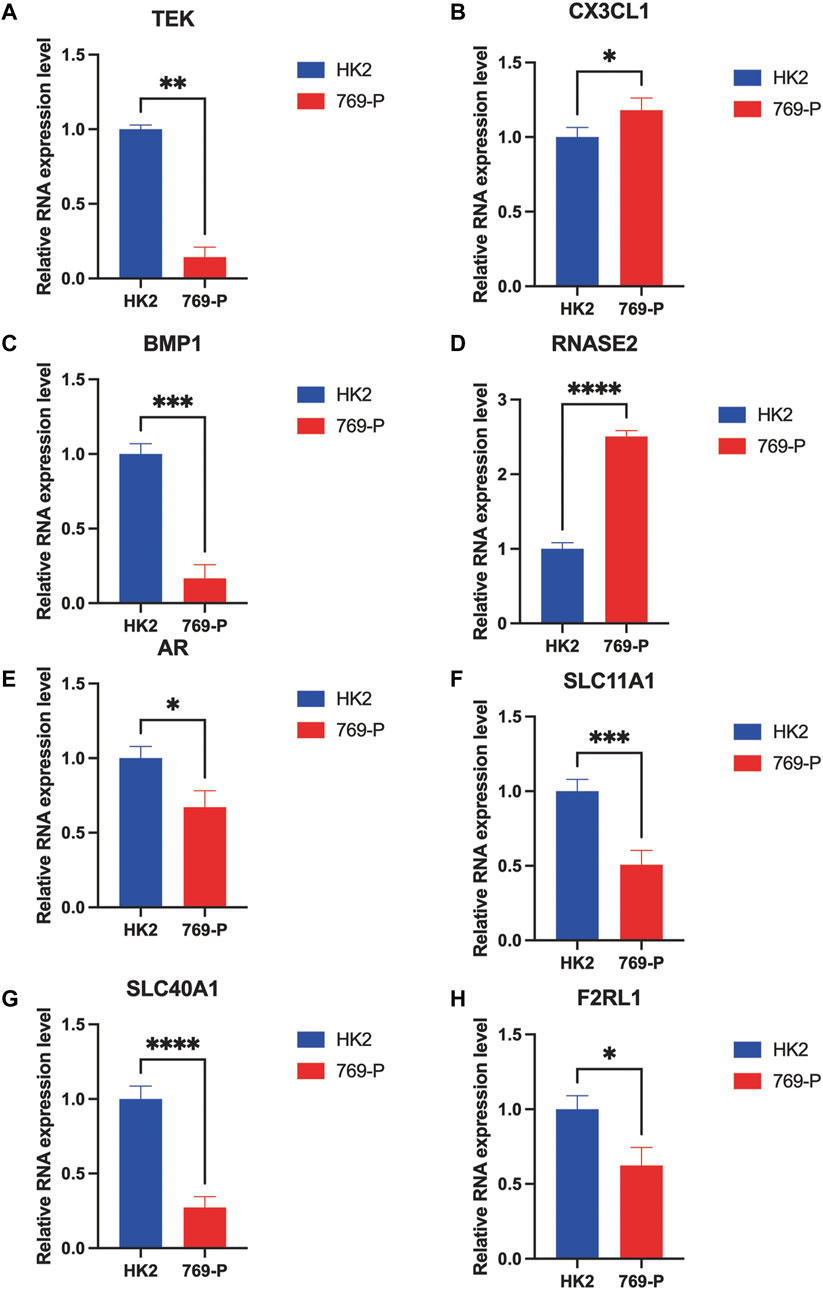
FIGURE 7. RT-qPCR confirmed the difference of the prognostic gene expression in normal renal and renal cell carcinomas. *p < 0.05, **p < 0.01, ***p < 0.001, and ****p < 0.0001.
Despite targeted therapies, poor survival rates and advanced metastasis of ccRCC treatment are still challenging issues (Gu et al., 2020). The advent of immunotherapy against ccRCC, such as the targeting of PD-1, PD-L1, and CTLA4, has recently been demonstrated to revolutionize the clinical treatment for ccRCC (Farkona et al., 2016). Nevertheless, a significant number of patients still fail to respond to targeted therapy mainly due to malignant metastasis (Makhov et al., 2018). Additionally, accurate prognostic biomarkers of treatment efficacy in ccRCC are still lacking. This situation reflects the urgent need to identify potential new biomarkers for prognosis prediction and treatment targets (Xu et al., 2019b; Hu et al., 2020).
Clear cell renal cell carcinoma is one of the most immune-infiltrated tumors in the urinary system (Şenbabaoğlu et al., 2016). In reality, it is important to determine the immune function of each patient to choose the best immunotherapy strategy and predict prognosis. In recent years, some studies have established prognostic panels for ccRCC based on immune genes to predict the prognosis of ccRCC (Şenbabaoğlu et al., 2016). Immune genes appear as a valuable tool to supplement prognosis in clinical practice. In this study, ccRCCs were reclassified into two distinct ccRCC groups, the Immunity_H and Immunity_L groups, which were defined by immune characteristics, including immune-associated genes, immune checkpoint molecules, and immunotherapy. The Immunity_H group had more immune-associated gene expressions.
Additionally, the Immunity_H group was engaged in processes related to tumorigenesis and development, including Wnt signaling, focal adhesion, ECM receptor interaction, and axon guidance. Altogether, the potential associations between cancer-related processes and immune infiltration pathways in ccRCC were validated (Lai et al., 2021).
In our current work, eight genes, TEK, CX3CL1, BMP1, RNASE2, AR, SLC11A1, SLC40A1, and F2RL1, were found to be associated with poor prognosis in ccRCC based on the above methods. The prognosis model was established, and our findings indicated that the prognosis panel is a promising predictive indicator for patients with ccRCC.
Among the eight genes used to develop the IGPM-based prognosis panel, five were reported to be associated with the prognosis of ccRCC. TEK, an immune marker that promotes apoptosis by regulating the phosphorylation of AKT, can be used for risk assessment and survival prediction (Chen et al., 2021). CX3CL1, an immunoregulatory gene that is highly expressed in inflammatory ccRCC, provides a tool that enables individualized treatment of ccRCC (Wang et al., 2021). The high expression of BMP1, bone morphogenetic protein 1, indicates poor prognosis in ccRCC (Xiao et al., 2020). RNASE2, ribonuclease A Family Member 2, an RNA binding protein, indicates a prognostic value, together with other prognostic differentially expressed immune-related genes (PDEIRGs) (Wan et al., 2019; Qin et al., 2021). AR, an androgen receptor, suppresses bone metastasis of renal cancer and acts as a valuable feature in prognosis in ccRCC (Gong et al., 2021). This encourages us to further investigate the molecular mechanisms of these genes in ccRCC in future studies.
Nevertheless, there were a few limitations to our study. First, all data analyzed in this study were obtained from online databases, and further laboratory studies and clinical trial verifications are required to assess the value of this panel in ccRCC. Second, the immune gene sequence was incomplete; therefore, future studies are needed to explore whether other immune-associated genes could be used as diagnostic markers.
This study mainly focused on immune-associated genes and their association with ccRCC prognosis. This work provided a novel predictive biomarker for prognosis and clinical outcome prediction, which could help to identify an optimal prognosis prediction strategy for ccRCC and guide future immunotherapy regimens in ccRCC patients.
The datasets presented in this study can be found in online repositories. The names of the repository/repositories and accession number(s) can be found in the article/Supplementary Material.
JJ and ML conceived and funded the study. ZX and LW designed and performed the research, drafted the manuscript. SH and YZ performed and drafted the manuscript. FS and MC coordinated technical support. SZ and ZL revised the manuscript. All authors contributed to the article and approved the submitted version.
This work was supported by The National Natural Science Foundation of China (No.81771564) and Zunyi Municipal Science and Technology Bureau (No. 2018(192)).
The authors declare that the research was conducted in the absence of any commercial or financial relationships that could be construed as a potential conflict of interest.
All claims expressed in this article are solely those of the authors and do not necessarily represent those of their affiliated organizations, or those of the publisher, the editors, and the reviewers. Any product that may be evaluated in this article, or claim that may be made by its manufacturer, is not guaranteed or endorsed by the publisher.
We thank Professor Shujie Xia (Department of Urology, Shanghai General Hospital, Shanghai Jiaotong University; Department of Urology, Shanghai General Hospital of Nanjing Medical University) for his assistance of guiding in the writing process and Lei Pan for his former research stuff to create a better workflow for this study.
The Supplementary Material for this article can be found online at: https://www.frontiersin.org/articles/10.3389/fcell.2021.794840/full#supplementary-material
Bielecka, Z., Czarnecka, A., Solarek, W., Kornakiewicz, A., and Szczylik, C. (2014). Mechanisms of Acquired Resistance to Tyrosine Kinase Inhibitors in Clear - Cell Renal Cell Carcinoma (ccRCC). Cst 8 (3), 219–228. doi:10.2174/1574362409666140206223014
Braun, D. A., Hou, Y., Bakouny, Z., Ficial, M., Sant’ Angelo, M., Forman, J., et al. (2020). Interplay of Somatic Alterations and Immune Infiltration Modulates Response to PD-1 Blockade in Advanced Clear Cell Renal Cell Carcinoma. Nat. Med. 26 (6), 909–918. doi:10.1038/s41591-020-0839-y
Capitanio, U., Bensalah, K., Bex, A., Boorjian, S. A., Bray, F., Coleman, J., et al. (2019). Epidemiology of Renal Cell Carcinoma. Eur. Urol. 75 (1), 74–84. doi:10.1016/j.eururo.2018.08.036
Chen, S., Yu, M., Ju, L., Wang, G., Qian, K., Xiao, Y., et al. (2021). The Immune‐related Biomarker TEK Inhibits the Development of Clear Cell Renal Cell Carcinoma (ccRCC) by Regulating AKT Phosphorylation. Cancer Cel Int 21 (1), 119. doi:10.1186/s12935-021-01830-1
Chevrier, S., Levine, J. H., Zanotelli, V. R. T., Silina, K., Schulz, D., Bacac, M., et al. (2017). An Immune Atlas of Clear Cell Renal Cell Carcinoma. Cell 169 (4), 736–749.e18. doi:10.1016/j.cell.2017.04.016
Clerici, S., and Boletta, A. (2020). Role of the KEAP1-NRF2 Axis in Renal Cell Carcinoma. Cancers 12 (11), 3458. doi:10.3390/cancers12113458
Farkona, S., Diamandis, E. P., and Blasutig, I. M. (2016). Cancer Immunotherapy: The Beginning of the End of Cancer? BMC Med. 14, 73. doi:10.1186/s12916-016-0623-5
Giraldo, N. A., Becht, E., Vano, Y., Petitprez, F., Lacroix, L., Validire, P., et al. (2017). Tumor-Infiltrating and Peripheral Blood T-Cell Immunophenotypes Predict Early Relapse in Localized Clear Cell Renal Cell Carcinoma. Clin. Cancer Res. 23 (15), 4416–4428. doi:10.1158/1078-0432.CCR-16-2848
Gong, D., Sun, Y., Guo, C., Sheu, T. j., Zhai, W., Zheng, J., et al. (2021). Androgen Receptor Decreases Renal Cell Carcinoma Bone Metastases via Suppressing the Osteolytic Formation Through Altering a Novel circEXOC7 Regulatory Axis. Clin. Translational Med. 11 (3), e353. doi:10.1002/ctm2.353
Gu, Y.-Y., Chen, G., Lin, P., Cheng, J.-W., Huang, Z.-G., Luo, J., et al. (2020). Development and Validation of an Immune Prognostic Classifier for Clear Cell Renal Cell Carcinoma. Cbm 27 (2), 265–275. doi:10.3233/CBM-191017
Hsieh, J. J., Purdue, M. P., Signoretti, S., Swanton, C., Albiges, L., Schmidinger, M., et al. (2017). Renal Cell Carcinoma. Nat. Rev. Dis. Primers 3, 17009. doi:10.1038/nrdp.2017.9
Hu, J., Chen, Z., Bao, L., Zhou, L., Hou, Y., Liu, L., et al. (2020). Single-Cell Transcriptome Analysis Reveals Intratumoral Heterogeneity in ccRCC, Which Results in Different Clinical Outcomes. Mol. Ther. 28 (7), 1658–1672. doi:10.1016/j.ymthe.2020.04.023
Iasonos, A., Schrag, D., Raj, G. V., and Panageas, K. S. (2008). How to Build and Interpret a Nomogram for Cancer Prognosis. Jco 26 (8), 1364–1370. doi:10.1200/JCO.2007.12.9791
Kobak, D., and Berens, P. (2019). The Art of Using T-SNE for Single-Cell Transcriptomics. Nat. Commun. 10 (1), 5416. doi:10.1038/s41467-019-13056-x
Lai, Y., Tang, F., Huang, Y., He, C., Chen, C., Zhao, J., et al. (2021). The Tumour Microenvironment and Metabolism in Renal Cell Carcinoma Targeted or Immune Therapy. J. Cel Physiol 236 (3), 1616–1627. doi:10.1002/jcp.29969
Li, P., Xiao, J., Zhou, B., Wei, J., Luo, J., and Chen, W. (2020). SYNE1 Mutation May Enhance the Response to Immune Checkpoint Blockade Therapy in Clear Cell Renal Cell Carcinoma Patients. Aging 12 (19), 19316–19324. doi:10.18632/aging.103781
Lin, J., Yu, M., Xu, X., Wang, Y., Xing, H., An, J., et al. (2020). Identification of Biomarkers Related to CD8+ T Cell Infiltration with Gene Co-expression Network in Clear Cell Renal Cell Carcinoma. Aging 12 (4), 3694–3712. doi:10.18632/aging.102841
Ljungberg, B., Bensalah, K., Canfield, S., Dabestani, S., Hofmann, F., Hora, M., et al. (2015). EAU Guidelines on Renal Cell Carcinoma: 2014 Update. Eur. Urol. 67 (5), 913–924. doi:10.1016/j.eururo.2015.01.005
Makhov, P., Joshi, S., Ghatalia, P., Kutikov, A., Uzzo, R. G., and Kolenko, V. M. (2018). Resistance to Systemic Therapies in Clear Cell Renal Cell Carcinoma: Mechanisms and Management Strategies. Mol. Cancer Ther. 17 (7), 1355–1364. doi:10.1158/1535-7163.MCT-17-1299
McDougal, W. S., Wein, A. J., Kavoussi, L. R., Partin, A. W., and Peters, C. A. (2015). Campbell-walsh Urology. 11th Edn. Elsevier Health Sciences.
McEligot, A. J., Poynor, V., Sharma, R., and Panangadan, A. (2020). Logistic LASSO Regression for Dietary Intakes and Breast Cancer. Nutrients 12 (9), 2652. doi:10.3390/nu12092652
Meng, Y., Cai, K., Zhao, J., Huang, K., Ma, X., Song, J., et al. (2021). Transcriptional Profiling Reveals Kidney Neutrophil Heterogeneity in Both Healthy People and ccRCC Patients. J. Immunol. Res. 2021, 1–17. doi:10.1155/2021/5598627
Miao, D., Margolis, C. A., Gao, W., Voss, M. H., Li, W., Martini, D. J., et al. (2018). Genomic Correlates of Response to Immune Checkpoint Therapies in Clear Cell Renal Cell Carcinoma. Science 359 (6377), 801–806. doi:10.1126/science.aan5951
Mulders, P., Figlin, R., deKernion, J. B., Wiltrout, R., Linehan, M., Parkinson, D., et al. (1997). Renal Cell Carcinoma: Recent Progress and Future Directions. Cancer Res. 57 (22), 5189–5195.
Newman, A. M., Liu, C. L., Green, M. R., Gentles, A. J., Feng, W., Xu, Y., et al. (2015). Robust Enumeration of Cell Subsets from Tissue Expression Profiles. Nat. Methods 12 (5), 453–457. doi:10.1038/nmeth.3337
Nishida, J., Momoi, Y., Miyakuni, K., Tamura, Y., Takahashi, K., Koinuma, D., et al. (2020). Epigenetic Remodelling Shapes Inflammatory Renal Cancer and Neutrophil-dependent Metastasis. Nat. Cel Biol 22 (4), 465–475. doi:10.1038/s41556-020-0491-2
Pesenti, C., Navone, S. E., Guarnaccia, L., Terrasi, A., Costanza, J., Silipigni, R., et al. (2019). The Genetic Landscape of Human Glioblastoma and Matched Primary Cancer Stem Cells Reveals Intratumour Similarity and Intertumour Heterogeneity. Stem Cell Int. 2019, 1–12. doi:10.1155/2019/2617030
Qi, Y., Xia, Y., Lin, Z., Qu, Y., Qi, Y., Chen, Y., et al. (2020). Tumor-infiltrating CD39+CD8+ T Cells Determine Poor Prognosis and Immune Evasion inCclear Cell Renal Cell Carcinoma Patients. Cancer Immunol. Immunother:cii 69 (8), 1565–1576. doi:10.1007/s00262-020-02563-2
Qin, X., Liu, Z., Yan, K., Fang, Z., and Fan, Y. (2021). Integral Analysis of the RNA Binding Protein-Associated Prognostic Model for Renal Cell Carcinoma. Int. J. Med. Sci. 18 (4), 953–963. doi:10.7150/ijms.50704
Ritchie, M. E., Phipson, B., Wu, D., Hu, Y., Law, C. W., Shi, W., et al. (2015). Limma powers Differential Expression Analyses for RNA-Sequencing and Microarray Studies. Nucleic Acids Res. 43 (7), e47. doi:10.1093/nar/gkv007
Şenbabaoğlu, Y., Gejman, R. S., Winer, A. G., Liu, M., Van Allen, E. M., de Velasco, G., et al. (2016). Tumor Immune Microenvironment Characterization in Clear Cell Renal Cell Carcinoma Identifies Prognostic and Immunotherapeutically Relevant Messenger RNA Signatures. Genome Biol. 17 (1), 231. doi:10.1186/s13059-016-1092-z
Sorokin, I., Canvasser, N. E., Margulis, V., Lotan, Y., Raj, G., Sagalowsky, A., et al. (2017). Axial Abdominal Imaging After Partial Nephrectomy for T1 Renal Cell Carcinoma Surveillance. J. Urol. 198 (5), 1021–1026. doi:10.1016/j.juro.2017.04.080
Wan, B., Liu, B., Huang, Y., Yu, G., and Lv, C. (2019). Prognostic Value of Immune-Related Genes in Clear Cell Renal Cell Carcinoma. Aging 11 (23), 11474–11489. doi:10.18632/aging.102548
Wang, J., Zhang, C., He, W., and Gou, X. (2020). Effect of m6A RNA Methylation Regulators on Malignant Progression and Prognosis in Renal Clear Cell Carcinoma. Front. Oncol. 10, 3. doi:10.3389/fonc.2020.00003
Wang, Q., Hu, J., Kang, W., Wang, J., Xiang, Y., Fu, M., et al. (2021). Tumor Microenvironment Immune Subtypes for Classification of Novel clear Cell Renal Cell Carcinoma Profiles with Prognostic and Therapeutic Implications. Medicine 100 (11), e24949. doi:10.1097/MD.0000000000024949
Wu, H., and Zhang, J. (2018). Decreased Expression of TFAP2B in Endometrial Cancer Predicts Poor Prognosis: A Study Based on TCGA Data. Gynecol. Oncol. 149 (3), 592–597. doi:10.1016/j.ygyno.2018.03.057
Xiao, W., Wang, X., Wang, T., and Xing, J. (2020). Overexpression of BMP1 Reflects Poor Prognosis in Clear Cell Renal Cell Carcinoma. Cancer Gene Ther. 27 (5), 330–340. doi:10.1038/s41417-019-0107-9
Xu, W. H., Shi, S. N., Xu, Y., Wang, J., Wang, H. K., Cao, D. L., et al. (2019a). Prognostic Implications of Aquaporin 9 Expression in Clear Cell Renal Cell Carcinoma. J. Transl Med. 17 (1), 363. doi:10.1186/s12967-019-2113-y
Xu, W. H., Xu, Y., Wang, J., Wan, F. N., Wang, H. K., Cao, D. L., et al. (2019b). Prognostic Value and Immune Infiltration of Novel Signatures in Clear Cell Renal Cell Carcinoma Microenvironment. Aging 11 (17), 6999–7020. doi:10.18632/aging.102233
Xu, W., Atkins, M. B., and McDermott, D. F. (2020). Checkpoint Inhibitor Immunotherapy in Kidney Cancer. Nat. Rev. Urol. 17 (3), 137–150. doi:10.1038/s41585-020-0282-3
Yi, M., Nissley, D. V., McCormick, F., and Stephens, R. M. (2020). ssGSEA Score-Based Ras Dependency Indexes Derived from Gene Expression Data Reveal Potential Ras Addiction Mechanisms with Possible Clinical Implications. Sci. Rep. 10 (1), 10258. doi:10.1038/s41598-020-66986-8
Yoshihara, K., Shahmoradgoli, M., Martínez, E., Vegesna, R., Kim, H., Torres-Garcia, W., et al. (2013). Inferring Tumour Purity and Stromal and Immune Cell Admixture from Expression Data. Nat. Commun. 4, 2612. doi:10.1038/ncomms3612
Zarrabi, A. J., Kao, D., Nguyen, D. T., Loscalzo, J., and Handy, D. E. (2017). Hypoxia-induced Suppression of C-Myc by HIF-2α in Human Pulmonary Endothelial Cells Attenuates TFAM Expression. Cell Signal. 38, 230–237. doi:10.1016/j.cellsig.2017.07.008
Keywords: clear cell renal cell carcinomas, immunotherapy, immune gene, prognosis panel, nomogram
Citation: Xie Z, Wu L, Hua S, Zhang Y, Shi F, Chen M, Zhao S, Liu Z, Liu M and Jiang J (2021) External Validation of the Prognostic Value of an Immune-Associated Gene Panel for Clear Cell Renal Cell Carcinomas. Front. Cell Dev. Biol. 9:794840. doi: 10.3389/fcell.2021.794840
Received: 14 October 2021; Accepted: 07 December 2021;
Published: 23 December 2021.
Edited by:
Chao Qin, Nanjing Medical University, ChinaReviewed by:
Qijie Zhang, Nanjing Medical University, ChinaCopyright © 2021 Xie, Wu, Hua, Zhang, Shi, Chen, Zhao, Liu, Liu and Jiang. This is an open-access article distributed under the terms of the Creative Commons Attribution License (CC BY). The use, distribution or reproduction in other forums is permitted, provided the original author(s) and the copyright owner(s) are credited and that the original publication in this journal is cited, in accordance with accepted academic practice. No use, distribution or reproduction is permitted which does not comply with these terms.
*Correspondence: Meng Liu, NTM1Nzg4ODQ3QHFxLmNvbQ==; Juntao Jiang, amp0dXJvbG9naXN0QDEyNi5jb20=
†These authors have contributed equally to this work
Disclaimer: All claims expressed in this article are solely those of the authors and do not necessarily represent those of their affiliated organizations, or those of the publisher, the editors and the reviewers. Any product that may be evaluated in this article or claim that may be made by its manufacturer is not guaranteed or endorsed by the publisher.
Research integrity at Frontiers
Learn more about the work of our research integrity team to safeguard the quality of each article we publish.