- 1Beijing Tiantan Hospital, Capital Medical University, Beijing, China
- 2Beijing Neurosurgical Institute, Capital Medical University, Beijing, China
- 3CapitalBio Corporation, National Engineering Research Center for Beijing Biochip Technology, Beijing, China
- 4Chinese Glioma Genome Atlas Network, Beijing, China
Annexin A1 (ANXA1) is a calcium-dependent phospholipid-binding protein and has been implicated in multiple functions essential in cancer, including cell proliferation, apoptosis, chemosensitivity, metastasis, and invasion. However, the biological role and clinical behavior of ANXA1 in glioma remain unclear. In this study, RNA-seq (n = 1018 cases) and whole-exome sequencing (WES) (n = 286 cases) data on a Chinese cohort, RNA-seq data with different histological regions of glioblastoma blocks (n = 270 cases), and scRNA-seq data (n = 7630 cells) were used. We used the R software to perform statistical calculations and graph rendering. We found that ANXA1 is closely related to the malignant progression in gliomas. Meanwhile, ANXA1 is significantly associated with clinical behavior. Furthermore, the mutational profile revealed that glioma subtypes classified by ANXA1 expression showed distinct genetic features. Functional analyses suggest that ANXA1 correlates with the immune-related function and cancer hallmark. At a single-cell level, we found that ANXA1 is highly expressed in M2 macrophages and tumor cells of the mesenchymal subtype. Importantly, our result suggested that ANXA1 expression is significant with the patient’s survival outcome. Our study revealed that ANXA1 was closely related to immune response. ANXA1 plays a key factor in M2 macrophages and MES tumor cells. Patients with lower ANXA1 expression levels tended to experience improved survival. ANXA1 may become a valuable factor for the diagnosis and treatment of gliomas in clinical practice.
Introduction
Gliomas are the most common malignant brain tumor in adults. According to the 2016 WHO classification, glioma can be classified into five subtypes, namely, IDH-mutant lower-grade gliomas (LGGs) with chromosome 1p/19q co-deletion, IDH-mutant LGGs without 1p/19q co-deletion, IDH wild-type LGGs, IDH-mutant glioblastomas (GBMs), and IDH wild-type GBMs (Cancer Genome Atlas Research,N. et al., 2015; Louis et al., 2016). Although there have been advances of surgical resection followed by radiotherapy and chemotherapy with temozolomide (TMZ) in the past decades, patients with glioma still have poor prognosis, indicating that the main challenges underlying therapeutic failure are rooted in tumor heterogeneity (Jiang et al., 2016; Jiang et al., 2021). Studies of inter-tumor heterogeneity based on bulk tumor expression profiles found that GBMs exist in four subtypes, namely, proneural (TCGA-PN), classical (TCGA-CL), mesenchymal (TCGA-MES), and neural (TCGA-NE) (Verhaak et al., 2010). Recently, single-cell RNA-sequencing (scRNA-seq) has emerged as a critical technology to comprehensively depict the cellular states within tissues, both in health and in disease. By integrating single-cell RNA-sequencing (scRNA-seq) and other omics data, Neftel et al. found that malignant cells in GBMs exist in four cellular states that recapitulate 1) neural-progenitor–like (NPC-like), 2) oligodendrocyte-progenitor–like (OPC-like), 3) astrocyte-like (AC-like), and 4) mesenchymal-like (MES-like) states (Neftel et al., 2019), in which AC-like and MES-like cell types are enriched in TCGA-CL and TCGA-MES, and NPC- and OPC-like cell types are enriched in TCGA-PN. Although these findings shed much light on tumor heterogeneity, the relationships between the tumor and tumor microenvironment (TME) in glioma are still poorly understood.
As the first member of the annexin superfamily, annexin A1 (ANXA1) is a calcium-dependent phospholipid-binding protein. Previous studies suggest that loss of function or expression of this gene has been implicated in multiple functions essential in cancer, including cell proliferation, apoptosis, chemosensitivity, metastasis, and invasion (Bai et al., 2020; Feng et al., 2020; Xiong et al., 2021). Recently, Lin et al. investigated the prognostic and immune role of ANXA1 in gliomas (Lin et al., 2021). However, the systematic and comprehensive transcriptome characterization of ANXA1 in gliomas is unclear. In this study, we integrated bulk genomic and transcriptomic profiles and scRNA-seq data to comprehensively characterize ANXA1’s role in gliomas. Our work provides an insight on ANXA1’s role in glioma, which might translate to clinical application for future diagnosis and therapy in glioma.
Materials and Methods
Patients and Samples
All RNA-sequencing data of diffuse glioma patients were obtained from two independent databases: the CGGA dataset (Dataset 1, n = 325 cases) (http://www.cgga.org.cn) and the CGGA dataset (Dataset 2, n = 693 cases) (Zhao et al., 2021). To compare the gene expression patterns of tumor tissues and normal brain tissues, we also collected 20 RNA-seq samples of normal brain tissues from the CGGA database in this study. All WES data of diffuse glioma patients from WHO II-IV were obtained from the CGGA Network (Dataset 3, n = 286). Clinical information of all patients was also collected from the CGGA Network, such as WHO grade (WHO II-IV), histology grade (oligodendroglioma, anaplastic oligodendroglioma, astrocytoma, anaplastic astrocytoma, and glioblastoma, abbreviated as O, AO, A, AA, and GBMs, respectively); gender, age, and overall survival data; progression status (primary and recurrent states); and molecular pathological features (IDH mutation status, MGMT promoter methylation status, and chromosome 1p/19q co-deletion status). This research was approved by the Ethics Committee of Capital Medical University, and all patients provided written informed consent.
To further explore ANXA1 expression in different histological regions of GBM blocks, we obtained Ivy data from the Ivy Glioblastoma Atlas Project–Allen Institute for Brain Science datasets (Dataset 4, n = 270 cases) (Puchalski et al., 2018) (http://glioblastoma.alleninstitute.org/). For this dataset, we collected different histological regions that contain 1) cellular tumor (CT), 2) infiltrating tumor (IT), 3) leading edge (LE), 4) microvascular proliferation (MP), and 5) pseudopalisading cells (PC).
The scRNA-seq data of diffuse glioma patients were obtained from a previous study (Neftel et al., 2019) (https://singlecell.broadinstitute.org/single_cell/study/SCP393/single-cell-rna-seq-of-adult-and-pediatric-glioblastoma). Of them, there are 6863 tumor cells, 754 macrophages, 219 oligodendrocytes, and 94 T cells (Dataset 5). For tumor cells, we also obtained four types of cellular state annotations that recapitulate 1) neural-progenitor–like (NPC-like), 2) oligodendrocyte-progenitor–like (OPC-like), 3) astrocyte-like (AC-like), and 4) mesenchymal-like (MES-like) states.
CGGA CNV Data Analysis
WES data were mapped to the human reference genome (hg19) using the Burrows–Wheeler Aligner (BWA) tool (Li and Durbin, 2009) with default parameters. Then, SAMtools (Li et al., 2009) and Picard (http://broadinstitute.github.io/picard/) were used to sort the reads by coordinates and mark duplicates. Next, we used the CNVkit software (Talevich et al., 2016) to estimate the CNA status of well-known driver genes in gliomas, such as PTEN, MET, EGFR, and CDKN2A/B. In this study, a copy number gain is identified as log2 (ratio) larger than 0.5, while a copy number loss is identified as log2 (ratio) less than 1.0.
Immune Proportion Analysis
For RNA-seq data, we estimated the abundance of member cell types using the CIBERSORT method (Newman et al., 2015). We uploaded gene expression profiles and ran CIBERSORT software online (https://cibersort.stanford.edu/runcibersort.php) by selecting LM22 (gene signature) and 1000 permutation parameters. As result, we obtained the 22 kinds of cell composition for each sample from gene expression profiles.
TCGA Molecular Classifications for Each Sample
For RNA-seq data, we identified the TCGA subtypes for each sample as previously described (Wang et al., 2017). In this pipeline, ssGSEA was performed to obtain the scores of the four signatures for each sample from gene expression profiles. Since the scores of the four signatures were not directly comparable, this pipeline was used to perform a resampling procedure to generate null distributions for each of the four subtypes (1000 permutations). Following this procedure, this method generated random ssGSEA scores for each subtype to provide empirical p-values and scaled ssGSEA scores for the raw ssGSEA scores of each sample. Finally, we assigned the TCGA subtypes for each sample based on the p-values and scaled ssGSEA scores.
Immunohistochemistry Analysis
The selected glioma samples were collected from the CGGA tissue bank and were supervised by the Beijing Tiantan Hospital Institutional Review Board (KY 2019-143-02). IHC analysis was performed as previously reported (Hu et al., 2018). Briefly, the slides were deparaffinized and boiled in antigen-retrieval buffer. Then, the slides were blocked using endogenous peroxidase with H2O2, subsequently blocking non-special sites, and the slides were incubated with primary antibodies against ANXA1 (Cell Signaling Technology #32934, 1:400 dilution) overnight at 4°C. On the second day, the slides were rinsed three times in PBS buffer and incubated with the secondary antibody working solution (PV6000 Beijing Zhongshan Jinqiao Biological Company) for 60 min at room temperature. Last, the IHC images were captured using an Axio Imager 2 microscope (Zeiss). The scores were calculated according to the intensity score multiplied by the areas as follows: The intensity was defined as follows: 0 for no staining, one for weak staining, two for moderate staining, and three for strong staining. The area score was determined as follows: 0 for less than 5% cells positive, 1 for 5–25% cells positive, 2 for 26–50% cells positive, 3 for 51–75% cells positive, and 4 for greater than 75% cells positive.
Gene Set Enrichment Analysis
To investigate the biological functions of the ANXA1 gene, the ANXA1 coexpressed genes were obtained and gene set enrichment analysis (GSEA) (Subramanian et al., 2005) was performed. First, we downloaded the gene sets from the GSEA website (http://www.gsea-msigdb.org/gsea), including the Gene Ontology (GO) biological process, Kyoto Encyclopedia of Genes and Genomes (KEGG), and cancer hallmark. Then, ANXA1 coexpressed genes were obtained by the Pearson expression correlation analysis between ANXA1 and other genes. Finally, we implemented the ClusterProfiler R package to reach this process (Yu et al., 2012).
Statistical Analysis
The R statistical software (v4.0.3) (http://www.r-project.org) was used for statistical calculations and graph rendering. The prognostic value of ANXA1 was estimated by using the Kaplan–Meier analysis and Cox proportional hazard model analysis using the “survival” and “survminer” packages in R. In this study, the Pearson correlation analysis was used to obtain ANXA1 coexpressed genes. In particular, a positive correlation is defined as a correlation coefficient larger than 0.6 and p-value < 0.05, while a negative correlation is defined as a correlation coefficient less than −0.6 and p-value < 0.05. The Wilcoxon test and one-way ANOVA test were used for two and multiple group comparisons, respectively. For all statistical methods, p < 0.05 was considered as a significant difference.
Results
Patient Characteristics
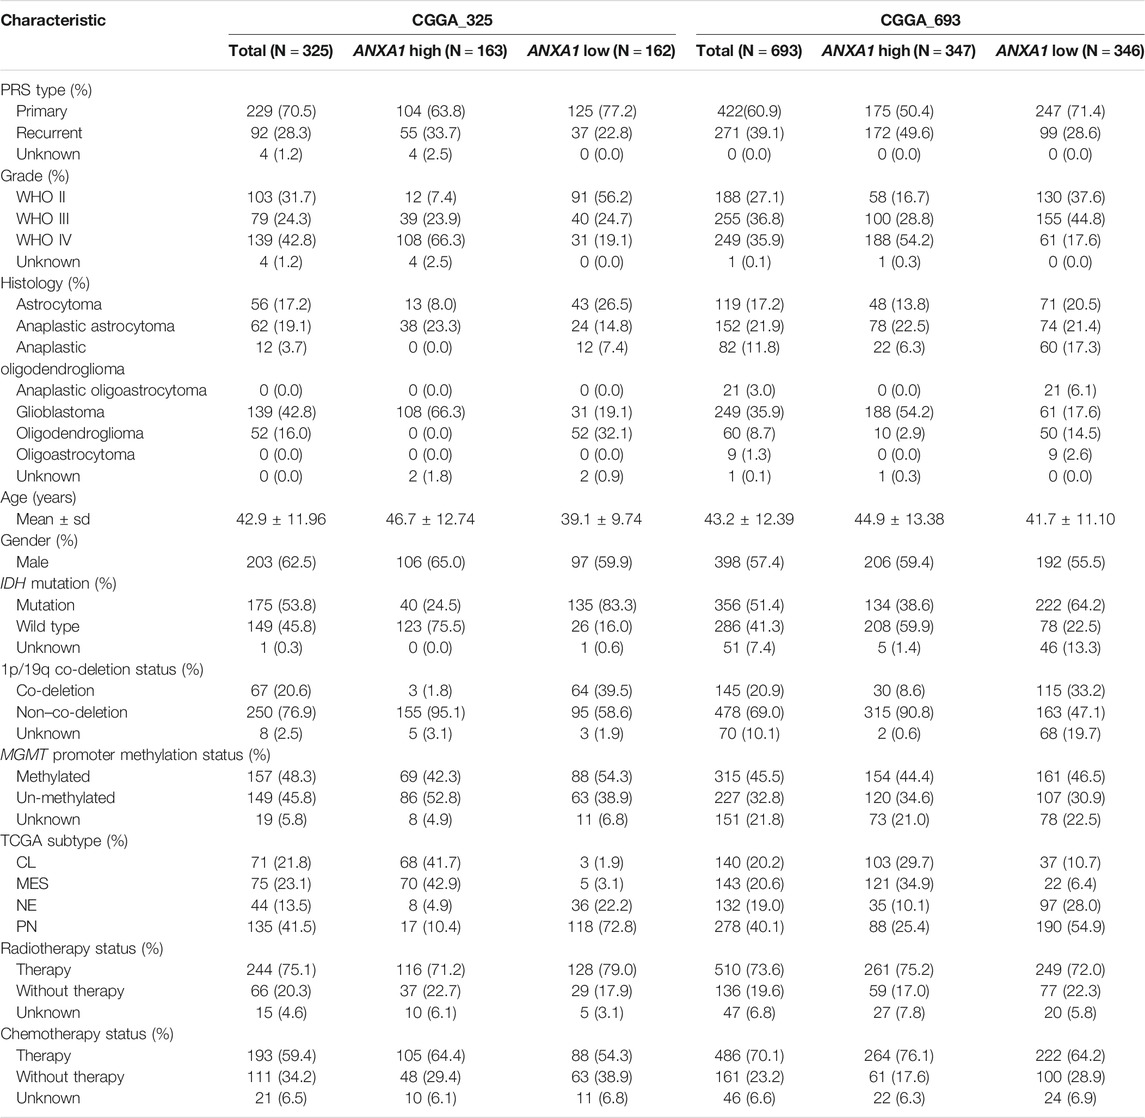
In this study, a total of 1,018 patients with gliomas aged 8–79 years (median ± sd, 42 ± 12 years) were included. The majority of glioma patients were males (59%) and WHO IV (38%), and there were 651 cases of primary gliomas. For these patients, 617 case deaths were recorded, with the median survival of NA (3470-NA), 1208 (1028-1657), and 378 (344-415) for WHO II, WHO III, and WHO IV, respectively. All patients with transcriptomic data were used to analyze ANXA1 expression, and 231 of patients were also performed with WES to investigate genetic changes. The clinical and pathological features of these patients are described in Table 1.
ANXA1 Is Associated With Malignant Progression of Gliomas
To explore ANXA1’s role in gliomas, we examined its transcriptomic level in different subtypes of gliomas in two batches of RNA-seq data from the CGGA database. We found that the expression values of ANXA1 were significantly higher in GBM patients than in those with normal brain and lower-grade gliomas (WHO II and WHO III) in Dataset 1 (p < 5e-5, Figure 1A). Our further results showed that the ANXA1 expression levels were statistically more abundant in GBMs than in other histology (p < 1e-2, Figure 1B). In addition, due to the genetic and clinical differences between IDH-mutated gliomas and IDH wild-type gliomas, we explored the role ANXA1 played in gliomas with different IDH statuses. The ANXA1 expression was highest in IDH wild-type and lowest in IDH mutation and 1p/19q co-deletion in LGGs (all p ≤ 5e-5, Figure 1C left), while ANXA1 expression was higher in the IDH wild-type than in IDH mutant gliomas in GBMs (p < 5e-11, Figure 1C right). There was a reduced expression of ANXA1 in glioma with IDH mutation based on LGGs and GBMs (all p < 5e-9, Figure 1D). It is well known that the MGMT promoter methylation status is a key biomarker indicating temozolomide (TMZ) chemotherapy sensitivity in gliomas. As a result, we found that patients without MGMT promoter methylation possessed a higher ANXA1 expression level in GBMs, suggesting that ANXA1 may play a resistance role in TMZ therapy of GBMs (p < 5e-3, Figure 1E). Notably, we also found that ANXA1 expression was higher in recurrent LGGs (Figure 1F). The aforementioned results are well validated in independent CGGA RNA-seq data (Figures 1G–L). Consistently, the immunohistochemistry (IHC) experiments of glioma patients (WHO II–IV grade) showed that ANXA1 was the highest in WHO IV patients and lowest in WHO II patients (all p < 0.05, Figures 1M–N). Taken together, these results suggest that the ANXA1 gene acts as an oncogene and may serve as a biomarker for disease progression in gliomas.
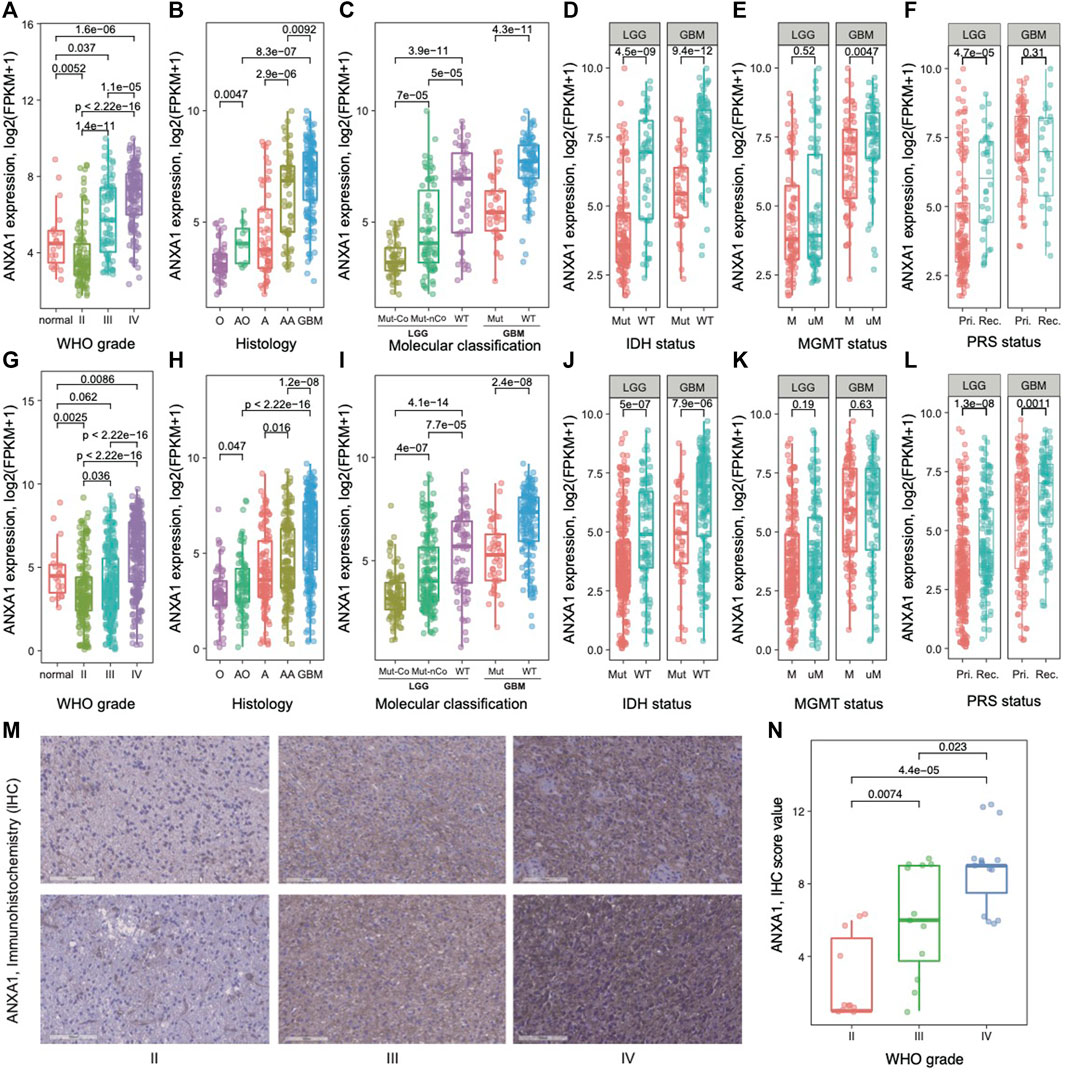
FIGURE 1. Gene expression pattern of ANXA1 in glioma. (A) and (G) Normal brain and WHO II–IV; (B) and (H) histology; (C) and (I) 2016 WHO classification; (D) and (J) IDH mutation status in LGGs and GBMs; (E) and (K) MGMT promoter methylation status in LGGs and GBMs; (F) and (L) primary (Pri.)/recurrent (Rec.) status in LGGs and GBMs. (A–F) for Dataset 1 and (G–L) for Dataset 2. (M) Representative immunohistochemistry (IHC) staining of ANXA1 in different grades of gliomas. (N) Comparing ANXA1 expression in gliomas with WHO II–IV by Dot plots.
ANXA1 Clinicopathological Features of Glioma Specimens
To investigate the clinical value of ANXA1, we examined the association between gene expression of ANXA1 and clinical information, including primary/recurrent status, WHO grade, histology, age, gender, well-known molecular status, TCGA subtype, survival, and therapy information. The evaluation of the association between clinicopathological features and the ANXA1 gene was conducted for 1,018 glioma patients from a Chinese cohort. Gliomas in Dataset 1 were ordered by increasing ANXA1 expression (Figure 2A). Our results showed that primary gliomas and LGGs had lower levels of ANXA1 expression (all p < 0.01), suggesting that ANXA1 may play a positive role in malignant progression. Younger patients with glioma had lower expression of ANXA1 (p < 2.14e-10). Gender of patients is not associated with ANXA1 expression. With regard to genomic alterations, IDH mutation, 1p/19q co-deletion, and MGMT promoter methylation indicated lower ANXA1 expression (all p < 0.01). Gliomas with lower ANXA1 expression are more likely to belong to proneural (PN) and neural (NE) subtypes and have a good prognosis, while gliomas with high ANXA1 expression are more likely to belong to mesenchymal (MES) and classical (CL) subtypes and have poor survival (all p < 2.00e-16). Gliomas with chemotherapy and/or radiotherapy tend to have a high ANXA1 expression. The aforementioned results are well validated in independent CGGA RNA-seq data (Dataset 2, Figure 2B). These results indicate that ANXA1 is closely related to clinical behavior.
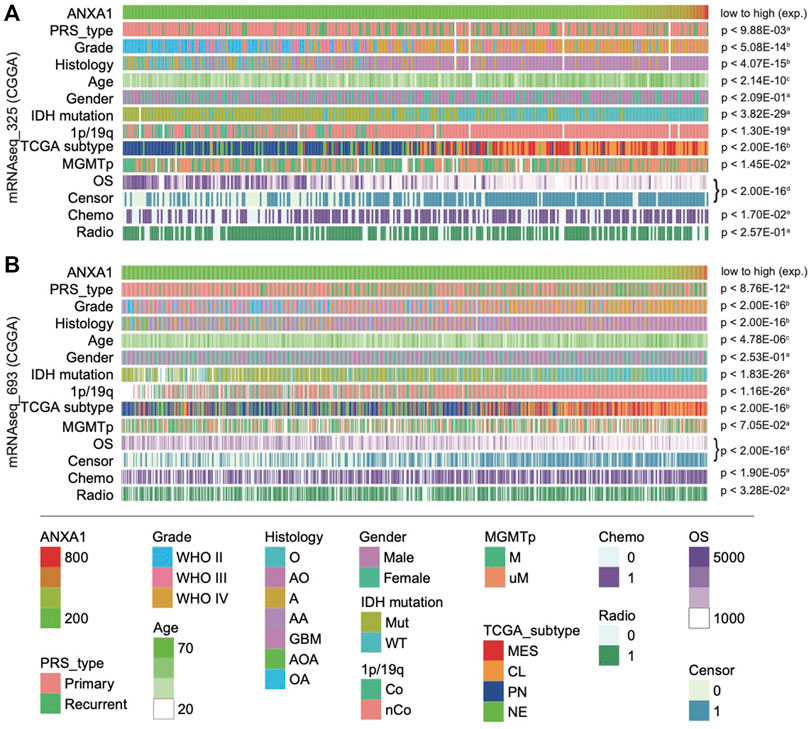
FIGURE 2. Landscape of clinical and molecular characteristics associated with ANXA1 expression in gliomas. Dataset 1 (A) and Dataset 1 (B) were arranged in an increasing order of ANXA1 expression. The relationship between ANXA1 expression and patients’ characteristics was evaluated: (a, Wilcoxon rank sum tests between two groups; b, one-way ANOVA between several groups; c, Spearman’s correlation tests between ANXA1 expression and continuous variables; d, Log-rank test for survival data).
Genomic Features of ANXA1 Expression Subtypes in Gliomas
To investigate the association between ANXA1 expression and genomic alterations, we analyzed the somatic mutations and copy number alteration data from cases with RNA-seq and WES data for this purpose. In total, 231 samples in the entire cohort harbored both RNA-seq and WES data (Dataset 3). Recapitulating previous studies, we confirmed frequency mutation in IDH, TP53, ATRX, CIC, NOTCH1, EGFR, and PDGFRA in this study. According to ANXA1 expression, gliomas were divided into G1 group (low expression, n = 116) and G2 group (high expression, n = 115). Approximately two-thirds of cases in the G1 group carried either an IDH1 mutation or IDH2 mutation.
In addition, cases in the G1 group were enriched in CIC and NOTCH1 mutation that have been well-described in oligodendroglia histology (Figure 3). In contrast, both TP53 and ATRX mutation in cases of the G2 group were 1.25 times higher than those in the G1 group. On the other hand, cases in the G2 group have a much higher mutation frequency of EGFR and PDGFRA than those in the G1 group. Notably, although previously not recognized, mutations in RYR2, IGSF10, BNC2, CADPS2, COL12A1, TRABD2A, and USP34 were significantly enriched in the G2 group. Moreover, we also explored the frequency of copy number alterations in G1 and G2 groups. For CN amplification, G1 had a higher alteration frequency in AHNAK and CD276, while G2 had a high alteration frequency in EGFR, PDGFRA, MET, and TTN. For CN loss, our results showed that deletion in CDKNA2A/B genes in interferon-α family and olfactory receptor family 4 subfamilies mainly occurred in G2 cases. Taken together, glioma subtypes classified by ANXA1 expression showed distinct mutation and CNA features.
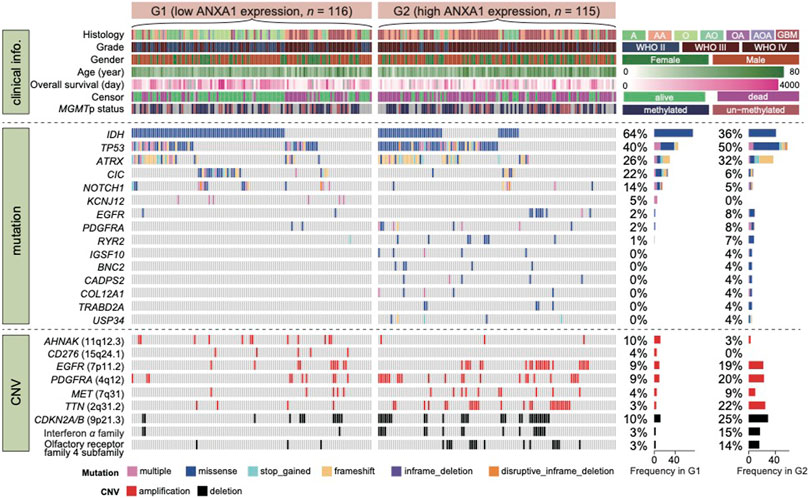
FIGURE 3. Mutational landscape of glioma with high and low expression of ANXA1. Dataset 3 was classified in two groups according to ANXA1 expression. Alterations in common driver and novel genes are displayed. Cases with both RNA-seq and WES data (n = 231) were enrolled for this analysis.
ANXA1 Correlates With Immune-Related Function and Cancer Hallmark in Glioma Ecosystem
ANXA1 expression was heterogeneous in different glioma subtypes. To explore ANXA1’s biological role in gliomas, RNA-seq data were collected. First, we obtained the genes that significantly correlated with ANXA1 expression (Pearson |R| > 0.6 and p < 0.05). Totally, 462 positive and 107 negative coexpressed genes were identified in Dataset 1. Then, we predicted the GO biological process and cancer hallmark of these coexpressed genes. GSEA showed that the coexpressed positive genes associated with ANXA1 were mainly involved in immune-related functions, such as interferon-gamma response and regulation of innate immune response, suggesting a regulatory role in the immune microenvironment in gliomas (Figure 4A). In particular, we found that these coexpressed genes also positively function in apoptosis, epithelial–mesenchymal transition, NF-κB signaling, etc., indicating that ANXA1 may play an important role in regulating cell fate in gliomas. In contrast, we found that coexpressed negative genes of ANXA1 participate in the neuro-basic functions in gliomas, such as synapse structure and organization, regulation of cellular component biogenesis, and neuro-projection morphogenesis and differentiation. Furthermore, GSEA verified that ANXA1 was associated with immune, apoptosis, and neuron function (Figure 4B). For genes in interferon-gamma response, we confirmed that they are associated with ANXA1 expression, and show the differential expressed patterns in glioma subtypes grouped by ANXA1 expression (Figure 4C). In summary, ANXA1 correlates with immune-related function and cancer hallmark and plays a critical role in the glioma ecosystem.
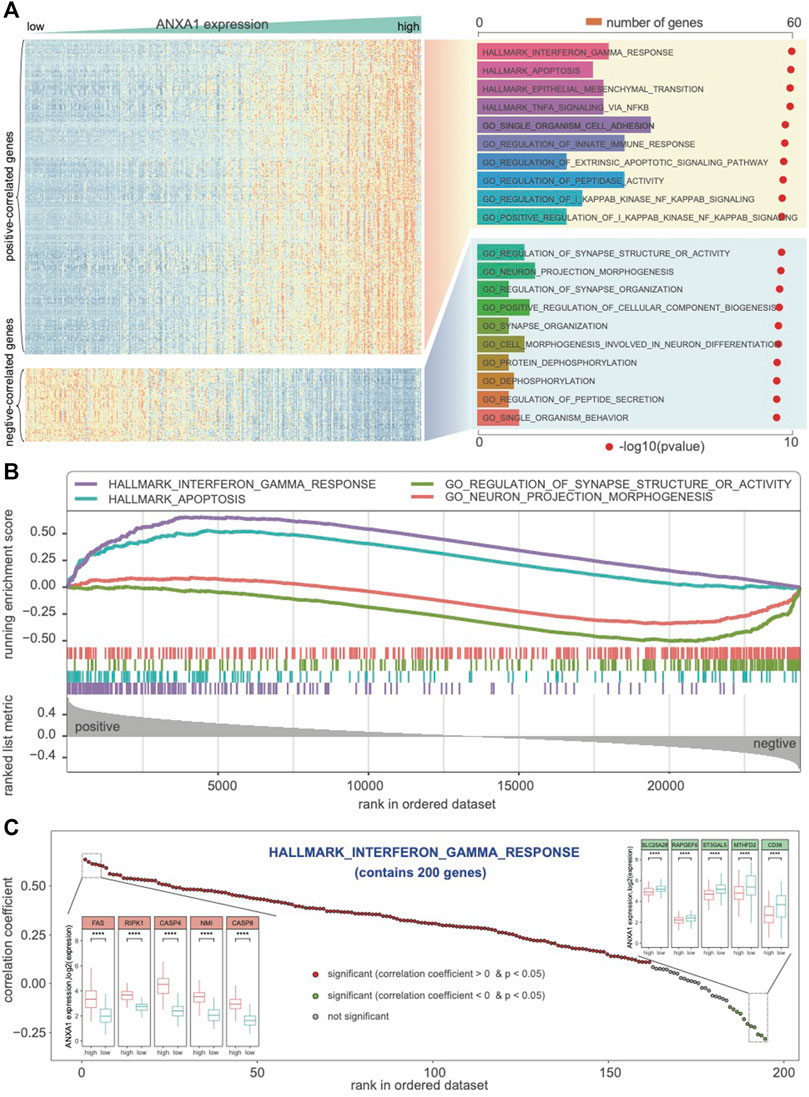
FIGURE 4. ANXA1 involved in the biological process and cancer hallmark. (A) Biological functions related to immune response, interferon-gamma response, and regulation of innate immune response were significantly positively correlated with ANXA1 expression (R > 0.6 and p < 0.05). (B) GSEA indicated that ANXA1 was significantly associated with immune phenotypes and neuro-associated function. (C) ANXA1 was significantly correlated with the genes in the hallmark of interferon-gamma response.
ANXA1 Is Highly Expressed in M2 Macrophages and MES Tumor Cells
As ANXA1 confers an extended immune status, we sought to further explore the ANXA1 regulatory immune role in the glioma ecosystem. We applied CIBERSORT software on Dataset 1 for estimating the relative abundances of 22 infiltrating immune cells (Newman et al., 2015). These cells mainly include lymphocytes, plasma, myeloid cells, and eosinophils. As a result, the majority of cell types in gliomas are myeloid cells and lymphocytes. In addition, we found that M2 macrophages are significantly enriched in gliomas with high ANXA1 expression (Figure 5A). We also validated that ANXA1 expression exhibited a significant positive correlation with the expression of M2-related genes (all R > 0.6 and p < 2.2e-16), including CD276, CLE7A, CTSA, FN1, IL4R, MMP9, MSR1, TGFB1, and VEGFA (Figure 5B), suggesting that ANXA1 acts a potential regulatory factor for M2 macrophages. In addition, we further collected anatomic transcriptional data in gliomas (Dataset 4), including leading edge (LE), infiltrating tumor (IT), cellular tumor (CT), pseudopalisading cells around necrosis (PAN), and microvascular proliferation (MVP) (Puchalski et al., 2018). Therefore, we found that ANXA1 was significantly under-expressed in CL enriched in the PN TCGA subtype and significantly overexpressed in MVP enriched in the MES TCGA subtype. This result is consistent with previous findings that ANXA1 was highly expressed in MES gliomas. To further explore ANXA1’s role in the tumor environment, we collected single-cell transcriptomic data in gliomas from a previous study (Neftel et al., 2019) (Dataset 5). We found that ANXA1 is highly expressed in macrophages, indicating a potential role for macrophages, especially M2 macrophages (Figure 5D). Moreover, we also noticed that tumor cells are highly expressed in the ANXA1 gene. In the single-cell level, our result showed that tumor cells with high expression of ANXA1 are in the MES cellular state (Figure 5E), indicating that ANXA1 could drive transitions to MES-like states in gliomas as reported in a previous study (Hara et al., 2021). In summary, we found that ANXA1 is highly expressed in M2 macrophages and MES tumor cells.
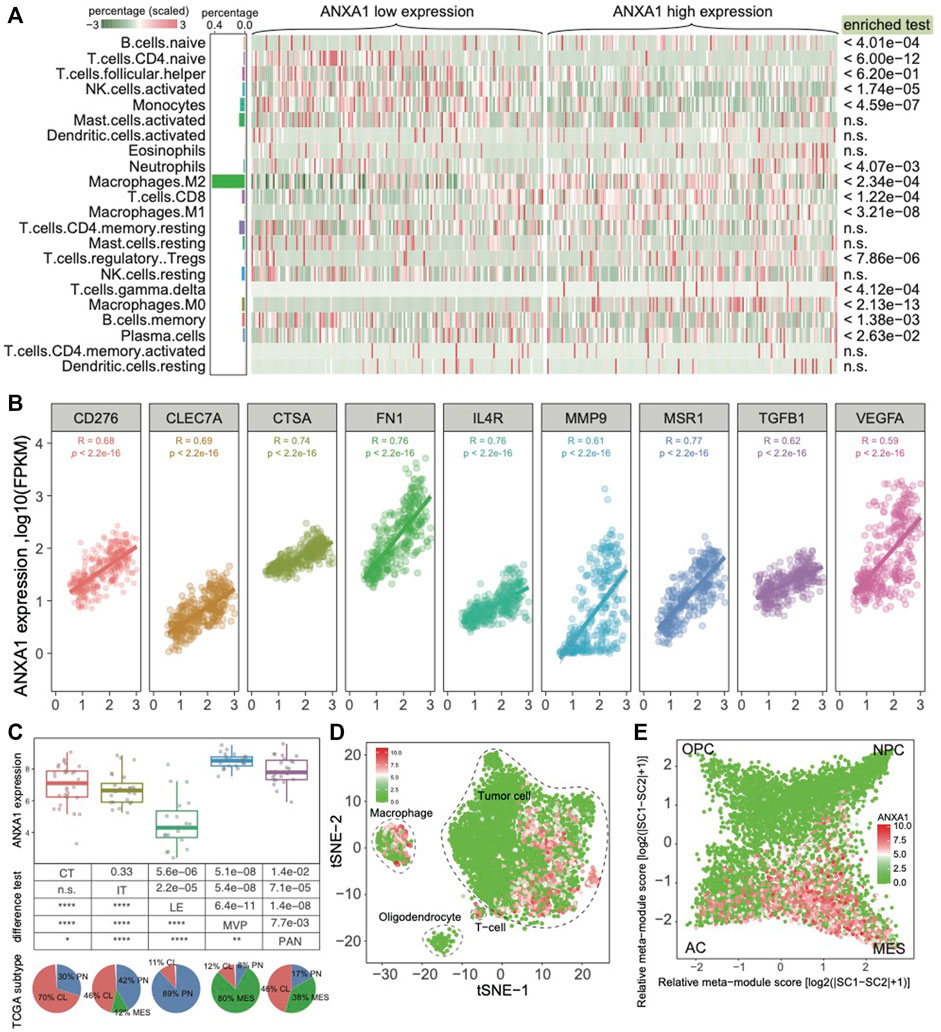
FIGURE 5. ANXA1 highly expressed in M2 macrophages and MES tumor cells. (A) Cell component of gliomas grouped by ANXA1 expression. (B) ANXA1 expression positively associated markers of M2 macrophages. (C) Expression pattern of ANXA1 in different histological regions of GBM blocks. (D) The single-cell data showed that ANXA1 was mainly expressed in tumor cells and macrophages. (E) Expression pattern of ANXA1 in the glioma cellular state.
ANXA1 Is a Prognostic Model for Predicting OS in Gliomas
To further explore the role of the ANXA1 gene in clinical application, we examined the prognostic value in all kinds of subtypes in gliomas. We used the quartile of ANXA1 expression to divide the samples into three groups and explore their prognostic differences (Dataset 1). Gliomas with high expression levels of ANXA1 showed a significant poor prognosis for overall survival (OS) in both gliomas and LGGs (log-rank test, p < 1.0e-4, Figures 6A,B). We also found that ANXA1 expression stratified patients with MGMT promoter methylation into distinct survival groups (log-rank test, p < 1.0e-4, Figure 6C), assuming that patients previously thought to be sensitive to TMZ could be stratified based on ANXA1 expression. Meanwhile, our results suggest that patients previously thought to be resistant to TMZ can be stratified based on ANXA1 expression, and patients with low ANXA1 expression could also have a good prognosis (log-rank test, p < 1.0e-4, Figure 6D). These analyses in Dataset 2 were conducted in parallel (log-rank test, all p < 1.0e-4, Figures 6E–H). Furthermore, we conducted the univariate and multivariable Cox regression analyses in Dataset 1, which implies that ANXA1 expression is an independent predictor for survival prognosis after adjusting for other clinicopathological factors (Table 2). These results suggest that ANXA1 expression is significantly correlated with patient outcome.
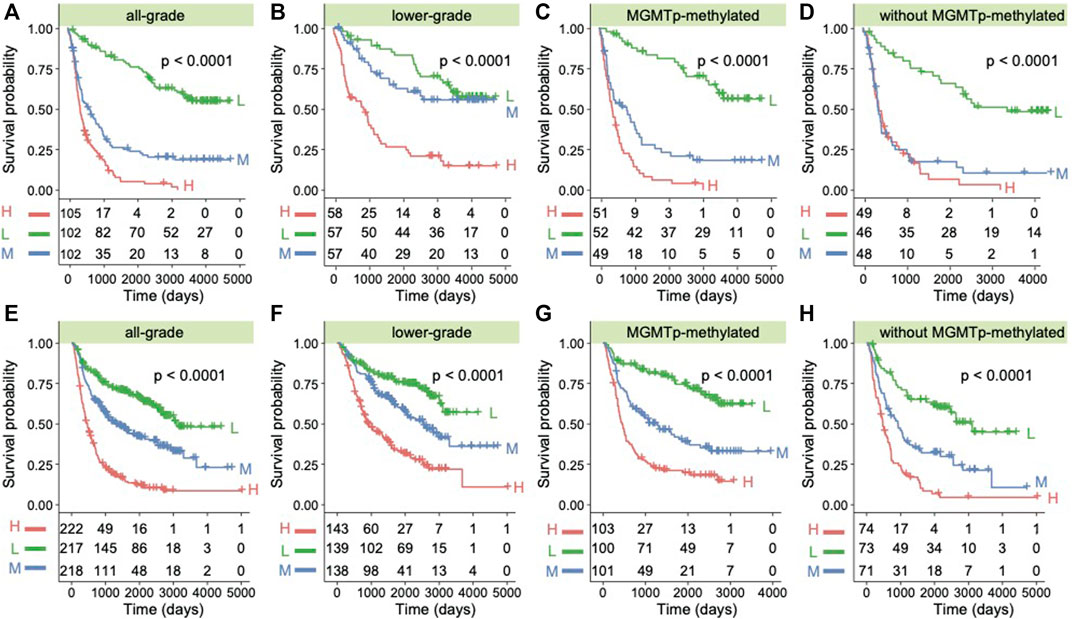
FIGURE 6. ANXA1 was a prognostic factor in glioma patients. (A) Kaplan–Meier survival analysis of all grades of glioma patients in Dataset 1 based on ANXA1 expression. (B) Kaplan–Meier survival analysis of LGG patients in Dataset 1 based on ANXA1 expression. (C) Kaplan–Meier survival analysis of patients with MGMT promoter methylation in Dataset 1 based on ANXA1 expression. (D) Kaplan–Meier survival analysis of patients without MGMT promoter methylation in Dataset 1 based on ANXA1 expression. (E) Kaplan–Meier survival analysis of all grades of glioma patients in Dataset 2 based on ANXA1 expression. (F) Kaplan–Meier survival analysis of LGG patients in Dataset 2 based on ANXA1 expression. (G) Kaplan–Meier survival analysis of patients with MGMT promoter methylation in Dataset 2 based on ANXA1 expression. (H) Kaplan–Meier survival analysis of patients without MGMT promoter methylation in Dataset 2 based on ANXA1 expression.
Discussion
Since the advanced therapeutic classical model including surgery followed by commitment radiotherapy and chemotherapy with temozolomide, the median survival time remains poor with 14–16 months for recent 10 years (Stupp et al., 2005). The discovery of the lymphatic system in the central nervous system proposed a new theoretical basis and reformed the past view regarding the immunotherapy for brain tumors (Louveau et al., 2015). Therefore, more effective treatment methods were needed to improve survival in these patients.
Annexin A1 (ANXA1), also known as lipocortin I, is a Ca2+-dependent phospholipid-binding protein (Rescher and Gerke, 2004). It not only plays a regulated role in the process of inflammation and immunity (Perretti and D'Acquisto, 2009) but also is deregulated in multiple cancers, where it may participate in tumor development and metastasis, as summarized in previous reports (Foo et al., 2019; Bai et al., 2020). To explore the exhaustive function of ANXA1 in gliomas, we integrated the bulk genomic and transcriptomic profiles and scRNA-seq data to comprehensively characterize the role of ANXA1 in gliomas. In this study, we revealed that ANXA1 was significantly upregulated in GBM patients, especially enriched in IDH wild-type gliomas, which was consistent with previous reports (Lin et al., 2021; Qiu et al., 2020). In addition, gliomas with chemotherapy and/or radiotherapy tend to have a high ANXA1 expression. From the somatic mutation and copy number alteration data, we confirmed that glioma-related mutations in TP53, ATRX, EGFR, PDGFRA, and others previously not recognized, including RYR2, IGSF10, BNC2, CADPS2, COL12A1, TRABD2A, and USP34, were significantly enriched in the higher ANXA1 expression group, while the deletion in CDKNA2A/B correlated with higher ANXA1 expression. As observed from previous reports of ANXA1 in different cancers (Bai et al., 2020), we also revealed that ANXA1 was mainly involved in immune-related functions, such as interferon-gamma response and regulation of innate immune response. Notably, in single-cell–level analysis, we validated that ANXA1 exhibited a significant positive correlation with the expression of M2 macrophages and was significantly overexpressed in MVP enriched in the MES TCGA subtype. Importantly, in our analysis from 1018 CGGA samples, higher ANXA1 expression predicted a poor prognosis in gliomas.
Despite increasing studies postulating the roles of ANXA1 in cancer, the consensus holds that ANXA1 in cancer cells might only be a partial functional mediator of tumorigenesis and metastasis, so it does not simply qualify as a tissue-specific mediator for predicting the occurrence of metastasis or cancer in general, due to its differential expression between different cancers. In gliomas, although there had been several reports confirming the overexpression of ANXA1 and that it may be a prognostic and immune microenvironmental marker, the exhaustive functions of ANXA1 in gliomas remain unclear. Consistent with previous results, we further validated that ANXA1 was mainly upregulated in MES gliomas and macrophages, especially overexpressed in the pseudopalisading cells around the necrosis and microvascular proliferation region which further precisely confirmed the location of ANXA1, indicating that ANXA1 could drive transitions to MES-like states in gliomas and plays an important role in M2 macrophages to induce the inhibitory glioma microenvironment. The details in moving the interaction of tumor cells and macrophages in gliomas will be our next study focus.
ANXA1 has also been shown to affect the sensitivity of cancer cells to various chemotherapeutic drugs. For instance, the silencing of ANXA1 with specific targeting compounds could increase cisplatin sensitivity to drug-resistant A549 cells (Wang et al., 2010). In our study, we also found that ANXA1 was highly expressed in recurrent GBMs, and patients with MGMT promoter methylation possessed a lower ANXA1 expression level in GBMs. As we know, the MGMT promoter methylated status has a confirmed association with TMZ therapy in GBMs; thus, we imply that ANXA1 not only functions as an important factor of the post-surgery recurrence of glioma but also results in the resistance of TMZ chemotherapy. In the far future, the combined strategy of TMZ and anti-ANXA1 may improve the prognosis of GBMs.
In our current study, we elaborated the functions of ANXA1 in gliomas from different datasets, including gene mutations, CNAs, and transcriptomic RNA sequences, especially at the single-cell transcriptomic level. Compared with the previous studies, we revealed that ANXA1 was also upregulated in M2 macrophages derived from the glioma immune microenvironment, indicating that ANXA1 may exert pro-tumor and inhibitory immune effects in both tumors intrinsically and the tumor microenvironment. Additionally, inhibiting ANXA1 would decrease post-surgery recurrence or relapse of GBMs and prolong patients’ survival times. In summary, these findings have proposed that ANXA1, a key gene in glioma, in moving the tumor cell and glioma inhibitory microenvironment, can be a promising direction for the therapeutic strategy in gliomas. The further mechanism and intervention treatment require extensive studies to validate in vivo. We hope that these results would provide a new insight into future diagnosis and therapy in gliomas.
Data Availability Statement
The datasets presented in this study can be found in online repositories. The names of the repository/repositories and accession number(s) can be found in the article/Supplementary material.
Ethics Statement
The studies involving human participants were reviewed and approved by the Ethics Committee of Capital Medical University. The patients/participants provided their written informed consent to participate in this study.
Author Contributions
ZZ, FW, RC, and FZ contributed to the study concept and design. WF, ZQ, FM, YZ, YC, and ZS contributed to acquisition of data. ZZ, WF, ZQ, CY, and FM contributed to the analysis and interpretation of data. WF and YZ performed the experiments. ZZ and WF contributed to drafting of the manuscript. FZ and FW revised the manuscript. All authors contributed to the article and approved the submitted version.
Funding
This work was supported by grants from the National Natural Science Foundation of China (Nos. 82002647, 81802994, 82002994, and 81903078), the Beijing Nova Program (Z201100006820118), and the Beijing Postdoctoral Foundation (2-1-1-500-01).
Conflict of Interest
The authors declare that the research was conducted in the absence of any commercial or financial relationships that could be construed as a potential conflict of interest.
Publisher’s Note
All claims expressed in this article are solely those of the authors and do not necessarily represent those of their affiliated organizations, or those of the publisher, the editors, and the reviewers. Any product that may be evaluated in this article, or claim that may be made by its manufacturer, is not guaranteed or endorsed by the publisher.
References
Bai, F., Zhang, P., Fu, Y., Chen, H., Zhang, M., Huang, Q., et al. (2020). Targeting ANXA1 Abrog ates Treg-Mediated Immune Suppression in Triple-Negative Breast Cancer. J. Immunother. Cancer 8 (1), e000169. doi:10.1136/jitc-2019-000169
Cancer Genome Atlas Research, N. Brat, D. J., Verhaak, R. G., Aldape, K. D., Yung, W. K., Salama, S. R., et al. (2015). Comprehensive, Integrative Genomic Analysis of Diffuse Lower-Grade Gliomas. N. Engl. J. Med. 372 (26), 2481–2498. Epub 2015/06/11. doi:10.1056/NEJMoa1402121
Feng, J., Lu, S. S., Xiao, T., Huang, W., Yi, H., Zhu, W., et al. (2020). ANXA1 Binds and Stabilizes EphA2 to Promote Nasopharyngeal Carcinoma Growth and Metastasis. Cancer Res. 80 (20), 4386–4398. Epub 2020/08/02. doi:10.1158/0008-5472.CAN-20-0560
Foo, S. L., Yap, G., Cui, J., and Lim, L. H. K. (2019). Annexin-A1 - A Blessing or a Curse in Cancer? Trends Mol. Med. 25 (4), 315–327. Epub 2019/03/16. doi:10.1016/j.molmed.2019.02.004
Hara, T., Chanoch-Myers, R., Mathewson, N. D., Myskiw, C., Atta, L., Bussema, L., et al. (2021). Interactions between Cancer Cells and Immune Cells Drive Transitions to Mesenchymal-like States in Glioblastoma. Cancer Cell 39 (6), 779–792. e11. doi:10.1016/j.ccell.2021.05.002
Hu, H., Mu, Q., Bao, Z., Chen, Y., Liu, Y., Chen, J., et al. (2018). Mutational Landscape of Secondary Glioblastoma Guides MET-Targeted Trial in Brain Tumor. Cell 175 (6), 1665–1678. doi:10.1016/j.cell.2018.09.038
Jiang, T., Mao, Y., Ma, W., Mao, Q., You, Y., Yang, X., et al. (2016). CGCG Clinical Practice Guidelines for the Management of Adult Diffuse Gliomas. Cancer Lett. 375 (2), 263–273. Epub 2016/03/12. doi:10.1016/j.canlet.2016.01.024
Jiang, T., Nam, D. H., Ram, Z., Poon, W. S., Wang, J., Boldbaatar, D., et al. (2021). Clinical Practice Guidelines for the Management of Adult Diffuse Gliomas. Cancer Lett. 499, 60–72. Epub 2020/11/10. doi:10.1016/j.canlet.2020.10.050
Li, H., and Durbin, R. (2009). Fast and Accurate Short Read Alignment with Burrows-Wheeler Transform. Bioinformatics 25 (14), 1754–1760. Epub 2009/05/20. doi:10.1093/bioinformatics/btp324
Li, H., Handsaker, B., Wysoker, A., Fennell, T., Ruan, J., Homer, N., et al. (2009). The Sequence Alignment/Map Format and SAMtools. Bioinformatics 25 (16), 2078–2079. Epub 2009/06/10. doi:10.1093/bioinformatics/btp352
Lin, Z., Wen, M., Yu, E., Lin, X., Wang, H., Chen, J., et al. (2021). ANXA1 as a Prognostic and Immune Microenvironmental Marker for Gliomas Based on Transcriptomic Analysis and Experimental Validation. Front Cel Dev Biol 9, 659080. Epub 2021/08/24. doi:10.3389/fcell.2021.659080
Louis, D. N., Perry, A., Reifenberger, G., von Deimling, A., Figarella-Branger, D., Cavenee, W. K., et al. (2016). The 2016 World Health Organization Classification of Tumors of the Central Nervous System: a Summary. Acta Neuropathol. 131 (6), 803–820. Epub 2016/05/10. doi:10.1007/s00401-016-1545-1
Louveau, A., Smirnov, I., Keyes, T. J., Eccles, J. D., Rouhani, S. J., Peske, J. D., et al. (2015). Structural and Functional Features of central Nervous System Lymphatic Vessels. Nature 523 (7560), 337–341. Epub 2015/06/02. doi:10.1038/nature14432
Neftel, C., Laffy, J., Filbin, M. G., Hara, T., Shore, M. E., Rahme, G. J., et al. (2019). An Integrative Model of Cellular States, Plasticity, and Genetics for Glioblastoma. Cell 178 (4), 835–849. e21. doi:10.1016/j.cell.2019.06.024
Newman, A. M., Liu, C. L., Green, M. R., Gentles, A. J., Feng, W., Xu, Y., et al. (2015). Robust Enumeration of Cell Subsets from Tissue Expression Profiles. Nat. Methods 12 (5), 453–457. Epub 2015/03/31. doi:10.1038/nmeth.3337
Perretti, M., and D'Acquisto, F. (2009). Annexin A1 and Glucocorticoids as Effectors of the Resolution of Inflammation. Nat. Rev. Immunol. 9 (1), 62–70. doi:10.1038/nri2470
Puchalski, R. B., Shah, N., Miller, J., Dalley, R., Nomura, S. R., Yoon, J. G., et al. (2018). An Anatomic Transcriptional Atlas of Human Glioblastoma. Science 360 (6389), 660–663. Epub 2018/05/12. doi:10.1126/science.aaf2666
Qiu, H., Li, Y., Cheng, S., Li, J., He, C., and Li, J. (2020). A Prognostic Microenvironment-Related Immune Signature ESTIMATE (PROMISE Model) Predicts Overall Survival of Patients with Glioma. Front. Oncol. 10, 580263. doi:10.3389/fonc.2020.580263
Rescher, U., and Gerke, V. (2004). Annexins--unique Membrane Binding Proteins with Diverse Functions. J. Cel Sci 117 (Pt 13), 2631–2639. PubMed PMID: 15169834.
Stupp, R., Mason, W. P., van den Bent, M. J., Weller, M., Fisher, B., Taphoorn, M. J., et al. (2005). Radiotherapy Plus Concomitant and Adjuvant Temozolomide for Glioblastoma. N. Engl. J. Med. 352 (10), 987–996. Epub 2005/03/11. doi:10.1056/NEJMoa043330
Subramanian, A., Tamayo, P., Mootha, V. K., Mukherjee, S., Ebert, B. L., Gillette, M. A., et al. (2005). Gene Set Enrichment Analysis: a Knowledge-Based Approach for Interpreting Genome-wide Expression Profiles. Proc. Natl. Acad. Sci. U S A. 102 (43), 15545–15550. Epub 2005/10/04. doi:10.1073/pnas.0506580102
Talevich, E., Shain, A. H., Botton, T., and Bastian, B. C. (2016). CNVkit: Genome-wide Copy Number Detection and Visualization from Targeted DNA Sequencing. Plos Comput. Biol. 12 (4), e1004873. Epub 2016/04/23. doi:10.1371/journal.pcbi
Verhaak, R. G., Hoadley, K. A., Purdom, E., Wang, V., Qi, Y., Wilkerson, M. D., et al. (2010). Integrated Genomic Analysis Identifies Clinically Relevant Subtypes of Glioblastoma Characterized by Abnormalities in PDGFRA, IDH1, EGFR, and NF1. Cancer Cell 17 (1), 98–110. Epub 2010/02/05. doi:10.1016/j.ccr.2009.12.020
Wang, L. P., Bi, J., Yao, C., Xu, X. D., Li, X. X., Wang, S. M., et al. (2010). Annexin A1 Expression and its Prognostic Significance in Human Breast Cancer. Neoplasma 57 (3), 253–259.
Wang, Q., Hu, B., Hu, X., Kim, H., Squatrito, M., Scarpace, L., et al. (2017). Tumor Evolution of Glioma-Intrinsic Gene Expression Subtypes Associates with Immunological Changes in the Microenvironment. Cancer Cell 32 (1), 42–56. e6. Epub 2017/07/12. doi:10.1016/j.ccell.2017.06.003
Xiong, W., Zhang, B., Yu, H., Zhu, L., Yi, L., and Jin, X. (2021). RRM2 Regulates Sensitivity to Sunitinib and PD-1 Blockade in Renal Cancer by Stabilizing ANXA1 and Activating the AKT Pathway. Adv. Sci. (Weinh). 2021; 8 (18): e2100881. doi:10.1002/advs.202100881
Yu, G., Wang, L. G., Han, Y., and He, Q. Y. (2012). clusterProfiler: an R Package for Comparing Biological Themes Among Gene Clusters. OMICS 16 (5), 284–287. Epub 2012/03/30. doi:10.1089/omi.2011.0118
Keywords: glioma, clinical behaviors, immune, macrophage, mesenchymal
Citation: Qian Z, Fan W, Meng F, Sun Z, Li G, Zhai Y, Chang Y, Yang C, Zeng F, Chai R, Wu F and Zhao Z (2021) Molecular Characterization and Clinical Relevance of ANXA1 in Gliomas via 1,018 Chinese Cohort Patients. Front. Cell Dev. Biol. 9:777182. doi: 10.3389/fcell.2021.777182
Received: 15 September 2021; Accepted: 04 November 2021;
Published: 29 November 2021.
Edited by:
Chunjie Jiang, University of Pennsylvania, United StatesReviewed by:
Liang Zhu, Sparx Therapeutics, United StatesWei Jiang, Nanjing University of Aeronautics and Astronautics, China
Tingfang Chen, University of Pennsylvania, United States
Copyright © 2021 Qian, Fan, Meng, Sun, Li, Zhai, Chang, Yang, Zeng, Chai, Wu and Zhao. This is an open-access article distributed under the terms of the Creative Commons Attribution License (CC BY). The use, distribution or reproduction in other forums is permitted, provided the original author(s) and the copyright owner(s) are credited and that the original publication in this journal is cited, in accordance with accepted academic practice. No use, distribution or reproduction is permitted which does not comply with these terms.
*Correspondence: Zheng Zhao, emhhb3poZW5nMDUwM0BjY211LmVkdS5jbg==; Fan Wu, d3VmYW4wNTEwMjg0QDE2My5jb20=; Ruichao Chai, Y2hhaXJ1aWNoYW9fZ2xpYUAxNjMuY29t; Fan Zeng, emVuZ2ZhbmpveWNlQHNpbmEuY29t
†These authors have contributed equally to this work and share first authorship
 Zenghui Qian
 Wenhua Fan1,2†
 Guanzhang Li
 Fan Zeng
 Ruichao Chai
 Fan Wu
 Zheng Zhao