
94% of researchers rate our articles as excellent or good
Learn more about the work of our research integrity team to safeguard the quality of each article we publish.
Find out more
ORIGINAL RESEARCH article
Front. Cell Dev. Biol., 03 January 2022
Sec. Signaling
Volume 9 - 2021 | https://doi.org/10.3389/fcell.2021.774108
This article is part of the Research TopicThe Subcellular Architecture of Mitochondria in Driving Cellular ProcessesView all 8 articles
 Benjamín Cartes-Saavedra1,2
 Josefa Macuada1
 Daniel Lagos1
 Duxan Arancibia1
 María E. Andrés1
 Patrick Yu-Wai-Man3,4,5,6
 György Hajnóczky2
 Verónica Eisner1*
Autosomal Dominant Optic Atrophy (ADOA), a disease that causes blindness and other neurological disorders, is linked to OPA1 mutations. OPA1, dependent on its GTPase and GED domains, governs inner mitochondrial membrane (IMM) fusion and cristae organization, which are central to oxidative metabolism. Mitochondrial dynamics and IMM organization have also been implicated in Ca2+ homeostasis and signaling but the specific involvements of OPA1 in Ca2+ dynamics remain to be established. Here we studied the possible outcomes of OPA1 and its ADOA-linked mutations in Ca2+ homeostasis using rescue and overexpression strategies in Opa1-deficient and wild-type murine embryonic fibroblasts (MEFs), respectively and in human ADOA-derived fibroblasts. MEFs lacking Opa1 required less Ca2+ mobilization from the endoplasmic reticulum (ER) to induce a mitochondrial matrix [Ca2+] rise ([Ca2+]mito). This was associated with closer ER-mitochondria contacts and no significant changes in the mitochondrial calcium uniporter complex. Patient cells carrying OPA1 GTPase or GED domain mutations also exhibited altered Ca2+ homeostasis, and the mutations associated with lower OPA1 levels displayed closer ER-mitochondria gaps. Furthermore, in Opa1−/− MEF background, we found that acute expression of OPA1 GTPase mutants but no GED mutants, partially restored cytosolic [Ca2+] ([Ca2+]cyto) needed for a prompt [Ca2+]mito rise. Finally, OPA1 mutants’ overexpression in WT MEFs disrupted Ca2+ homeostasis, partially recapitulating the observations in ADOA patient cells. Thus, OPA1 modulates functional ER-mitochondria coupling likely through the OPA1 GED domain in Opa1−/− MEFs. However, the co-existence of WT and mutant forms of OPA1 in patients promotes an imbalance of Ca2+ homeostasis without a domain-specific effect, likely contributing to the overall ADOA progress.
Mitochondria are compartmentalized and dynamic organelles that undergo multiple membrane reshaping processes (Eisner et al., 2018). Mitochondria reshaping involves mitochondrial fusion, fission, and IMM folding. The GTPase protein, OPA1, is the master regulator of IMM reshaping; controlling IMM fusion, folding, cristae biogenesis, and cristae shape (Liu et al., 2009; Song et al., 2009; Varanita et al., 2015; Glytsou et al., 2016; Hu et al., 2020). Mitochondrial cristae host OXPHOS supercomplexes and support mitochondrial and cellular metabolism (Vogel et al., 2006; Cogliati et al., 2013). The multiple functions of OPA1 rely on several domains, which include the GTPase domain and the GTPase effector domain (GED) (Landes et al., 2010).
Ca2+ controls OXPHOS and in turn, ATP production by activating different dehydrogenases and supporting pyruvate supply inside the mitochondria (Denton, 1990; Hajnóczky et al., 1995; Jouaville et al., 1999). Ca2+ is principally stored at the Endoplasmic Reticulum (ER), and its release to the cytosol is mediated through the activation of the IP3 receptor (IP3R) or the Ryanodine receptor (Berridge, 2016). Mitochondria can physically interact with the ER through multiple protein tethers to facilitate the local Ca2+ transfer from the ER to mitochondria, and cytosolic Ca2+ (Ca2+cyto) clearance (Rizzuto et al., 1998; Csordás et al., 1999; Csordás et al., 2006). Mitochondrial Ca2+ (Ca2+mito) uptake is determined by: 1) the Voltage-dependent Anion Selective Channels (VDACs) and Mitochondrial Calcium Uniporter complex (mtCU), located at the outer mitochondrial membrane (OMM) and IMM, respectively; and 2) Δψm, which is the main component of the electrochemical gradient acting as the driving force (Gunter and Sheu, 2009; Rizzuto et al., 2012; Hajnóczky et al., 2014). In addition, mitochondrial morphology is a potential modulator of Ca2+mito homeostasis that needs further investigation (Szabadkai et al., 2004; Szabadkai et al., 2006; Kowaltowski et al., 2019).
Pathogenic mutations in OPA1 trigger Autosomal Dominant Optic Atrophy (ADOA, MIM#165500) which causes blindness due to Retinal Ganglion Cells (RGCs) death (Delettre et al., 2000; Olichon et al., 2003; Amati-Bonneau et al., 2008). OPA1 dysfunction induces IMM fusion abolition, IMM rearrangement, cristae shape disturbance and metabolic disruption (Song et al., 2009; Patten et al., 2014). The axons of mice RGCs expressing ADOA mutants, show drastic mitochondrial depletion, due to autophagosome accumulation at axonal hillocks in a AMPK-dependent manner (Zaninello et al., 2020).
The relevance of OPA1 in Ca2+ homeostasis has been described in the literature with many discrepancies between different groups. Knockdown of Opa1 in RGCs caused altered Ca2+cyto clearance upon ER Ca2+ (Ca2+ER) release and excitotoxicity, suggesting that OPA1 may have a role in Ca2+ homeostasis and disease progress (Dayanithi et al., 2010; Kushnareva et al., 2013). However, silencing of OPA1 in HeLa and H295R cell lines induced enhanced Ca2+mito uptake upon IP3R activation despite low Δψm and mitochondrial morphology changes (Fülöp et al., 2011). In contrast, another group showed that OPA1 knockdown in HeLa cells displayed diminished Ca2+mito uptake upon IP3R stimulation with serious defects on Ca2+mito retention capacity, associated with a decrease in cristae number (Kushnareva et al., 2013). In a different study, ADOA-derived fibroblasts from a family carrying the same OPA1 GTPase mutation showed an enhanced Ca2+mito uptake upon IP3R stimulation but with a wide variety of responses between patients (Fülöp et al., 2015). And, expression of ADOA-causing mutants in mice RGCs and nematode motorneurons, resulted in augmented Ca2+cyto levels (Zaninello et al., 2021). Yet, over 400 different pathogenic OPA1 variants have been described in the Leiden Open Variation Database, LOVD (Le Roux et al., 2019) or ClinVar Database (Landrum et al., 2018) which can affect different domains such as the GTPase and GED domain among others. Finally, it is clear that OPA1 loss alters Ca2+ homeostasis, but the mechanisms involved still remain elusive.
Ca2+ uptake across the IMM is mediated by the mtCU complex. The protein core of this highly regulated complex is composed of the mitochondrial Ca2+ uniporter (MCU), the essential MCU regulator (EMRE), and the dominant-negative MCU subunit (MCUb) (Baughman et al., 2011; De Stefani et al., 2011; Raffaello et al., 2013; Sancak et al., 2013). The MCU activity and Ca2+ threshold are controlled by the mitochondrial calcium uniporter proteins (MICU1/2/3) (Perocchi et al., 2010; Mallilankaraman et al., 2012; Csordás et al., 2013; Kamer et al., 2017; Patron et al., 2019). An interaction between OPA1 and the MCU-MICU1 complex has been recently described (Herkenne et al., 2020). Also, OPA1 interacts with the mitochondrial cristae and contact site organizing system (MICOS) complex and MICU1, suggesting a role for MICU1 on cristae junction regulation (Gottschalk et al., 2019; Tomar et al., 2019). These data suggest that the role of OPA1 on Ca2+ homeostasis may involve mechanisms beyond its fusion activity.
High-resolution imaging experiments have shown that cristae are dynamic (Kondadi et al., 2020) and they move throughout the mitochondria in an OPA1-dependent manner (Gottschalk et al., 2018). Cristae localized close to ER-mitochondria contacts decelerate upon IP3R stimulation probably to support ER-mitochondria Ca2+ transfer (Gottschalk et al., 2018), reinforcing the potential role of OPA1 on Ca2+mito signaling.
In this work, we studied the role of OPA1 and its disease causing mutations in Ca2+mito responses upon local or bulk Ca2+cyto signaling. We show that OPA1 is necessary to regulate ER-to-mitochondria Ca2+ transfer. We also demonstrate that OPA1 GTPase and GED, which are known to cause ADOA when pathogenic mutants are present, differentially alter Ca2+mito homeostasis, with the GED domain playing a key role in ER-to-mitochondria functional coupling. In addition, the coexistence of all studied mutant and wild-type (WT) forms of OPA1 indistinctly disrupts Ca2+ homeostasis, potentially contributing to ADOA disease progression.
To test the relevance of OPA1 in Ca2+ homeostasis, we first used MEFs in which the mitochondrial matrix-targeted Ca2+-sensitive protein, mtRCaMP was expressed to monitor the [Ca2+] mito simultaneously with [Ca2+] cyto tracked by a Ca2+ sensing dye, Fura2-AM. The cells were also transfected with the muscarinic type 3 receptor (M3R) to allow Carbachol (CCh)-induced [Ca2+] cyto transients through activation of IP3R-mediated Ca2+ mobilization from the ER (Figure 1A).
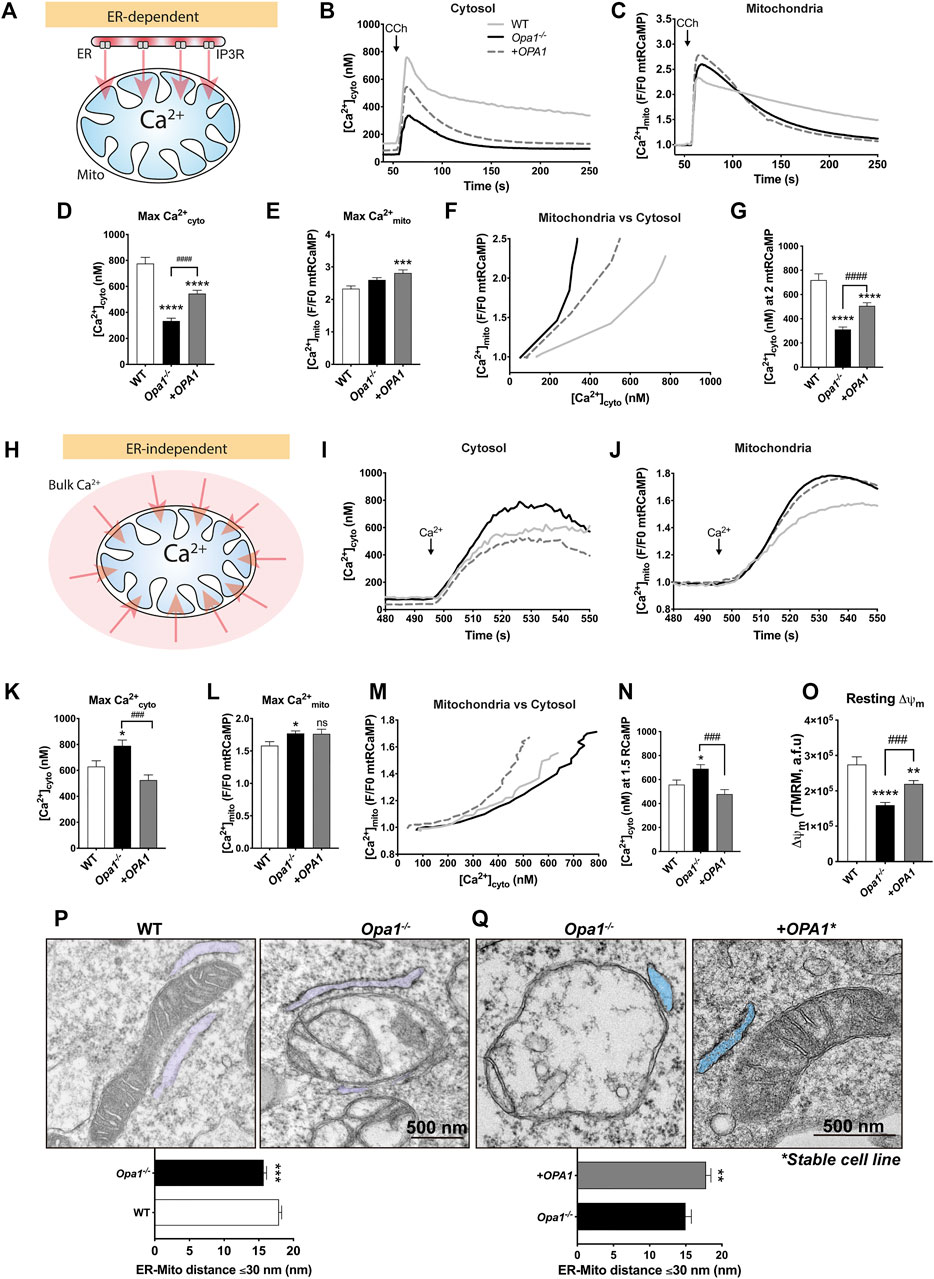
FIGURE 1. OPA1 is required for cytosolic and mitochondrial Ca2+ homeostasis. (A) ER-dependent mitochondrial Ca2+ uptake, schematic experimental design. WT, Opa1−/− or acute rescued Opa1−/− MEF Cells with OPA1 WT isoform 1, expressing mtRCaMP, and the muscarinic receptor 3 (M3R), were incubated with Fura2-AM (2 µM) for 20 min at room temperature and stimulated with 200 µM of Carbachol (CCh) to induce the release of Ca2+ from the ER to the cytosol via activation of IP3R (B) The graph shows mean traces of [Ca2+]cyto expressed in nM (WT, n = 3/64; preparations/cells; Opa1−/−, n = 3/87; Opa1−/− + OPA1 WT, n = 3/100) (C) Mean traces of [Ca2+]mito. (D,E) Maximal [Ca2+]cyto and [Ca2+]mito amplitude upon agonist stimulation. (F) The graph shows mean traces of [Ca2+]mito uptake vs IP3R-induced [Ca2+]cyto release. (G) [Ca2+]cyto at which WT, Opa1−/−, and +OPA1 WT shows 2 fold increase in [Ca2+]mito upon CCh stimulation. (H) ER-independent mitochondrial Ca2+ uptake, schematic experimental design. Prior to stimulation with CCh, cells were washed and kept in Ca2+-free medium. In order to completely deplete Ca2+ from the ER, we first induced the stimulation of IP3R by CCh 200 µM (60s), followed by 2 µM of Thapsigargin (Tg) (200s). Finally, SOCE was triggered by 1 mM CaCl2 addition. (I) The graph shows mean traces of [Ca2+]cyto after CaCl2 addition (WT, n = 3/78; preparations/cells; Opa1−/−, n = 3/84; Opa1−/− + OPA1 WT, n = 3/74). (J) [Ca2+]mito mean traces upon CaCl2 addition. (K,L) Maximal [Ca2+]cyto and [Ca2+]mito amplitude upon SOCE induction. (M) The graph shows mean traces of [Ca2+]mito uptake vs SOCE-linked [Ca2+]cyto. (N) [Ca2+]cyto at which WT, Opa1−/−, and +OPA1 WT shows 1.5 fold increase in [Ca2+]mito upon SOCE induction. (O) Cells were incubated with TMRM 20 nM and stimulated as described above. The bar graph shows resting Δψm calculated a s the subtraction between initial fluorescence and fluorescence after FCCP addition (WT, n = 3/63; preparations/cells; Opa1−/−, n = 3/105; Opa1−/− + OPA1 WT, n = 3/113). (P) Upper panel: TEM analysis of ER-mitochondria contacts of WT and Opa1−/− cells, representative images (ER is pseudo-colored in blue). Bottom panel: Quantification of ER-mitochondria distance ≤30 nm (WT, n = 3/103; preparations/mitochondria; Opa1−/−, n = 3/99). (Q) Upper panel: TEM analysis of ER-mitochondria contacts of Opa1−/− and Opa1−/− + OPA1 WT stable MEFs cells, representative images (ER is pseudo-colored in blue). Bottom panel: Quantification of ER-mitochondria distance ≤30 nm (Opa1−/−, n = 2/90; preparations/mitochondria; Opa1−/− + OPA1 WT, n = 2/100). Data are mean ± SEM. Error bar represent SEM. (*p < 0.05vs. WT, **p < 0.01 vs. WT, ***p < 0.001 vs. WT, ****p < 0.0001 vs. WT, ###p < 0.001 vs. Opa1−/− cells).
First, we explored the differences in the Ca2+ signaling between WT and Opa1−/− cells. Our data showed lower resting [Ca2+]cyto levels (50.2 ± 2.9 nM) in Opa1−/− cells compared with WT cells (127.8 ± 7.8 nM), and upon the acute rescue with the human OPA1 isoform 1 (OPA1), we found a partial restoration of the baseline (83.6 ± 5.2 nM, Supplementary Figure S1A). After CCh stimulation, we observed lower maximal [Ca2+]cyto amplitude in Opa1−/− cells (333.6 ± 21.4 nM) compared with WT cells (775.9 ± 47.6 nM). Moreover, the exogenous expression of OPA1 partially rescued the [Ca2+]cyto signal (544.6 ± 25.8 nM, Figures 1B,D).
The resting [Ca2+]mito was elevated in Opa1−/− cells. This was also detected by an alternative Ca2+mito sensor, mtCEPIA3. In addition, OPA1 rescue further increased resting [Ca2+]mito, suggesting that acute restoration of OPA1 to mitochondria is insufficient to lower basal [Ca2+]mito to WT levels (Supplementary Figures S1B–E). The baseline-normalized agonist-stimulated [Ca2+]mito transients showed no differences between WT and Opa1−/− cells, whereas the OPA1-rescued MEFs showed an increased [Ca2+]mito (Figures 1C,E). Interestingly, after reaching the maximum [Ca2+]mito amplitude, Opa1−/− cells exhibited faster decay kinetics than WT cells, however, this decay in the [Ca2+]mito is not rescued by acute expression of OPA1.
To further explore the correlation between [Ca2+]mito, and IP3-linked Ca2+ release, the two variables were plotted against each other (Figure 1F). The graph shows that Opa1−/− cells needed less [Ca2+]cyto to induce Ca2+mito uptake than WT cells, which can be partially rescued by the expression of OPA1 (Figure 1G). To test the possibility of mitochondrial Ca2+ uptake capacity saturation, we plotted the maximal [Ca2+]mito vs the maximal [Ca2+]cyto in single WT cells. As shown in Supplementary Figure S1F, there is a positive correlation between the [Ca2+]cyto peak and the [Ca2+]mito peak, confirming that the mitochondrial Ca2+ uptake or the Ca2+ sensor was not saturated in the range of the responses. Moreover, lower [Ca2+]cyto was needed to induce maximal [Ca2+]mito (Supplementary Figure 1G). In summary, the [Ca2+]cyto records indicate lesser ER Ca2+ content/release, whereas the [Ca2+]mito -[Ca2+]cyto relationship seems to support more effective decoding of the IP3R-mediated Ca2+ release by mitochondrial Ca2+ uptake in Opa1 deficient cells than that in the control cells.
To evaluate the ER Ca2+ content/release, in a Ca2+ free extracellular medium, we stimulated the cells with Thapsigargin (2 µM) to discharge ER Ca2+ by blocking the ER-Ca2+ re-uptake through the Sarcoendoplasmic Reticulum Calcium-ATPase (SERCA). To follow the Ca2+ that the mitochondria face upon Ca2+ER release, the cells were transfected with an outer mitochondrial membrane-targeted Ca2+ sensor (OMMRCaMP). Both [Ca2+]cyto and [Ca2+]OMM responses showed a decreased Ca2+ release from ER (Supplementary Figures S1H–K), suggesting that the free Ca2+ER content is attenuated in the Opa1−/− cells and this is not reverted by the acute expression of OPA1.
To further test the ER Ca2+ content, in a Ca2+ free extracellular medium, we first stimulated the cells with CCh to induce IP3R-mediated release of Ca2+ from the ER, and then, we added Thapsigargin to discharge the residual ER Ca2 (Supplementary Figure S1L). The [Ca2+]cyto responses confirmed that ER Ca2+ content is reduced in the Opa1−/− cells than that in the WT. Acute expression of OPA1 failed to rescue the ER Ca2+ content. (Supplementary Figures S1M,N).
During CCh stimulation, mostly local ER-to-mitochondria Ca2+ transfer mediates the [Ca2+]mito rise. To test if the [Ca2+]mito increase induced by a bulk [Ca2+]cyto increase is also altered in the Opa1-deficient cells, Store Operated Calcium Entry (SOCE) was induced by adding 1 mM CaCl2 after the ER Ca2+ depletion (Figure 1H; Supplementary Figure S1L). After SOCE induction, Opa1−/− cells showed an augmented [Ca2+]cyto transient amplitude (790.7 ± 44.2 nM) compared with WT cells (629.4 ± 44.5 nM), and this effect was completely rescued upon OPA1 expression (525.1 ± 40.0 nM, Figures 1I,K). The corresponding [Ca2+]mito responses were slightly but significantly augmented in Opa1−/− cells compared with WT but similar to that in the OPA1 rescued cells (Figures 1J,L). However, plotting [Ca2+]mito vs. [Ca2+]cyto revealed higher [Ca2+]cyto requirement to induce [Ca2+]mito in Opa1−/− cells than WT or rescued cells (Figures 1M,N; Supplementary Figure S1O). Thus, Opa1−/− cells have an advantage in the mitochondrial response to IP3R-mediated Ca2+ release from the ER but they have a disadvantage in the response to the SOCE-mediated global [Ca2+]cyto increase.
To test if some of the differences between WT, Opa1−/−, and rescued cells might result from a difference in the driving force for the mitochondrial Ca2+ uptake, we studied mitochondrial membrane potential (Δψm) by a potentiometric dye, TMRE. Consistent with Fülop et al (Fülöp et al., 2011), we found that Opa1−/− cells exhibited lower resting Δψm than WT cells, which was partially rescued by OPA1 (Figure 1O). This might be a reason for the relatively weak [Ca2+]mito response by the Opa1−/− cells to the enhanced SOCE.
We next tested if a difference in the mitochondrial mass or mtCU abundance/composition might explain the differential [Ca2+]mito responses in the Opa1−/− cells and the controls. We found that both, Opa1−/− and OPA1 rescued cells exhibit elevated levels of mitochondrial mass markers (Supplementary Figures S2A,B). We also found that Opa1−/− MEFs showed no changes in the main mtCU components after mitochondrial mass normalization (Supplementary Figures S2C,D).
Finally, we tested the ER-mitochondrial spatial relationship and mitochondrial ultrastructure as a potential source of the differences in the [Ca2+]mito responses by transmission electron microscopy (TEM). Our results showed IMM topology perturbation and cristae compartmentalization in the Opa1−/− MEFs, as previously described (Frezza et al., 2006; Olichon et al., 2007a). Furthermore, we found significantly closer ER-mitochondria gaps in Opa1−/− cells, compared with WT cells (Opa1−/−:15.71 ± 0.41 nm vs. WT: 17.92 ± 0.38 nm) (Figure 1P). To test the OPA1-specificity of our findings, we generated Opa1−/− + OPA1 WT stable MEF cells (Supplementary Figure S2E) and tested the ER-mitochondrial distance. We found increased ER-mitochondria distance in OPA1 rescued cells compared with Opa1−/− cells (Opa1−/− + OPA1: 17.81 ± 0.67 nm vs. Opa1−/−: 14.98 ± 0.72) (Figure 1Q).
Thus, we conclude that the lack of Opa1 causes multiple changes in the Ca2+cyto and Ca2+mito homeostasis including an attenuated ER Ca2+ storage and enhanced SOCE. Still, the Ca2+mito uptake response to IP3R-mediated Ca2+ release is enhanced, likely because of closer physical proximity between mitochondria and the ER.
We wanted to address if ADOA patient-derived fibroblasts carrying domain-specific heterozygous OPA1 mutations replicate the defects in Ca2+ homeostasis and ER-mitochondria distance Opa1−/− cells exhibited. Fibroblasts carrying specific mutations at the GTPase domain included OPA1 c.870+5G>A, with a deletion of the Exon8, and c.889C>T with an early stop codon at GTPase domain. Both patients presented a severe form of the disease, involving other symptoms besides optic nerve atrophy, known as ADOA+ (MIM# 125250). Also, we studied patients carrying specific mutations in GED: OPA1 c.2713C>T leading to a stop codon and loss of the GED domain, and c.2818+5G>A with a deletion of GED coding exon 27. These patients presented symptoms restricted to the eye or plain ADOA (MIM#165500) (Figure 2A). Western blot analysis revealed that patients’ cells carrying c.889C>T, c.870+5G>A, and c.2818+5G>A mutations, exhibited lower OPA1 protein levels compared with Control cells or the c.2713C>T mutant (Figure 2B; Supplementary Figure S3A).
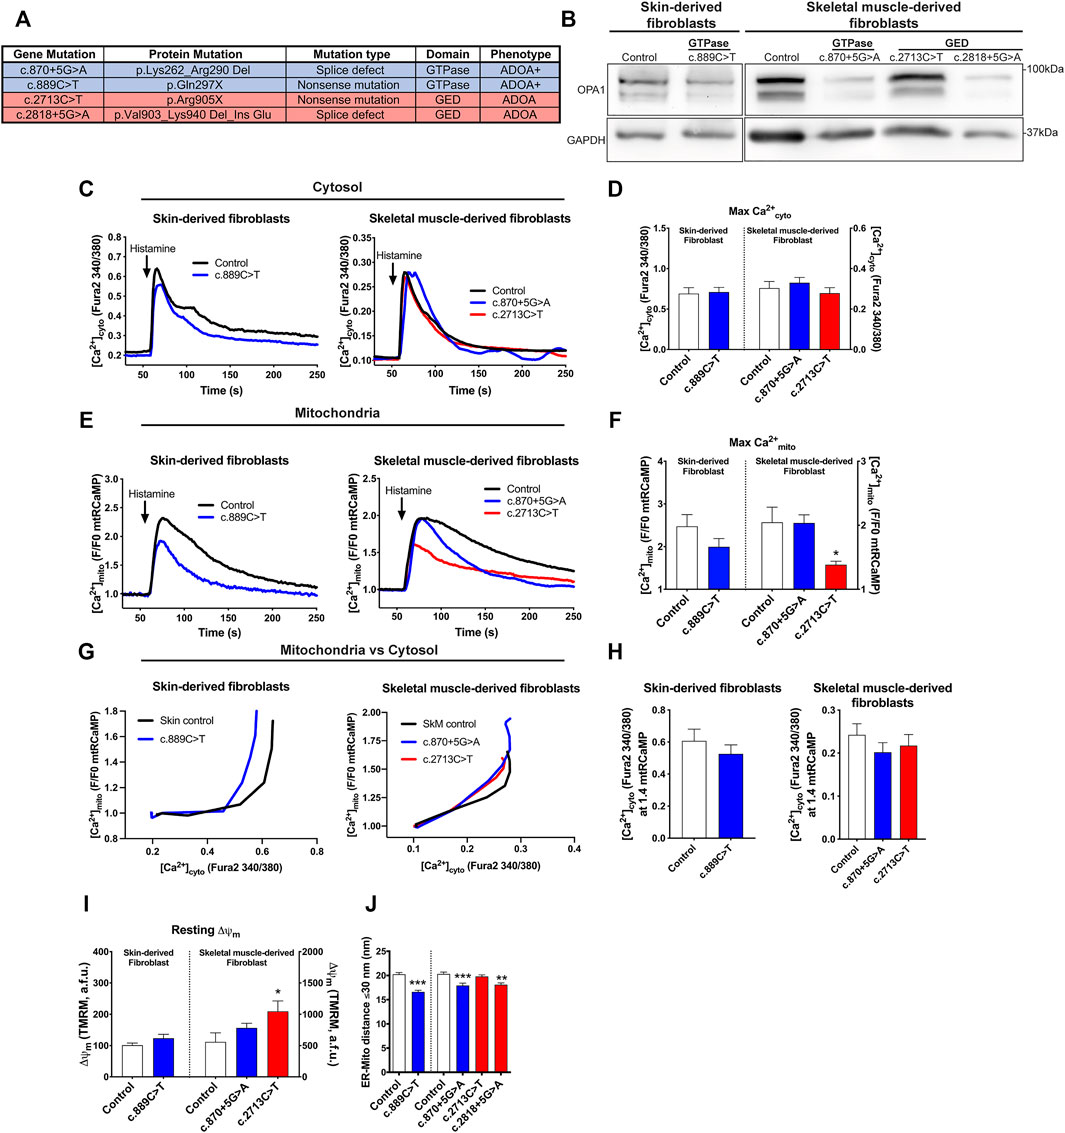
FIGURE 2. Mitochondrial Ca2+ homeostasis, mitochondrial membrane potential, and ER-mitochondria distance are altered in cells from ADOA patients carrying OPA1 domain-specific mutations. (A) OPA1 disease-related mutations, protein product prediction, type of mutation, and clinical ADOA phenotype, evaluated in this study. (B) Western blot analysis of OPA1 protein abundance of the skin or skeletal muscle-derived fibroblasts from ADOA patient’s cells. (C) Skin or skeletal muscle ADOA-derived fibroblast expressing mtRCaMP were loaded with Fura2-AM (2 μM) for 20 min at room temperature. To induce the release of Ca2+ through IP3R activation, Histamine 100 μM was used. The graph show [Ca2+]cyto expressed as Fura2-AM 340/380 mean ratio values (Skin Control, n = 3/12; preparations/cells; Skin OPA1c.889C>T, n = 3/18; SkM Control, n = 5/17, SkM OPA1c.870+5G>A, n = 7/21; SkM OPA1c.2713C>T, n = 4/19). (D) The bar chart shows maximal [Ca2+]cyto amplitude upon agonist stimulation. (E) Mean traces of Skin or skeletal muscle ADOA-derived fibroblast [Ca2+]mito upon Histamine stimulation. (F) The bar chart shows maximal [Ca2+]mito uptake upon agonist stimulation expressed in F/F0 to mtRCaMP. (G) The graph shows mean traces of [Ca2+]mito uptake vs IP3R-induced [Ca2+]cyto release. (H) [Ca2+]cyto at which WT, Opa1−/−, and +OPA1 WT shows 1.4 fold increase in [Ca2+]mito upon agonist stimulation. (I) Skin or skeletal muscle fibroblasts from ADOA-patients were loaded with TMRM 10 nM and Fura2-AM. Incubation and stimulation were performed as described above. At the end of the experiment, FCCP 10 µM was added to dissipate me membrane potential. The bar chart shows resting Δψm. (Skin Control, n = 3/25; preparations/cells; Skin OPA1c.889C>T, n = 3/18; SkM Control, n = 3/25, SkM OPA1c.870+5G>A, n = 3/25; SkM OPA1c.2713C>T, n = 3/28) (J) ER-mitochondria distance analysis for all mitochondria with ER contact (≤30 nm distance) (Skin control, n = 2/96; preparations/mitochondria), (OPA1c.889C>T, n = 2/101), (SkM control, n = 3/106), (OPA1c.870+5G>A, n = 3/120), (OPA1c.2713C>T, n = 3/123), (OPA1c.2818+5G>A, n = 2/92). p-values for Skin fibroblasts were calculated by Mann-Whitney U-test. p-values for SkM fibroblasts were calculated using Kruskal-Wallis test. Data are mean ± SEM. Error bar represent SEM. *p < 0.05, **p < 0.01, ***p < 0.001 vs respective control condition The blue color is indicative of GTPase mutants and the red color for GED mutants.
To evaluate intracellular Ca2+ signaling, we first measured resting [Ca2+]. Our results showed that patients’ cells have unaltered resting [Ca2+]cyto (Figures 2C,D; Supplementary Figure S3B). Analysis of Ca2+mito showed no differences in [Ca2+]mito resting in patients’ cells carrying GTPase mutants. However, the GED mutant c.2713C>T showed elevated resting [Ca2+]mito compared with control patient cells (Supplementary Figure S3C).
Then, we used histamine as an agonist to induce Ca2+ release from the ER through activation of the IP3R. Data in Figures 2C,D show that the patients’ cells displayed comparable maximal [Ca2+]cyto transient amplitude than control individuals. Cells carrying GTPase mutations showed no significant changes in [Ca2+]mito rise; however, cells carrying the GED mutant c.2713C>T displayed lower [Ca2+]mito increase compared with control cells (Figures 2E,F). [Ca2+]mito vs.[Ca2+]cyto chart showed that all the ADOA patient’s cells had a leftward shift tendency in this relationship compared to control cells (Figures 2G,H; Supplementary Figure S3D).
Next, we evaluated the resting Δψm in ADOA-derived cells. Fibroblast carrying GTPase mutants showed no significant changes, but GED mutant c.2713C>T exhibited a higher resting Δψm compared with control cells, which may be a factor in the elevated resting [Ca2+]mito levels and therefore, reduced [Ca2+]mito transients amplitude (Figure 2I).
Finally, we tested the distance between the ER and the mitochondria. EM analysis of ADOA-derived fibroblasts revealed that cells carrying the GTPase mutants c.889C>T, c.870+5G>A and the GED mutant c.2818+5G>A exhibited significantly closer ER-mitochondria apposition, compared with control cells (Skin Control: 20.24 ± 0.35 nm, OPA1 c.889C>T 16.6 ± 0.35 nm, SkM Control: 20.3 ± 0.39 nm, OPA1 c.870+5G>A 17.93 ± 0.49 nm, OPA1 c.2818+5G>A 18.09 ± 0.38 nm). Yet, we found no differences between control and GED mutant c.2713C>T carrying cells (Figure 2J; Supplementary Figure S3E). Strikingly, all the samples that exhibited closer ER-mitochondria contacts also displayed lower OPA1 protein levels (Figure 2B).
In summary, ADOA-derived fibroblasts showed no defects on [Ca2+]cyto transients unlike Opa1−/− cells. However, we found that all the studied mutants needed lesser Ca2+cyto to trigger a Ca2+mito rise, consistent with the observations in Opa1−/− cells. Interestingly, the patients’ cells showed a correlation between OPA1 protein levels and ER-mitochondria distance. Thus, despite the distinct severities of ADOA disease, caused by GTPase and GED mutants, both kinds of aberrant proteins lead to similar Ca2+ homeostasis dysregulation.
Given that patients’ cells might carry genetic or environmental adaptations, we next studied the domain-specific effects of OPA1 mutants in an Opa1−/− background. For this, we generated ADOA-causing OPA1 GTPase and GED domain-specific mutants, matching the patients’ genotype (Supplementary Figure S4A). We observed that different mutants show distinct protein levels, consistent with our observation in the patients’ cells (Figure 2A). Particularly, mutants carrying splicing defects, such as OPA1 c.870+5G>A and c.2818+5G>A, display lower protein levels than WT OPA1, suggesting defects in protein stability.
Our data showed that the acute expression of WT OPA1 rescues decreased resting [Ca2+]cyto levels shown by Opa1−/− cells; nevertheless, the expression of each ADOA-causing OPA1 mutants displayed resting [Ca2+]cyto levels comparable to Opa1−/− cells. These data suggest that OPA1 integrity is critical to support a mitochondrial role in the Ca2+cyto balance under non-stimulated conditions (Figures 3A,B; Supplementary Figure S4B). The analysis of Ca2+mito showed that all studied OPA1 GED mutants exhibited increased resting [Ca2+]mito (Supplementary Figures S4C–E). Consistently, we observed the same effect in the Opa1−/− cells and the OPA1 GED mutation c.2713C>T patient cells (Supplementary Figures S1A, S3C, respectively), suggesting that the GED region, and not the GTPase domain, may play a specific role in the regulation of [Ca2+]mito resting levels.
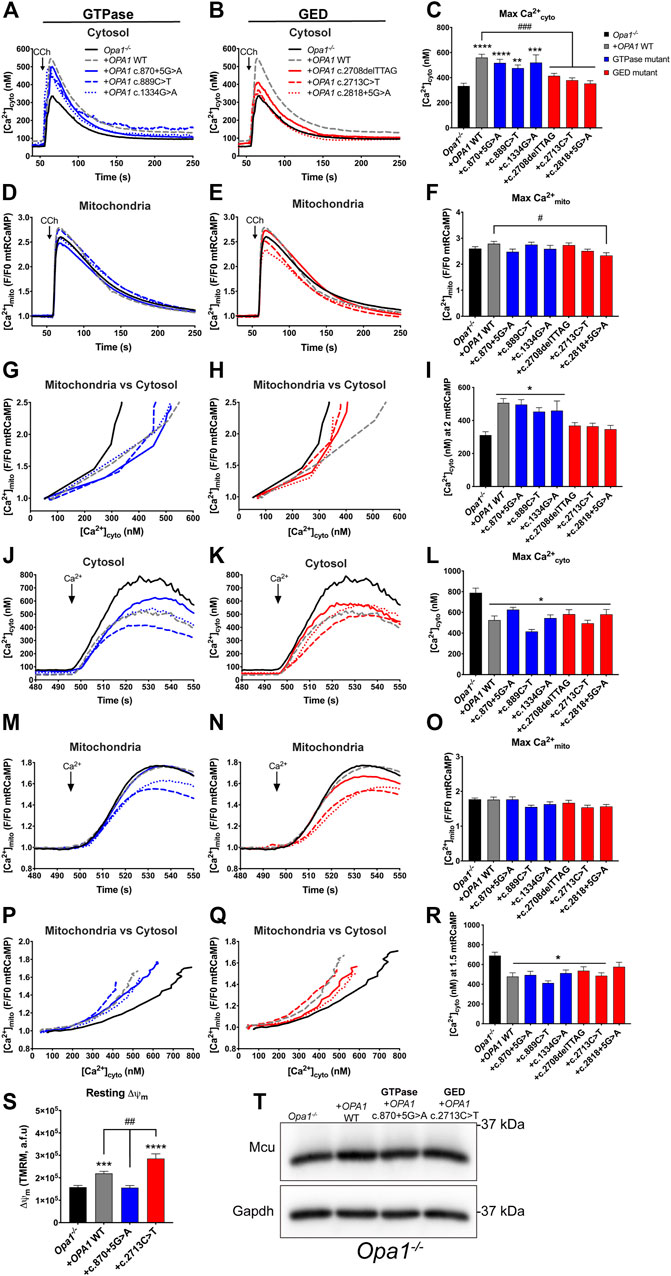
FIGURE 3. OPA1 GED domain is required effective ER-to-mitochondrial Ca2+ transfer. (A,B) ER-dependent Ca2+ release. Opa1−/− MEF cells expressing OPA1 mutants, mtRCaMP, and the muscarinic receptor 3 (M3R), were incubated with Fura2-AM as described, and stimulated with 200 µM of Carbachol (CCh) to induce the release of Ca2+ from the ER to the cytosol via activation of IP3R. Graph show mean traces of [Ca2+]cyto expressed in nM. (A) Shows mean traces of GTPase mutants and (B) shows mean traces of GED mutants of [Ca2+]cyto transients, respectively (Opa1−/− MEF, n = 3/87; Opa1−/− + OPA1 WT, n = 3/100; Opa1−/− + OPA1c.870+5G>A, n = 3/100; Opa1−/− + OPA1c.889C>T, n = 3/55; Opa1−/− + OPA1c.1334G>A, n = 3/35; Opa1−/− + OPA1c.2708delTTAG, n = 3/69; Opa1−/− + OPA1c.2713C>T, n = 3/109; Opa1−/− + OPA1c.2818+5G>A, n = 3/55). (C) The bar chart shows maximal [Ca2+]cyto amplitude upon agonist stimulation. (D,E) The graph shows mean traces of [Ca2+]mito uptake for OPA1 GTPase and GED mutants. (F) Maximal [Ca2+]mito uptake induced upon agonist stimulation. (G,H) OPA1 GTPase and GED mutants [Ca2+]mito uptake vs IP3R-induced [Ca2+]cyto upon agonist stimulation. (I) [Ca2+]cyto at which OPA1 GTPase and GED mutants shows 2 fold increase in [Ca2+]mito upon agonist stimulation. (J,K) ER-independent Ca2+ transients; SOCE. Opa1−/− MEF cells expressing hOPA1 mutants, mtRCaMP, and the muscarinic receptor 3 (M3R), were incubated with Fura2-AM as described above. Prior stimulation with CCh, cells were washed and kept in a Ca2+ free medium. To induce the stimulation of IP3R, cells were treated with CCh 200 µM, followed with 2 µM of Thapsigargin (Tg) to completely deplete the Ca2+ from the ER. Then, 1 mM of CaCl2 was added to induce the SOCE. Graph show mean traces of [Ca2+]cyto expressed in nM upon SOCE induction for GTPase and GED mutants (Opa1−/− MEF, n = 3/84; Opa1−/− + OPA1 WT, n = 3/74; Opa1−/− + OPA1c.870+5G>A, n = 3/50; Opa1−/− + OPA1c.889C>T, n = 3/35; Opa1−/− + OPA1c.1334G>A, n = 3/47; Opa1−/− + OPA1c.2708delTTAG, n = 3/38; Opa1−/− + OPA1c.2713C>T, n = 3/54; Opa1−/− + OPA1c.2818+5G>A, n = 3/36). (L) Maximal [Ca2+]cyto amplitude upon SOCE induction. (M,N) Mean traces of [Ca2+]mito uptake upon SOCE induction. (O) Maximal [Ca2+]mito uptake upon SOCE induction. (P,Q) The graphs show [Ca2+]mito uptake vs SOCE-linked [Ca2+]cyto. (R) [Ca2+]cyto at which OPA1 GTPase and GED mutants shows 1.5 fold increase in [Ca2+]mito upon SOCE induction. (S) Same cells described in A were incubated with TMRM 20 nM and stimulated as described above. The bar graph shows resting Δψm calculated as the subtraction between initial fluorescence and fluorescence after FCCP addition (Opa1−/− MEF, n = 3/105; Opa1−/− + OPA1 WT, n = 3/113; Opa1−/− + OPA1c.870+5G>A, n = 3/103; Opa1−/− + OPA1c.2713C>T, n = 3/73). (T) Western blot analysis of Mcu protein abundance upon acute expression of OPA1 GTPase or GED mutants in Opa1−/− MEF cells. Data are mean ± SEM. Error bars represent SEM. *p < 0.05, **p < 0.01, ***p < 0.001, ****p < 0.0001 vs. Opa1−/− condition. #p < 0.05, ##p < 0.01, ###p < 0.001, ####p < 0.0001 vs. Opa1−/− + OPA1 WT condition. The blue color is indicative of GTPase mutants and the red color for GED mutants.
Upon CCh stimulation, both WT and OPA1 GTPase mutants rescued the maximal [Ca2+]cyto rise; whereas, GED domain mutants showed no rescue (Figures 3A–C). In terms of maximal [Ca2+]mito transient amplitude triggered by CCh, neither the acute expression of WT OPA1 nor the OPA1 mutants, showed a significant difference compared to Opa1−/− cells (Figures 3D–F). This might be a consequence of a chronic absence of Opa1 or alternatively, more than one OPA1 isoform is needed to restore Ca2+mito homeostasis, as it has been demonstrated for mitochondrial network morphology (Del Dotto et al., 2017).
We next studied the correlation between ER-associated [Ca2+]mito and [Ca2+]cyto responses. Our data showed that as in Opa1−/− background, the expression of OPA1 GED mutants, displayed a leftward shift in [Ca2+]cyto needed to induce a [Ca2+]mito rise compared with WT or GTPase rescued conditions (Figures 3G–I). Moreover, the levels of [Ca2+]cyto needed to generate the maximal [Ca2+]mito were rescued by the OPA1 GTPase mutants, while OPA1 mutants lacking GED displayed only a mild rescue (Supplementary Figure S4F). Thus, our data suggest that Ca2+ transfer to the mitochondria from local Ca2+cyto is enhanced when the GED region or the entire protein is missing. However, this asseveration doesn’t totally match with the GTPase mutant c.889C>T, which expresses a truncated protein form due to a stop codon (Figure 2A) and showed a behavior comparable to the GTPase mutants rather than the GED mutants.
To test the OPA1 domain-specific effects on the Ca2+mito rise prompted by bulk Ca2+cyto increases, we turned to SOCE. Upon SOCE induction, the augmented [Ca2+]cyto transients of the Opa1−/− cells were restored by WT OPA1. All the mutants also displayed [Ca2+]cyto transients comparable with WT OPA1 (Figures 3J–L). However, no significant effect was observed on [Ca2+]mito upon SOCE induction in Opa1−/− or rescued cells (Figures 3M–O).
A two-variable chart was plotted to explore the role of bulk Ca2+cyto entry on ER-independent Ca2+mito uptake. The graphs show that upon [Ca2+]cyto increase, Opa1−/− cells exhibited a rightward shift in [Ca2+]cyto needed to induce [Ca2+]mito rise, compared with the GTPase or GED mutants (Figures 3P–R). Moreover, Opa1−/− mitochondria required 790.7 ± 44.2 nM of [Ca2+]cyto to reach the maximal [Ca2+]mito, and this was completely restored with the inclusion of either OPA1 or the mutants, requiring lower [Ca2+]cyto to reach the maximal [Ca2+]mito (Supplementary Figure S4G).
Next, we measured resting Δψm to test if the driving force of Ca2+ uptake is altered upon the expression of some of the OPA1 mutants. No change in resting Δψm was detected in the GTPase mutant c.870+5G>A (Figure 3S). We found the GED mutant c.2713C>T exhibited an augmented resting Δψm compared with OPA1 WT rescue (Figure 3S), as we observed in the patient cells harboring the same mutant (Figure 2I). Thus, although WT and GTPase OPA1 mutants can restore ER-to-mitochondrial Ca2+ transfer, this seems independent of the cation driving force evoked by Δψm. Finally, Mcu protein levels were unaltered by the acute expression of neither OPA1 GTPase nor GED mutants (Figure 3T).
Thus, OPA1 GED region plays a critical role in ER-mitochondrial Ca2+ transfer, and this effect is independent of resting Δψm, OPA1, or Mcu protein levels. Moreover, Ca2+mito uptake induced by bulk Ca2+cyto was restored by OPA1 or the mutants suggesting that the sole physical presence of the protein is sufficient to support this process, in a domain-specific independent manner.
Considering the heterozygosity of the ADOA patients carrying OPA1 mutations, we tested if the introduction of OPA1 mutants, in the presence of native Opa1 in the WT MEF background, disrupts normal Ca2+ homeostasis like what was observed in the patient cells.
Our results showed that acute expression of OPA1 mutants did not alter resting [Ca2+]cyto (Supplementary Figure S4H). Interestingly, the GTPase mutant c.1334G>A exhibited a high resting [Ca2+]mito when compared with WT OPA1 overexpression (Supplementary Figures S4I–K).
Upon CCh stimulation, we found a decreased maximal [Ca2+]cyto amplitude in the GTPase mutant c.1334G>A when is compared with WT OPA1 overexpression (Figures 4A–C). The same mutant exhibited an elevated maximal [Ca2+]mito transient amplitude upon agonist stimulation (Figures 4D–F). In addition, GED mutant c.2818+5G>A exhibited a reduced maximal [Ca2+]cyto amplitude after agonist stimulation compared to WT OPA1 overexpression (Figure 4C). Moreover, both GED mutants c.2713C>T and c.2818+5G>A displayed a reduced [Ca2+]mito (Figure 4F). The same reduction in [Ca2+]mito was observed in the ADOA patient’s cells carrying the GED mutant c.2713C>T.
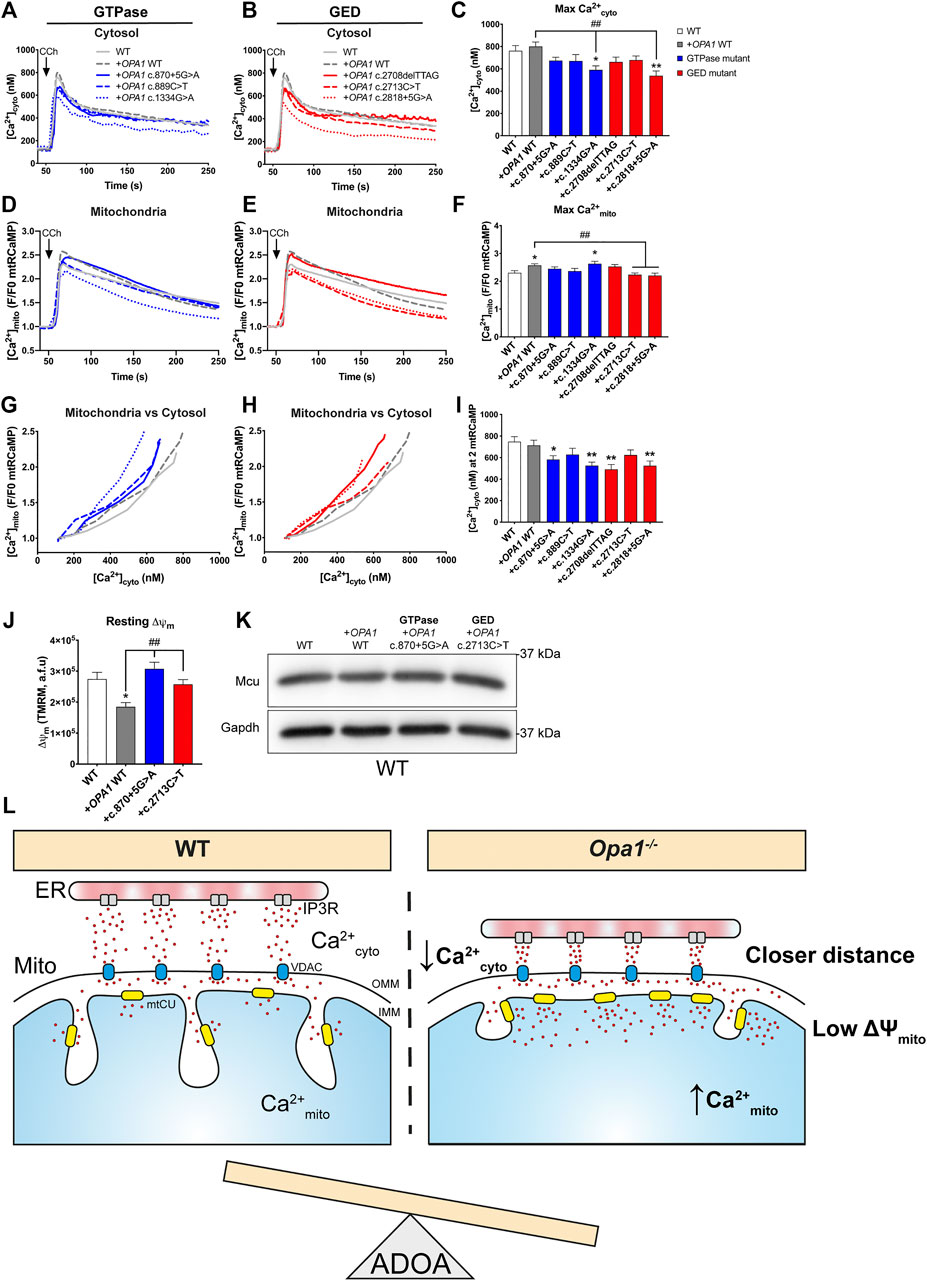
FIGURE 4. Overexpression of ADOA-causing OPA1 mutants impairs ER-to mitochondrial Ca2+ transfer. (A,B) WT MEF cells expressing OPA1 mutants, mtRCaMP, and the muscarinic receptor 3 (M3R), were incubated with Fura2-AM and stimulated with 200 µM of Carbachol (CCh) to induce the release of Ca2+ from the ER to the cytosol via activation of IP3R. Graph show mean traces of [Ca2+]cyto expressed in nM, in WT MEF expressing GTPase and (B) in GED mutants (WT MEF, n = 3/64; WT + OPA1 WT, n = 3/58; WT + OPA1c.870+5G>A, n = 3/49; WT + OPA1c.889C>T, n = 3/48; WT + OPA1c.1334G>A, n = 3/51; WT + OPA1c.2708delTTAG, n = 3/47; WT + OPA1c.2713C>T, n = 3/49; WT + OPA1c.2818+5G>A, n = 3/42) (C) Bar chart shows maximal [Ca2+]cyto amplitude upon agonist stimulation. (D,E) The graph shows mean traces of [Ca2+]mito uptake in OPA1 GTPase and GED mutants, expressing WT MEF cells. (F) Maximal [Ca2+]mito uptake induced upon agonist stimulation. (G,H) OPA1 GTPase and GED mutants [Ca2+]mito uptake vs IP3R-induced [Ca2+]cyto upon agonist stimulation. (I) [Ca2+]cyto at which OPA1 GTPase and GED mutants shows 2 fold increase in [Ca2+]mito. (J) The same cells described in A were incubated with TMRM 20 nM and stimulated as described by Carbachol. The bar graph shows resting Δψm calculated as the subtraction between initial fluorescence and fluorescence after FCCP addition (WT MEF, n = 3/63; WT + OPA1 WT, n = 3/117; WT + OPA1c.870+5G>A, n = 3/159; WT + OPA1c.2713C>T, n = 3/117; WT). (K) Western blot analysis of Mcu protein abundance upon acute expression of OPA1 GTPase or GED mutants in WT MEF cells. Data are mean ± SEM. Error bar represent SEM. *p < 0.05, **p < 0.01 vs. WT condition. #p < 0.05, ##p < 0.01 vs. WT + OPA1 WT condition. The blue color is indicative of GTPase mutants and the red color for GED mutants. (L) Working model. Cells lacking OPA1 exhibited closer ER-mitochondria contacts and a leftward shift in Ca2+cyto dependence compared to WT cells evoking a more efficient ER-to-mitochondrial Ca2+ transfer. OPA1 ADOA-causing mutants disrupt Ca2+ homeostasis inducing an OPA1 dominant-negative phenotype, probably contributing to disease progression.
Correlative study of [Ca2+]mito and [Ca2+]cyto transients showed that overexpression of OPA1 WT displayed no alteration in the [Ca2+]cyto needed to trigger a [Ca2+]mito rise. In contrast, the acute expression of most GTPase or GED mutants, prompted a leftward shift in [Ca2+]cyto needed to induce [Ca2+]mito rise upon agonist stimulation (Figures 4G–I). Consistently, as oppose to WT OPA1 overexpression, the inclusion of GTPase or GED mutants lowered the maximal [Ca2+]cyto needed to evoke maximal [Ca2+]mito (Supplementary Figure S4L).
Evaluation of Δψm revealed that acute overexpression of OPA1 WT decreased resting Δψm (Figure 4J). Yet, neither GTPase mutant c.870+5G>A nor GED mutant c.2713C>T overexpression altered resting Δψm in a WT MEF background. (Figure 4J). Finally, we found no differences in Mcu protein levels caused by WT or mutant OPA1 overexpression (Figure 4K).
Thus, acute expression of ADOA-causing OPA1 mutants in the presence of endogenous Opa1 causes a dominant-negative phenotype in ER-to-mitochondria Ca2+ transfer.
We showed here that cells with low levels of Opa1 exhibit closer ER-mitochondria apposition, likely resulting in a more efficient ER-to-mitochondria Ca2+ transfer. This occurs without changes in the mtCU components or mitochondrial mass, and despite the reduced resting Δψm presented by the Opa1-deficient cells. In an Opa1-null background, ADOA-causing mutants located in OPA1 GED region perturbed ER-dependent Ca2+cyto transients and Ca2+mito uptake. In WT background, OPA1 mutants evoke a dominant-negative phenotype independent of the domain affected by the specific mutation possibly, contributing to ADOA disease progression (Figure 4L; Supplementary Table S1).
In different cell types, the absence of OPA1 has shown diverse results. In cultured RGCs, the principal cells affected by OPA1 mutants causing DOA (Votruba et al., 1998), silencing of Opa1 augmented Ca2+cyto transients (Dayanithi et al., 2010; Kushnareva et al., 2013). Interestingly, RGCs expressing OPA1 ADOA-causing mutants, show elevated Ca2+cyto (Zaninello et al., 2021). However, proopiomelanocortin neurons devoid of Opa1 show unaltered Ca2+cyto transients, and reduced Ca2+mito responses (Gómez-Valadés et al., 2021). Finally, adult cardiomyocytes of Opa1+/− mice displayed lower [Ca2+]cyto amplitude (Chen et al., 2012; Le Page et al., 2016) or enhanced Ca2+mito uptake (Piquereau et al., 2012). These studies suggest that OPA1 affects intracellular Ca2+ homeostasis, possibly, in a cell-type specific manner.
Our data in Opa1−/− cells exhibited alterations in cytosolic, ER and mitochondrial Ca2+ homeostasis. Resting [Ca2+]cyto was reduced in Opa1−/−, which could be explained by a decreased influx or increased efflux of Ca2+. The former is unlikely because a higher influx was detected upon SOCE, whereas, the latter is not consistent with our Δψm data, which suggests lower ATP levels in these cells. Also, CCh-induced [Ca2+]cyto transient amplitude was decreased in Opa1−/− cells, caused by lower ER content, suggesting that chronic absence of Opa1 leads to an adaptation in ER Ca2+ homeostasis, that could involve IP3R or SERCA levels or activity alterations. Moreover, resting and maximal [Ca2+]mito was augmented despite low resting Δψm during local Ca2+ transfer. This observation is consistent with previous reports in OPA1 silenced intact HeLa and H295R cells using a genetically encoded Ca2+mito sensor (Fülöp et al., 2011). Conversely, another group reported OPA1 silencing decreases maximal [Ca2+]mito amplitude upon Histamine stimulation, using Rhod-2 as a Ca2+mito sensor in intact cells (Kushnareva et al., 2013). These opposite results can be attributed to the different technical approaches. The mitochondria-specific nature of [Ca2+]mito transients studied by genetic encoded Ca2+-sensitive proteins, provides strong pieces of evidence to confirm that both acute (Fülöp et al., 2011), and chronic absence of OPA1 studied in this work lead to augmented Ca2+mito uptake. Hence, our study strengths the idea of OPA1 as a key molecular modulator in ER-to-mitochondria Ca2+ transfer.
The reduced [Ca2+]cyto needed to induce a [Ca2+]mito rise shown by Opa1−/− cells likely reflects enhanced ER-to-mitochondria privileged communication, which might be caused by the increased proximity between both organelles. Yet, this was independent of resting mitochondrial Δψm and mtCU protein levels. RNA-seq data has shown that mtCU components expression levels were unaltered in Opa1 KO lymphocytes (Corrado et al., 2021). In addition, silencing of Micu1 increases resting matrix [Ca2+]mito (Mallilankaraman et al., 2012; Liu et al., 2016; Gottschalk et al., 2019), as we observe in Opa1−/− cells. Given that Opa1 can physically interact with Mcu-Micu1 complex (Tomar et al., 2019; Herkenne et al., 2020), it remains possible that the absence of Opa1 might alter Micu1 homo or heterodimerization with Micu2, which have been proposed to control Ca2+mito uptake threshold (Patron et al., 2014). Also, it has been suggested that loss of cristae junction can expose a population of mtCU that is not protected by the gatekeeper Micu1 in the cristae lumen (Gottschalk et al., 2019), this explanation could justify the increased resting a maximal Ca2+mito observed in the Opa1 KO cells. However, this explanation would not be consistent with a lack of leftward shift in the [Ca2+]mito rise during SOCE.
How does OPA1 influence ER-mitochondrial Ca2+ transfer? It has been shown that upon agonist stimulation, mitochondrial cristae and matrix modify their volume in HepG2 cells (Booth et al., 2016). Studies in HeLa cells proposed that OPA1 knockdown decelerates cristae membrane movements. Interestingly, upon IP3R activation, cristae stop their motion at the ER-mitochondria contact region, in an OPA1 independent manner (Gottschalk et al., 2018). Thus, it remains a question whether perturbation in OPA1 is connected to cristae dynamics adaptations associated with Ca2+mito uptake.
Regarding the role of OPA1 in Ca2+mito uptake in response to bulk Ca2+cyto induced by SOCE, our data are opposed to previous studies in HeLa and H295R OPA1 silenced cells performed in permeabilized cells and depolarized mitochondria conditions (Fülöp et al., 2011). These discrepancies can be attributed to the experimental setting and the temporary vs. long-term OPA1 ablation conditions. As oppose to the cited work, our experimental conditions involve polarized mitochondria and chronic Opa1 ablation. In addition, we found that upon SOCE, WT OPA1 rescue in Opa1−/− cells restored the Ca2+cyto-dependence of the Ca2+mito uptake even beyond that in the WT cells. The exact restoration of the Ca2+mito homeostasis in the Opa1−/− cells likely requires more than one OPA1 isoforms, as it has been demonstrated for mitochondrial morphology (Del Dotto et al., 2017). Thus, we propose that OPA1 plays distinctive roles in bulk versus ER-to-mitochondria-driven Ca2+mito uptake.
Our results showed that all the ADOA patients’ cells that exhibited low levels of OPA1 displayed closer ER-mitochondria contacts, independent of the mutated domain. In a previous study in skin fibroblast from patients carrying a splicing defect at the GTPase domain, cells exhibited an enhanced Ca2+mito uptake rate (Fülöp et al., 2015). However, the GTPase mutants explored in this study, both in patient’s cells and acutely expressed in MEFs, displayed no changes in [Ca2+]mito. Interestingly, the previous study found a high dispersion between patients carrying the same mutation (Fülöp et al., 2015), suggesting that part of the effect could be related to environmental adaptations or the patient’s genetic background.
To isolate the domain-specific mutants’ effect we performed in vitro studies in Opa1−/− background. We found that the integrity of the whole OPA1 protein is necessary to restore resting [Ca2+]cyto, given that neither GTPase nor GED mutants altered resting [Ca2+]cyto. The GTPase domain was not required to restore ER-dependent or ER-independent [Ca2+]mito uptake. Previous studies have shown that GTPase is critical for mitochondrial fusion activity (DeVay et al., 2009; Del Dotto et al., 2017), suggesting that the OPA1 Ca2+ role can be independent of the fusion activity. Instead, the GED mutants couldn’t rescue resting or maximal [Ca2+]cyto, whereas, resting but no maximal [Ca2+]mito was augmented. Elevated resting [Ca2+]mito was also found in the patient’s cells harboring the OPA1 GED mutant c.2713C>T, suggesting that this effect could be specific for this domain. In addition, the GED mutants did not restore the [Ca2+]cyto needed to induce [Ca2+]mito rise, suggesting that the OPA1 GED domain is essential for the maintenance of resting Ca2+mito and Ca2+mito uptake mediated by ER-mitochondria Ca2+ transfer. OPA1 GED domain is a predicted coiled-coil domain (Akepati et al., 2008); however, no molecular partner, except for SIRT3, has been linked to physically interact with this domain (Samant et al., 2014). Strikingly, GED mutant’s expression restored bulk [Ca2+]cyto needed to induce [Ca2+]mito rise, proposing that OPA1 GED domain could be relevant during ER-mitochondria functional tethering through a, so far, unknown molecular partner.
Finally, ADOA is a dominant disease, most of the patients are heterozygous OPA1 mutant, with only a few reports of patients with homozygous OPA1 mutations (MIM #605290). The inclusion of OPA1 GTPase or GED mutants in the presence of WT Opa1 in MEF cells, slightly diminished the Ca2+mito uptake without alteration of Mcu levels. A leftward shift in [Ca2+]cyto dependence to promote [Ca2+]mito rise was a particular characteristic observed in the Opa1−/− cells. Moreover, ADOA patient cells exhibiting low levels of OPA1 displayed a closer ER-mitochondria distance, suggesting that OPA1 integrity and levels are necessary for physiological intracellular Ca2+ regulation and ER-mitochondria Ca2+ transfer. Thus, the cellular models studied here, with patient cells and the acute expression of OPA1 mutants in a WT background, all point towards a dominant-negative Ca2+ homeostasis phenotype, independent of the involved domain.
In conclusion, our study provides new evidence on a central role for OPA1 in Ca2+ homeostasis and in determining functional ER-mitochondrial coupling, with the GED region playing a fundamental role in stabilizing the efficiency of inter-organelle Ca2+ transfer. The co-existence of WT and ADOA-related mutants could perturb ER-to-mitochondrial communication, providing a mechanism for disease progression in patients affected with ADOA disease.
Experiments were performed in fibroblasts derived from ADOA patients and control individuals or WT and Opa1 KO Mouse embryonic fibroblasts (MEFs) (provided by David Chan). Patient-derived cells were provided by Newcastle Research Biobank for Rare and Neuromuscular Diseases, based on a Material Transference Agreement with Pontificia Universidad Católica de Chile, and were maintained following the institutional biosecurity and bioethics protocols. All the cells were cultured in high glucose Dulbecco-Eagle modified medium containing sodium pyruvate (DMEM, Gibco Cat#1280017) and supplemented with 10% of fetal bovine serum (FBS), 2 mM glutamine, and 100 U/ml penicillin, and 100 μg/ml streptomycin in humidified air (5% CO2) at 37°C. Given that human myoblasts grow slowly, skeletal muscle-derived fibroblasts were generated from myoblast samples. Briefly, the patient’s derived myoblasts were cultured in Skeletal Muscle Cell Growth Medium (PromoCell #CatC-23160) and plated in collagen I-coated dishes. Cells were trypsinized and pre-plated in an uncoated dish for 30 min to separate fibroblasts from myoblasts, where the former adhere to the uncoated dish while the latter were resuspended and placed aside. The patient’s fibroblasts were used between passages 3–9. All the cells were tested for mycoplasma contamination regularly using the following protocol (Young et al., 2010).
Cells were plated on glass 25 mm coverslips and then transfected with specific constructs using Lipofectamine 2,000–3,000 (Invitrogen). MEF cells were transfected pCCEY plasmid encoding for human OPA1 isoform 1. OPA1 GTPase or GED mutants were built in the same backbone. For mitochondrial matrix calcium analysis, we used mitochondrial matrix-targeted Ca2+-sensitive proteins mtRCaMP (Kd ∼ 1 µM) and CEPIA3mt (Kd ∼ 10 µM). The transfection was performed with OPTI-mem (Thermofisher) or Transfectagro (Corning) and lipofectamine 2,000 or 3,000 (Invitrogen, Cat#11668019 or Cat#L300015, respectively) according to the manufacturer´s protocol. For optimal expression, the cells were grown for 48 h after transfection. One μg of DNA per plasmid per 35 mm dish was used for each experiment.
MEFs were transfected with the mtRCaMP, the muscarinic receptor type 3 (M3R), and OPA1 mutants. Forty-eight hours after transfection the cells were incubated in a serum-free extracellular medium (ECM: 121 mM NaCl, 5 mM NaHCO3, 10 mM Na-HEPES, 4.6 mM KCl, 1.2 mM KH2PO4, 1.2 mM MgSO4, 2 mM CaCl2, 10 mM glucose, pH7.4) containing 2%BSA and loaded with Fura2-AM (2 µM) in presence of 0.0003% Pluronic F-127 and 100 μM sulfinpyrazone for 15 min at room temperature. Cells were washed once with ECM containing 2% BSA, and recorded in ECM containing 0.25% BSA, and transferred to the thermostated stage (37°C) of the microscope. Cells were stimulated by Carbachol (CCh) 200 nM to activate the M3R, and subsequently, the IP3R, to induce Ca2+ release from the ER. For SOCE, after Fura2-AM incubation, cells were washed once with a Ca2+ free buffer. Imaging was performed in a Ca2+-free ECM containing 0.25% BSA. Cells were stimulated by CCh 200 nM to activate the IP3R and induce Ca2+ release from the ER and recorded for 150s, then the cells were stimulated with Thapsigargin 2 µg to deplete the ER of Ca2+ and recorded for 300s, and finally, 1 mM of Ca2+ was added to induce SOCE. Images were acquired using an ImagEM EM-CCD camera (Hamamatsu) fitted to an Olympus IX81 microscope with LED source (Lambda TLED+, Sutter Instruments). The configuration for each fluorescent probe or protein was as follow: Fura2-AM was recorded using 340–380 nm excitation; mtRCaMP was recorded with a 577 nm excitation filter; CEPIA3mt was recorded using 485 nm excitation filter (Chroma, customized 59022 UV filters), using dual-band dichroic and emission filters (Chroma, 59022m dual-band filters). Image collection frequency, 1 Hz. Calibration of the Fura2-AM signal was carried out at the end of each measurement, adding 1 mM CaCl2, followed by 10 mM EGTA/Tris, pH 8.5. The Fura2-AM ratios were calibrated in terms of nM [Ca2+]cyto using the following formula:
Where Fura2-AM Kd was 224 nM, R is ratio 340/380 nm, Rmin is the ratio 340/380 after EGTA addition, Rmax is the ratio 340/380 nm after 1 mM CaCl2 addition, Fmax is the maximum 380 nm fluorescence upon EGTA addition. Fmin is the minimum 380 nm fluorescence upon 1 mM CaCl2 addition. Maximal [Ca2+]mito uptake was calculated as Fmax/F0 where Fmax is the maximum fluorescence intensity and F0 is the mean resting fluorescence intensity before IP3R stimulation or SOCE protocol induction.
For [Ca2+]mito vs. [Ca2+]cyto analysis we plotted the mean trace curve from basal to maximal [Ca2+]cyto in X-axis, with regards to the same time points corresponding to [Ca2+]mito relative fluorescence from basal to maximal [Ca2+]cyto, in the Y-axis. For maximal IP3R-induced [Ca2+]cyto vs maximal [Ca2+]mito uptake we used the maximal [Ca2+]cyto ± SEM in the X-axis, and the maximal [Ca2+]mito uptake ±SEM, in the Y-axis. To quantify the changes in the [Ca2+]mito vs. [Ca2+]cyto we consider considered the [Ca2+]cyto at the moment of a 2-fold increase in [Ca2+]mito upon CCh stimulation. For SOCE, we considered the [Ca2+]cyto at the moment of a 1.5-fold increase in [Ca2+]mito for CCh stimulation.
For ADOA-derived fibroblasts experiments, the cells plated on glass coverslips were transfected with mtRCaMP and loaded with Fura2-AM (2 µM). Cells were evaluated in 0.25% BSA-ECM containing and transferred to the thermostated stage (37°C) of the microscope. Live-cell image series was performed every 1.5s, in a Nikon Eclipse Ti inverted microscope with a Lambda DG4 wavelength-switch xenon light source (Sutter Instruments) and attached by iXon3 897 Andor EMCCD camera controlled by NIS software (Nikon). Cells were stimulated by Histamine to activate the IP3R and induce ER Ca2+ release. Fura2-AM was evaluated by a dedicated filter set cube: ex.340,380—em.535/40 nm, whereas, mtRCaMP was tested using ex.545—em.620/60 nm Ca2+cyto transient data were expressed as 340/380 ratio. To quantify the level of change in the [Ca2+]mito vs. [Ca2+]cyto we considered the [Ca2+]cyto at the moment of a 1.4-fold increase in [Ca2+]mito upon Histamine stimulation.
Cells plated on glass coverslips were washed with ECM and loaded 10 min at room temperature with Tetramethyl rhodamine methyl ester or Tetramethyl rhodamine ethyl ester probe (TMRM 20 nM for MEF cells or TMRE 10 nM for human fibroblasts) in non-quenching mode. Mitochondrial membrane potential in MEF cells was measured at the custom-built LED Olympus epifluorescence imaging system. TMRM was recorded using a 577 nm excitation filter, using dual-band dichroic and emission filters (Chroma, 59022m dual-band filters). Cells were recorded every 1s. ADOA-derived cells experiments were performed at the Nikon Eclipse Ti microscope, using the following configuration: ex. 540 nm—em. 620/60 nm, 1 image every 1.5s. FCCP 5 µM/Oligomycin 5 μg/ml (MEF cells) or FCCP 10 µM (ADOA-derived fibroblasts) was used to induce loss of mitochondrial membrane potential. Resting membrane potential was calculated as ΔFbasal—FFCCP using absolute fluorescence values.
To evaluate mitochondrial ultrastructure, pellets of 8 × 10⁵ cells were fixed with glutaraldehyde 2.5%. Staining was performed as previously described (Csordás et al., 2010). Images of ultra-thin sections were acquired in a transmission electron microscope Philips Tecnai 12 at 80 kV, or at a TALOS F200C G2 system (Thermo Scientific), equipped with a Ceta 16M CMOS camera, at 200 kV, at the Advanced Microscopy Facility UMA-UC, Pontificia Universidad Católica de Chile. ER-mitochondria distance analysis was performed with Fiji ImageJ. For ER-mitochondria distance measurement we considered the values ≤30 nm.
Cells were cultured to 70–80% of confluence, harvested, and frozen. Upon thawing, a membrane-rich lysate was generated by RIPA buffer supplemented with protease and phosphatase inhibitors; 30 µg of total protein extracts were loaded into 8% or 4–12% gradient SDS-PAGE gel and transferred to PVDF membranes. Membranes were blocked with 5% milk in 0.1% TBS-Tween for 1 h at RT, followed by overnight incubation with primary antibody prepared in 5% milk or 3% BSA in 0.1% TBS-Tween. Secondary antibodies were visualized with enhanced chemiluminescent substrates (ECL, SuperSignal West Dura or SuperSignal West Femto, Thermo Scientific). For MICU1, MICU2, and EMRE, were used IR LI-COR Bioscience secondary antibodies. Densitometry was performed using ImageStudio software (LI-COR Bioscience). Antibodies used in this study: OPA1(1:1,000, BD Pharmigen #Cat 612607), MICU1 (1:500, Sigma #Cat HPA037479), MICU2 and EMRE (1:1,000, Bethyl) MCU (1:1,000, Cell signaling #Cat14997, 1:500 Sigma-Aldrich #Cat HPA016480), mtHSP70 (1:1,000 Invitrogen, #Cat MA3-028), TIM23 (1:1,000, BD Pharmigen #Cat 611-222), TOM20 (1:1,000, Proteintech #Cat 11802-1-AP), TUBULIN (1:1,000 Cell Signaling #Cat 2144S), GAPDH (1:5,000, Proteintech #Cat 60004-1-lg).
The pCCEY plasmid containing human OPA1 isoform 1 WT was kindly donated by Guy Lenaers. Mutagenic OPA1 variants were designed using the Q5 Site-Directed Mutagenesis Kit (New England Biolabs) and following the manufacturer´s protocol. The actual generation of specific mutations was confirmed by sequencing using the ABI PRISM 3500 xl Applied Biosystems (FONDEQUIP EQM150077) at Pontificia Universidad Católica de Chile or sequenced at Macrogene inc., Seoul, South Korea. pCCEY plasmid encoding GTPase mutant OPA1 c.899G>A (G300E) and GED mutant OPA1 c.2708delTTAG was kindly donated by Guy Lenaers and used in previous studies (Olichon et al., 2007b; Eisner et al., 2014). For primers’ details, see Table 1.
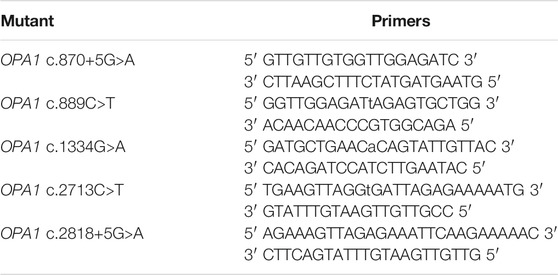
TABLE 1. Primers used to build the mutants generated in this work.
Opa1−/− MEFs cells were transfected as described above with a lentiviral plasmid containing the human OPA1 isoform 1 and a puromycin resistance cassette (pLenti-OPA1). Transfected cells were selected with Puromycin 2 μg/ml to obtain a polyclonal stable cell line. The cells were grown in growth media described above in presence of Puromycin 2 μg/ml. The pLenti-OPA1 was obtained from VectorBuilder.
Image acquisition and analysis were performed using Fiji (ImageJ) software. The statistical analysis was carried out using the GraphPad Prism 8 Software. For pairwise comparisons, unpaired t-tests were used for all normally distributed data, whereas Mann-Whitney tests were used for nonparametric data. For multiple comparisons, One-way ANOVA followed by Dunnett’s multiple comparison test was used to determine the significance of normally distributed data. For nonparametric multiple comparisons, a Kruskal-Wallis test followed by Dunn’s multiple comparison test was used to determine significance (p < 0.05). In all cases, data not indicated as significant should be considered not statistically different.
The original contributions presented in the study are included in the article/Supplementary Material, further inquiries can be directed to the corresponding authors.
BC-S and VE conceived the project. BC-S, GH, and VE designed the experiments. BC-S performed the research. BC-S, GH, and VE analyzed the data. PYWM provided the patient's cells. BC-S, DA, and ME-A designed and prepared the plasmids. DL and JM prepared the Opa1−/− + OPA1 stable cell line. JM analyzed the TEM images obtained with the Opa1−/− + OPA1 stable cell line. BC-S and VE wrote the paper with comments from all authors. All the authors read and approve the final manuscript.
This work was supported by the Chilean Government through Agencia Nacional de Investigación y Desarrollo (ANID) PhD. Fellowship 21181402 to BC-S, VRI-UC PhD. Fellowship to BC-S. ANID PhD. fellowship 21150971 to DA, 21211363 to JM, and 21191304 to DL. FONDECYT grant 1191152 to ME-A. PYWM is supported by an Advanced Fellowship Award (NIHR301696) from the UK National Institute of Health Research (NIHR) and a Clinician Scientist Fellowship Award (G1002570) from the UK Medical Research Council (MRC). PYWM also receives funding from Fight for Sight (United Kingdom), the Isaac Newton Trust (United Kingdom), Moorfields Eye Charity (GR001376), the Addenbrooke's Charitable Trust, the National Eye Research Centre (United Kingdom), the International Foundation for Optic Nerve Disease (IFOND), the NIHR as part of the Rare Diseases Translational Research Collaboration, the NIHR Cambridge Biomedical Research Centre (BRC-1215-20014), and the NIHR Biomedical Research Centre based at Moorfields Eye Hospital NHS Foundation Trust and UCL Institute of Ophthalmology. The views expressed are those of the author(s) and not necessarily those of the NHS, the NIHR or the Department of Health. NIH grant RO1-HL142271 to GH. FONDECYT grants 1150677 and 1191770 to VE.
The authors declare that the research was conducted in the absence of any commercial or financial relationships that could be construed as a potential conflict of interest.
All claims expressed in this article are solely those of the authors and do not necessarily represent those of their affiliated organizations, or those of the publisher, the editors and the reviewers. Any product that may be evaluated in this article, or claim that may be made by its manufacturer, is not guaranteed or endorsed by the publisher.
We would like to thank David Weaver, Alejandro Munizaga for their valuable technical support, and György Csordás for fruitful data discussion. We also want to thank Guy Lenaers for the pCCEY plasmid. We thank Enrique Brandan for his help with reagents. Finally, we thank all former and current lab members for their fruitful discussion.
The Supplementary Material for this article can be found online at: https://www.frontiersin.org/articles/10.3389/fcell.2021.774108/full#supplementary-material
Supplementary Figure 1 | (A) Opa1−/−, Opa1−/− +OPA1 WT or WT MEF cells expressing mtRCaMP, and the muscarinic receptor 3 (M3R), were incubated with Fura2-AM as described above, and stimulated with 200 µM of Carbachol (CCh) to induce the release of Ca2+ from the ER to the cytosol via activation of IP3R. The graph shows resting [Ca2+]cyto. (B) Graph show mean traces of [Ca2+]mito expressed in arbitrary fluorescence units for mtRCaMP. (C) Resting [Ca2+]mito expressed in arbitrary fluorescence units. (D) OPA1−/− MEF cells exogenously expressing CEPIA3mt, M3R, and incubated with TMRM 20nM as described above, were stimulated with 200 µM of Carbachol to induce the release of Ca2+ from the ER to the cytosol via activation of IP3R. Graph show mean traces of [Ca2+]mito expressed in arbitrary fluorescence units (WT, n=3/99; preparations/cells; Opa1−/−, n = 3/103; Opa1−/− +OPA1 WT, n = 3/99). (E) Resting [Ca2+]mito expressed in arbitrary fluorescence units. (F) Maximal [Ca2+]mito uptake vs Maximal [Ca2+]cyto amplitude upon agonist stimulation of WT single cells. (G) Maximal [Ca2+]mito uptake vs Maximal [Ca2+]cyto amplitude upon agonist stimulation. (H) Opa1−/−, Opa1−/− +OPA1 WT or WT MEF cells expressing OMMRCaMP were washed and kept in a Ca2+-free medium. The cells were treated 2µM of Thapsigargin (Tg) (250s) to deplete the ER Ca2+ content. The graph shows mean traces of [Ca2+]cyto (WT, n=2/40; preparations/cells; Opa1−/−, n=2/72; Opa1−/− +OPA1WT, n=2/49). (I) [Ca2+]OMM mean traces upon Tg addition. (J) AUC from [Ca2+]cyto traces (K) AUC from [Ca2+]OMM traces (L) Store Operated Calcium Entry (SOCE) induction protocol. Prior to stimulation with CCh, cells were washed and kept in a Ca2+-free medium. To stimulate IP3R, cells were treated with CCh 200 µM (60s), followed with 2 µM of Tg (200s) to completely deplete the Ca2+ from the ER. Next, 1mM of CaCl2 was added to induce the Store Operated Calcium Entry (SOCE, 500s). The graph shows mean traces of [Ca2+]cyto. (M) Maximal [Ca2+]cyto amplitude upon CCh stimulation in Ca2+-free buffer. (N) Maximal [Ca2+]cyto amplitude upon Tg stimulation in Ca2+-free buffer. (O) Maximal [Ca2+]mito uptake vs Maximal [Ca2+]cyto amplitude upon SOCE induction. Data are mean ± SEM. Error bars represent SEM. *p < 0.05, **p < 0.01, ***p < 0.001, ****p < 0.0001 vs. WT condition. ####p < 0.0001 vs. Opa1−/− + OPA1 WT condition.
Supplementary Figure 2 | (A) Western blot analysis of mitochondrial mass markers for different mitochondrial compartments (Matrix, IMM, OMM). (B) Western blot densitometry of mitochondrial mass markers for different compartments (Matrix, IMM, OMM). (C) Western blot analysis of mtCU components in WT, Opa1−/−or acute rescued Opa1−/− MEF Cells. (D) Western blot densitometry of main mtCU components. (E) Western blot validation of Opa1−/− +OPA1 WT stable MEFs cells. Data are mean ± SEM. Error bars represent SEM. *p < 0.05 vs. WT.
Supplementary Figure 3 | (A) Western blot quantification of OPA1 levels. (B) Skin or skeletal muscle ADOA-derived fibroblast expressing mtRCaMP were loaded with Fura2-AM (2 μM) for 20 min at room temperature. To induce the release of Ca2+ through IP3R activation, Histamine 100 μM was used. The bar chart shows resting [Ca2+]cyto. (C) The bar chart shows resting [Ca2+]mito. (D) Maximal [Ca2+]mito uptake vs Maximal IP3R-induced [Ca2+]cyto amplitude upon agonist stimulation. (E) TEM representative images of ER-mitochondria contacts from ADOA-derived patient cells. ER is pseudo-colored in blue. Data are mean ± SEM. Error bars represent SEM. **p < 0.01, ***p < 0.001 vs. Control condition.
Supplementary Figure 4 | (A) Western blot quantification of OPA1 levels. (B) Skin or skeletal muscle ADOA-derived fibroblast expressing mtRCaMP were loaded with Fura2-AM (2 μM) for 20 min at room temperature. To induce the release of Ca2+ through IP3R activation, Histamine 100 μM was used. The bar chart shows resting [Ca2+]cyto. (C) The bar chart shows resting [Ca2+]mito. (D) Maximal [Ca2+]mito uptake vs Maximal IP3R-induced [Ca2+]cyto amplitude upon agonist stimulation. (E) TEM representative images of ER-mitochondria contacts from ADOA-derived patient cells. ER is pseudo-colored in blue. Data are mean ± SEM. Error bars represent SEM. **p < 0.01, ***p < 0.001 vs. Control condition. (F) Maximal [Ca2+]mito uptake vs Maximal [Ca2+]cyto amplitude induced upon agonist stimulation. (G) Maximal [Ca2+]mito uptake vs Maximal [Ca2+]cyto upon SOCE induction. (H) WT MEF cells expressing OPA1 mutants, mtRCaMP, and the muscarinic receptor 3 (M3R), were incubated with Fura2-AM and stimulated as described above. Graph shows mean traces of [Ca2+]cyto expressed in nM. The bar chart shows resting [Ca2+]cyto. (I) Graphs show mean traces of [Ca2+]mito expressed in arbitrary fluorescence units, evoked by GTPase mutants. (J) Graphs show mean traces of [Ca2+]mito expressed in arbitrary fluorescence units, evoked by GED mutants. (K) The bar chart shows resting [Ca2+]mito. (L) Maximal [Ca2+]mito vs Maximal [Ca2+]cyto amplitude induced upon agonist stimulation. Data are mean SEM. Error bars represent SEM. ∗p < 0.05, ∗∗p < 0.01 vs Opa1−/− or WT condition. #p < 0.05, ##p < 0.01 vs Opa1−/− + OPA1 WT condition. The blue color is indicative of GTPase mutants and the red color for GED mutants.
Akepati, V. R., Müller, E.-C., Otto, A., Strauss, H. M., Portwich, M., and Alexander, C. (2008). Characterization of OPA1 Isoforms Isolated from Mouse Tissues. J. Neurochem. 106, 372–383. doi:10.1111/j.1471-4159.2008.05401.x
Amati-Bonneau, P., Valentino, M. L., Reynier, P., Gallardo, M. E., Bornstein, B., Boissiere, A., et al. (2008). OPA1 Mutations Induce Mitochondrial DNA Instability and Optic Atrophy 'plus' Phenotypes. Brain 131, 338–351. doi:10.1093/brain/awm298
Baughman, J. M., Perocchi, F., Girgis, H. S., Plovanich, M., Belcher-Timme, C. A., Sancak, Y., et al. (2011). Integrative Genomics Identifies MCU as an Essential Component of the Mitochondrial Calcium Uniporter. Nature 476, 341–345. doi:10.1038/nature10234
Berridge, M. J. (2016). The Inositol Trisphosphate/Calcium Signaling Pathway in Health and Disease. Physiol. Rev. 96, 1261–1296. doi:10.1152/physrev.00006.2016
Booth, D. M., Joseph, S. K., and Hajnóczky, G. (2016). Subcellular ROS Imaging Methods: Relevance for the Study of Calcium Signaling. Cell Calcium 60, 65–73. doi:10.1016/j.ceca.2016.05.001
Chen, L., Liu, T., Tran, A., Lu, X., Tomilov, A. A., Davies, V., et al. (2012). OPA1 Mutation and Late-Onset Cardiomyopathy: Mitochondrial Dysfunction and mtDNA Instability. J. Am. Heart Assoc. 1, e003012–12. doi:10.1161/JAHA.112.003012
Cogliati, S., Frezza, C., Soriano, M. E., Varanita, T., Quintana-Cabrera, R., Corrado, M., et al. (2013). Mitochondrial Cristae Shape Determines Respiratory Chain Supercomplexes Assembly and Respiratory Efficiency. Cell 155, 160–171. doi:10.1016/j.cell.2013.08.032
Corrado, M., Samardžić, D., Giacomello, M., Rana, N., Pearce, E. L., and Scorrano, L. (2021). Deletion of the Mitochondria-Shaping Protein Opa1 during Early Thymocyte Maturation Impacts Mature Memory T Cell Metabolism. Cell Death Differ 28 (7), 2194–2206. doi:10.1038/s41418-021-00747-6
Csordás, G., Golenár, T., Seifert, E. L., Kamer, K. J., Sancak, Y., Perocchi, F., et al. (2013). MICU1 Controls Both the Threshold and Cooperative Activation of the Mitochondrial Ca2+ Uniporter. Cell Metab 17, 976–987. doi:10.1016/j.cmet.2013.04.020
Csordás, G., Renken, C., Várnai, P., Walter, L., Weaver, D., Buttle, K. F., et al. (2006). Structural and Functional Features and Significance of the Physical Linkage between ER and Mitochondria. J. Cel Biol. 174, 915–921. doi:10.1083/jcb.200604016
Csordás, G., Thomas, A. P., and Hajnóczky, G. (1999). Quasi-synaptic Calcium Signal Transmission between Endoplasmic Reticulum and Mitochondria. EMBO J. 18, 96–108. doi:10.1093/emboj/18.1.96
Csordás, G., Várnai, P., Golenár, T., Roy, S., Purkins, G., Schneider, T. G., et al. (2010). Imaging Interorganelle Contacts and Local Calcium Dynamics at the ER-Mitochondrial Interface. Mol. Cel 39, 121–132. doi:10.1016/j.molcel.2010.06.029
Dayanithi, G., Chen-Kuo-Chang, M., Viero, C., Hamel, C., Muller, A., and Lenaers, G. (2010). Characterization of Ca2+Signalling in Postnatal Mouse Retinal Ganglion Cells: Involvement of OPA1 in Ca2+Clearance. Ophthalmic Genet. 31, 53–65. doi:10.3109/13816811003698117
De Stefani, D., Raffaello, A., Teardo, E., Szabò, I, Rizzuto, R., et al. (2011). A Forty-Kilodalton Protein of the Inner Membrane Is the Mitochondrial Calcium Uniporter. Nature 476, 336–340. doi:10.1038/nature10230
Del Dotto, V., Mishra, P., Vidoni, S., Fogazza, M., Maresca, A., Caporali, L., et al. (2017). OPA1 Isoforms in the Hierarchical Organization of Mitochondrial Functions. Cel Rep. 19, 2557–2571. doi:10.1016/j.celrep.2017.05.073
Delettre, C., Lenaers, G., Griffoin, J.-M., Gigarel, N., Lorenzo, C., Belenguer, P., et al. (2000). Nuclear Gene OPA1, Encoding a Mitochondrial Dynamin-Related Protein, Is Mutated in Dominant Optic Atrophy. Nat. Genet. 26, 207–210. doi:10.1038/79936
Denton, R. M., and McCormack, J. G. (1990). Ca2+ as A Second Messenger within Mitochondria of the Heart and Other Tissues. Annu. Rev. Physiol. 52, 451–466. doi:10.1146/annurev.ph.52.030190.002315
DeVay, R. M., Dominguez-Ramirez, L., Lackner, L. L., Hoppins, S., Stahlberg, H., and Nunnari, J. (2009). Coassembly of Mgm1 Isoforms Requires Cardiolipin and Mediates Mitochondrial Inner Membrane Fusion. J. Cel Biol. 186, 793–803. doi:10.1083/jcb.200906098
Eisner, V., Lenaers, G., and Hajnóczky, G. (2014). Mitochondrial Fusion Is Frequent in Skeletal Muscle and Supports Excitation-Contraction Coupling. J. Cel Biol. 205, 179–195. doi:10.1083/jcb.201312066
Eisner, V., Picard, M., and Hajnóczky, G. (2018). Mitochondrial Dynamics in Adaptive and Maladaptive Cellular Stress Responses. Nat. Cel Biol. 20, 755–765. doi:10.1038/s41556-018-0133-0
Frezza, C., Cipolat, S., Martins de Brito, O., Micaroni, M., Beznoussenko, G. V., Rudka, T., et al. (2006). OPA1 Controls Apoptotic Cristae Remodeling Independently from Mitochondrial Fusion. Cell 126, 177–189. doi:10.1016/j.cell.2006.06.025
Fülöp, L., Rajki, A., Maka, E., Molnár, M. J., and Spät, A. (2015). Mitochondrial Ca2+ Uptake Correlates with the Severity of the Symptoms in Autosomal Dominant Optic Atrophy. Cell Calcium 57, 49–55. doi:10.1016/j.ceca.2014.11.008
Fülöp, L., Szanda, G., Enyedi, B., Várnai, P., and Spät, A. (2011). The Effect of OPA1 on Mitochondrial Ca2+ Signaling. PLoS One 6, e25199. doi:10.1371/journal.pone.0025199
Glytsou, C., Calvo, E., Cogliati, S., Mehrotra, A., Anastasia, I., Rigoni, G., et al. (2016). Optic Atrophy 1 Is Epistatic to the Core MICOS Component MIC60 in Mitochondrial Cristae Shape Control. Cel Rep. 17, 3024–3034. doi:10.1016/j.celrep.2016.11.049
Gómez-Valadés, A. G., Pozo, M., Varela, L., Boudjadja, M. B., Ramírez, S., Chivite, I., et al. (2021). Mitochondrial Cristae-Remodeling Protein OPA1 in POMC Neurons Couples Ca2+ Homeostasis with Adipose Tissue Lipolysis. Cel Metab 33, 1820. e9–16. doi:10.1016/j.cmet.2021.07.008
Gottschalk, B., Klec, C., Leitinger, G., Bernhart, E., Rost, R., Bischof, H., et al. (2019). MICU1 Controls Cristae junction and Spatially Anchors Mitochondrial Ca2+ Uniporter Complex. Nat. Commun. 10 (1), 3732. doi:10.1038/s41467-019-11692-x
Gottschalk, B., Klec, C., Waldeck-Weiermair, M., Malli, R., and Graier, W. F. (2018). Intracellular Ca2+ Release Decelerates Mitochondrial Cristae Dynamics within the Junctions to the Endoplasmic Reticulum. Pflugers Arch. - Eur. J. Physiol. 470, 1193–1203. doi:10.1007/s00424-018-2133-0
Gunter, T. E., and Sheu, S.-S. (2009). Characteristics and Possible Functions of Mitochondrial Ca2+ Transport Mechanisms. Biochim. Biophys. Acta (Bba) - Bioenerg. 1787, 1291–1308. doi:10.1016/j.bbabio.2008.12.011
Hajnóczky, G., Booth, D., Csordás, G., Debattisti, V., Golenár, T., Naghdi, S., et al. (2014). Reliance of ER–Mitochondrial Calcium Signaling on Mitochondrial EF-Hand Ca2+ Binding Proteins: Miros, MICUs, LETM1 and Solute Carriers. Curr. Opin. Cel Biol. 29, 133–141. doi:10.1016/j.ceb.2014.06.002
Hajnóczky, G., Robb-Gaspers, L. D., Seitz, M. B., and Thomas, A. P. (1995). Decoding of Cytosolic Calcium Oscillations in the Mitochondria. Cell 82, 415–424. doi:10.1016/0092-8674(95)90430-1
Herkenne, S., Ek, O., Zamberlan, M., Pellattiero, A., Chergova, M., Chivite, I., et al. (2020). Developmental and Tumor Angiogenesis Requires the Mitochondria-Shaping Protein Opa1. Cel Metab. 31, 987–1003. doi:10.1016/j.cmet.2020.04.007
Hu, C., Shu, L., Huang, X., Yu, J., Li, l., Gong, L., et al. (2020). OPA1 and MICOS Regulate Mitochondrial Crista Dynamics and Formation. Cell Death Dis 11, 940. doi:10.1038/s41419-020-03152-y
Jouaville, L. S., Pinton, P., Bastianutto, C., Rutter, G. A., and Rizzuto, R. (1999). Regulation of Mitochondrial ATP Synthesis by Calcium: Evidence for a Long-Term Metabolic Priming. Proc. Natl. Acad. Sci. 96, 13807–13812. doi:10.1073/pnas.96.24.13807
Kamer, K. J., Grabarek, Z., and Mootha, V. K. (2017). High‐affinity Cooperative Ca 2+ Binding by MICU 1- MICU 2 Serves as an On-Off Switch for the Uniporter. EMBO Rep. 18, 1397–1411. doi:10.15252/embr.201643748
Kondadi, A. K., Anand, R., Hänsch, S., Urbach, J., Zobel, T., Wolf, D. M., et al. (2020). Cristae Undergo Continuous Cycles of Membrane Remodelling in a MICOS-dependent Manner. EMBO Rep. 21, e49776–22. doi:10.15252/embr.201949776
Kowaltowski, A. J., Menezes-Filho, S. L., Assali, E. A., Gonçalves, I. G., Cabral-Costa, J. V., Abreu, P., et al. (2019). Mitochondrial Morphology Regulates Organellar Ca2+uptake and Changes Cellular Ca2+homeostasis. FASEB J. 33, 13176–13188. doi:10.1096/fj.201901136r
Kushnareva, Y. E., Gerencser, A. A., Bossy, B., Ju, W.-K., White, A. D., Waggoner, J., et al. (2013). Loss of OPA1 Disturbs Cellular Calcium Homeostasis and Sensitizes for Excitotoxicity. Cel Death Differ 20, 353–365. doi:10.1038/cdd.2012.128
Landes, T., Leroy, I., Bertholet, A., Diot, A., Khosrobakhsh, F., Daloyau, M., et al. (2010). OPA1 (Dys)functions. Semin. Cel Develop. Biol. 21, 593–598. doi:10.1016/j.semcdb.2009.12.012
Landrum, M. J., Lee, J. M., Benson, M., Brown, G. R., Chao, C., Chitipiralla, S., et al. (2018). ClinVar: Improving Access to Variant Interpretations and Supporting Evidence. Nucleic Acids Res. 46, D1062–D1067. doi:10.1093/nar/gkx1153
Le Page, S., Niro, M., Fauconnier, J., Cellier, L., Tamareille, S., Gharib, A., et al. (2016). Increase in Cardiac Ischemia-Reperfusion Injuries in Opa1+/- Mouse Model. PLoS One 11, e0164066–19. doi:10.1371/journal.pone.0164066
Le Roux, B., Lenaers, G., Zanlonghi, X., Amati-Bonneau, P., Chabrun, F., Foulonneau, T., et al. (2019). OPA1: 516 Unique Variants and 831 Patients Registered in an Updated Centralized Variome Database. Orphanet J. Rare Dis. 14, 214. doi:10.1186/s13023-019-1187-1
Liu, J. C., Liu, J., Holmström, K. M., Menazza, S., Parks, R. J., Fergusson, M. M., et al. (2016). MICU1 Serves as a Molecular Gatekeeper to Prevent In Vivo Mitochondrial Calcium Overload. Cel Rep. 16, 1561–1573. doi:10.1016/j.celrep.2016.07.011
Liu, X., Weaver, D., Shirihai, O., and Hajnóczky, G. (2009). Mitochondrial 'kiss-And-Run': Interplay between Mitochondrial Motility and Fusion-Fission Dynamics. EMBO J. 28, 3074–3089. doi:10.1038/emboj.2009.255
Mallilankaraman, K., Doonan, P., Cárdenas, C., Chandramoorthy, H. C., Müller, M., Miller, R., et al. (2012). MICU1 Is an Essential Gatekeeper for MCU-Mediated Mitochondrial Ca2+ Uptake that Regulates Cell Survival. Cell 151, 630–644. doi:10.1016/j.cell.2012.10.011
Olichon, A., Baricault, L., Gas, N., Guillou, E., Valette, A., Belenguer, P., et al. (2003). Loss of OPA1 Perturbates the Mitochondrial Inner Membrane Structure and Integrity, Leading to Cytochrome C Release and Apoptosis. J. Biol. Chem. 278, 7743–7746. doi:10.1074/jbc.c200677200
Olichon, A., Elachouri, G., Baricault, L., Delettre, C., Belenguer, P., and Lenaers, G. (2007a). OPA1 Alternate Splicing Uncouples an Evolutionary Conserved Function in Mitochondrial Fusion from a Vertebrate Restricted Function in Apoptosis. Cel Death Differ 14, 682–692. doi:10.1038/sj.cdd.4402048
Olichon, A., Landes, T., Arnauné-Pelloquin, L., Emorine, L. J., Mils, V., Guichet, A., et al. (2007b). Effects of OPA1 Mutations on Mitochondrial Morphology and Apoptosis: Relevance to ADOA Pathogenesis. J. Cel. Physiol. 211, 423–430. doi:10.1002/jcp.20950
Patron, M., Checchetto, V., Raffaello, A., Teardo, E., Vecellio Reane, D., Mantoan, M., et al. (2014). MICU1 and MICU2 Finely Tune the Mitochondrial Ca2+ Uniporter by Exerting Opposite Effects on MCU Activity. Mol. Cel 53, 726–737. doi:10.1016/j.molcel.2014.01.013
Patron, M., Granatiero, V., Espino, J., Rizzuto, R., and De Stefani, D. (2019). MICU3 Is a Tissue-specific Enhancer of Mitochondrial Calcium Uptake. Cel Death Differ 26, 179–195. doi:10.1038/s41418-018-0113-8
Patten, D. A., Wong, J., Khacho, M., Soubannier, V., Mailloux, R. J., Pilon‐Larose, K., et al. (2014). OPA1‐dependent Cristae Modulation Is Essential for Cellular Adaptation to Metabolic Demand. EMBO J. 33, 2676–2691. doi:10.15252/embj.201488349
Perocchi, F., Gohil, V. M., Girgis, H. S., Bao, X. R., McCombs, J. E., Palmer, A. E., et al. (2010). MICU1 Encodes a Mitochondrial EF Hand Protein Required for Ca2+ Uptake. Nature 467, 291–296. doi:10.1038/nature09358
Piquereau, J., Caffin, F., Novotova, M., Prola, A., Garnier, A., Mateo, P., Fortin, D., et al. (2012). Down-Regulation of OPA1 Alters Mouse Mitochondrial Morphology, PTP Function, and Cardiac Adaptation to Pressure Overload. Cardiovasc. Res. 94, 408–417.
Raffaello, A., De Stefani, D., Sabbadin, D., Teardo, E., Merli, G., Picard, A., et al. (2013). The Mitochondrial Calcium Uniporter Is a Multimer that Can Include a Dominant-Negative Pore-Forming Subunit. EMBO J. 32, 2362–2376. doi:10.1038/emboj.2013.157
Rizzuto, R., De Stefani, D., Raffaello, A., and Mammucari, C. (2012). Mitochondria as Sensors and Regulators of Calcium Signalling. Nat. Rev. Mol. Cel Biol. 13, 566–578. doi:10.1038/nrm3412
Rizzuto, R., Pinton, P., Carrington, W., Fay, F. S., Fogarty, K. E., Lifshitz, L. M., et al. (1998). Close Contacts with the Endoplasmic Reticulum as Determinants of Mitochondrial Ca 2+ Responses. Science 280, 1763–1766. doi:10.1126/science.280.5370.1763
Samant, S. A., Zhang, H. J., Hong, Z., Pillai, V. B., Sundaresan, N. R., Wolfgeher, D., et al. (2014). SIRT3 Deacetylates and Activates OPA1 to Regulate Mitochondrial Dynamics during Stress. Mol. Cel. Biol. 34, 807–819. doi:10.1128/mcb.01483-13
Sancak, Y., Markhard, A. L., Kitami, T., Kovács-Bogdán, E., Kamer, K. J., Udeshi, N. D., et al. (2013). EMRE Is an Essential Component of the Mitochondrial Calcium Uniporter Complex. Science 342, 1379–1382. doi:10.1126/science.1242993
Song, Z., Ghochani, M., McCaffery, J. M., Frey, T. G., and Chan, D. C. (2009). Mitofusins and OPA1 Mediate Sequential Steps in Mitochondrial Membrane Fusion. MBoC 20, 3525–3532. doi:10.1091/mbc.e09-03-0252
Szabadkai, G., Simoni, A. M., Bianchi, K., De Stefani, D., Leo, S., Wieckowski, M. R., et al. (2006). Mitochondrial Dynamics and Ca2+ Signaling. Biochim. Biophys. Acta (Bba) - Mol. Cel Res. 1763, 442–449. doi:10.1016/j.bbamcr.2006.04.002
Szabadkai, G., Simoni, A. M., Chami, M., Wieckowski, M. R., Youle, R. J., and Rizzuto, R. (2004). Drp-1-dependent Division of the Mitochondrial Network Blocks Intraorganellar Ca2+ Waves and Protects against Ca2+-Mediated Apoptosis. Mol. Cel 16, 59–68. doi:10.1016/j.molcel.2004.09.026
Tomar, D., Thomas, M., Garbincius, J. F., Kolmetzky, D. W., Jadiya, P., Carpenter, A. C., et al. (2019). MICU1 Regulates Mitochondrial Cristae Structure and Function Independent of the Mitochondrial Calcium Uniporter Channel. BioRxiv. doi:10.1101/803213
Varanita, T., Soriano, M. E., Romanello, V., Zaglia, T., Quintana-Cabrera, R., Semenzato, M., et al. (2015). The OPA1-dependent Mitochondrial Cristae Remodeling Pathway Controls Atrophic, Apoptotic, and Ischemic Tissue Damage. Cel Metab. 21, 834–844. doi:10.1016/j.cmet.2015.05.007
Vogel, F., Bornhövd, C., Neupert, W., and Reichert, A. S. (2006). Dynamic Subcompartmentalization of the Mitochondrial Inner Membrane. J. Cel Biol. 175, 237–247. doi:10.1083/jcb.200605138
Votruba, M., Moore, A. T., and Bhattacharya, S. S. (1998). Clinical Features, Molecular Genetics, and Pathophysiology of Dominant Optic Atrophy. J. Med. Genet. 35, 793–800. doi:10.1136/jmg.35.10.793
Young, L., Sung, J., Stacey, G., and Masters, J. R. (2010). Detection of Mycoplasma in Cell Cultures. Nat. Protoc. 5 (5), 929–934. doi:10.1038/nprot.2010.43
Zaninello, M., Palikaras, K., Naon, D., Iwata, K., Herkenne, S., Quintana-Cabrera, R., et al. (2020). Inhibition of Autophagy Curtails Visual Loss in a Model of Autosomal Dominant Optic Atrophy. Nat. Commun. 11, 4029. doi:10.1038/s41467-020-17821-1
Keywords: mitochondria, OPA1, ADOA, calcium, endoplasmic reticulum
Citation: Cartes-Saavedra B, Macuada J, Lagos D, Arancibia D, Andrés ME, Yu-Wai-Man P, Hajnóczky G and Eisner V (2022) OPA1 Modulates Mitochondrial Ca2+ Uptake Through ER-Mitochondria Coupling. Front. Cell Dev. Biol. 9:774108. doi: 10.3389/fcell.2021.774108
Received: 11 September 2021; Accepted: 30 November 2021;
Published: 03 January 2022.
Edited by:
Jyoti K. Jaiswal, Children’s National Hospital, United StatesReviewed by:
Thomas Simmen, University of Alberta, CanadaCopyright © 2022 Cartes-Saavedra, Macuada, Lagos, Arancibia, Andrés, Yu-Wai-Man, Hajnóczky and Eisner. This is an open-access article distributed under the terms of the Creative Commons Attribution License (CC BY). The use, distribution or reproduction in other forums is permitted, provided the original author(s) and the copyright owner(s) are credited and that the original publication in this journal is cited, in accordance with accepted academic practice. No use, distribution or reproduction is permitted which does not comply with these terms.
*Correspondence: Verónica Eisner, dmVpc25lckBiaW8ucHVjLmNs
Disclaimer: All claims expressed in this article are solely those of the authors and do not necessarily represent those of their affiliated organizations, or those of the publisher, the editors and the reviewers. Any product that may be evaluated in this article or claim that may be made by its manufacturer is not guaranteed or endorsed by the publisher.
Research integrity at Frontiers
Learn more about the work of our research integrity team to safeguard the quality of each article we publish.