
95% of researchers rate our articles as excellent or good
Learn more about the work of our research integrity team to safeguard the quality of each article we publish.
Find out more
ORIGINAL RESEARCH article
Front. Cell Dev. Biol. , 08 December 2021
Sec. Molecular and Cellular Pathology
Volume 9 - 2021 | https://doi.org/10.3389/fcell.2021.772436
This article is part of the Research Topic DNA Methylation Dynamics and Human Diseases View all 10 articles
 Wenhao Xu1,2†
 Wenkai Zhu1,2†
 Xi Tian1,2†
 Wangrui Liu3†Yuanyuan Wu4†
 Aihetaimujiang Anwaier1,2
 Jiaqi Su1,2Shiyin Wei3†*
 Yuanyuan Qu1,2*
 Hailiang Zhang1,2*
 Dingwei Ye1,2*
The tumor microenvironment (TME) affects the biologic malignancy of clear cell renal cell carcinoma (ccRCC). The influence of the 5-methylcytosine (m5C) epigenetic modification on the TME is unknown. We comprehensively assessed m5C modification patterns of 860 ccRCC samples (training, testing, and real-world validation cohorts) based on 17 m5C regulators and systematically integrated the modification patterns with TME cell-infiltrating characterizations. Our results identified distinct m5C modification clusters with gradual levels of immune cell infiltration. The distinct m5C modification patterns differ in clinicopathological features, genetic heterogeneity, patient prognosis, and treatment responses of ccRCC. An elevated m5C score, characterized by malignant biologic processes of tumor cells and suppression of immunity response, implies an immune-desert TME phenotype and is associated with dismal prognosis of ccRCC. Activation of exhausted T cells and effective immune infiltration were observed in the low m5C score cluster, reflecting a noninflamed and immune-excluded TME phenotype with favorable survival and better responses to immunotherapy. Together, these findings provide insights into the regulation mechanisms of DNA m5C methylation modification patterns on the tumor immune microenvironment. Comprehensive assessment of tumor m5C modification patterns may enhance our understanding of TME cell-infiltrating characterizations and help establish precision immunotherapy strategies for individual ccRCC patients.
Renal cell carcinoma (RCC) is the most common malignancy of the urinary system, accounting for approximately 3.8% of all newly diagnosed cancers. The incidence of RCC is increasing by 1.1% each year (Siegel et al., 2020). Clear cell RCC (ccRCC), which originates from proximal tubule epithelial cells, is the most common histology type of RCC, accounting for approximately 80% of all RCC cases (Capitanio and Montorsi, 2016; Linehan and Ricketts, 2019). The Von Hippel–Lindau (VHL) gene is frequently mutated in ccRCC, and mutations in BAP1, PBRM1, SETD2, and PIK3CA are also commonly observed in ccRCC. Studies show that mutations in these genes influence the prognosis and treatment response of ccRCC patients (Clark et al., 2019; Linehan and Ricketts, 2019). The standard first-line treatment strategy for metastatic or advanced ccRCC mainly involves tyrosine kinase inhibitors, such as sunitinib and sorafenib, that target vascular endothelial growth factor receptors. Over the past few decades, rapid progress has been made in immunotherapy as a new treatment strategy for cancer (Xu et al., 2019; Braun et al., 2020; Motzer et al., 2020).
DNA methylation is one of the most researched epigenetic modifications and is linked to the development of human malignancies (Qian et al., 2020). The main type of DNA methylation is the presence of an additional methyl group on the 5 position of cytosine (5-methylcytosine, m5C) (Choi et al., 2021). The m5C modification was the first discovered epigenetic marker and plays an important role in regulating the transcriptome profiles and carcinogenesis process of solid tumors, which often harbor aberrant DNA methylation (Martisova et al., 2021). The m5C modification is frequently found in large clusters called CpG islands, which are present in gene-promoter regions and suppress gene transcription (Chen et al., 2019; Palei et al., 2020). A series of enzymes, called writers, readers, and erasers, is responsible for adding, recognizing, and removing the m5C modifications, respectively (Rausch et al., 2020). Some tumor-suppressor genes are silenced as a consequence of hypermethylation in the promoter regions. Therefore, DNA methylation represents a potential signature and promising treatment target for human malignancies. Investigation of m5C epigenetic modifications and their regulation of gene expression may, thus, provide insights into the mechanisms underlying cancer development.
The 5-methylcytidine modification occurs on both DNA and RNA. The major epigenetic mark in mammalian DNA is m5C, which is associated with carcinogenesis and tumorigenesis of various cancers (Greenberg and Bourc’his, 2019). The phenotype of tumor microenvironment (TME) is dynamically regulated by cell signaling transduction and epigenetic drivers, which are critical factors influencing the efficacy of immunotherapy and both extrinsic and intrinsic resistance pathways. DNA methyltransferase enzymes (DNMTs) methylate CpG islands in gene promoters, and aberrant expression or activity of DNMTs can lead to tumorigenesis and aggressive progression (Zhang et al., 2018). Additionally, upregulated DNMT1 is shown to be necessary for maintaining cancer stemness and is associated with poor clinical outcome of cancers. DNMT1 is also shown to regulate the inhibitory function of Foxp3+ T-regulated cells (Piperi et al., 2008; Wang et al., 2013; Zagorac et al., 2016). Therefore, comprehensively exploring the biological activities of epigenetic drivers in tumor phenotypes and TME is important (Xu et al., 2021a).
In this study, we examine the potential influence of DNA m5C regulators on the clinical malignant characteristics and TME of ccRCC. We first constructed m5C clusters using large-scale samples and algorithms and evaluated the relationship of m5C clusters with immune cell infiltration, the DNA variation landscape, and immunotherapy in ccRCC.
Gene expression, copy number variants, tumor somatic mutations, and matched clinical information of ccRCC from The Cancer Genome Atlas (TCGA) cohort were obtained. Gene expression data of 93 ccRCC tumors from the Clinical Proteomic Tumor Analysis Consortium (CPTAC) were obtained at https://proteomics.cancer.gov/programs/cptac. In addition, RNA-seq and clinical data of 91 ccRCC patients from the RECA-EU cohort were available from the International Cancer Genome Consortium (ICGC, https://dcc.icgc.org/) database and included in this study. Patients without overall survival information were removed from further analysis. In addition, 232 ccRCC samples with proteomics sequencing data with available clinical and pathologic electronic records were enrolled from our institute, Fudan University Shanghai Cancer Center (FUSCC, Shanghai, China). In total, 860 ccRCC tumor samples were included for analysis. Batch effects from nonbiological technical biases were corrected using the “ComBat” algorithm of sva package and the fragments per kilobase of transcript per million values were transformed into transcripts per kilobase million values.
A total of 17 m5C regulators were extracted from the integrated gene expression profiles to identify different m5C modification patterns. The 17 m5C regulators included three writers (DNMT1, DNMT3A, and DNMT3B), three erasers (TET1, TET2, and TET3), one regulating factor (DNMT3L), and 10 readers (MECP2, MBD1, MBD2, MBD3, MBD4, UHRF1, UHRF2, ZBTB4, ZBTB38, and ZFP57). The “ConsensusClusterPlus” R package was used to classify patients for further analysis, and 1000 times repetitions were conducted to ensure the stability of the classification (Wilkerson and Hayes, 2010). Overall survival was compared between patients with different m5C modification patterns.
GSVA, a commonly employed method for estimating the variation in pathways (Hänzelmann et al., 2013), was used to evaluate the potential biological differences between the m5C modification patterns using the “GSVA” R package. To estimate the TME cell infiltration, we applied the single-sample gene set enrichment analysis algorithm to evaluate the relative abundance of immune cells in the ccRCC TME. The reference gene sets for quantifying the immune cells were obtained from a previous study (Charoentong et al., 2017), and the examined immune cells included mast cells, monocyte, macrophage, activated CD4+ T cells, and other types of immune cells. Immune cell abundance was compared between m5C modification patterns, and the prognostic significance of each immune cell was also evaluated based on the overall survival information.
To explore the potential biological differences between m5C modification patterns, the limma package was used to identify differentially expressed genes (DEGs), and the threshold value was set as p < .05, |logFC|≥3 (Ritchie et al., 2015). Functional enrichment analyses were carried out to explore the potential functions of the DEGs. The expression profiles of DEGs were extracted, and unsupervised clustering was applied again to identify the subgroups; the subgroups were defined as m5C gene clusters.
A scoring system was constructed to evaluate the m5C modification patterns, and we termed it as m5C score. Univariate Cox regression was used to evaluate the prognostic value for each gene, and the genes with prognostic significance were extracted for further analysis. Random forest analysis and principal component analysis were used to construct the m5C relevant gene signature. Both principal components 1 and 2 were enrolled to calculate the signature scores, and the m5C score was defined as follows:
To explore potential associations between copy number variants and m5C score, Genomic Identification of Significant Targets in Cancer (version 2.0) was used to identify significantly amplified or deleted regions using TCGA copy number data (Beroukhim et al., 2007; Mermel et al., 2011). Q ≤ 0.05 was defined as significant, and the confidence interval was set to 0.95. Tumor immune dysfunction and exclusion (TIDE) was used to estimate the immunotherapy response based on the expression profiles (Jiang et al., 2018). Thus, the associations between m5C score and immunotherapy response were evaluated. The pRRophetic package was used to predict the half-maximal inhibitory concentration (IC50) of chemotherapy drugs in the high and low m5C score groups.
IHC was performed to evaluate the expression levels of Ki-67 (ab15580; Abcam), CD4 (RMA-0620, Maxim, China), CD8 (RMA-0514, Maxim, China), Glut-1 (ab115730; Abcam), PD-L1 (ab205921; Abcam), CXCL13 (ab246518; Abcam), TGF-β (ab189778; Abcam), FASN (ab99359; Abcam), CK (Kit-0009, Maxim, China), and FoxP3 (98,377, CST) following previously described procedures (Xu et al., 2021a; Xu et al., 2021b). Opal multispectral was implemented to identify differential immune cell infiltration and PD-L1 expression in different groups on a multispectral imaging system (Vectra® Polaris™, Shanghai, China).
A Wilcox test was used to compare differences between two groups. The Kaplan–Meier method was used to conduct survival analysis, and the cutoff value was defined via the survminer package. A log-rank test was used to detect the significance. The receiver operating characteristic curve (ROC) was drawn to evaluate the predictive ability for immunotherapy response.
A total of 17 m5C regulators including three writers, three erasers, one regulating factor, and 10 readers were manually identified in this study. The dynamic reversible process of m5C DNA methylation mediated by regulators as well as their potential biological functions for ccRCC are summarized in Figure 1A. We detected significant differences in the expressions of m5C regulators between ccRCC and para-cancer tissues (p < .05) (Figure 1B). Analysis of CNV frequency indicated that CNV alterations were prevalent in the 17 m5C regulators, and half of the m5C regulators more frequently showed copy number amplification compared with copy number loss (Figure 1C). Besides this, in DNA variation profiles, we found 19 experienced samples of m5C regulators with a frequency of 5.65% among 336 ccRCC samples from TCGA (Figure 1D). The location of CNV alterations of the m5C regulators on chromosomes is shown in Figure 1E. Notably, ccRCC samples could be distinguished from normal samples completely based on the expression pattern of these m5C regulators (Figure 1F). These findings suggest a high degree of m5C modification–mediated intertumoral heterogeneity of genetic and expressional alteration landscape between ccRCC and adjacent normal samples, suggesting that the aberrant expression of m5C regulators may play an essential role in ccRCC malignancy.
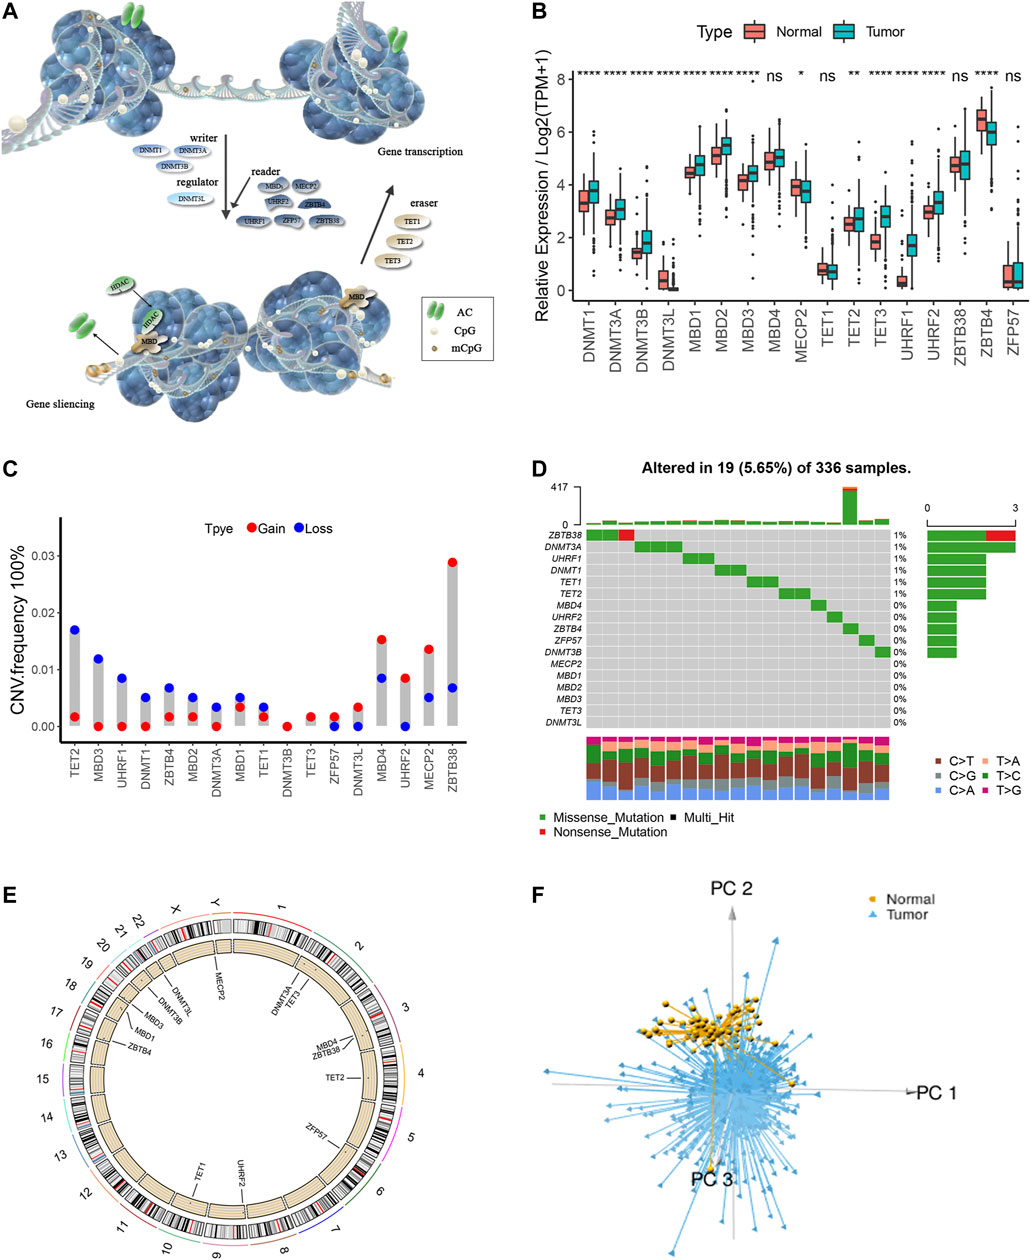
FIGURE 1. The overall depiction of genetic variations of m5C regulators in ccRCC. (A) The dynamic reversible process of m5C DNA methylation mediated by regulators as well as their potential biological functions for ccRCC are summarized. (B) Comparison of the expression levels of 17 m5C regulators in 530 ccRCC samples and >12,000 para-cancer tissues. (C) Copy number variations (CNVs) of the 17 m5C regulators in ccRCC from TCGA cohort. (D) Somatic variant landscape of the 17 m5C regulators in ccRCC from TCGA cohort. (E) The location of CNV alterations of m5C regulators on chromosomes. (F) Principal component analysis of ccRCC samples from the TCGA cohort based on the expression of the 17 m5C regulators.
Three data sets (both proteome and transcriptome) with available survival and clinicopathological information (TCGA, CPTAC, and RECA-EU) were included in one meta-cohort. Figure 2A shows the comprehensive landscape of the interaction of the 17 m5C regulators, interaction network, and the prognostic implications for ccRCC patients. The results identified TET2, MBD1, MBD2, MECP2, ZBTB4, ZBTB38, and UHRF2 as protumorigenesis indicators for ccRCC, and MBD3, UHRF1, and DNMT3B were identified as significant favorable factors for ccRCC. We also found that expression of the m5C regulators in the same functional category exhibited remarkable correlations, and a marked association was displayed among writers, regulators, erasers, and readers. For instance, whether ccRCC tumors with a high writer gene expression exhibit a high eraser gene expression normally depended on the different writer and eraser genes. However, we found that tumors with high expression of the m5C reader gene ZFP57 showed low expression of some reader genes (ZBTB4, UHRF2, MBD3, and MBD2) although the high expression of other reader genes was not affected. These results imply that a cross-talk among the genes encoding m5C writers, readers, regulators, and erasers could play essential roles in the malignancy of different m5C modification patterns and tumor immune microenvironment characterization among individual ccRCC samples.
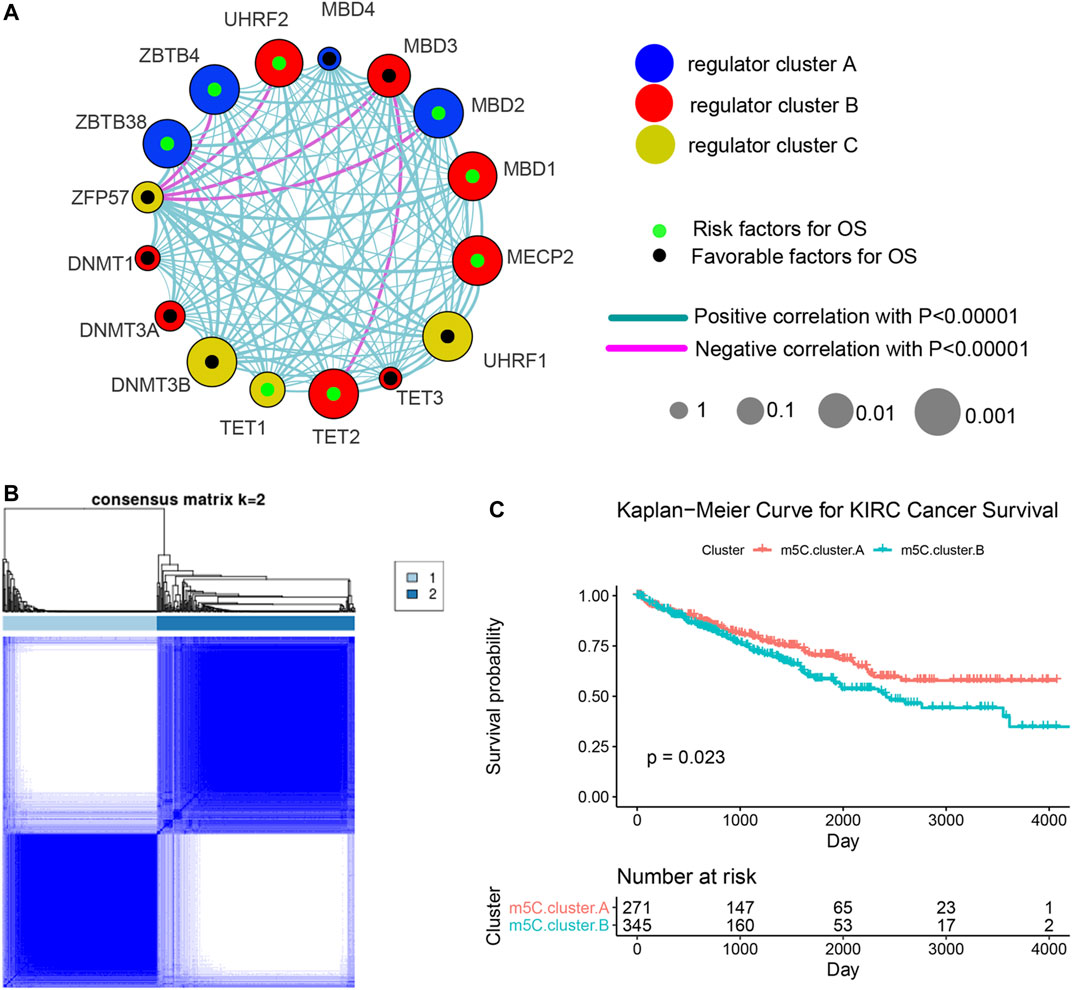
FIGURE 2. Machine learning algorithms identify m5C modification patterns mediated by the regulators. (A) Comprehensive landscape of the interactions of the 17 m5C regulators, interaction network, and the prognostic implications for ccRCC patients. (B) Unsupervised clustering based on expression of 17 m5C regulators. (C) Overall survival curves of ccRCC patients in the two m5C modification pattern clusters.
We next used the ConsensusClusterPlus R package to identify ccRCC patients with qualitatively different m5C modification patterns based on the transcriptional expression of 17 m5C regulators. Two distinct modification patterns were classified using unsupervised clustering: m5C cluster A (including 271 cases) and m5C cluster B (354 cases) (Figure 2B). Survival analysis of patients in the two clusters revealed that patients with the m5C cluster A modification pattern showed improved survival compared with patients with the m5C cluster B pattern (Figure 2C).
To investigate the clinical differences and biological processes between the two distinct m5C modification patterns, we constructed a clustering heat map showing differentially expressed m5C regulators and clinical information, including age, sex, stage, and survival status in the two m5C modification patterns (Supplementary Figure S1). GSVA enrichment analysis indicated that m5C clusters mainly differ in heterochromatin, peptidyl modification pathways, and microRNA post-transcriptional regulation (Figure 3A). The ccRCC samples in m5C cluster A showed prominent upregulation in E2F1, miR-147B, miR-3910, miR-4261, miR-3689-3p, miR-4719, PBXIP1, and ZNF184 targeted regulation and downregulation in peptidyl modification processes, such as histone binding, peptide amino acid modification, protein autoubiquitination, ubiquitin-like protein ligase, and transferase activities (Supplementary Figure S2A).
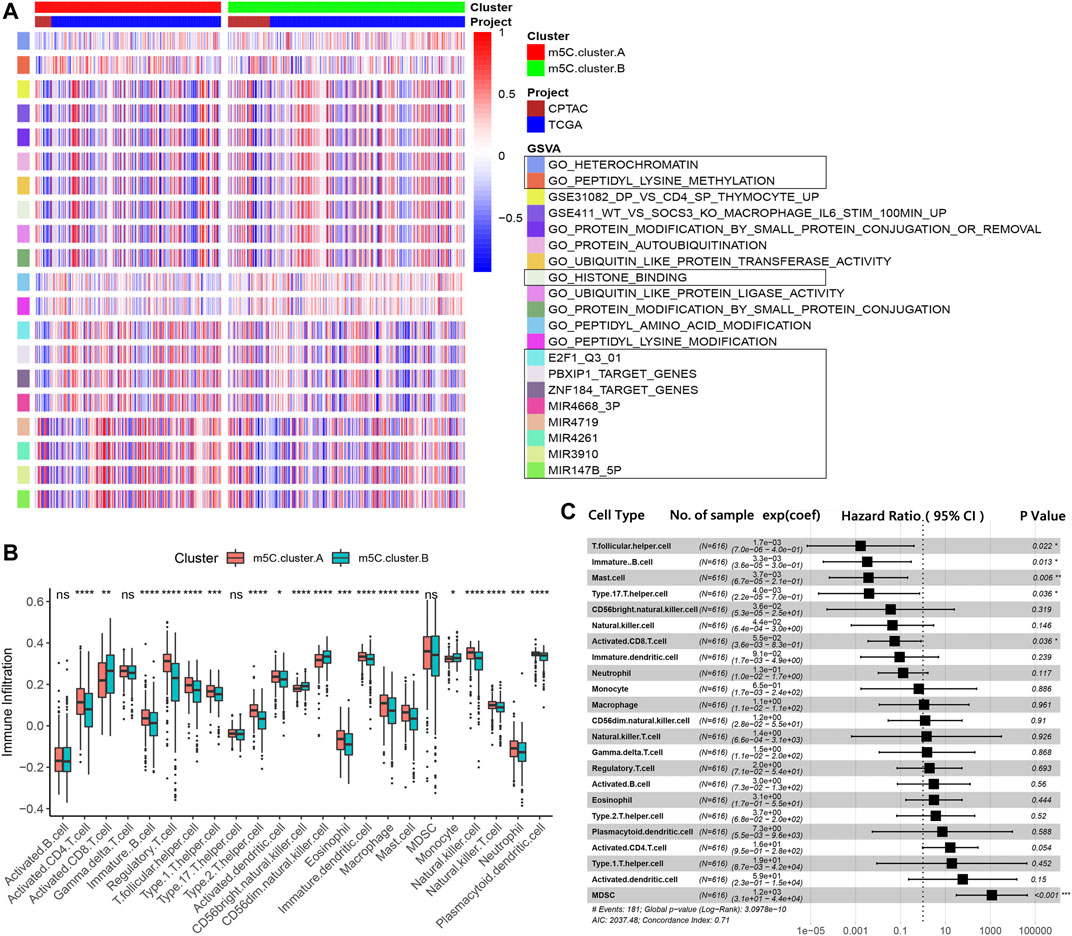
FIGURE 3. TME characterizations and infiltrating immune cells in the two m5C modification patterns. (A) GSVA results of the two m5C modification patterns. (B) Estimation of immune cell infiltration in the two m5C modification patterns. (C) Univariate regression analysis of various types of immune cells.
We next examined immune cell infiltration to assess differences in the immune context of the TME between m5C modification patterns. m5C cluster A was remarkably rich in innate immune cell infiltration and the active immune response process with a high abundance of activated CD4 T cells, immature B cells, regulatory T cells, Tfh cells, dendritic cells, eosinophils, macrophages, mast cells, natural killer cells, and neutrophils (Figure 3B). The results from GSVA analyses demonstrate that the m5C cluster A modification pattern, which predicts favorable clinical outcome, was significantly associated with antitumor immune responses. Therefore, we hypothesized that the peptidyl modification inactivation in m5C cluster A may be involved in the antitumor effects of immune cell infiltration related to this cluster.
We further assessed the prognostic implications of immune cell infiltration in ccRCC (Figure 3C). Univariate Cox analysis indicated that T follicular helper cells (p = .022), immature B cells (p = .013), mast cells (p = .006), type 17 T helper cells (p = .036), and activated CD8 T cells (p = .036) could serve as independent prognostic protective factors in ccRCC, and MDSC (p < .001) was a remarkable risk indicator for 616 ccRCC patients from the TCGA and CPTAC cohorts (Figure 3C). When clinicopathological factors were analyzed, we found no significant differences in the pathology types and genetic variations between the patients in the two m5C modification pattern groups, which suggests that DNA m5C methylation modification did not influence clinical and pathologic features of tumors (Supplementary Figure S2B–G).
To further explore the biological consequences of the distinct m5C modification patterns, we then investigated the genetic constitution of individual m5C clusters patterns and identified 180 m5C phenotype–related DEGs using the Limma package of R software. Random forest analysis was performed to determine the most important m5C gene signatures in identifying m5C modification patterns (Figure 4A). To investigate the regulation mechanism of DNA m5C modifications on ccRCC, we then performed unsupervised clustering analyses based on the obtained 180 m5C phenotype–related signatures to classify patients into different genotypes. Consistent with the clustering of m5C modification patterns, the unsupervised clustering algorithm also revealed two distinct m5C modification genomic subtypes, named as m5C gene clusters A and B (Figure 4B). Kaplan–Meier analysis of ccRCC cases in the combined discovery TCGA and test CPTAC cohorts revealed that patients in the m5C gene cluster B group (n = 247) showed significantly poor survival compared with cases in m5C gene cluster A (n = 369) (Figure 4C). Prominent differences in the expression of m5C regulators between the distinct m5C gene clusters were confirmed using unpaired t test, and the results were in accordance with the results of DNA m5C methylation modification patterns (Figure 4D). These results revealed the presence of distinct m5C methylation modification patterns in ccRCC and showed that these patterns could distinguish aggressiveness in ccRCC.
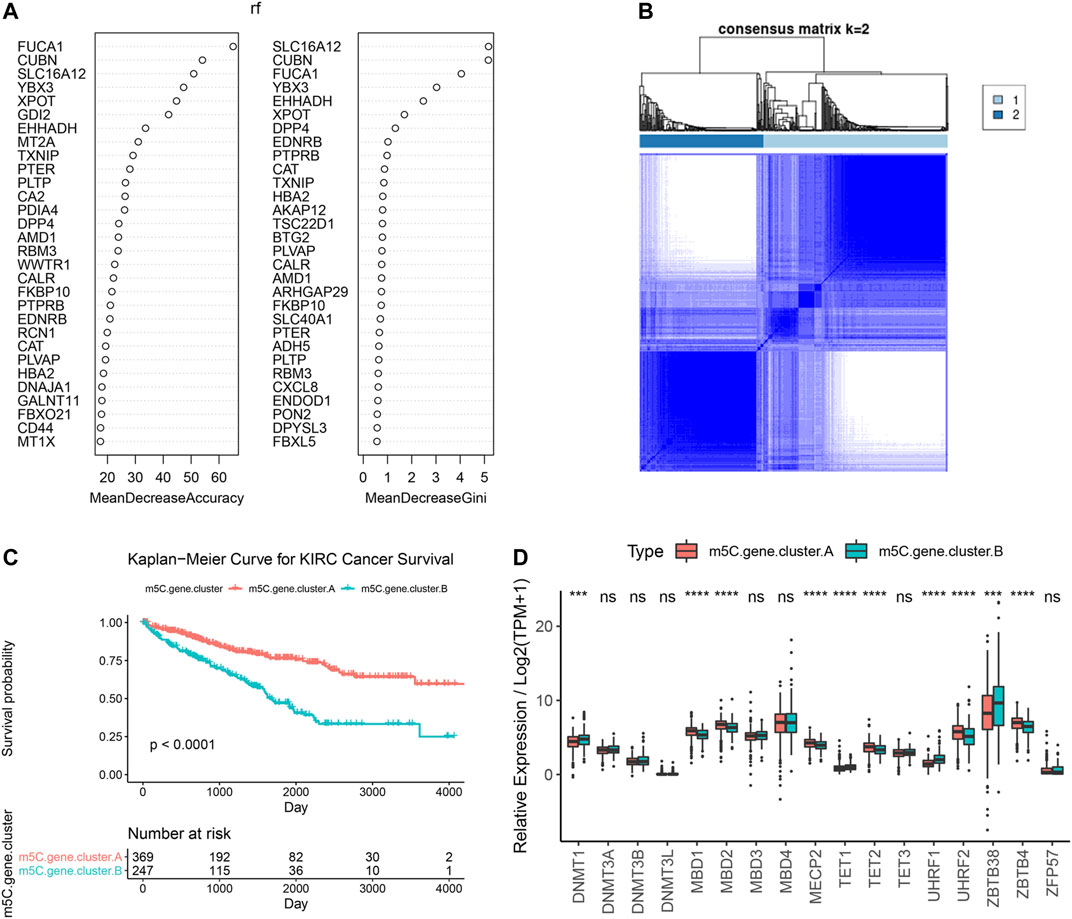
FIGURE 4. Identification and prognostic implications of m5C genotype signatures. (A) Random forest results for selecting the most important DEGs. (B) Unsupervised clustering based on the expression of selected DEGs. (C) Overall survival curves of ccRCC cases in the indicated subgroups. (D) Expression levels of 17 m5C regulators in the indicated subgroups.
Next, the clusterProfiler package was used to perform GO and KEGG functional enrichment analysis for the m5C DEGs. The biological processes, cellular components, and molecular functions with significant enrichment are summarized in Figure 5A. Enriched terms in biological processes were related to m5C modification, neutrophil activation–related immune response, and response to hypoxia, which provided a basis that m5C modification may play an important role in the immune regulation of the ccRCC TME (Figure 5A). We further found that ccRCC samples in m5C gene cluster B showed advanced clinical stages and exhibited higher mortality (Figure 5B). Older patients were concentrated in the m5C gene cluster B, and the distinct genotype clusters were characterized by different m5C signature genes.
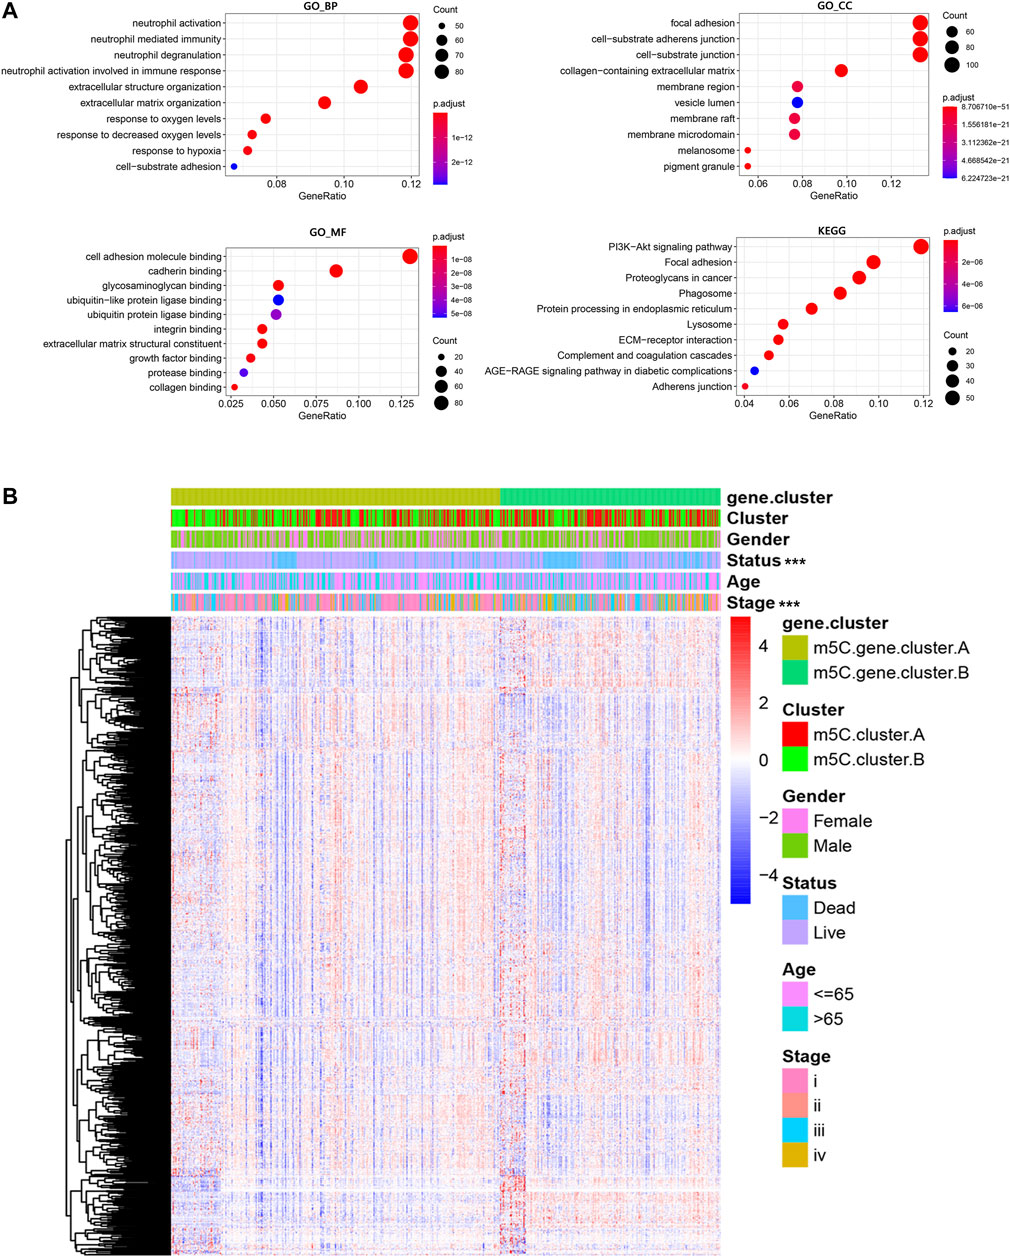
FIGURE 5. Functional annotations of m5C genotype signatures. (A) Functional enrichment results of the DEGs. (B) Integrative heat map including DEG expression, gender, age, clinical stage, and survival status in the two m5C modification pattern groups.
The above findings demonstrate that the m5C methylation modification plays a key regulatory role in reshaping different TME landscapes. Nevertheless, these results were determined on the patient population and might not provide accurate information on survivorship based on m5C modification patterns in individual ccRCC patients. Considering the individual intratumor heterogeneity of m5C methylation and using the phenotype-related genes, we establish a scoring system for easy quantification of the m5C modification patterns for individual ccRCC patients and named this system m5C score. The alluvial diagram was applied to visualize the alterations of individual patients (Figure 6A). The m5C score clusters prominently classified the patients into two prognostic groups (good and poor) and enabled stratification of patients in both the discovery TCGA and validation real-world FUSCC cohorts. Survival analysis indicated that high m5C score was significantly correlated with poor overall survival (HR = 0.3 with 95% CI from 0.22 to 0.41, p < .0001) in 516 patients with ccRCC from TCGA (Figure 6B) and correlated with worse overall survival in 266 patients with ccRCC from FUSCC (Figure 6C).
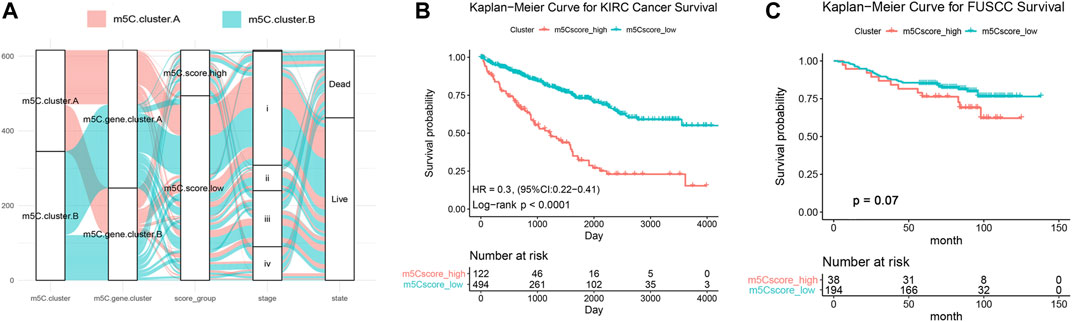
FIGURE 6. Generation and validation of the m5C score model. (A) Sanky diagram of the various clusters. (B) Overall survival curve of ccRCC patients from TCGA cohort stratified by m5C score. (C) Overall survival curve of 233 ccRCC patients from FUSCC cohort stratified by m5C score.
We next investigated the relationship of m5C score with clinical and pathologic characteristics in ccRCC patients from the training, testing, and validation cohorts. Consistent with its prognostic value, the m5C score significantly increased with advancing clinical stages and aggressive ISUP grade and reached the highest level at stage IV or grade 4 (Figures 7A,B). There was no difference in age between the two clusters. The proportion of males in the high m5C score group was markedly higher than that of females, which is consistent with the result that male patients have a worse prognosis than female patients with ccRCC (Figures 7C,D).
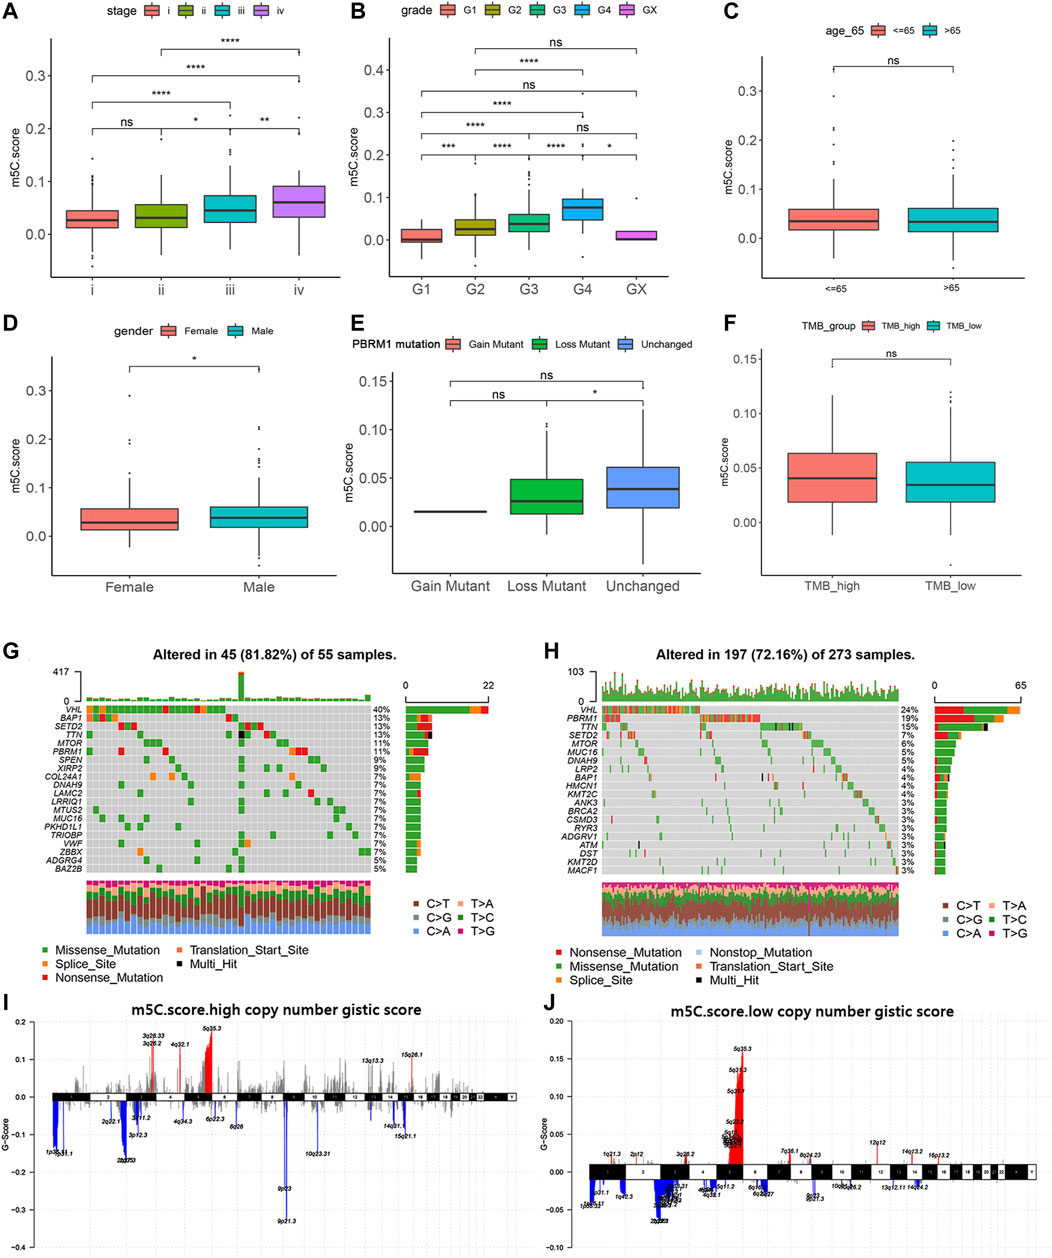
FIGURE 7. Relation of m5C modification with clinicopathological features and tumor somatic mutation. (A–F) Associations of m5C score with stage, grade, age, gender, PBRM1 mutation status, and TMB in TCGA cohort. (G–H) Landscapes of somatic variants of high and low m5C score groups in TCGA cohort. (I–J) Copy number variants of high and low m5C score groups in TCGA cohort.
To reveal the role of the m5C score phenotype in the comprehensive molecular landscape of ccRCC, we examined tumor somatic mutation and evaluated DNA variation in the m5C score clusters. Patients with mutation in PBRM1, a gene frequently mutated in ccRCC, showed a prominently lower m5C score compared with patients with wild-type PBRM1 (Figure 7E). The m5C score did not show a significant association with tumor mutation burden in patients with ccRCC (Figure 7F).
We next evaluated the differences in the DNA variation landscape in the two m5C score clusters. The top 20 frequently mutated genes in the m5C score clusters are shown in Figure 7G,H. VHL (mutation frequency, 40%), BAP1 (13%), SETD2 (13%), TTN (13%), and MTOR (11%) were the five most frequently mutated genes in the m5C scorehigh group (Figure 7G), whereas VHL (24%), PBRM1 (19%), TTN (15%), SETD2 (7%), and MTOR (6%) were the five most frequently mutated genes in the m5C scorelow group (Figure 7H). Thus, we speculate that the significantly higher mutation frequency of BAP1 in the high m5C score group may contribute to the poor prognosis for ccRCC patients and the low mutation frequency of PBRM1 may reduce immunotherapy efficiency for ccRCC patients. Copy number variant features are depicted in Figure 7I,J. In addition to the common mutation site located in 5q35.3, copy number variant in m5C scorehigh samples were generally located in 3q25.33, 2q10.53, and 9p12.3 loci.
To define the role of m5C-related phenotypes in regulation of the TME, we first investigated cancer-related pathways characterizing m5C gene clusters based on training and testing cohorts. As shown in Figure 8A, TGF-β signaling, oxidative phosphorylation, and fatty acid metabolism were significantly downregulated in ccRCC samples in the m5C scorehigh group compared with the m5C scorelow group, whereas pathways involved in protumorigenesis responses of the TME, such as hypoxia, glycolysis, epithelial-mesenchymal translation, and IL6-JAK/STAT3 signaling, were markedly upregulated in the m5C scorehigh group. We next evaluated the immune cell infiltration in the TME in m5C-related phenotype clusters. The results indicated that CD4+ T cell memory resting, mast cell resting, and monocyte and NK cell infiltration significantly correlated with a high m5C score, whereas plasma cell, M0 macrophage, Treg cell, and neutrophil infiltration were significantly associated with low m5C score in ccRCC patients (Figure 8B). To evaluate the regulatory role of m5C score in TME, we explored the expression of chemokine, cytokine, and immune checkpoints in m5C score clusters (Figure 8C). We found the expression levels of immune checkpoint factors were significantly different in the m5C scorehigh group, suggesting that the high m5C score cluster may indicate an immune-suppressive microenvironment.
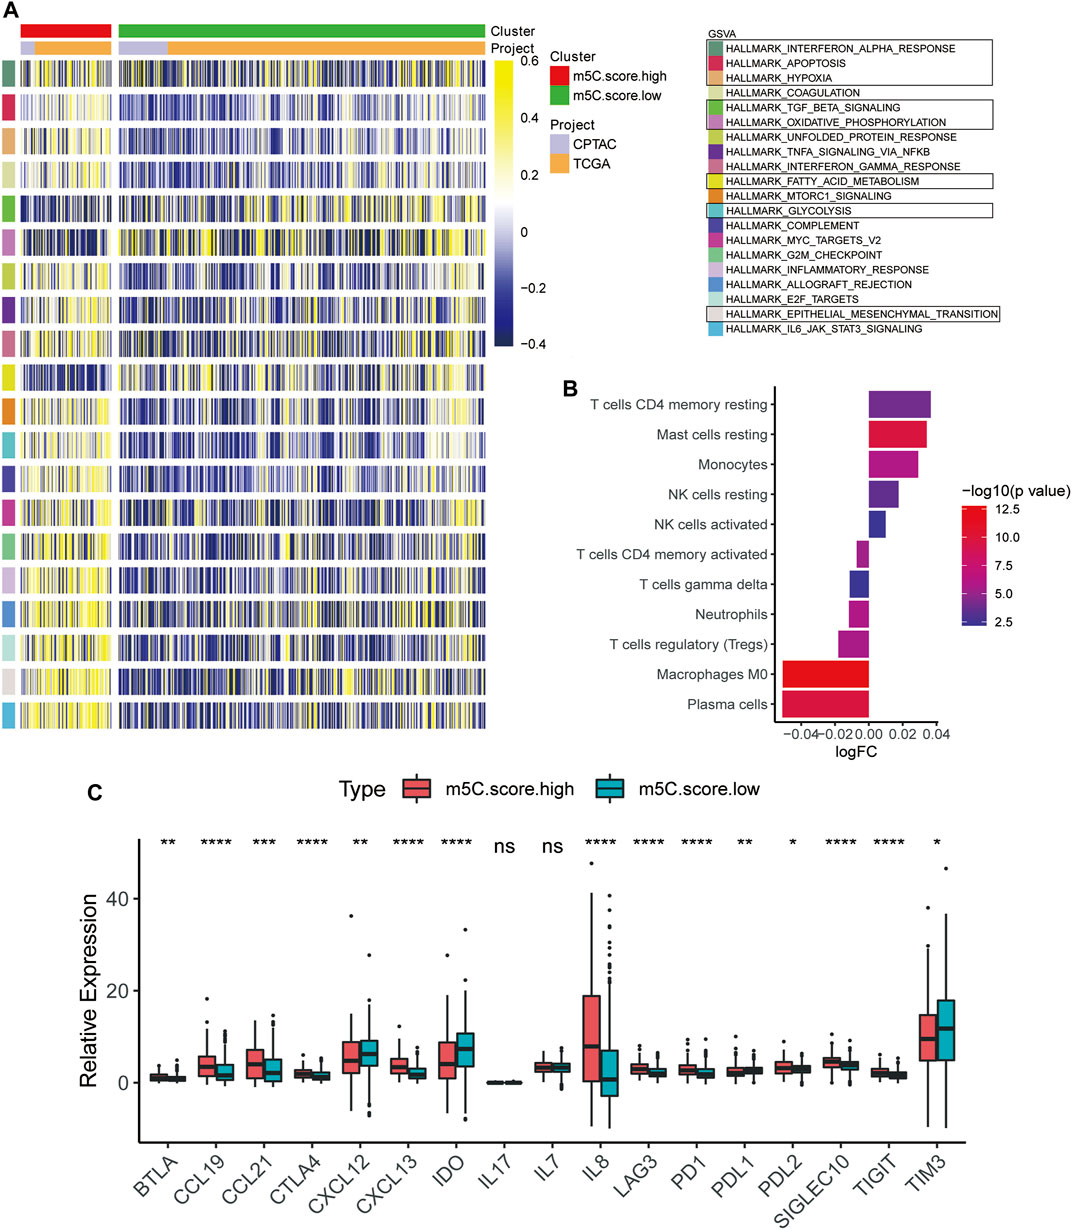
FIGURE 8. Characteristics of TME and immune cell distribution in m5C-related phenotypes. (A) GSVA results of high and low m5C score groups based on expression profiles from CPTAC and TCGA cohorts. (B) Estimation of immune cell infiltration in high and low m5C score groups. (C) Expression levels of chemokines, cytokines, and immune checkpoints between high and low m5C score groups.
Immunotherapies, including anti-immune checkpoints, are revolutionizing the field of cancer therapy. RCC is resistant to traditional cytotoxic chemotherapy but can be responsive to immunotherapy. Therefore, we investigated whether the m5C modification signature could predict the responses to chemotherapy and ICTs in the combined ccRCC cohorts (n = 860, TCGA, CPTAC, and FUSCC). Evaluation of the ICC50 of cisplatin showed that the low m5C score group was significantly correlated with a higher IC50 value, which indicates that the low m5C score group may be less sensitive to cisplatin (Figure 9A). However, no significant differences were observed in predicting IC50 values of gemcitabine between the m5C modification groups (Figure 9B). The TIDE algorithm was used to predict intratumoral heterogeneity and responsiveness to immunotherapy. The findings indicate that a higher m5C score was significantly correlated with an elevated TIDE score, suggesting that the high m5C score group may show a reduced response to immunotherapy, such as PD-1 and PD-L1 blockade (Figure 9C). The ROC curve showed a relatively stable ability for predicting the immunotherapy response of m5C score with an AUC of 0.676 (Figure 9D).
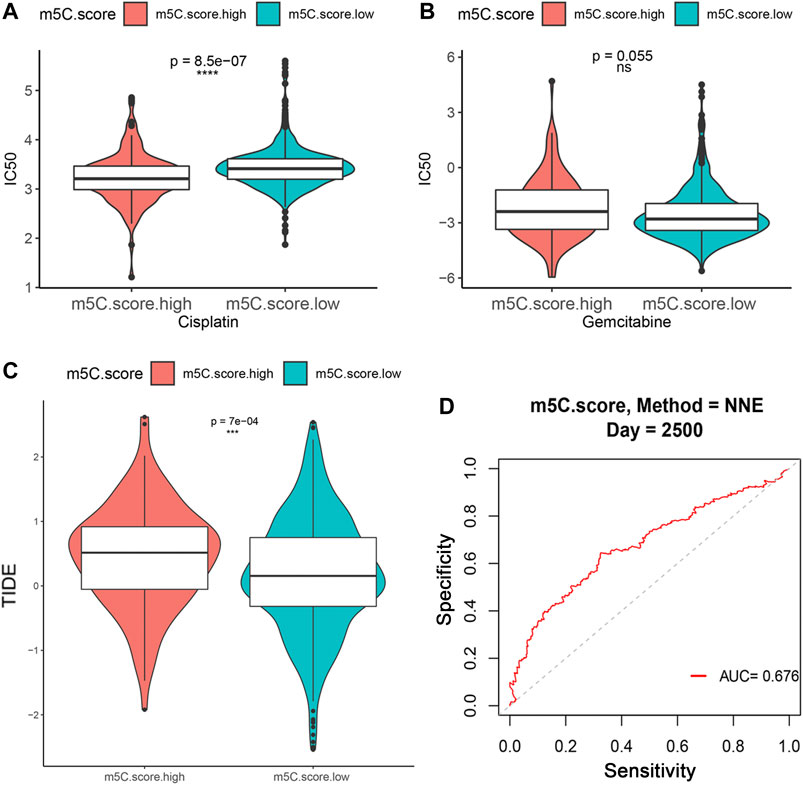
FIGURE 9. Influence of m5C modification patterns on chemotherapy and immunotherapy response. (A–B) IC50 value for cisplatin and gemcitabine in low and high m5C score groups. (C) TIDE prediction score of low and high m5C score groups. (D) ROC curve for evaluating the ability of m5C score to predict immunotherapy response.
To further test the stability of m5C score model, we applied the m5C score signature established in the real-world FUSCC proteomics cohort and evaluated TME characteristics by IHC staining analysis of 30 consecutive ccRCC tissue sections. IHC staining revealed significantly decreased CD8, PD-L1, and GLUT-1 expression and elevated FoxP3, CXCL13, and FASN expression and Ki-67 staining in tumors from the FUSCC cohort (p < .05) in the m5C scorehigh group (Figure 10), suggesting immune-suppressive characteristics of the TME. Furthermore, we found a significantly decreased number of infiltrated CD4+ T cells and CD8+FoxP3+ Treg cells and downregulated PD-L1 expression in the immune-cold m5C scorehigh group using opal multimarker IHC staining (Figure 10). In general, the data from multiomics bioinformatics to the real world demonstrate that lower m5C score predicts better responses to immunotherapy for ccRCC patients.
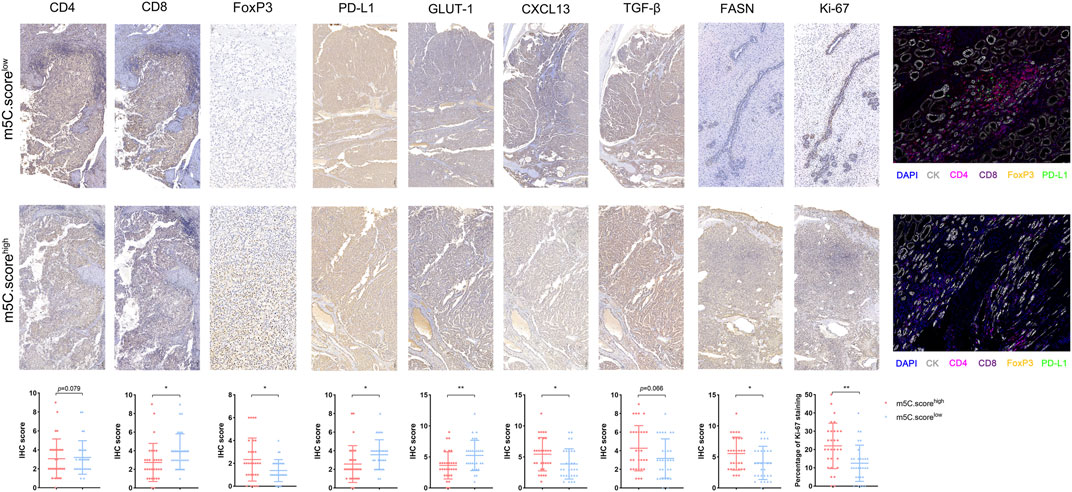
FIGURE 10. TME characterization in the m5C modification phenotypes. TME characterization assessment between high and low m5C score groups based on IHC staining (CD4, CD8, FoxP3, PD-L1, GLUT-1, CXCL13, TGF-β, FASN, Ki-67) and opal multimarkers IHC staining (DAPI, CK, CD4, CD8, FoxP3, PD-L1).
Increasing evidence demonstrates that malignant biological behaviors of cancer cells are tightly regulated by the TME and genetic variations (Mehdi and Rabbani, 2021). DNA methylation plays an essential role in modulating the transcriptional regulation of genes and subsequent cell functions, including the infiltration and functional differentiation of immune cells participating in protumor and antitumor immune responses (Saleh et al., 2020; Mehdi and Rabbani, 2021; Smiline Girija, 2021). Previous studies mainly focus on tumor-infiltrated lymphocytes or single signatures, and the influence of DNA m5C epigenetic regulators on the TME was not comprehensively elucidated. Therefore, the overall characteristics and implications of m5C modification patterns on the tumor immune microenvironment in ccRCC warrant further study.
In the current study, we used transcriptome data of 17 DNA methylation regulators and identified two distinct m5C methylation modification patterns that are associated with remarkable differences in molecular and clinical characteristics of TME in large-scale ccRCC samples in training, testing, and validation real-world cohorts. The m5C scorehigh cluster was characterized by poor prognosis and activation of innate immunity and metabolism, corresponding to the immune-desert phenotype. The m5C scorelow cluster was characterized by the activation of antitumor immunity, corresponding to the immune-excluded phenotype. IHC analysis revealed that the immune-excluded phenotype showed the presence of abundant immune cell infiltrations retained in the parenchyma in ccRCC samples rather than being located in the stroma (Gajewski et al., 2013). This is consistent with our previous findings that, even in occasional cases of nested tertiary lymphatic structures in the immune-excluded phenotype, tumor-infiltrating lymphocytes rarely appear in the stromal component of ccRCC samples (Xu et al., 2021a). Moreover, the immune-desert phenotype, the m5C scorehigh cluster, prominently correlates with progressive malignancy, immune tolerance, and lack of T cell–mediated immune responses (Kim and Chen, 2016), guiding effectiveness of immune checkpoint therapy strategies for ccRCC patients.
Research has identified molecular features underlying the initiation and progression of ccRCC. VHL gene inactivation and copy number variation are shown to be involved in promoting the initiation and lethality of ccRCC (D'Avella et al., 2020). The development of sequencing technologies enables determination of the comprehensive DNA mutation landscape and intratumor heterogeneity in the carcinogenesis process (Wettersten et al., 2015; Young et al., 2018; Clark et al., 2019). These findings are extremely important contributions to the categorization and treatment guidance of ccRCC. However, DNA variation, tumor epigenomics, and TME characterizations of ccRCC remain unclear. Here, we find significantly decreased mutation frequency of VHL (40% vs. 24%) and BAP1 (13% vs. 4%) and an elevated mutation frequency of PBRM1 (11%. vs 19%) in the high m5C score cluster compared with the low m5C modification pattern. Currently, screening for germline mutations in BAP1 and PBRM1 is recommended as these genes may serve as promising targets to predict clinical outcomes and ICT treatment responses (Miao et al., 2018; Gallan et al., 2021; Jonasch et al., 2021). Therefore, we speculate that the significantly higher proportion of BAP1 mutation in the m5C scorehigh cluster contributes to the poor prognosis for ccRCC patients, and the low proportion of PBRM1 mutations in the immune-desert phenotype may reflect reduced immunotherapy efficiency of ccRCC patients.
DNA methylation has an important impact on tumor initiation and progression because of its critical role in transcriptional regulation (Bates, 2020). An overall decrease in methylated CpG content is typically observed in tumors, and this leads to genome instability and oncogene activation. CpG hypermethylation in the promoter region of specific genes is a hallmark of many tumors (Paz et al., 2003; Bai et al., 2021). DNA methylations have been identified in genes involved in immune modulation, inflammation, cell differentiation, and metabolic and development processes (Serena et al., 2020). Here, we show that m5C methylation modification patterns may function to reshape different metabolism processes and the immune TME landscape, and our results suggest that m5C modification may mediate the therapeutic efficacy of ICTs. The m5C score together with integrated signatures, including tumor mutation load, PD-L1 expression, T cell infiltration, and immune TME based on multiomics large-scale samples data, may represent an effective predictive treatment strategy. In clinical practice, the m5C score can be used to comprehensively assess the m5C methylation modification patterns as well as distinct immune cell infiltration of the TME within individuals, allowing for determination of the genetic landscape and immunophenotypes and effective clinical treatment of ccRCC.
In summary, this work reveals the general regulation mechanisms of DNA m5C methylation modification patterns on the tumor immune microenvironment. The m5C modification patterns have marked influences on intratumoral heterogeneity and the complexity of the individual TME. Comprehensive assessment of tumor m5C modification patterns enhances our understanding of TME cell-infiltrating characterizations and helps establish precision immunotherapy strategies for individual ccRCC patients.
This work reveals the general regulation mechanisms of DNA m5C methylation modification patterns on the tumor immune microenvironment. The different m5C modification patterns have marked influences on intratumoral heterogeneity and complexity of the individual TME. Comprehensive assessment of tumor m5C modification patterns may enhance our understanding of TME cell-infiltrating characterizations and help establish precision immunotherapy strategies for individual ccRCC patients.
The datasets presented in this study can be found in online repositories. The names of the repository/repositories and accession number(s) can be found in the article/Supplementary Material. The raw proteome data supporting the conclusions of this article will be made available by the authors, without undue reservation.
Written informed consent was obtained from the individual(s) for the publication of any potentially identifiable images or data included in this article.
Conceptualization: WX, WZ, XT, and WL. Data curation and formal analysis: WX, WZ, XT, AA, YW, WL, and JS. Funding acquisition: SW, WX, YQ, HZ, and DY. Investigation and methodology: WX, WZ, AA, WZ, YW, and WL. Resources and software: WL, WS, YQ, HZ, YW, and DY. Supervision: YQ, SW, HZ, and DY. Validation and visualization: WX, WL, WZ, XT, and AA. Original draft: WX, WS, YW, and WL. Editing: WS, YQ, HZ, and DY.
This work is supported by Grants from the National Key Research and Development Project (No.2019YFC1316000), “Fuqing Scholar” Student Scientific Research Program of Shanghai Medical College, Fudan University (No. FQXZ202112B), the Natural Science Foundation of Shanghai (No.20ZR1413100) and Shanghai Municipal Health Bureau (No.2020CXJQ03).
The authors declare that the research was conducted in the absence of any commercial or financial relationships that could be construed as a potential conflict of interest.
All claims expressed in this article are solely those of the authors and do not necessarily represent those of their affiliated organizations, or those of the publisher, the editors and the reviewers. Any product that may be evaluated in this article, or claim that may be made by its manufacturer, is not guaranteed or endorsed by the publisher.
We are grateful to all patients for their dedicated participation in the current study. We expressed our sincere gratitude to Ms. ZOO for editing figures. We thank Gabrielle White Wolf, PhD, from Liwen Bianji (Edanz) (www.liwenbianji.cn/) for editing the English text of a draft of this manuscript.
The Supplementary Material for this article can be found online at: https://www.frontiersin.org/articles/10.3389/fcell.2021.772436/full#supplementary-material
ccRCC, clear cell renal cell carcinoma; CI, confidence interval; CNV, copy numbers variation; CPTAC, Clinical Proteomic Tumor Analysis Consortium; DEGs, differentially expressed genes; FUSCC, Fudan University Shanghai Cancer Center; GSEA, gene set enrichment analysis; GSVA, gene set variation analysis; HE, hematoxylin-eosin; HR, hazard ratio; ICTs, immune checkpoint therapies; ICGC, International Cancer Genome Consortium; IHC, immunohistochemistry; RCC, renal cell carcinoma; ROC, receiver operating characteristic curve; SNP, single nucleotide polypeptides; TCGA, The Cancer Genome Atlas; TME, tumor microenvironment.
Bai, L., Yang, G., Qin, Z., Lyu, J., Wang, Y., Feng, J., et al. (2021). Proteome‐Wide Profiling of Readers for DNA Modification. Adv. Sci. 8, 2101426. doi:10.1002/advs.202101426
Bates, S. E. (2020). Epigenetic Therapies for Cancer. N. Engl. J. Med. 383, 650–663. doi:10.1056/NEJMra1805035
Beroukhim, R., Getz, G., Nghiemphu, L., Barretina, J., Hsueh, T., Linhart, D., et al. (2007). Assessing the Significance of Chromosomal Aberrations in Cancer: Methodology and Application to Glioma. Proc. Natl. Acad. Sci. 104, 20007–20012. doi:10.1073/pnas.0710052104
Braun, D. A., Hou, Y., Bakouny, Z., Ficial, M., Sant’ Angelo, M., Forman, J., et al. (2020). Interplay of Somatic Alterations and Immune Infiltration Modulates Response to PD-1 Blockade in Advanced clear Cell Renal Cell Carcinoma. Nat. Med. 26, 909–918. doi:10.1038/s41591-020-0839-y
Capitanio, U., and Montorsi, F. (2016). Renal Cancer. The Lancet 387, 894–906. doi:10.1016/S0140-6736(15)00046-X
Charoentong, P., Finotello, F., Angelova, M., Mayer, C., Efremova, M., Rieder, D., et al. (2017). Pan-cancer Immunogenomic Analyses Reveal Genotype-Immunophenotype Relationships and Predictors of Response to Checkpoint Blockade. Cel Rep. 18, 248–262. doi:10.1016/j.celrep.2016.12.019
Chen, X., Li, A., Sun, B.-F., Yang, Y., Han, Y.-N., Yuan, X., et al. (2019). 5-methylcytosine Promotes Pathogenesis of Bladder Cancer through Stabilizing mRNAs. Nat. Cel Biol 21, 978–990. doi:10.1038/s41556-019-0361-y
Choi, W. L., Mok, Y. G., and Huh, J. H. (2021). Application of 5-Methylcytosine DNA Glycosylase to the Quantitative Analysis of DNA Methylation. Ijms 22, 1072. doi:10.3390/ijms22031072
Clark, D. J., Dhanasekaran, S. M., Petralia, F., Pan, J., Song, X., Hu, Y., et al. (2019). Integrated Proteogenomic Characterization of Clear Cell Renal Cell Carcinoma. Cell 179, 964–e31. doi:10.1016/j.cell.2019.10.007
D'Avella, C., Abbosh, P., Pal, S. K., and Geynisman, D. M. (2020). Mutations in Renal Cell Carcinoma. Urol. Oncol. Semin. Original Invest. 38, 763–773. doi:10.1016/j.urolonc.2018.10.027
Gajewski, T. F., Woo, S.-R., Zha, Y., Spaapen, R., Zheng, Y., Corrales, L., et al. (2013). Cancer Immunotherapy Strategies Based on Overcoming Barriers within the Tumor Microenvironment. Curr. Opin. Immunol. 25, 268–276. doi:10.1016/j.coi.2013.02.009
Gallan, A. J., Parilla, M., Segal, J., Ritterhouse, L., and Antic, T. (2021). BAP1-Mutated Clear Cell Renal Cell Carcinoma. Am. J. Clin. Pathol. 155, 718–728. doi:10.1093/ajcp/aqaa176
Greenberg, M. V. C., and Bourc’his, D. (2019). The Diverse Roles of DNA Methylation in Mammalian Development and Disease. Nat. Rev. Mol. Cel Biol 20, 590–607. doi:10.1038/s41580-019-0159-6
Hänzelmann, S., Castelo, R., and Guinney, J. (2013). GSVA: Gene Set Variation Analysis for Microarray and RNA-Seq Data. BMC bioinformatics 14, 7. doi:10.1186/1471-2105-14-7
Jiang, P., Gu, S., Pan, D., Fu, J., Sahu, A., Hu, X., et al. (2018). Signatures of T Cell Dysfunction and Exclusion Predict Cancer Immunotherapy Response. Nat. Med. 24, 1550–1558. doi:10.1038/s41591-018-0136-1
Jonasch, E., Walker, C. L., and Rathmell, W. K. (2021). Clear Cell Renal Cell Carcinoma Ontogeny and Mechanisms of Lethality. Nat. Rev. Nephrol. 17, 245–261. doi:10.1038/s41581-020-00359-2
Kim, J. M., and Chen, D. S. (2016). Immune Escape to PD-L1/pd-1 Blockade: Seven Steps to success (Or Failure). Ann. Oncol. 27, 1492–1504. doi:10.1093/annonc/mdw217
Linehan, W. M., and Ricketts, C. J. (2019). The Cancer Genome Atlas of Renal Cell Carcinoma: Findings and Clinical Implications. Nat. Rev. Urol. 16, 539–552. doi:10.1038/s41585-019-0211-5
Martisova, A., Holcakova, J., Izadi, N., Sebuyoya, R., Hrstka, R., and Bartosik, M. (2021). DNA Methylation in Solid Tumors: Functions and Methods of Detection. Ijms 22, 4247. doi:10.3390/ijms22084247
Mehdi, A., and Rabbani, S. A. (2021). Role of Methylation in Pro- and Anti-cancer Immunity. Cancers 13, 545. doi:10.3390/cancers13030545
Mermel, C. H., Schumacher, S. E., Hill, B., Meyerson, M. L., Beroukhim, R., and Getz, G. (2011). GISTIC2.0 Facilitates Sensitive and Confident Localization of the Targets of Focal Somatic Copy-Number Alteration in Human Cancers. Genome Biol. 12, R41. doi:10.1186/gb-2011-12-4-r41
Miao, D., Margolis, C. A., Gao, W., Voss, M. H., Li, W., Martini, D. J., et al. (2018). Genomic Correlates of Response to Immune Checkpoint Therapies in clear Cell Renal Cell Carcinoma. Science 359, 801–806. doi:10.1126/science.aan5951
Motzer, R. J., Jonasch, E., Boyle, S., Carlo, M. I., Manley, B., Agarwal, N., et al. (2020). NCCN Guidelines Insights: Kidney Cancer, Version 1.2021. J. Natl. Compr. Canc Netw. 18, 1160–1170. doi:10.6004/jnccn.2020.0043
Palei, S., Buchmuller, B., Wolffgramm, J., Muñoz-Lopez, Á., Jung, S., Czodrowski, P., et al. (2020). Light-Activatable TET-Dioxygenases Reveal Dynamics of 5-Methylcytosine Oxidation and Transcriptome Reorganization. J. Am. Chem. Soc. 142, 7289–7294. doi:10.1021/jacs.0c01193
Paz, M. F., Fraga, M. F., Avila, S., Guo, M., Pollan, M., Herman, J. G., et al. (2003). A Systematic Profile of DNA Methylation in Human Cancer Cell Lines. Cancer Res. 63, 1114–1121.
Piperi, C., Vlastos, F., Farmaki, E., Martinet, N., and Papavassiliou, A. G. (2008). Epigenetic Effects of Lung Cancer Predisposing Factors Impact on Clinical Diagnosis and Prognosis. J. Cell. Mol. Med. 12, 1495–1501. doi:10.1111/j.1582-4934.2008.00309.x
Qian, S., Sun, S., Zhang, L., Tian, S., Xu, K., Zhang, G., et al. (2020). Integrative Analysis of DNA Methylation Identified 12 Signature Genes Specific to Metastatic ccRCC. Front. Oncol. 10, 556018. doi:10.3389/fonc.2020.556018
Rausch, C., Hastert, F. D., and Cardoso, M. C. (2020). DNA Modification Readers and Writers and Their Interplay. J. Mol. Biol. 432, 1731–1746. doi:10.1016/j.jmb.2019.12.018
Ritchie, M. E., Phipson, B., Wu, D., Hu, Y., Law, C. W., Shi, W., et al. (2015). Limma powers Differential Expression Analyses for RNA-Sequencing and Microarray Studies. Nucleic Acids Res. 43 (7), e47. doi:10.1093/nar/gkv007
Saleh, R., Toor, S. M., Sasidharan Nair, V., and Elkord, E. (2020). Role of Epigenetic Modifications in Inhibitory Immune Checkpoints in Cancer Development and Progression. Front. Immunol. 11, 1469. doi:10.3389/fimmu.2020.01469
Serena, C., Millan, M., Ejarque, M., Saera-Vila, A., Maymó-Masip, E., Núñez-Roa, C., et al. (2020). Adipose Stem Cells from Patients with Crohn's Disease Show a Distinctive DNA Methylation Pattern. Clin. Epigenet 12, 53. doi:10.1186/s13148-020-00843-3
Siegel, R. L., Miller, K. D., and Jemal, A. (2020). Cancer Statistics. CA A. Cancer J. Clin. 70, 7–30. doi:10.3322/caac.21590
Smiline Girija, A. S. (2021). Protean Role of Epigenetic Mechanisms and Their Impact in Regulating the Tregs in TME. Cancer Gene Ther. online ahead of print. doi:10.1038/s41417-021-00371-z
Wang, L., Liu, Y., Beier, U. H., Han, R., Bhatti, T. R., Akimova, T., et al. (2013). Foxp3+ T-Regulatory Cells Require DNA Methyltransferase 1 Expression to Prevent Development of Lethal Autoimmunity. Blood 121, 3631–3639. doi:10.1182/blood-2012-08-451765
Wettersten, H. I., Hakimi, A. A., Morin, D., Bianchi, C., Johnstone, M. E., Donohoe, D. R., et al. (2015). Grade-Dependent Metabolic Reprogramming in Kidney Cancer Revealed by Combined Proteomics and Metabolomics Analysis. Cancer Res. 75, 2541–2552. doi:10.1158/0008-5472.CAN-14-1703
Wilkerson, M. D., and Hayes, D. N. (2010). ConsensusClusterPlus: a Class Discovery Tool with Confidence Assessments and Item Tracking. Bioinformatics 26, 1572–1573. doi:10.1093/bioinformatics/btq170
Xu, W.-H., Xu, Y., Wang, J., Wan, F.-N., Wang, H.-K., Cao, D.-L., et al. (2019). Prognostic Value and Immune Infiltration of Novel Signatures in clear Cell Renal Cell Carcinoma Microenvironment. Aging 11, 6999–7020. doi:10.18632/aging.102233
Xu, W., Anwaier, A., Ma, C., Liu, W., Tian, X., Palihati, M., et al. (2021). Multi-omics Reveals Novel Prognostic Implication of SRC Protein Expression in Bladder Cancer and its Correlation with Immunotherapy Response. Ann. Med. 53, 596–610. doi:10.1080/07853890.2021.1908588
Xu, W., Tian, X., Liu, W., Anwaier, A., Su, J., Zhu, W., et al. (2021). m6A Regulator-Mediated Methylation Modification Model Predicts Prognosis, Tumor Microenvironment Characterizations and Response to Immunotherapies of Clear Cell Renal Cell CarcinomaA Regulator-Mediated Methylation Modification Model Predicts Prognosis, Tumor Microenvironment Characterizations and Response to Immunotherapies of Clear Cell Renal Cell Carcinoma. Front. Oncol. 11, 709579. doi:10.3389/fonc.2021.709579
Young, M. D., Mitchell, T. J., Vieira Braga, F. A., Tran, M. G. B., Stewart, B. J., Ferdinand, J. R., et al. (2018). Single-cell Transcriptomes from Human Kidneys Reveal the Cellular Identity of Renal Tumors. Science 361, 594–599. doi:10.1126/science.aat1699
Zagorac, S., Alcala, S., Fernandez Bayon, G., Bou Kheir, T., Schoenhals, M., González-Neira, A., et al. (2016). DNMT1 Inhibition Reprograms Pancreatic Cancer Stem Cells via Upregulation of the miR-17-92 Cluster. Cancer Res. 76, 4546–4558. doi:10.1158/0008-5472.CAN-15-3268
Keywords: clear cell renal cell carcinoma, 5-methylcytosine, tumor microenvironment, renal cell carcinoma (RCC) clear cell renal cell carcinoma (CCRCC), immune checkpoint therapies, prognosis, machine learning algorithm
Citation: Xu W, Zhu W, Tian X, Liu W, Wu Y, Anwaier A, Su J, Wei S, Qu Y, Zhang H and Ye D (2021) Integrative 5-Methylcytosine Modification Immunologically Reprograms Tumor Microenvironment Characterizations and Phenotypes of Clear Cell Renal Cell Carcinoma. Front. Cell Dev. Biol. 9:772436. doi: 10.3389/fcell.2021.772436
Received: 08 September 2021; Accepted: 01 November 2021;
Published: 08 December 2021.
Edited by:
Chunjie Jiang, University of Pennsylvania, United StatesReviewed by:
Youyang Shi, Shanghai University of Traditional Chinese Medicine, ChinaCopyright © 2021 Xu, Zhu, Tian, Liu, Wu, Anwaier, Su, Wei, Qu, Zhang and Ye. This is an open-access article distributed under the terms of the Creative Commons Attribution License (CC BY). The use, distribution or reproduction in other forums is permitted, provided the original author(s) and the copyright owner(s) are credited and that the original publication in this journal is cited, in accordance with accepted academic practice. No use, distribution or reproduction is permitted which does not comply with these terms.
*Correspondence: Shiyin Wei, eWp3ZWlzaGl5aW5AMTYzLmNvbQ==; Yuanyuan Qu, cXV5eTE5ODdAMTYzLmNvbQ==; Hailiang Zhang, emhhbmdobDkxOEAxNjMuY29t; Dingwei Ye, ZHd5ZWxpZUAxNjMuY29t
†These authors have contributed equally to this work
Disclaimer: All claims expressed in this article are solely those of the authors and do not necessarily represent those of their affiliated organizations, or those of the publisher, the editors and the reviewers. Any product that may be evaluated in this article or claim that may be made by its manufacturer is not guaranteed or endorsed by the publisher.
Research integrity at Frontiers
Learn more about the work of our research integrity team to safeguard the quality of each article we publish.