 Yan Zhang1,2
 Xianfeng Fang
- 1Department of Dermatology, The First College of Clinical Medical Sciences, China Three Gorges University, Yichang, China
- 2Department of Dermatology, Yichang Central People’s Hospital, Yichang, China
Purpose: Our aim was to construct a signature that accurately predicted the prognostic and immune response of melanoma.
Methods: First, the weighted co-expression network analysis (WGCNA) algorithm was used to identify the hub genes related to clinical phenotypes of melanoma in the cancer genome atlas (TCGA) database. Nest, the least absolute shrinkage and selection operator (LASSO) analysis was used to dimensionality reduction of these hub genes and constructed a prognostic signature to predict the prognosis and immunosuppressive response of melanoma.
Result: Through in-depth analysis, we constructed a 5-mRNA prognostic signature and verified its prognostic value in internal (TCGA-SKCM, n = 452) and external independent datasets (GSE53118, n = 79). Based on this signature, the tumor immune microenvironment (TME) of melanoma was characterized, and the result was found that patients in the high-risk group had lower CD8 T cell infiltration and immune checkpoint expression (PD-1, PD-L1, CTLA4), as well as higher M0/M2 macrophage infiltration. Our results also found the risk score based on a 5-mRNA signature was significantly associated with tumor mutational burden (TMB) and tumor stem cell markers (CD20, CD38, ABCB5, CD44, etc.). Lastly, we built a nomogram for clinician prediction for the prognosis of patients with melanoma.
Conclusion: Our findings indicated that the 5-mRNA signature has an important predictive value for the overall survival of melanoma. By analyzing the tumor immune microenvironment and tumor stem cell marker between different groups, a new method is provided for the stratified diagnosis and treatment of melanoma.
Introduction
Melanoma is one of the most aggressive and fatal forms of skin tumor, although it accounts for about 4% of all skin cancers, its mortality rate is as high as 80% (Kim et al., 2019). Melanoma can invade within any tissue containing melanocytes, especially in the skin (Guo et al., 2016). Surgery, radiation therapy, and chemotherapy are common treatments for melanoma. For patients with primary melanoma, the 5-year survival rate can reach up to 95%. However, for patients with metastatic melanoma, the 5-year survival rate is less than 10% due to the high rate of recurrence and lack of efficient biomarkers (Schadendorf et al., 2018). Fortunately, the molecular characterizations of melanoma have achieved considerable advances. Current research shows that BRAF, NRAS, and C-Kit genes are closely related to the pathogenesis of melanoma (Ponti et al., 2017). As an emerging treatment in recent years, PD-1 has been shown to significantly improve the survival rate of melanoma patients. The identification of effective biomarkers that can estimate responses to immunotherapy for melanoma has become a new trend of research. Melanoma with BRAF mutations appears to benefit from targeted BRAF and MEK therapy. Moreover, PD-L1 can predict which patients will benefit from targeting CTLA-4 (Ponti et al., 2017).
In this study, by constructing a WGCNA network, we grouped some genes with the same characteristics into the same cluster. Next, we calculated the correlations of all clusters with some important clinical phenotype data. Then, after a battery of screening tests, we developed and used independent external data to validate a 5-mRNA signature that predicted melanoma prognosis. Univariate and multivariate Cox regression analyses combined with key clinical characteristics were used to construct a graph that clinicians can use to predict the prognosis of melanoma. Finally, we found significant associations between risk scores and melanoma immune microenvironment and tumor stem cell markers.
Materials and Methods
Data Collection and Data Preprocessing
Transcriptome (n = 472) and clinical feature data (n = 477) were downloaded from the UCSC dataset.1 The RNA-seq data included 471 melanoma samples and 1 normal skin sample. The clinical information of melanoma samples included survival events, tumor staging, grade, Breslow depth value, and Clark level value. We selected samples (n = 472) with both RNA-seq data and clinical phenotype data for subsequent analysis. Later, when building the Lasso regression model, we only retained samples (n = 452) containing both RNA-seq data and survival data for analysis. We installed a 2:1 ratio to randomly group these samples as the training set (n = 301) and internal validation set (n = 151), respectively. All the data used for survival analysis comes from an attachment to an article (Liu et al., 2018). The somatic mutation data (MuTect2 Variant Aggregation and Masking) were also downloaded from this website. We built a flow chart for the whole process of the experiment (Figure 1). We converted our downloaded RNA-seq data (FPKM values) into TPM values, which makes the samples more comparable (Wagner et al., 2012). To filter out genes whose expression has not changed much, we then selected the genes in the top 25% (n = 4,939) of the variance for subsequent analysis. For the processing of externally validated data from the GEO database, we download public data from the GEO database, then RMA corrected, standardized, and then logarithmic.
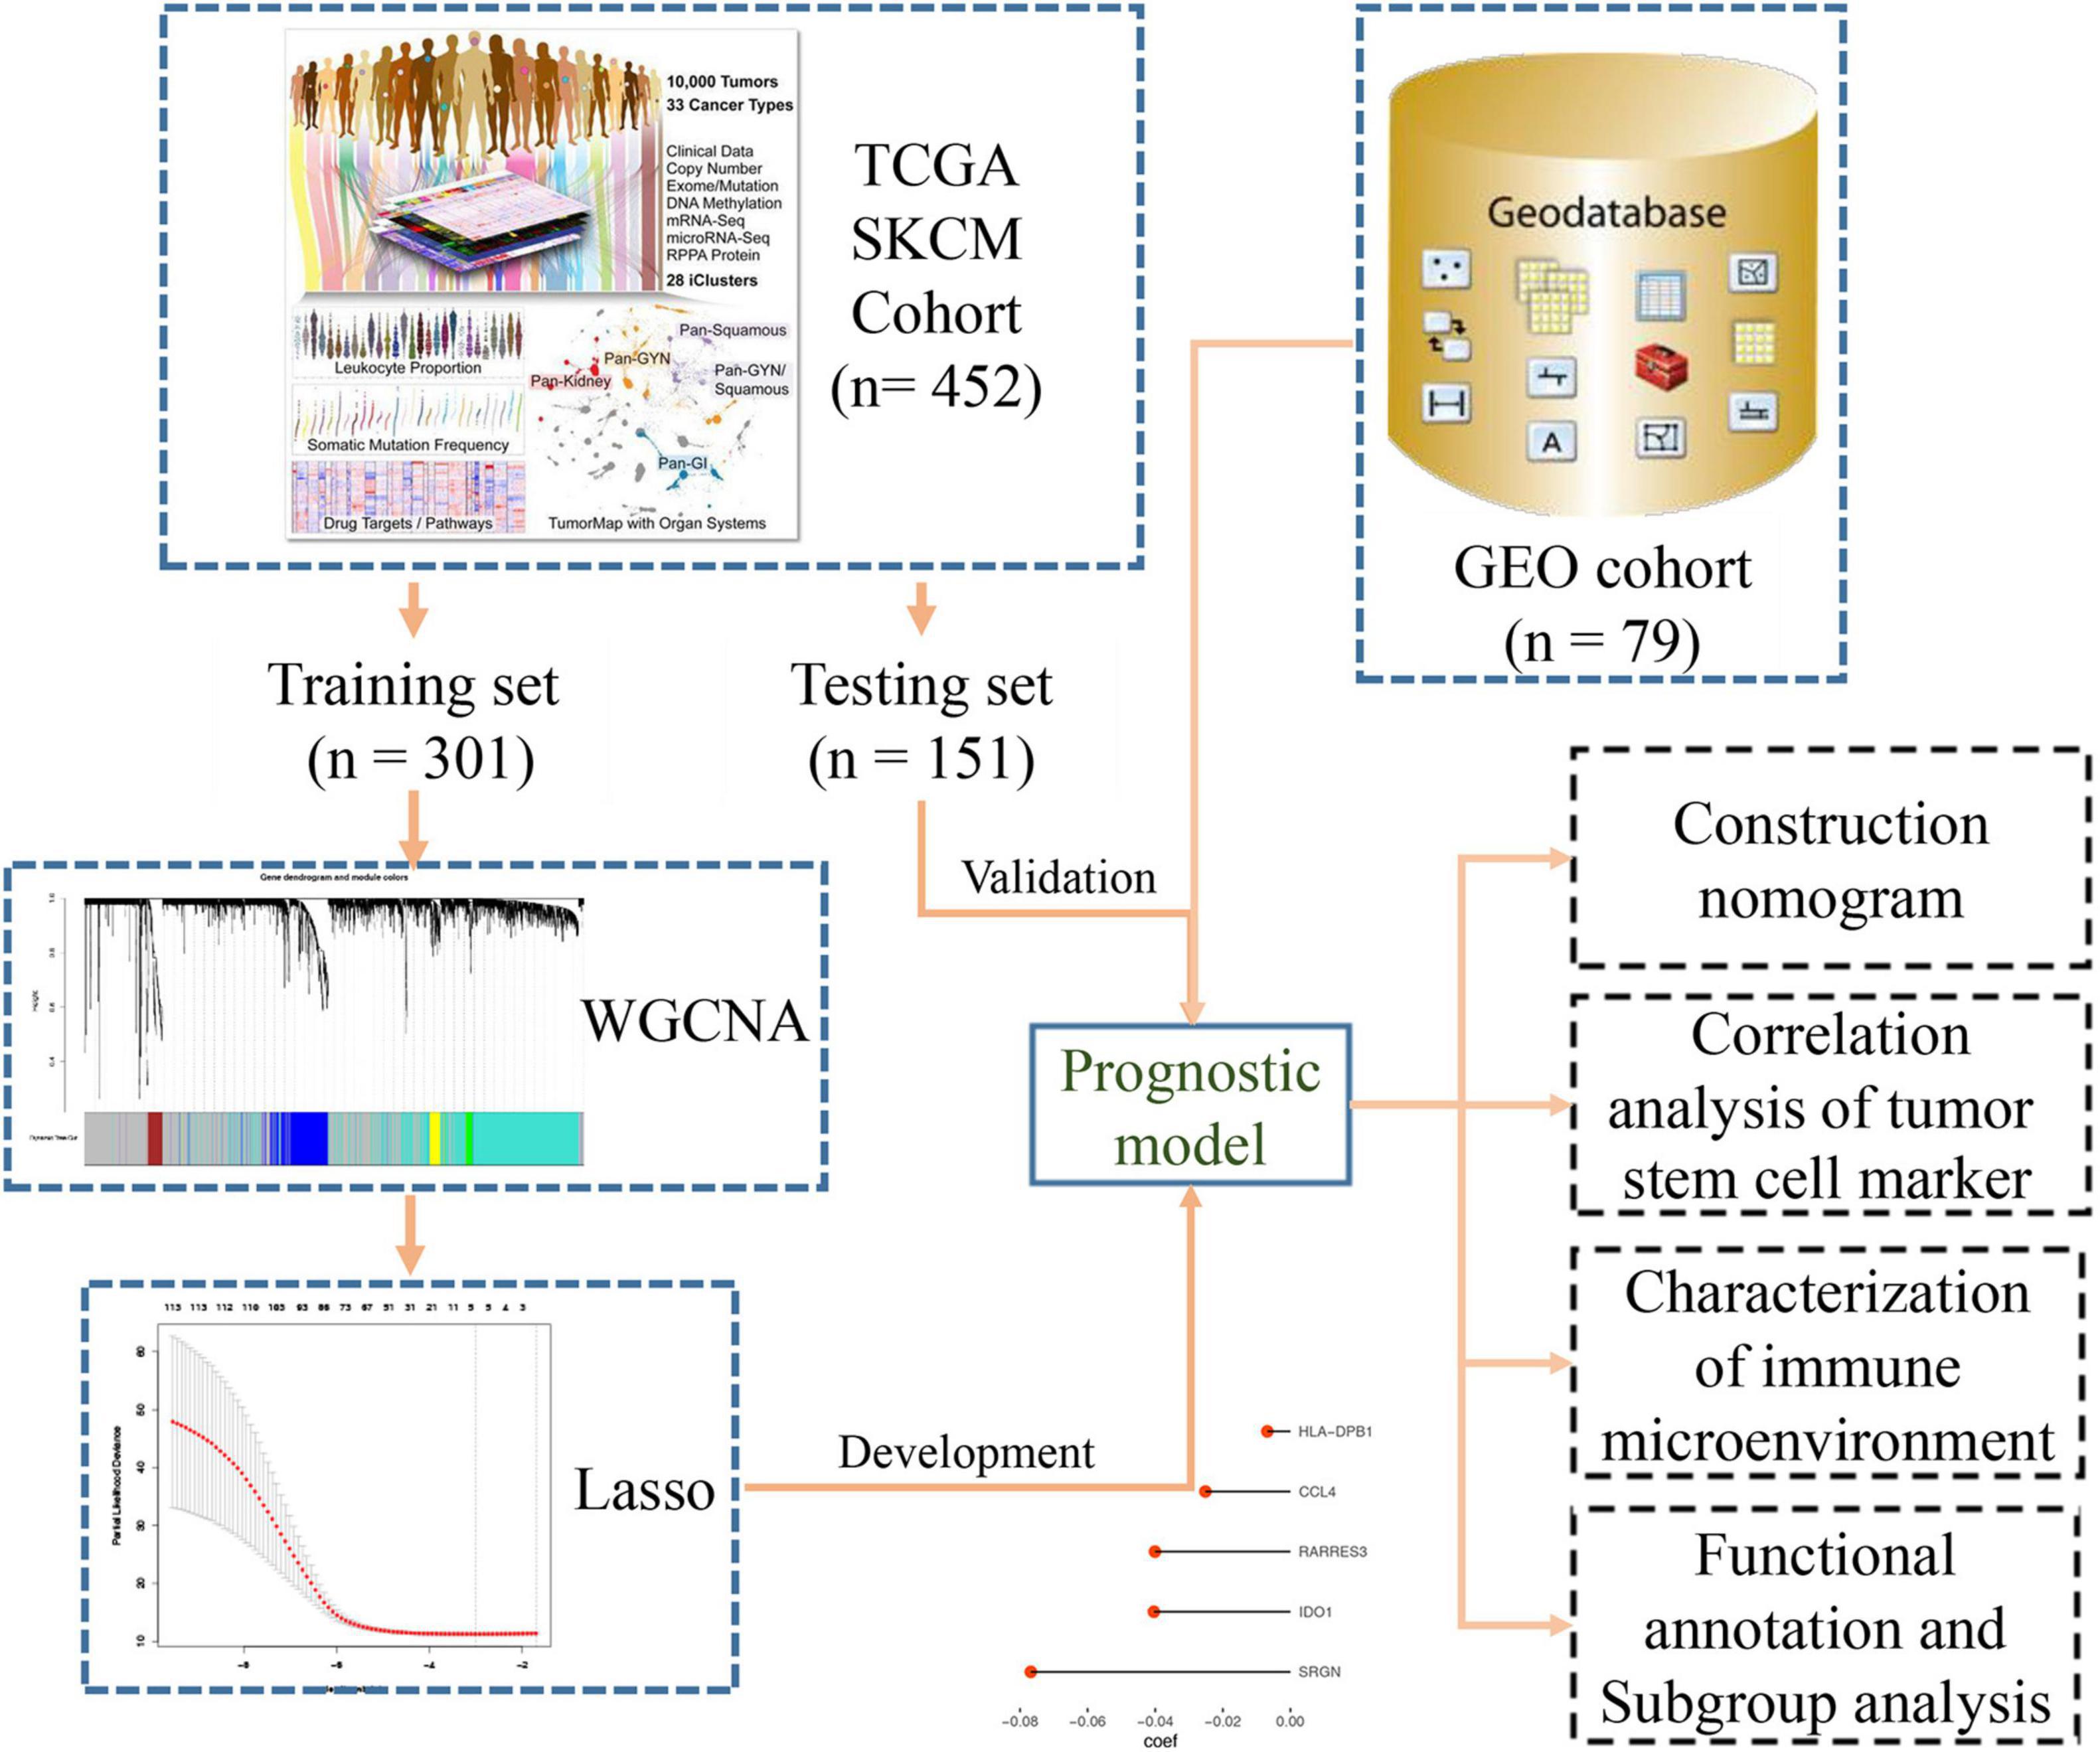
Figure 1. Flow diagram of the study.
Establishment of a Co-expression Network
We used those genes from one step to build a co-expression network by the R package “WGCNA” (Langfelder and Horvath, 2008). First, the Pearson correlation coefficient between samples is calculated to remove abnormal samples (Supplementary Figure 1). Then we constructed an adjacency matrix through the use of Pearson’s correlation analysis for all pairs of genes. Finally, by associating the modules with the clinical features, we selected the modules most relevant to the clinical features of greatest concern for subsequent analysis. We defined the cor.geneModuleMembership > 0.8 and cor.geneTraitSignificance > 0.2 as the threshold for screening hub genes in a module.
Functional Annotation
We uploaded all the genes of the blue module to DAVID’s website2 for GO analysis and KEGG analysis. In order to understand the enrichment of signal pathways in the classification of the 5-mRNA signature, the gene set enrichment analysis (GSEA) was carried out with R package “ClusterProfiler.”
Immune Infiltration and Tumor Stem Cell Related Analysis
The mutation frequency less than 0.05 and synonymous mutations were removed. We used CIBERSORT (Newman et al., 2015) online software to quantify the immune infiltration of BLCA-SKCM based on deconvolution algorithm. The LM-22 gene signature which included 22 types of human immune cell was used as the set of reference gene-expression values to perform immune infiltration analysis. The R package “estimate” (Yoshihara et al., 2013) was used to quantify the stromal and immune cell admixture, stromal cells and immune cells were the main components of normal cells in tumor tissue. The association between tumor stem cell markers (CD20, ABCB5, CD38, etc.) and risk score was calculated using Pearson’s correlation analysis.
Statistical Analysis
We use R package “survival” for univariate and multivariate analysis, R package “forestplot” for forest map, and then R package “rms” for the nomogram. The calibration curve and the decision curve analysis performed by R package “rmda” were used to measure the accuracy of the nomogram. The statistical test method of the two groups of data involved in this paper was the t-test, which used the two-sample t-test and the Welch two-sample t-test, respectively, according to whether the variance was homogeneous. The statistical method used for all survival analyses was the Log-rank test.
Results
Co-expression Network Analysis
The R package of “WGCNA” is used to perform co-expression network analysis. The Pearson correlation analysis was used to detect the outlier samples and we found 8 samples were outlier samples, then we removed them (Supplementary Figure 1). The 4,939 genes with the first 25% variance were put with similar expression patterns into modules by cluster analysis. The power of β = 10 was chosen for the soft-thresholding to develop a scale-free network (scale-free R2 = 0.91, Supplementary Figure 2).
We finally got six modules, among which the blue module showed a strong negative correlation with the Breslow depth (r = −0.32, p = 3e-12). It also showed a strong negative correlation with the Clark level (r = −0.22, p = 1e-06) and the T stage (r = −0.25, p = 6e-08, Figure 2A). So, we finally chose the blue module as our focus, and then finally we got 116 hub genes (Figure 2B).
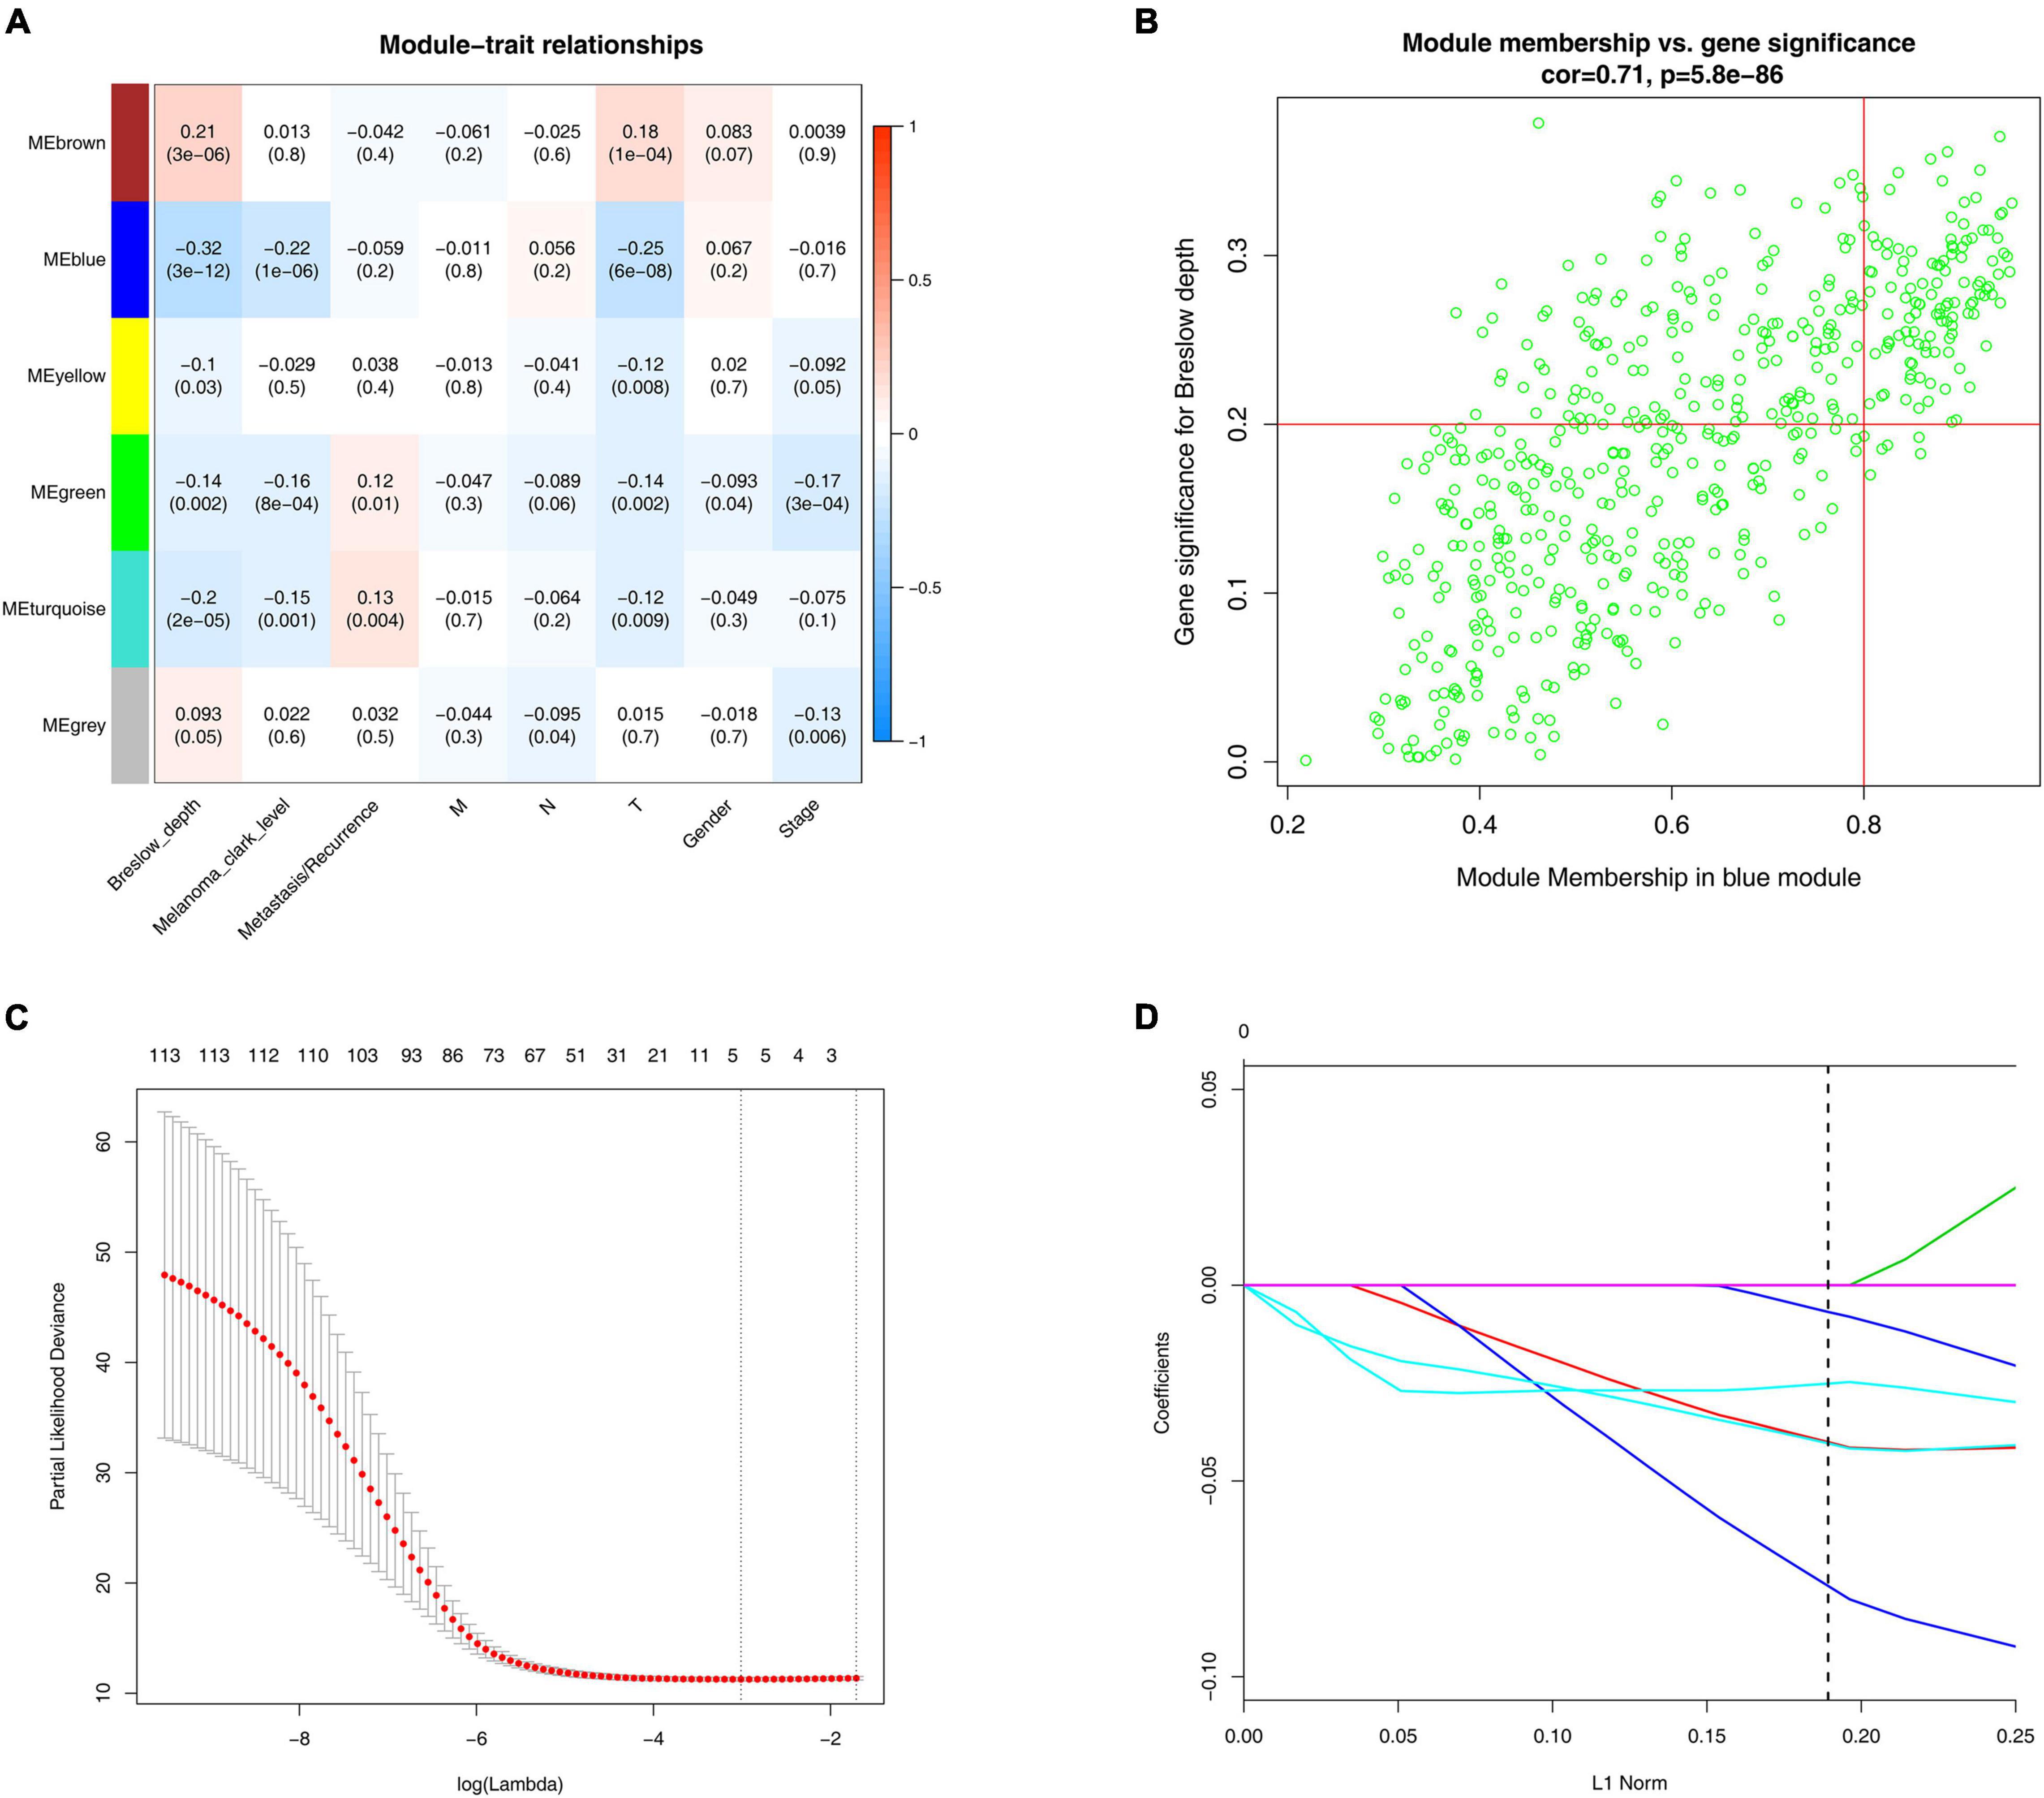
Figure 2. WGCNA and LASSO analysis. (A) Identification of modules associated with the clinical traits of melanoma. Heatmap of the correlation between module eigengenes and clinical traits of melanoma. (B) Scatter plot of module eigengenes related to Breslow depth in the blue module. (C) Tenfold cross-validation for parameter chosen. Here, λ = 0.049 was chosen by 10-fold cross-validation. (D) Construction of prognosis signature based on the LASSO algorithm.
Establishment and Validation of the Signature
We constructed a prognosis signature based on 5-mRNA through LASSO algorithm (Figures 2C,D). In the training set (HR = 2.69, 95%CI: 1.94–3.71, p < 0.0001) and the external validation set (HR = 1.73, 95%CI: 0.96–3.10, p = 0.047), the prognostic model showed high predictive power. The risk score = −0.08 × SRGN expression value—0.04 × IDO1 expression value—0.04 × RARRES3 expression value—0.03 × CCL4 expression value—0.007 × HLA-DPB1 expression value. We grouped the population according to the median risk score. We found that the risk of death in the training set and the validation set increased significantly with the increase of the risk score (Figures 3A,D, the middle panels), and the genes used to construct the 5-mRNA prognosis signature decreased with the increase of the risk score (Figures 3A,D, the lower panels). The time-dependent ROC curve showed that the AUC of 1-, 3-, 5-, and 7-years was mostly greater than 0.65 (Figures 3B,E). Survival analysis also showed good predictive value of the signature; the high-risk group tended to have a worse prognosis (Figures 3C,F).
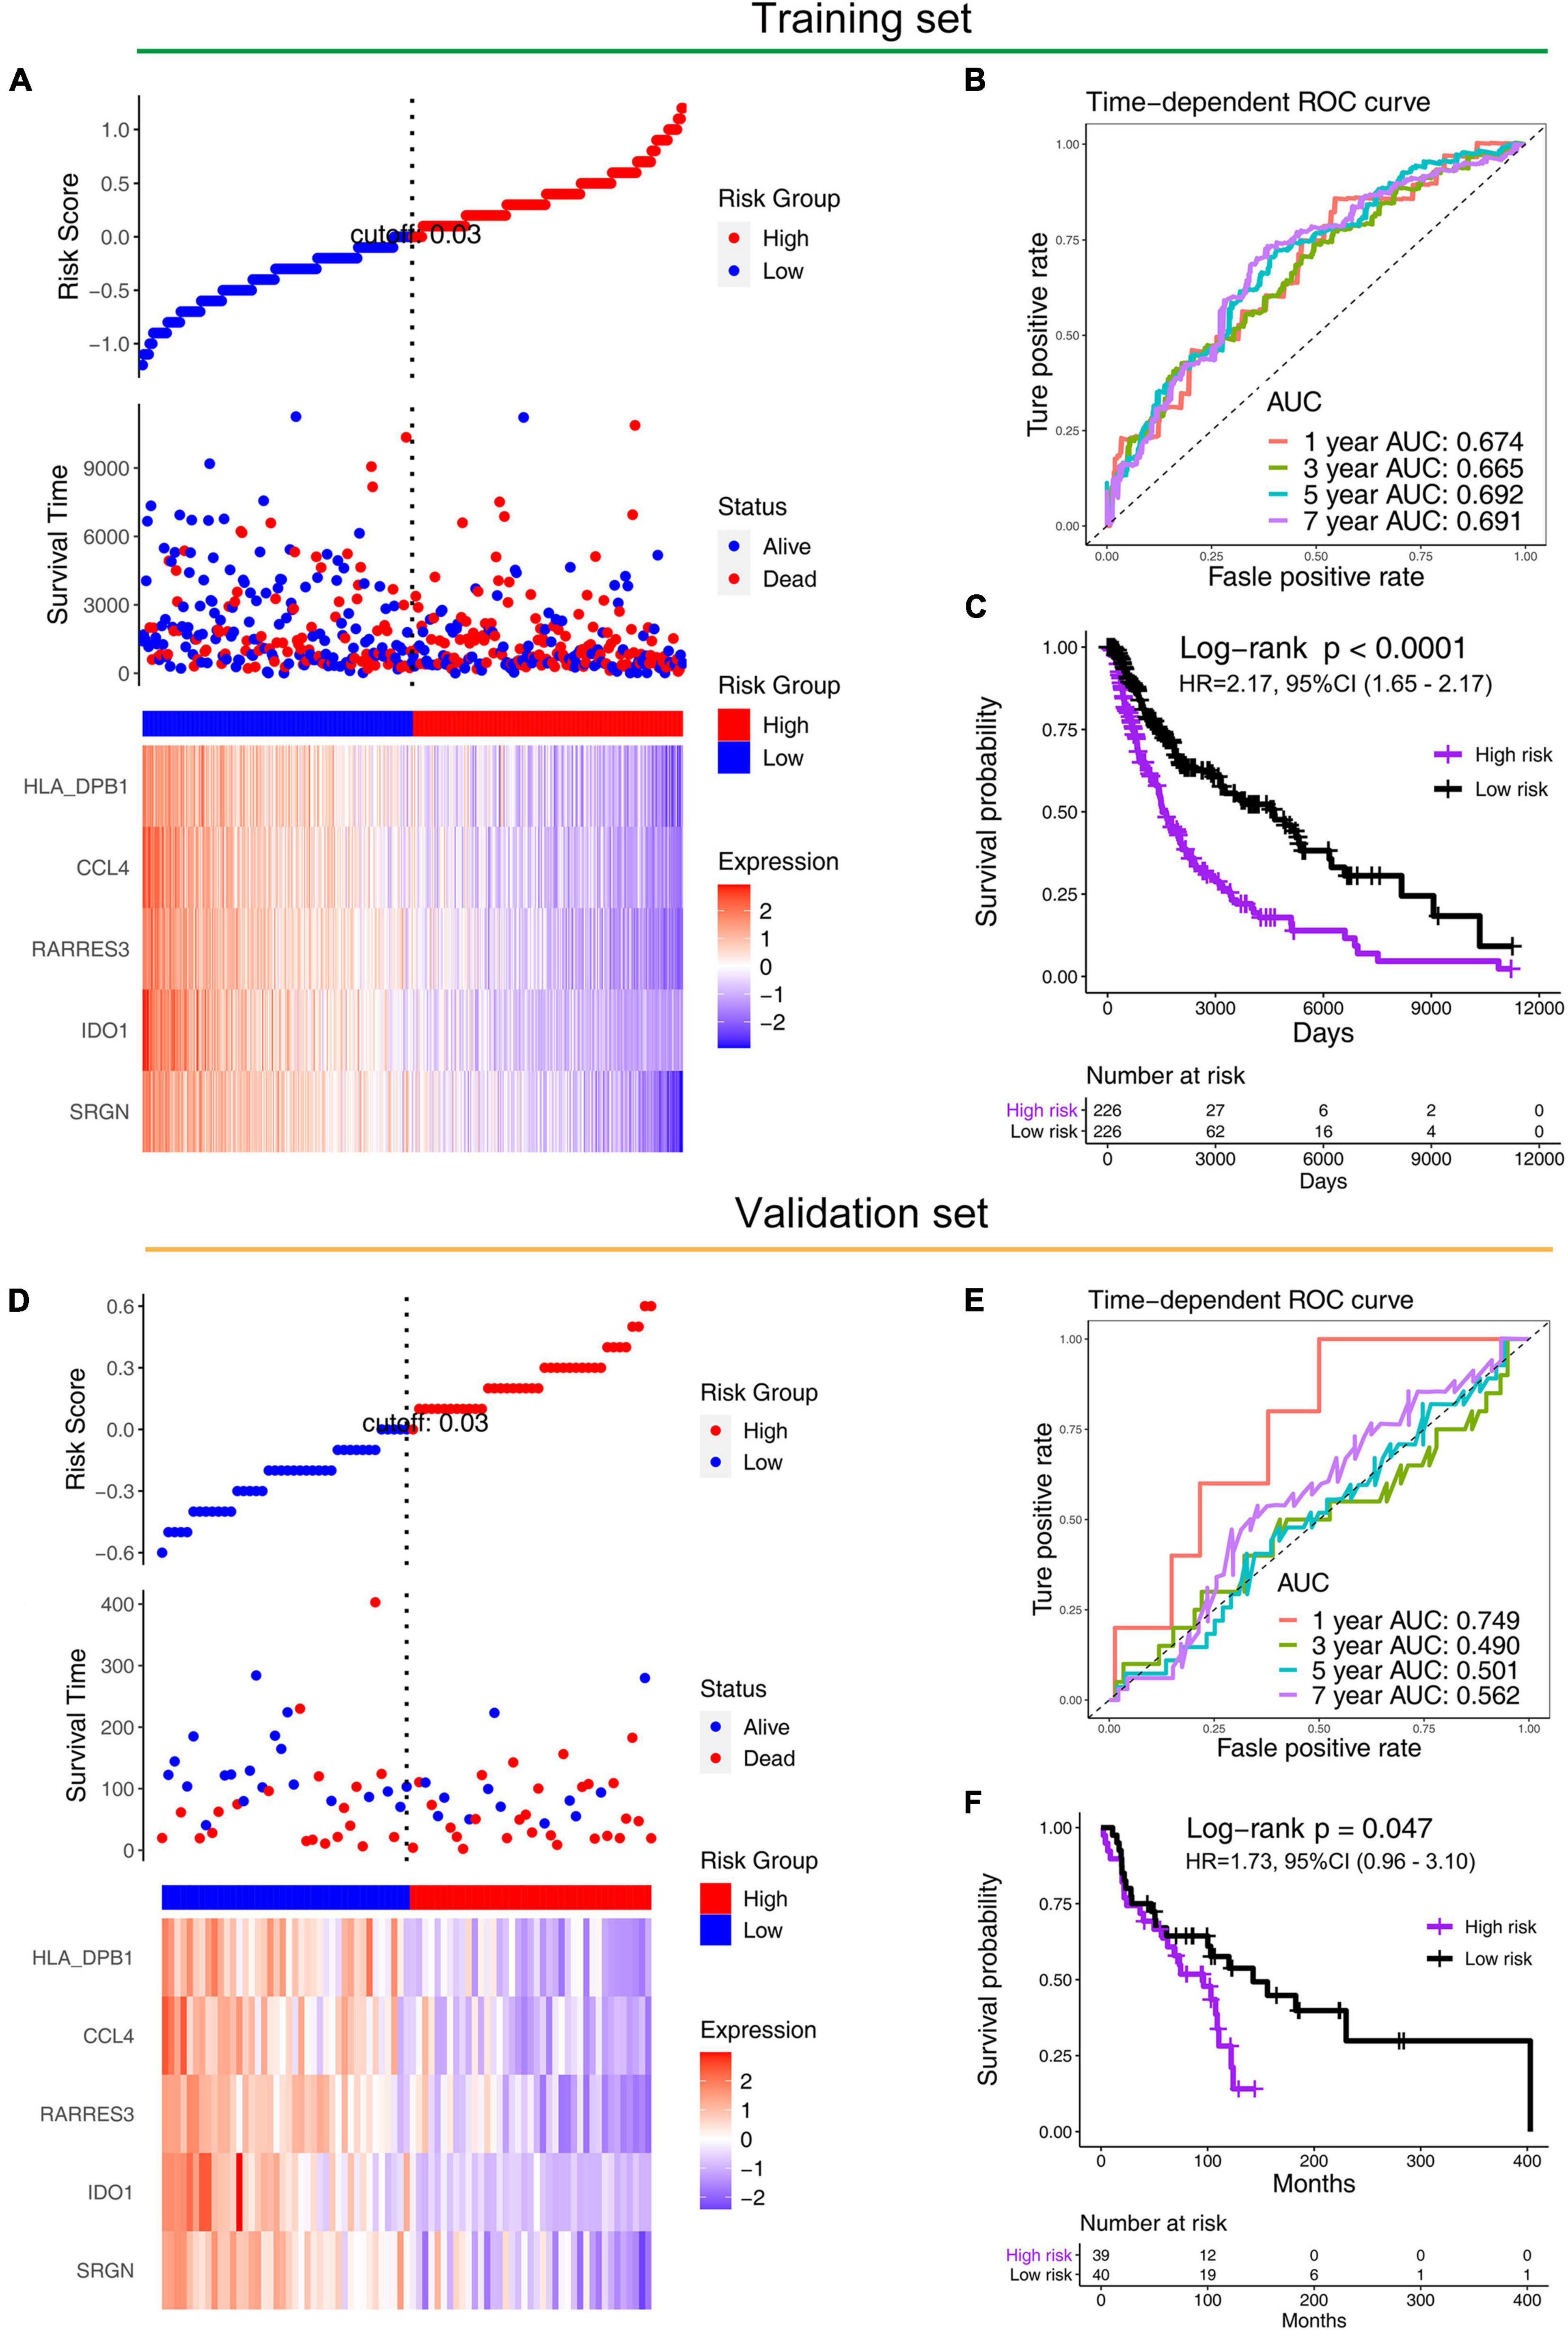
Figure 3. Performance of prognostic models in training (TCGA) and validation sets (GSE53118). Distribution of the risk scores (the upper panels), distribution of prognostic status (the middle panels), and distribution of 5-gene expression in the (A) training set and (D) validation set (the lower panels). The time-dependent ROC curve of prognostic model in the (B) training set and the (E) validation set. The Kaplan–Meier survival in the (C) training set and the (F) validation set.
Univariate and multivariate Cox regression analyses were performed to test the independence of the predictive power of risk scores. First, the signature risk score, TMN stage, gender, histologic stage, Breslow depth, and Clark level were performed with the univariate analysis (Figure 4A and Table 1), we found that risk score (HR = 5.05, p = 2.91e-11), Breslow depth (HR = 1.03, p = 6.98e-05), Clark level (HR = 1.74, p = 7.19e-07), T stage (HR = 1.33, p = 7.68e-07), N stage (HR = 1.31, p = 7.49e-05), and pathological stage (HR = 1.44, p = 1.42e-05) showed good predictive power of prognosis. Next, we put this factor to perform the multivariate analysis. The results showed that risk score was an independent predictor of melanoma risk (HR = 4.6, p = 8.77e-07, Figure 4B and Table 1). The subgroup analysis’s results exhibit the 5-mRNA signature showed good predictive value among different tumor stages and grades (Supplementary Figure 3). We also used the GEPIA database (Tang et al., 2017)3 to measure the prognostic value of the 5 genes in the signature. The results showed that all the 5 genes were protective factors for the prognosis of melanoma (Supplementary Figure 4).
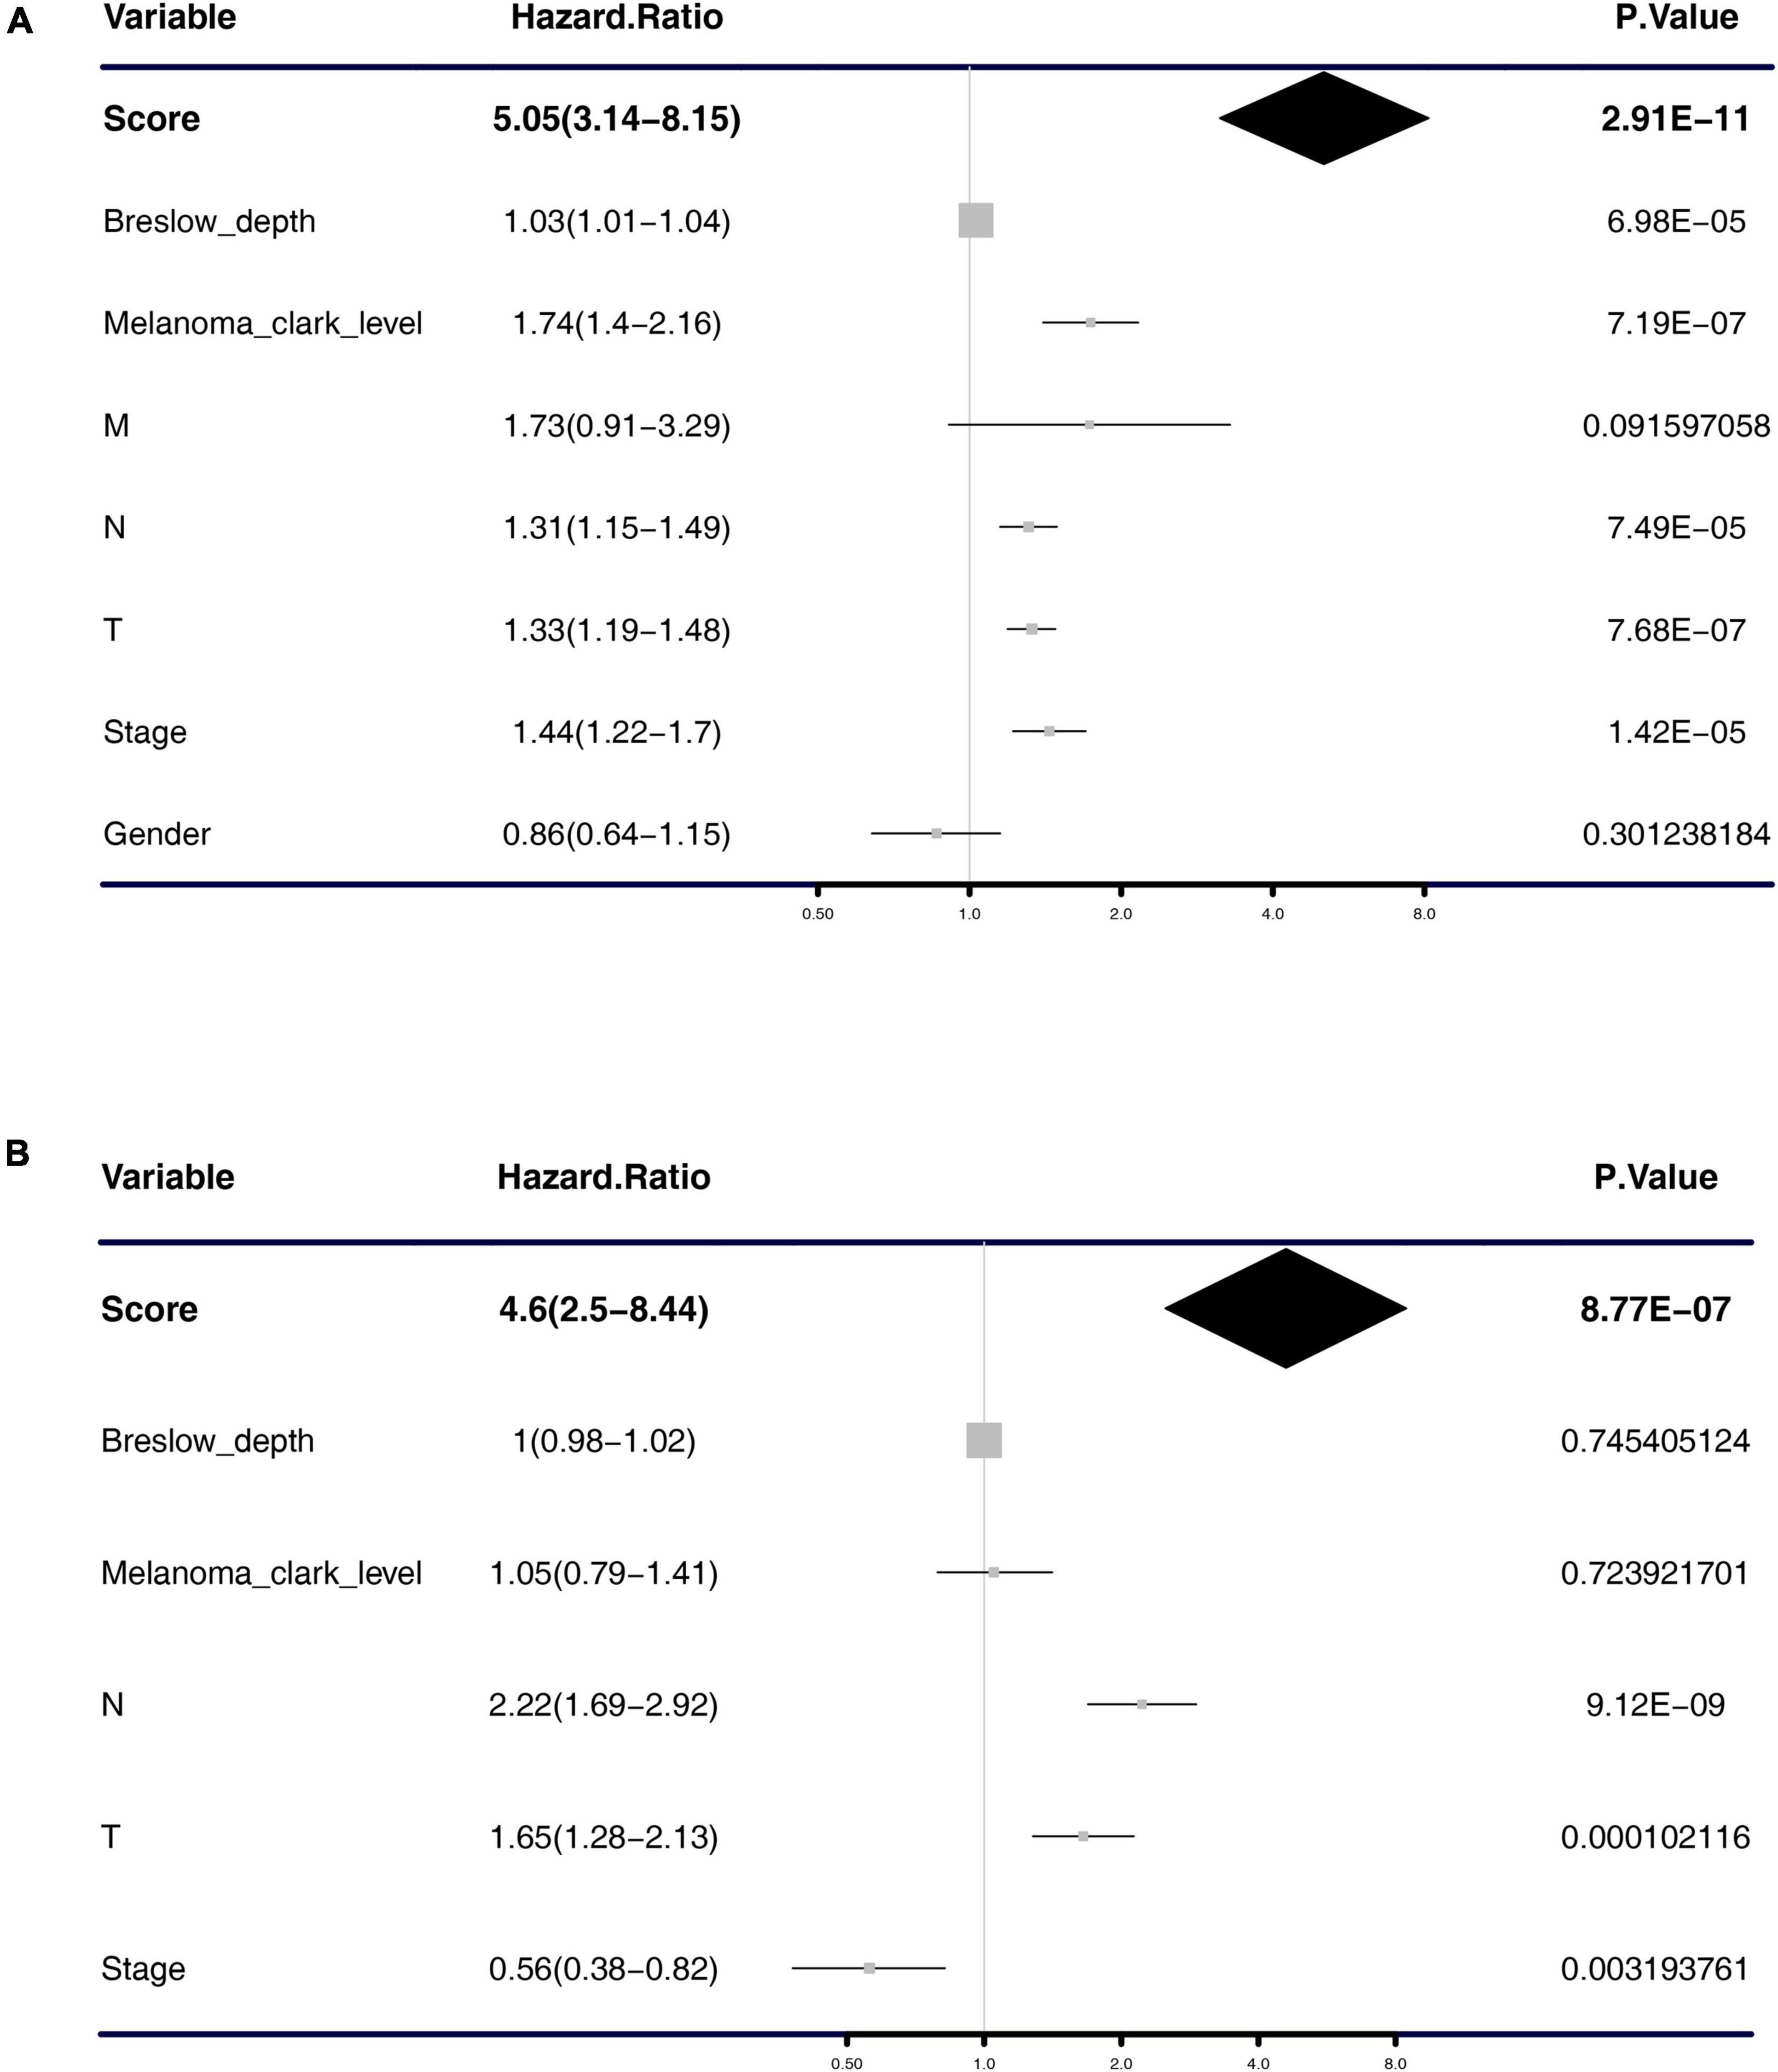
Figure 4. Forest plot of univariate and multivariate Cox regression analysis. Univariate analysis (A) and multivariate analysis (B) of the risk scores, Breslow depth, TNM classification, stage, etc.
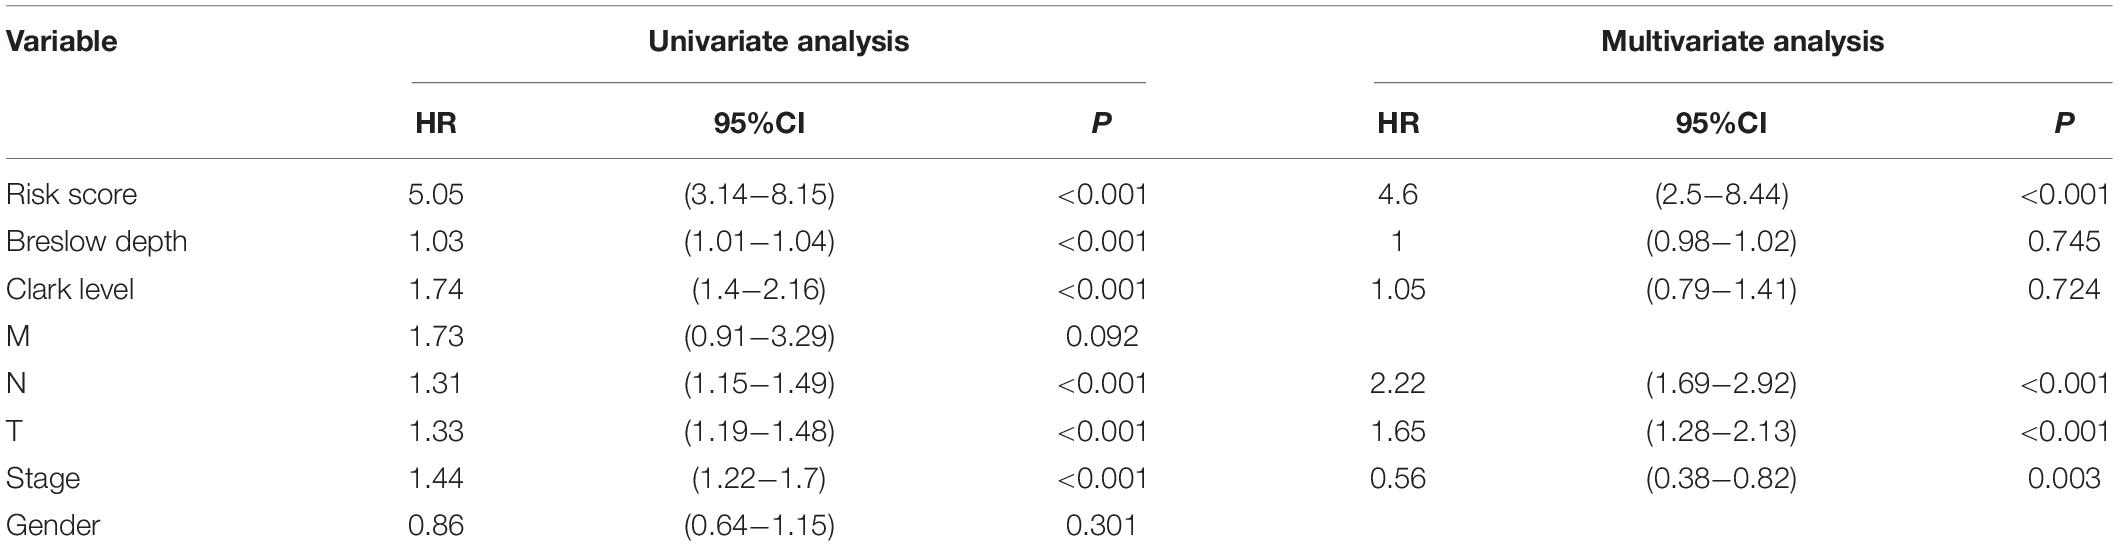
Table 1. Univariate analysis and multivariate analysis of the immune-related signature.
The Construction of the Nomogram and Its Accuracy Verification
From the results of the previous step, we constructed a nomogram combining the risk score and important clinical characteristics (Figure 5A). The calibration curve showed that the predictive power of the nomogram at 1, 3, and 5 years was accurate (Figures 5B–D). The DCA indicated the clinical utility of the nomogram was well, the risk score had a better net benefit compared to tumor stage, and the combination of the two had a better net benefit than either of the two (Figure 5E).
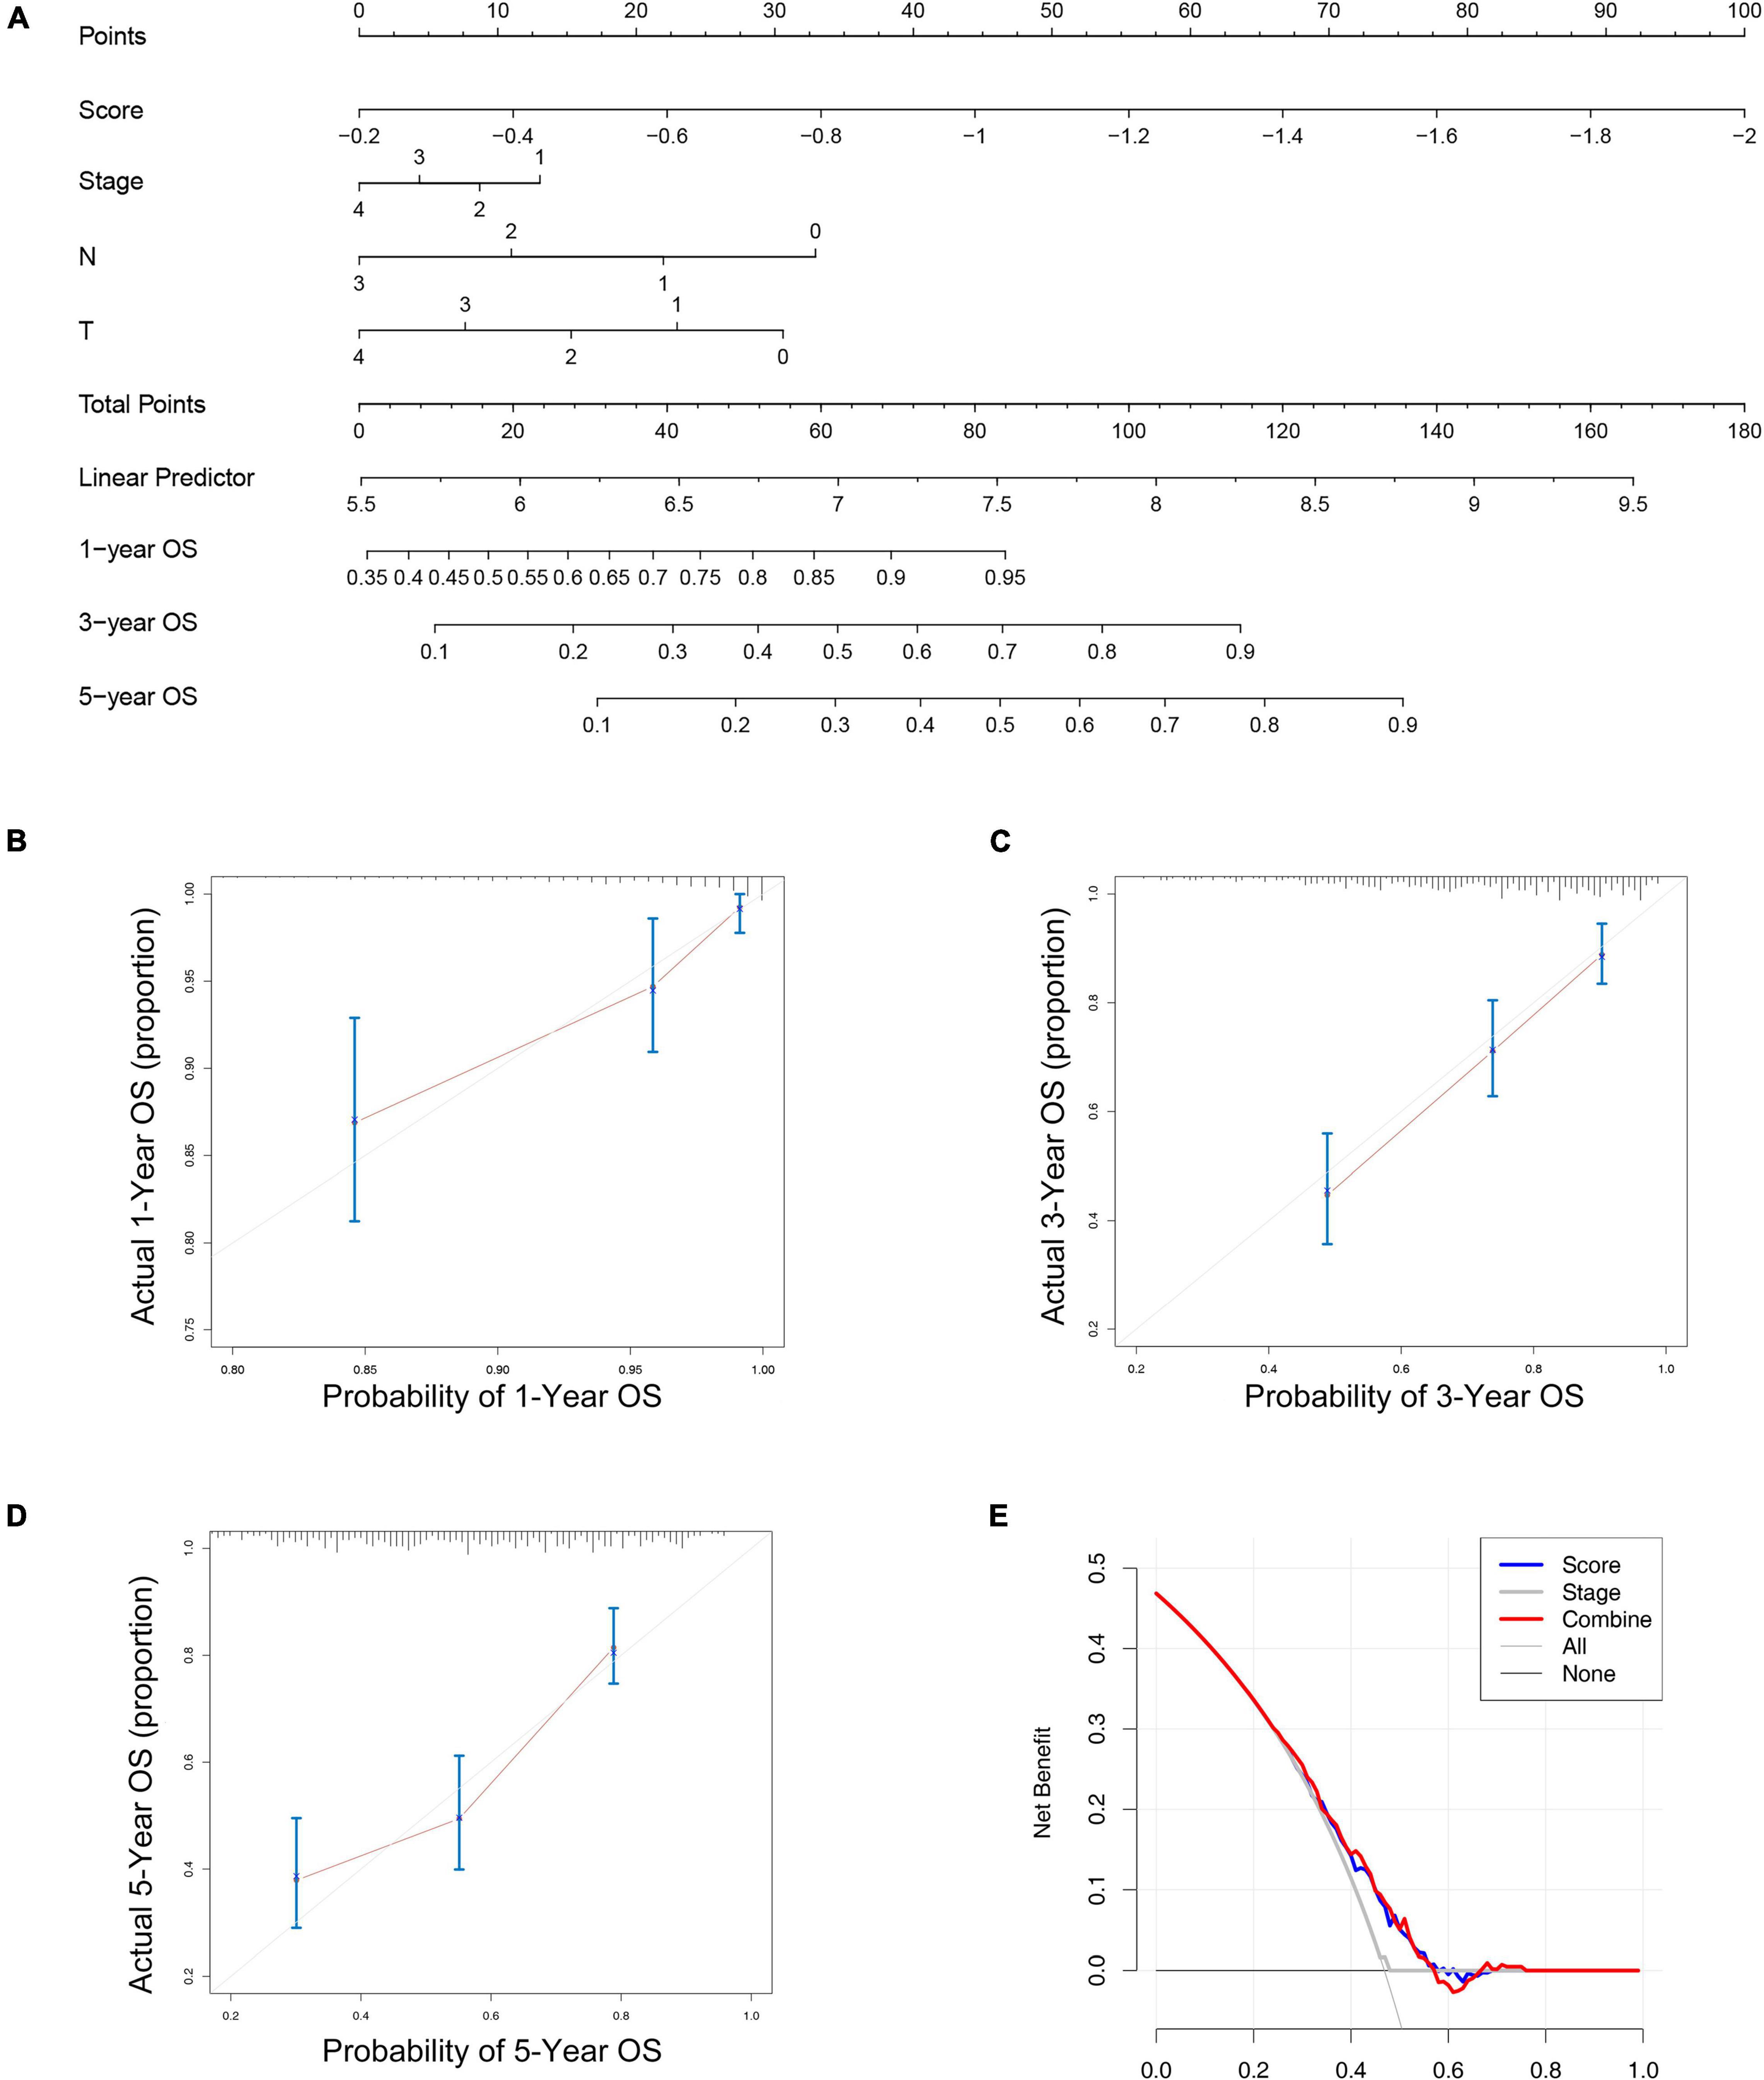
Figure 5. The nomogram to predict the overall survival of melanoma. (A) The nomograms for predicting the proportion of melanoma patients with 1-, 3-, or 5-year overall survival. Plots depict the calibration of the nomogram between predicted and observed 1- (B), 3- (C), or 5- (D) year outcomes. (E) The DCA indicated the clinical utility of the nomogram was well, the risk score had a better net benefit compared to tumor stage, and the combination of the two had a better net benefit than either of the two.
Functional Annotation and Gene Set Enrichment Analysis
We uploaded all the genes of the blue module to DAVID’s website to perform GO and KEGG analysis, and the results of KEGG analysis indicated that the “Staphylococcus aureus infection,” “Antigen processing and presentation,” “Graft-vs.-host disease” were enriched in the blue module (Supplementary Figure 5D and Supplementary Table 1). The GO analysis showed that the blue module was related to “immune response,” “type I interferon signaling pathway,” “inflammatory response,” “T cell receptor signaling pathway,” “extracellular exosome,” “peptide antigen binding,” “MHC class II receptor activity,” and so on (Supplementary Figures 5A–C and Supplementary Table 1). These results indicated that the genes of the blue module were significantly related to the immune process. Then we explored the difference in signaling pathways between the high- and low-risk groups by GSEA under the threshold of p.adjust < 0.05. The high-risk groups were mainly enriched in “MYC targets v2” related pathways, while the low-risk groups were mainly enriched in “ALLOGRAFT REJECTION,” “INTERFERON_ALPHA_RESPONSE,” “INFLAMMATORY_RESPONSE,” and so on (Supplementary Figure 6C and Table 2). Through GO and KEGG analysis of risk scores, we found that risk scores were significantly correlated with T cell activation, regulation of lymphocyte activation, and regulation of T cell activation functions, and were correlated with cell adhesion molecules (CAMs), allograft rejection, antigen processing and presentation and so on pathways (Supplementary Figures 6A,B and Supplementary Table 2).
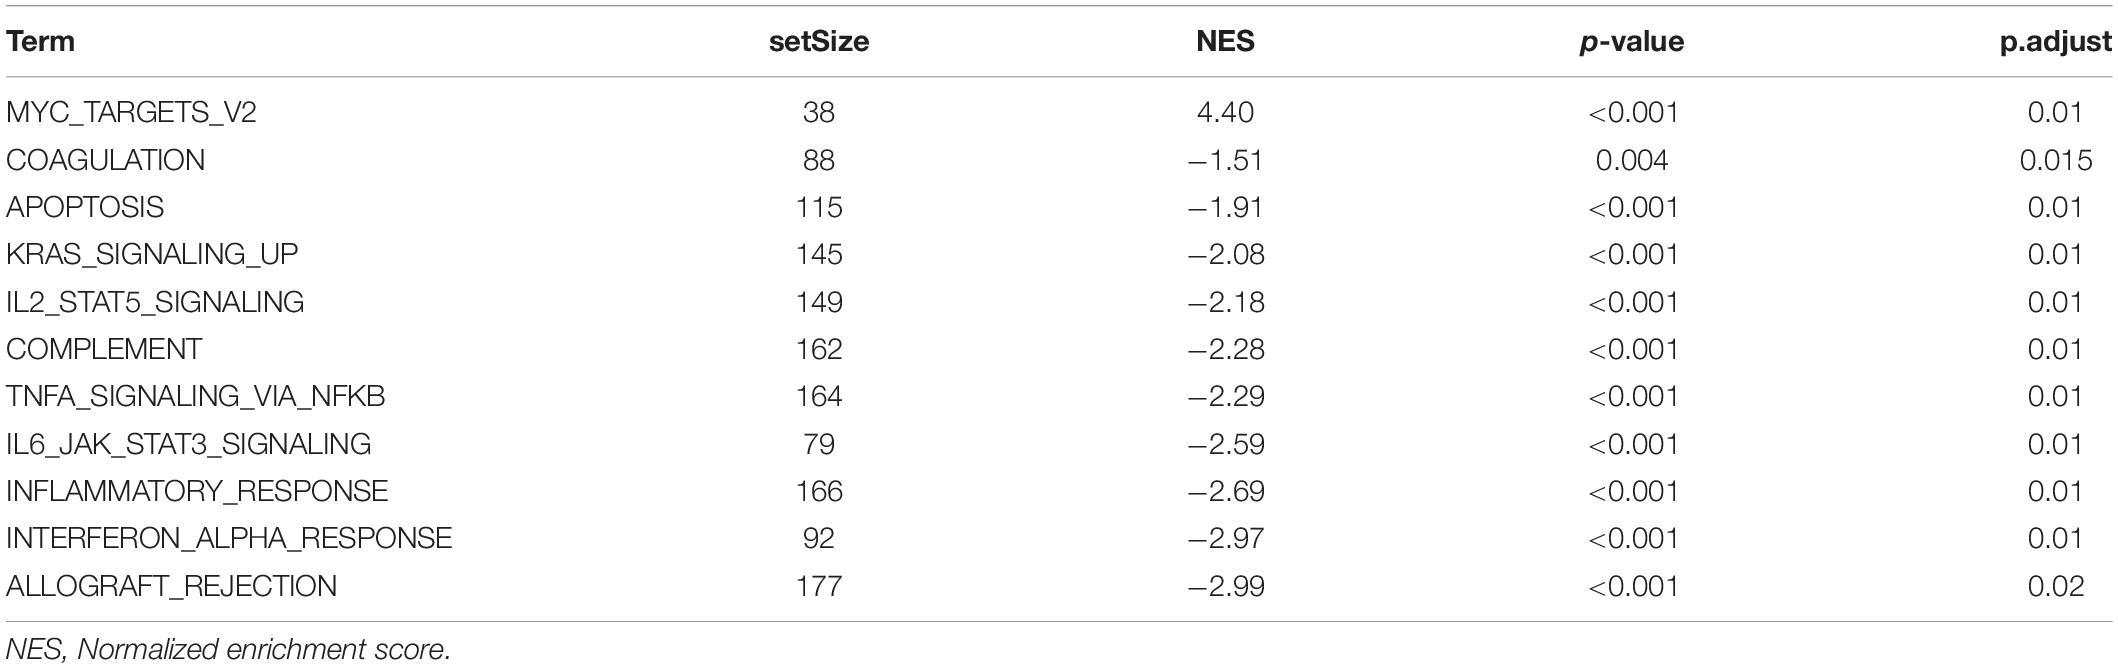
Table 2. Gene set enrichment analysis (GSEA) of the prognostic signature.
Correlation Analysis of Risk Score With Tumor Immunity and Tumor Stem Cells
Through the functional annotation in the previous step, the results exhibit that the low-risk group had a significant relationship with tumor immune-related pathways, so we then analyzed the characteristics of this prognostic model in the immune microenvironment (Figures 6A,B). We quantified 22 major immune cells using CIBERSORT software and found that the main immune infiltration cells in melanoma are CD8 T cells and macrophages (Figures 6A,D and Supplementary Figures 7A–C), the low-risk group had higher CD8 T cell and macrophages M1 infiltration and lower macrophage M0/2 infiltration (Figure 6C). It was also found that these recognized immune checkpoints (PD-L1, PD-L1, CTLA4, etc.) were highly expressed in the low-risk group (Supplementary Figures 7E–G). Our study found that in patients with high TMB or BRAF mutation, the risk score was low (Supplementary Figures 7D,H). By calculating risk score and the correlation of the tumor stem cell marker, results showed that the risk score significantly associated with melanoma cancer stem cell markers (CD20, ABCB5), not only such, risk score also some correlation with other tumor markers, which suggests that tumor stem cell factors contributed to the prognosis of different risk groups for different reasons (Figure 6D).
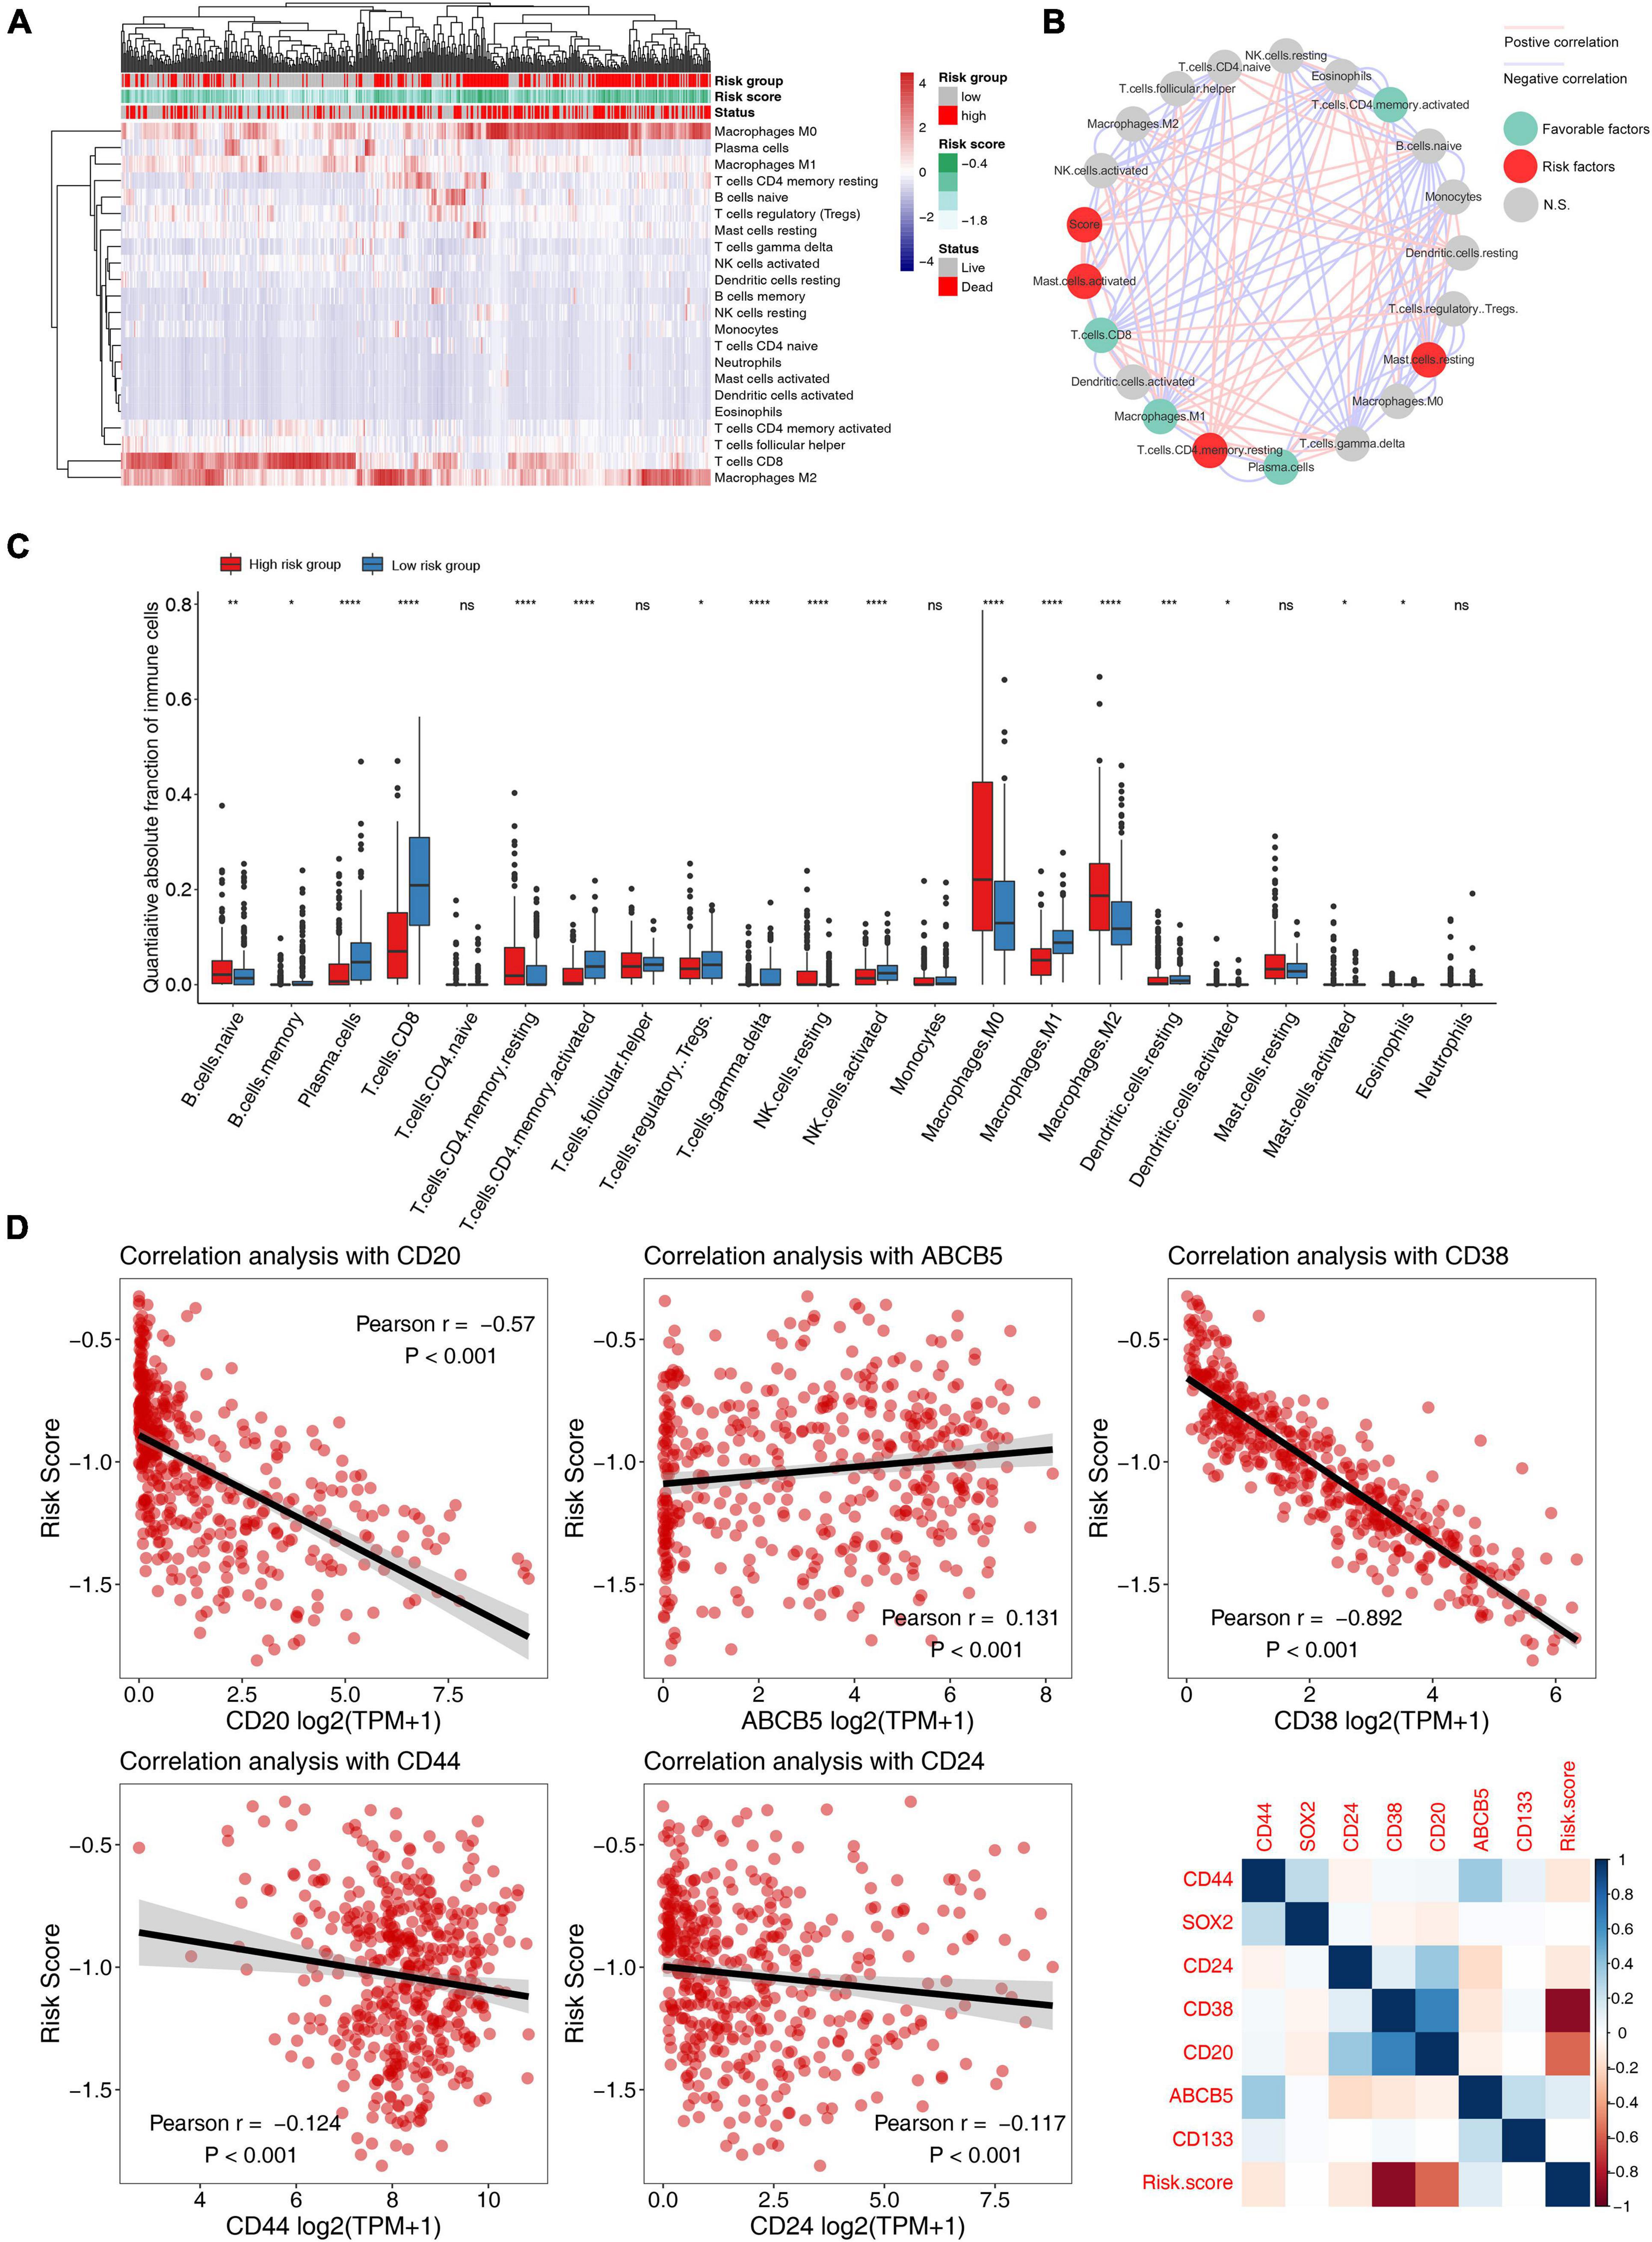
Figure 6. Correlation analysis of 5-mRNA prognostic signature with tumor immune microenvironment and tumor stemless in melanoma. (A) The heatmap of immune cell infiltration based on the 5-mRNA signature. Red squares indicate high levels, while blue squares indicate low levels. (B) Cellular interaction of the tumor immune microenvironment cell types and risk scores. The red line represents a significant positive correlation, and the blue line represents a significant negative correlation. The red dots indicate that it is a risk factor for melanoma prognosis, the green dots indicate a protective factor, and the gray dots indicate that it is not significantly predictive of prognosis. (C) Distribution of 22 types of immune-infiltrating cells in different risk groups. (D) Scatter plot and heatmap of correlation analysis between risk score and tumor stem cell markers. *, p < 0.05; **, p < 0.01; ***, p < 0.001; ****, p < 0.0001; ns, no significant.
Discussion
Melanoma is one of the most aggressive forms of skin cancer worldwide, with high mortality rates. Every year, more than 50,000 people die of melanoma (Sahranavardfard et al., 2019). The melanocytes transform into melanoma is a complex process that requires many factors, and the immune-related factors play an important role in this process (Schadendorf et al., 2018). The overall survival rates for metastatic melanoma have increased due to immunotherapy being widely used, but the efficacy of immunotherapy varied widely among different populations. Therefore, it is important to search meaningful molecular biomarkers to determine the progress and prognosis of melanoma, and these molecular biomarkers can not only represent favorable or poor prognosis but also be used to help patients choose appropriate immunotherapy.
Since stemness markers of melanoma have been proved to be significantly correlated with immune microenvironment, for example, CD20 is also a surface marker of B cells (Lee et al., 2021), we also explored the correlation between 5-mRNA prognostic signature and some stemness markers, and found a significant correlation between the two. Over the years, several tumor stem cell markers associated with melanoma have been gradually identified (Marzagalli et al., 2019). For example, a marker known as ABCB5 has been found to be significantly associated with melanoma drug resistance. For another example, CD20 is a recognized marker of melanoma stem cell surface, and there have been quite a few studies targeting CD20 for the treatment of melanoma (Schlaak et al., 2012; Song et al., 2015; Zeng et al., 2018; Marzagalli et al., 2019). We found that 5-mRNA prognostic signature was also significantly associated with some stemness markers in other tumors (stemness marker of breast cancer and pancreatic cancer: CD44/CD24). Studies have found that the high CD38 in melanoma patients can be used as biomarkers for anti-PD-1 resistance (Plesca et al., 2020). The 5-mRNA prognostic signature we constructed and validated was significantly associated with the two melanoma stem cell markers, suggesting that underlying stemness factors influence the prognosis and immune microenvironment of melanoma patients.
Many reports have applied the WGCNA algorithm in cancers to explore potential biomarkers of prognosis (Tang et al., 2018; Chen et al., 2019; Dong et al., 2019; Wang et al., 2019; Yang L. et al., 2019; Zhao et al., 2019), but there are not very many similar studies on melanoma. Yang L. et al. (2019) identified the expression of three genes (STK26, KCNT2, CASP12) was correlated with the prognosis of skin cutaneous melanoma (SKCM) using the WGCNA algorithm and LASSO Cox regression model. Another study used network-based co-expression analysis to find 24 hub genes were involved in the immune response and development of metastatic melanoma, and those hub genes can be used as biomarkers for the early diagnosis of melanoma (Wang et al., 2018).
In our study, a total of 6 co-expression modules were identified using the WGCNA method. We found the blue module showed a negative correlation with the Breslow depth, Clark level, and T stage. The Breslow depth has been found to be associated with progressive migration of CD1a+ DC subsets in early melanoma (van den Hout et al., 2017). This suggests that the Breslow depth is closely related to the immune microenvironment of melanoma. By LASSO Cox regression analysis, we constructed a prognosis model based on 5-mRNA (SRGN, IDO1, RARRES3, CCL4, HLA-DPB1), which has great predictive value for the overall survival of melanoma. Through GO and KEGG analysis we found the blue module was significantly related to the immune process, such as antigen processing and presentation, immune response, type I interferon signaling pathway, T cell receptor signaling pathway, etc. In addition, GSEA showed that the low-risk groups were mainly enriched in “T CELL RECEPTOR SIGNALING PATHWAY,” “B CELL RECEPTOR SIGNALING PATHWAY,” “JAK STAT SIGNALING PATHWAY,” etc. indicating that the patients in the low-risk group had a stronger immune response than those in the high-risk group. Then, we quantified 22 major immune cells using CIBERSORT software and found that the low-risk group had higher CD8 T cell infiltration and lower macrophage infiltration. CD8 T lymphocytes play an important role in immunity against tumors. Some studies found that the infiltration of CD8 T cells in melanoma has been associated with longer survival in patients (Edwards et al., 2018; Yang S. et al., 2019), this was consistent with our results. Moreover, increasing CD8 T cell infiltration could enhance melanoma radiosensitivity (Chen et al., 2018). These results indicated that the 5-mRNA prognostic signature could predict melanoma for the benefit of immunotherapy.
The five hub genes were related to the immunity of melanoma. In detail, IDO1 (Indoleamine 2,3-Dioxygenase 1) was a monomeric heme-containing oxidoreductase that catalyzes the rate-limiting step of tryptophan (Trp) metabolism to kynurenine (Kyn) (Jung et al., 2019). IDO1 suppresses the immune response in T cells by depleting Trp and accumulating Kyn in the local tumor microenvironment (Xu et al., 2018). IDO1 overexpresses in many types of human malignancies, such as melanoma (Brody et al., 2009). CCL4 (C-C Motif Chemokine Ligand 4) is a chemokine currently thought to mediate the recruitment of CD8+ T cells and regulatory T cells (Jamal et al., 2017). In general, increased tumor immune infiltration significantly improves survival in melanoma patients (Jacquelot et al., 2018), therefore CCL4 was the potential predictive biomarker most likely to respond to immunotherapy of melanoma. In addition, the role of chemokines in evaluating the prognosis of melanoma patients may be a new trend of research.
In conclusion, through deep mining, we have built a 5-mRNA prognostic signature that not only predicts the overall survival rate of melanoma but also according to its classification of immune microenvironments, it is possible to predict the effect of immunotherapy.
Data Availability Statement
The datasets presented in this study can be found in online repositories. The names of the repository/repositories and accession number(s) can be found in the article/Supplementary Material.
Author Contributions
YZ, JP, and HD performed the data management and analysis procedures. YZ, HD, and XF analyzed the results. YZ, NZ, and JP contributed to the writing of the manuscript. All authors contributed to the study conception and design, read and approved the final manuscript.
Funding
This study was supported by a study on the pathogenesis, TCM syndrome types and therapeutic effects of Astragalus Membranaceus based on IgG glycosylation in patients with SLE (81260593).
Conflict of Interest
The authors declare that the research was conducted in the absence of any commercial or financial relationships that could be construed as a potential conflict of interest.
Publisher’s Note
All claims expressed in this article are solely those of the authors and do not necessarily represent those of their affiliated organizations, or those of the publisher, the editors and the reviewers. Any product that may be evaluated in this article, or claim that may be made by its manufacturer, is not guaranteed or endorsed by the publisher.
Acknowledgments
We would like to acknowledge the TCGA and GEPIA database developed by the National Institutes of Health (NIH). We greatly appreciate all the staff who contributed to this work from the Department of Dermatology, the First College of Clinical Medical Sciences, China Three Gorges University.
Supplementary Material
The Supplementary Material for this article can be found online at: https://www.frontiersin.org/articles/10.3389/fcell.2021.755284/full#supplementary-material
Footnotes
References
Brody, J. R., Costantino, C. L., Berger, A. C., Sato, T., Lisanti, M. P., Yeo, C. J., et al. (2009). Expression of indoleamine 2,3-dioxygenase in metastatic malignant melanoma recruits regulatory T cells to avoid immune detection and affects survival. Cell Cycle 8, 1930–1934. doi: 10.4161/cc.8.12.8745
Chen, H. Y., Xu, L., Li, L. F., Liu, X. X., Gao, J. X., and Bai, Y. R. (2018). Inhibiting the CD8(+) T cell infiltration in the tumor microenvironment after radiotherapy is an important mechanism of radioresistance. Sci. Rep. 8:11934. doi: 10.1038/s41598-018-30417-6
Chen, W., Zhang, W., Wu, R., Cai, Y., Xue, X., and Cheng, J. (2019). Identification of biomarkers associated with histological grade and prognosis of gastric cancer by co-expression network analysis. Oncol. Lett. 18, 5499–5507. doi: 10.3892/ol.2019.10869
Dong, Z., Wang, J., Zhang, H., Zhan, T., Chen, Y., and Xu, S. (2019). Identification of potential key genes in esophageal adenocarcinoma using bioinformatics. Exp. Ther. Med. 18, 3291–3298. doi: 10.3892/etm.2019.7973
Edwards, J., Wilmott, J. S., Madore, J., Gide, T. N., Quek, C., Tasker, A., et al. (2018). CD103(+) tumor-resident CD8(+) T cells are associated with improved survival in immunotherapy-naive melanoma patients and expand significantly during anti-PD-1 treatment. Clin. Cancer Res. 24, 3036–3045. doi: 10.1158/1078-0432.CCR-17-2257
Guo, J., Qin, S., Liang, J., Lin, T., Si, L., Chen, X., et al. (2016). Chinese guidelines on the diagnosis and treatment of melanoma (2015 edition). Chin. Clin. Oncol. 5:57. doi: 10.21037/cco.2015.12.02
Jacquelot, N., Duong, C. P. M., Belz, G. T., and Zitvogel, L. (2018). Targeting chemokines and chemokine receptors in melanoma and other cancers. Front. Immunol. 9:2480. doi: 10.3389/fimmu.2018.02480
Jamal, R., Lapointe, R., Cocolakis, E., Thebault, P., Kazemi, S., Friedmann, J. E., et al. (2017). Peripheral and local predictive immune signatures identified in a phase II trial of ipilimumab with carboplatin/paclitaxel in unresectable stage III or stage IV melanoma. J. Immunother. Cancer 5:83. doi: 10.1186/s40425-017-0290-x
Jung, K. H., LoRusso, P., Burris, H., Gordon, M., Bang, Y. J., Hellmann, M. D., et al. (2019). Phase I study of the indoleamine 2,3-dioxygenase 1 (IDO1) inhibitor navoximod (GDC-0919) administered with PD-L1 inhibitor (atezolizumab) in advanced solid tumors. Clin. Cancer Res. 25, 3220–3228. doi: 10.1158/1078-0432.CCR-18-2740
Kim, S. H., Yoo, E. S., Woo, J. S., Han, S. H., Lee, J. H., Jung, S. H., et al. (2019). Antitumor and apoptotic effects of quercetin on human melanoma cells involving JNK/P38 MAPK signaling activation. Eur. J. Pharmacol. 860:172568. doi: 10.1016/j.ejphar.2019.172568
Langfelder, P., and Horvath, S. (2008). WGCNA: an R package for weighted correlation network analysis. BMC Bioinformatics 9:559. doi: 10.1186/1471-2105-9-559
Lee, D. S. W., Rojas, O. L., and Gommerman, J. L. (2021). B cell depletion therapies in autoimmune disease: advances and mechanistic insights. Nat. Rev. Drug Discov. 20, 179–199. doi: 10.1038/s41573-020-00092-2
Liu, J., Lichtenberg, T., Hoadley, K. A., Poisson, L. M., Lazar, A. J., Cherniack, A. D., et al. (2018). An integrated TCGA pan-cancer clinical data resource to drive high-quality survival outcome analytics. Cell 173, 400–416. doi: 10.1016/j.cell.2018.02.052
Marzagalli, M., Raimondi, M., Fontana, F., Montagnani Marelli, M., Moretti, R. M., and Limonta, P. (2019). Cellular and molecular biology of cancer stem cells in melanoma: possible therapeutic implications. Semin. Cancer Biol. 59, 221–235. doi: 10.1016/j.semcancer.2019.06.019
Newman, A. M., Liu, C. L., Green, M. R., Gentles, A. J., Feng, W., Xu, Y., et al. (2015). Robust enumeration of cell subsets from tissue expression profiles. Nat. Methods 12, 453–457. doi: 10.1038/nmeth.3337
Plesca, I., Tunger, A., Muller, L., Wehner, R., Lai, X., Grimm, M. O., et al. (2020). Characteristics of tumor-infiltrating lymphocytes prior to and during immune checkpoint inhibitor therapy. Front. Immunol. 11:364. doi: 10.3389/fimmu.2020.00364
Ponti, G., Manfredini, M., Greco, S., Pellacani, G., Depenni, R., Tomasi, A., et al. (2017). BRAF, NRAS and C-KIT advanced melanoma: clinico-pathological features, targeted-therapy strategies and survival. Anticancer Res. 37, 7043–7048. doi: 10.21873/anticanres.12175
Sahranavardfard, P., Firouzi, J., Azimi, M., Khosravani, P., Heydari, R., Emami Razavi, A., et al. (2019). MicroRNA-203 reinforces stemness properties in melanoma and augments tumorigenesis in vivo. J. Cell Physiol. 234, 20193–20205. doi: 10.1002/jcp.28619
Schadendorf, D., van Akkooi, A. C. J., Berking, C., Griewank, K. G., Gutzmer, R., Hauschild, A., et al. (2018). Melanoma. Lancet 392, 971–984. doi: 10.1016/S0140-6736(18)31559-9
Schlaak, M., Schmidt, P., Bangard, C., Kurschat, P., Mauch, C., and Abken, H. (2012). Regression of metastatic melanoma in a patient by antibody targeting of cancer stem cells. Oncotarget 3, 22–30. doi: 10.18632/oncotarget.437
Song, H., Su, X., Yang, K., Niu, F., Li, J., Song, J., et al. (2015). CD20 antibody-conjugated immunoliposomes for targeted chemotherapy of melanoma cancer initiating cells. J. Biomed. Nanotechnol. 11, 1927–1946. doi: 10.1166/jbn.2015.2129
Tang, J., Kong, D., Cui, Q., Wang, K., Zhang, D., Gong, Y., et al. (2018). Prognostic genes of breast cancer identified by gene co-expression network analysis. Front. Oncol. 8:374. doi: 10.3389/fonc.2018.00374
Tang, Z., Li, C., Kang, B., Gao, G., Li, C., and Zhang, Z. (2017). GEPIA: a web server for cancer and normal gene expression profiling and interactive analyses. Nucleic Acids Res. 45, W98–W102. doi: 10.1093/nar/gkx247
van den Hout, M., Koster, B. D., Sluijter, B. J. R., Molenkamp, B. G., van de Ven, R., van den Eertwegh, A. J. M., et al. (2017). Melanoma sequentially suppresses different dc subsets in the sentinel lymph node, affecting disease spread and recurrence. Cancer Immunol. Res. 5, 969–977. doi: 10.1158/2326-6066.CIR-17-0110
Wagner, G. P., Kin, K., and Lynch, V. J. (2012). Measurement of mRNA abundance using RNA-seq data: RPKM measure is inconsistent among samples. Theory Biosci. 131, 281–285. doi: 10.1007/s12064-012-0162-3
Wang, H., Lu, D., Liu, X., Jiang, J., Feng, S., Dong, X., et al. (2019). Survival-related risk score of lung adenocarcinoma identified by weight gene co-expression network analysis. Oncol. Lett. 18, 4441–4448. doi: 10.3892/ol.2019.10795
Wang, L. X., Li, Y., and Chen, G. Z. (2018). Network-based co-expression analysis for exploring the potential diagnostic biomarkers of metastatic melanoma. PLoS One 13:e0190447. doi: 10.1371/journal.pone.0190447
Xu, G., Wang, T., Li, Y., Huang, Z., Wang, X., Zheng, J., et al. (2018). A highly potent and selective inhibitor Roxyl-WL targeting IDO1 promotes immune response against melanoma. J. Enzyme Inhib. Med. Chem. 33, 1089–1094. doi: 10.1080/14756366.2018.1471688
Yang, L., Xu, Y., Yan, Y., Luo, P., Chen, S., Zheng, B., et al. (2019). common nevus and skin cutaneous melanoma: prognostic genes identified by gene co-expression network analysis. Genes 10:747. doi: 10.3390/genes10100747
Yang, S., Liu, T., Nan, H., Wang, Y., Chen, H., Zhang, X., et al. (2019). Comprehensive analysis of prognostic immune-related genes in the tumor microenvironment of cutaneous melanoma. J. Cell Physiol. 235, 1025–1035. doi: 10.1002/jcp.29018
Yoshihara, K., Shahmoradgoli, M., Martinez, E., Vegesna, R., Kim, H., Torres-Garcia, W., et al. (2013). Inferring tumour purity and stromal and immune cell admixture from expression data. Nat. Commun. 4:2612. doi: 10.1038/ncomms3612
Zeng, Y. B., Yu, Z. C., He, Y. N., Zhang, T., Du, L. B., Dong, Y. M., et al. (2018). Salinomycin-loaded lipid-polymer nanoparticles with anti-CD20 aptamers selectively suppress human CD20+ melanoma stem cells. Acta Pharmacol. Sin. 39, 261–274. doi: 10.1038/aps.2017.166
Keywords: melanoma, overall survival, tumor immune microenvironment (TME), tumor stem cell, prognostic signature
Citation: Zhang Y, Peng J, Du H, Zhang N and Fang X (2021) Identification and Validation of Immune- and Stemness-Related Prognostic Signature of Melanoma. Front. Cell Dev. Biol. 9:755284. doi: 10.3389/fcell.2021.755284
Received: 08 August 2021; Accepted: 11 October 2021;
Published: 05 November 2021.
Edited by:
Yu Xiao, Wuhan University, ChinaCopyright © 2021 Zhang, Peng, Du, Zhang and Fang. This is an open-access article distributed under the terms of the Creative Commons Attribution License (CC BY). The use, distribution or reproduction in other forums is permitted, provided the original author(s) and the copyright owner(s) are credited and that the original publication in this journal is cited, in accordance with accepted academic practice. No use, distribution or reproduction is permitted which does not comply with these terms.
*Correspondence: Xianfeng Fang, ZmFuZ3hpYW5mZW5nMDAxQDE2My5jb20=