 Jonathan Kuhn
 Yiyan Lin
 Peter N. Devreotes
94% of researchers rate our articles as excellent or good
Learn more about the work of our research integrity team to safeguard the quality of each article we publish.
Find out more
REVIEW article
Front. Cell Dev. Biol., 05 October 2021
Sec. Molecular and Cellular Pathology
Volume 9 - 2021 | https://doi.org/10.3389/fcell.2021.740205
This article is part of the Research TopicDictyostelium: A Tractable Cell and Developmental Model in Biomedical ResearchView all 24 articles
For decades, the social amoeba Dictyostelium discoideum has been an invaluable tool for dissecting the biology of eukaryotic cells. Its short growth cycle and genetic tractability make it ideal for a variety of biochemical, cell biological, and biophysical assays. Dictyostelium have been widely used as a model of eukaryotic cell motility because the signaling and mechanical networks which they use to steer and produce forward motion are highly conserved. Because these migration networks consist of hundreds of interconnected proteins, perturbing individual molecules can have subtle effects or alter cell morphology and signaling in major unpredictable ways. Therefore, to fully understand this network, we must be able to quantitatively assess the consequences of abrupt modifications. This ability will allow us better control cell migration, which is critical for development and disease, in vivo. Here, we review recent advances in imaging, synthetic biology, and computational analysis which enable researchers to tune the activity of individual molecules in single living cells and precisely measure the effects on cellular motility and signaling. We also provide practical advice and resources to assist in applying these approaches in Dictyostelium.
In order to respond to cues in their environment, cells detect and move toward or away from cues like light, chemical gradients, and mechanical forces. Directed migration is a critical process in all domains of life: unicellular organisms can detect and move toward food and mates, while multicellular organisms use chemical gradients to guide cells during development and immune response (Yamada and Cukierman, 2007; Thomas et al., 2018; Yamada and Sixt, 2019). Understanding how cells sense direction and respond is therefore important both to basic biological questions and for developing new therapies to treat birth defects, immunodeficiencies, and cancers.
Directed migration consists of three processes: directional sensing, motility and polarity. Directional sensing is the orientation of molecules involved in cell migration toward a stimulus. Once cell senses a directional cue, it can use motility proteins to move toward that cue. These two processes are distinct: immobile cells still can align molecules along a chemical gradient and cells with no stimulus can migrate in random directions (Janetopoulos et al., 2004; Song et al., 2006; Swaney et al., 2010). Finally, polarized cells maintain a single “front” and “back” at designated locations in order to move processively. Again, this process is not dependent on the two others: polarized cells can migrate randomly, unpolarized cells can exhibit chemotactic behavior, and cells can maintain a polarized state without moving (Janetopoulos et al., 2004; Tang et al., 2008; Wang et al., 2014; Park et al., 2017). Because the mechanisms of polarity are less fleshed out than the other two, this review will focus on directional sensing and motility exclusively.
Dictyostelium discoideum undergo directed migration in the presence of chemical, mechanical, and electrical gradients, which makes it an ideal model organism for studying cell migration (Van Haastert and Devreotes, 2004; Annesley and Fisher, 2009; Artemenko et al., 2014; Nichols et al., 2015; Devreotes et al., 2017). Compared to mammalian cells, Dictyostelium are easy to maintain, genetically manipulate, and are amenable to large-scale genetic and pharmaceutical screens. Moreover, nearly all the signal molecules are conserved between Dictyostelium and mammals. Historically, Dictyostelium has been used to identify and study regulators of directional migration. Many of these molecules are now known, but we only have a limited understanding of how they function together as a network. Dictyostelium has emerged as a platform for designing and testing tools which can acutely change properties of this network. This approach, in combination with quantitative analysis and computational modeling, has allowed investigators to dissect the structure of the directed migration pathway.
Directed migration can be broken into three steps: chemical inputs, signal transduction, and cytoskeletal response. Ligands like Cyclic AMP (cAMP) bind to membrane-bound receptors, eliciting downstream signaling transduction events involving Ras GTPases, phosphoinositide lipids, lipid kinases/phosphatases and protein kinases/phosphatases. These molecules then modulate the actomyosin cytoskeleton network that drives cell movement (Figure 1; Devreotes et al., 2017).
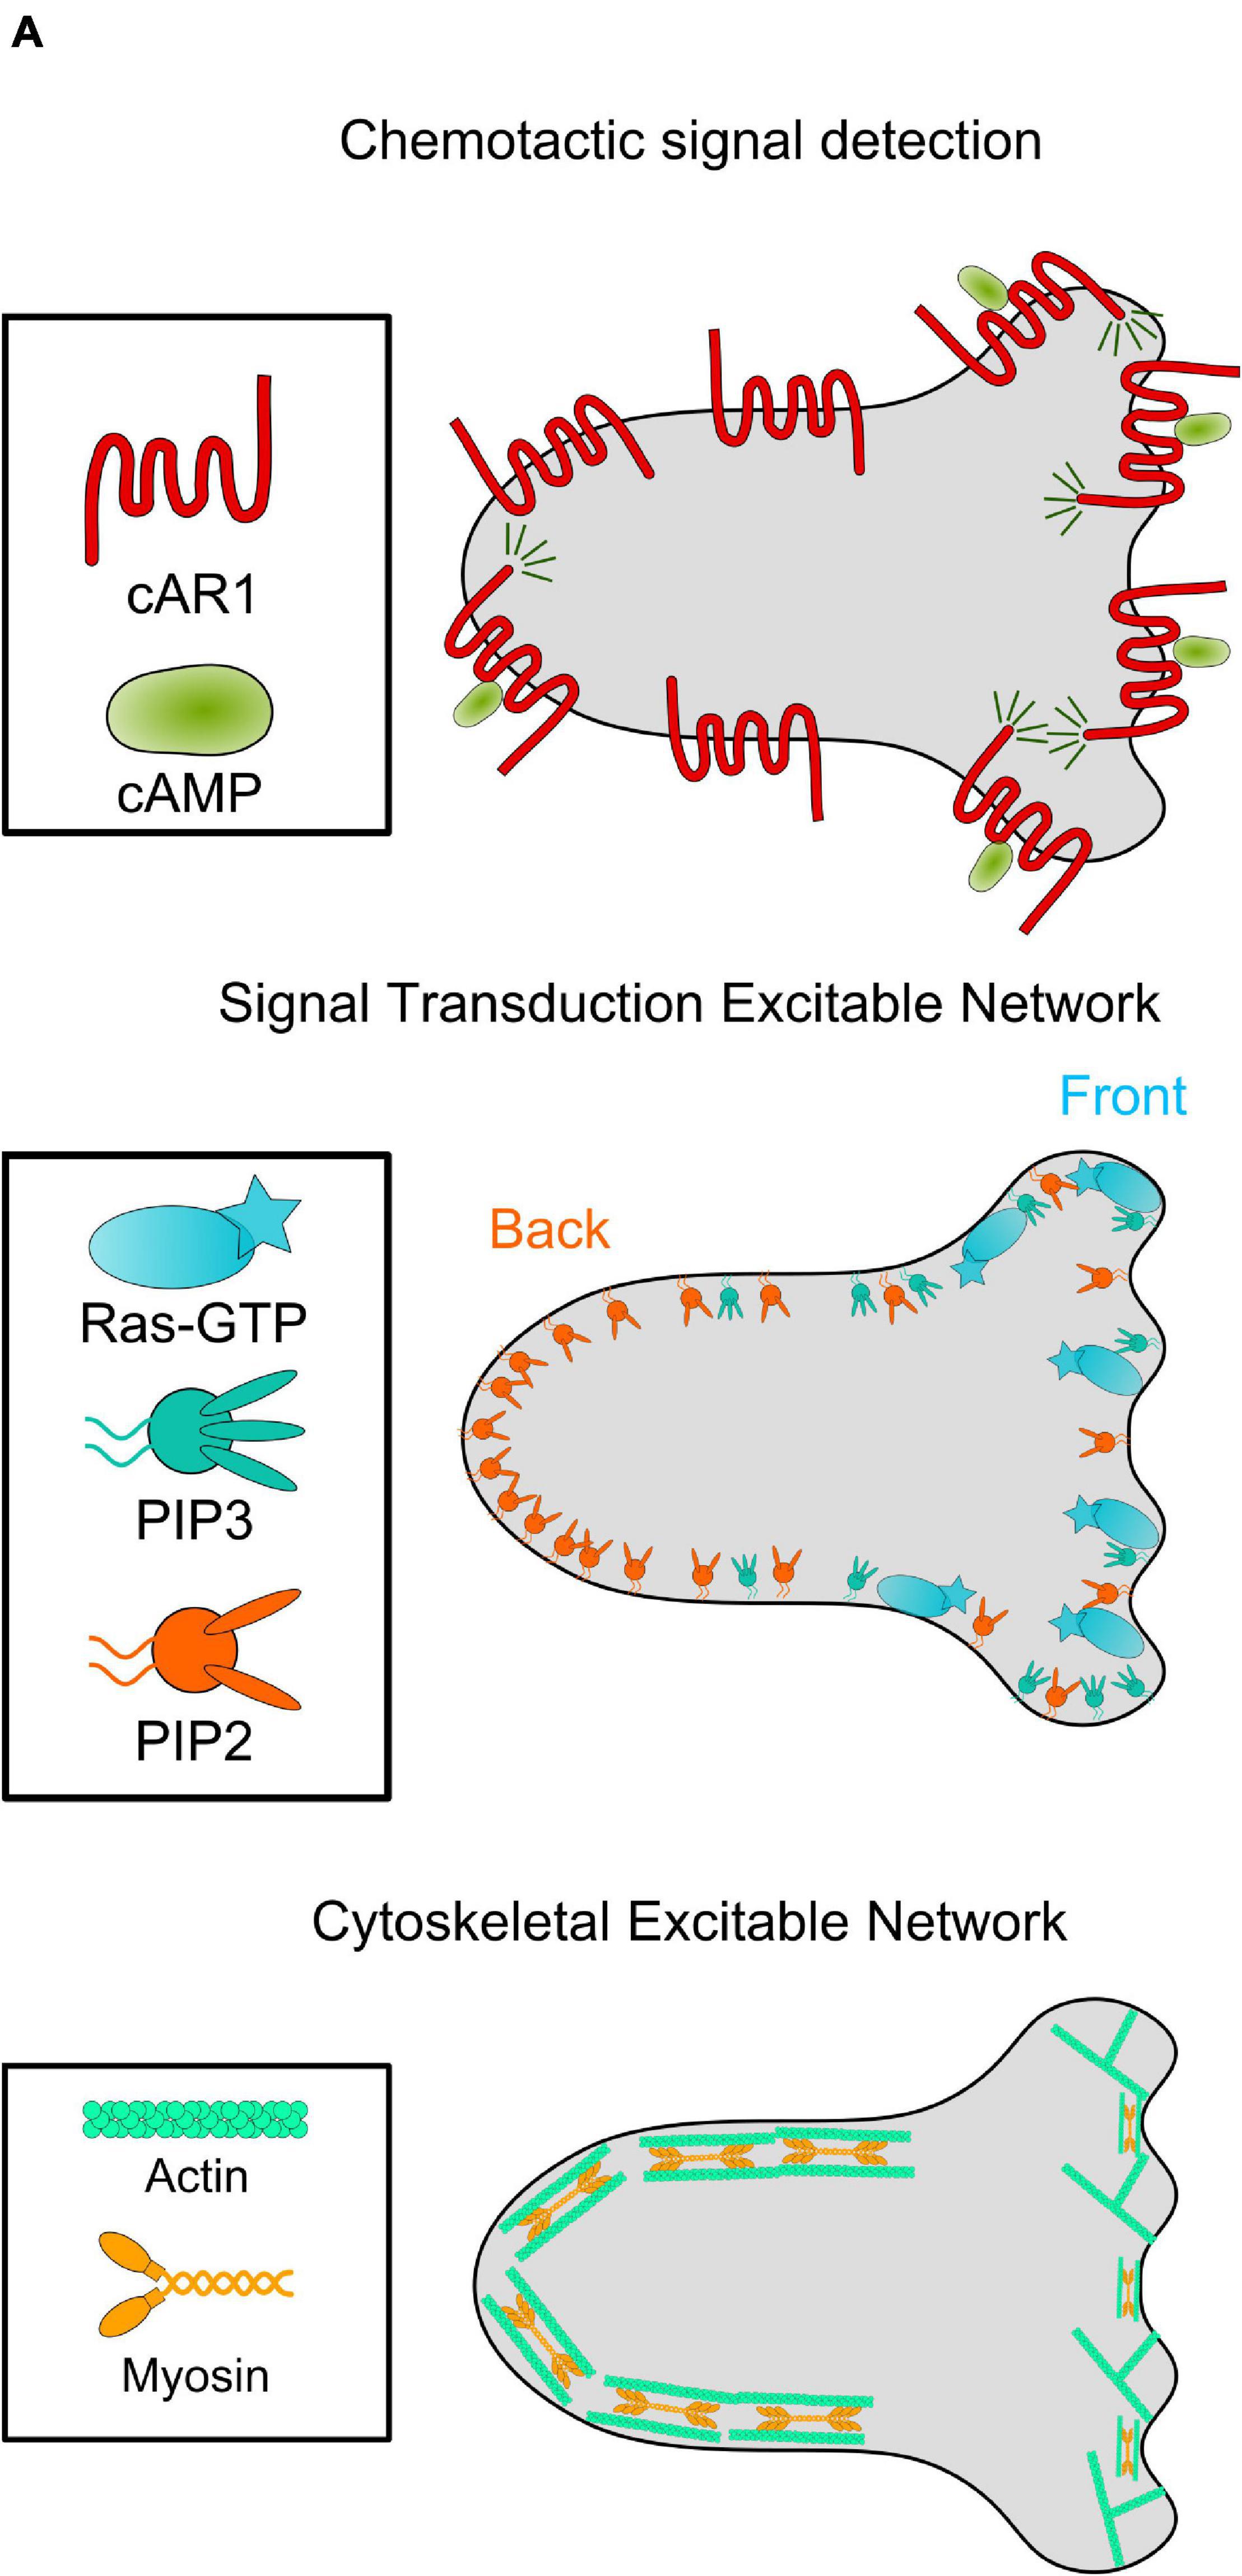
Figure 1. The chemotaxis network in Dictyostelium. Diagram of the connected networks controlling Dictyostelium cyclic AMP (cAMP) chemotaxis. Top: the uniformly distributed G-Protein Coupled Receptor cAR1 binds to cAMP, leading to motion up the concentration gradient. Middle: cAMP-cAR1 interactions locally increase concentration of activated Ras and membrane lipid PI(3,4,5)P3 (PIP3), among other molecules. These molecules form the cell “front” and are mutually exclusive with localization of cell “back” molecules like PI(4,5)P2 (PIP2). Together, these signaling molecules form the Signal Transduction Excitable Network. Bottom: Active Ras enrichment leads to an increase in actin polymerization at the cell front. Meanwhile, cell back signaling molecules activate the contraction of an actomyosin network. This Cytoskeletal Excitable Network powers motility.
In order to understand directed migration, several groups have developed computational models of the biochemical networks underlying the process (Zigmond, 1974; Mato et al., 1975; Tranquillo et al., 1988; Meinhardt, 1999; Arrieumerlou and Meyer, 2005; Levine et al., 2006; Hecht et al., 2010; Neilson et al., 2011; Takeda, 2012; Tang et al., 2014). To account for the rapid response to chemoattractant and for directional movement, the Iglesias and Devreotes labs developed a model where chemoattractant stimulation leads to Local Excitation and Global Inhibition (LEGI) (Figure 2A; Meinhardt and Gierer, 2000; Xiong et al., 2010; Tang et al., 2014). The LEGI concept explains why cells can respond directionally in shallow gradients and adapt to global concentration changes: chemical stimulation produces both an excitor and an inhibitor. The excitor is fast and localized, while the inhibitor is slow and global, ensuring that excitor is higher than inhibitor only at the high end of a gradient and lower than the inhibitor at the back. The concentration of the excitor then biases the probability of spontaneous signal transduction events such that the cell forms many more protrusions toward a stimulus on average. This LEGI framework helped explain many of the dynamic signaling changes in response to chemoattractants, but it did not detail how these changes helped cells form and control protrusions using the actin cytoskeleton.
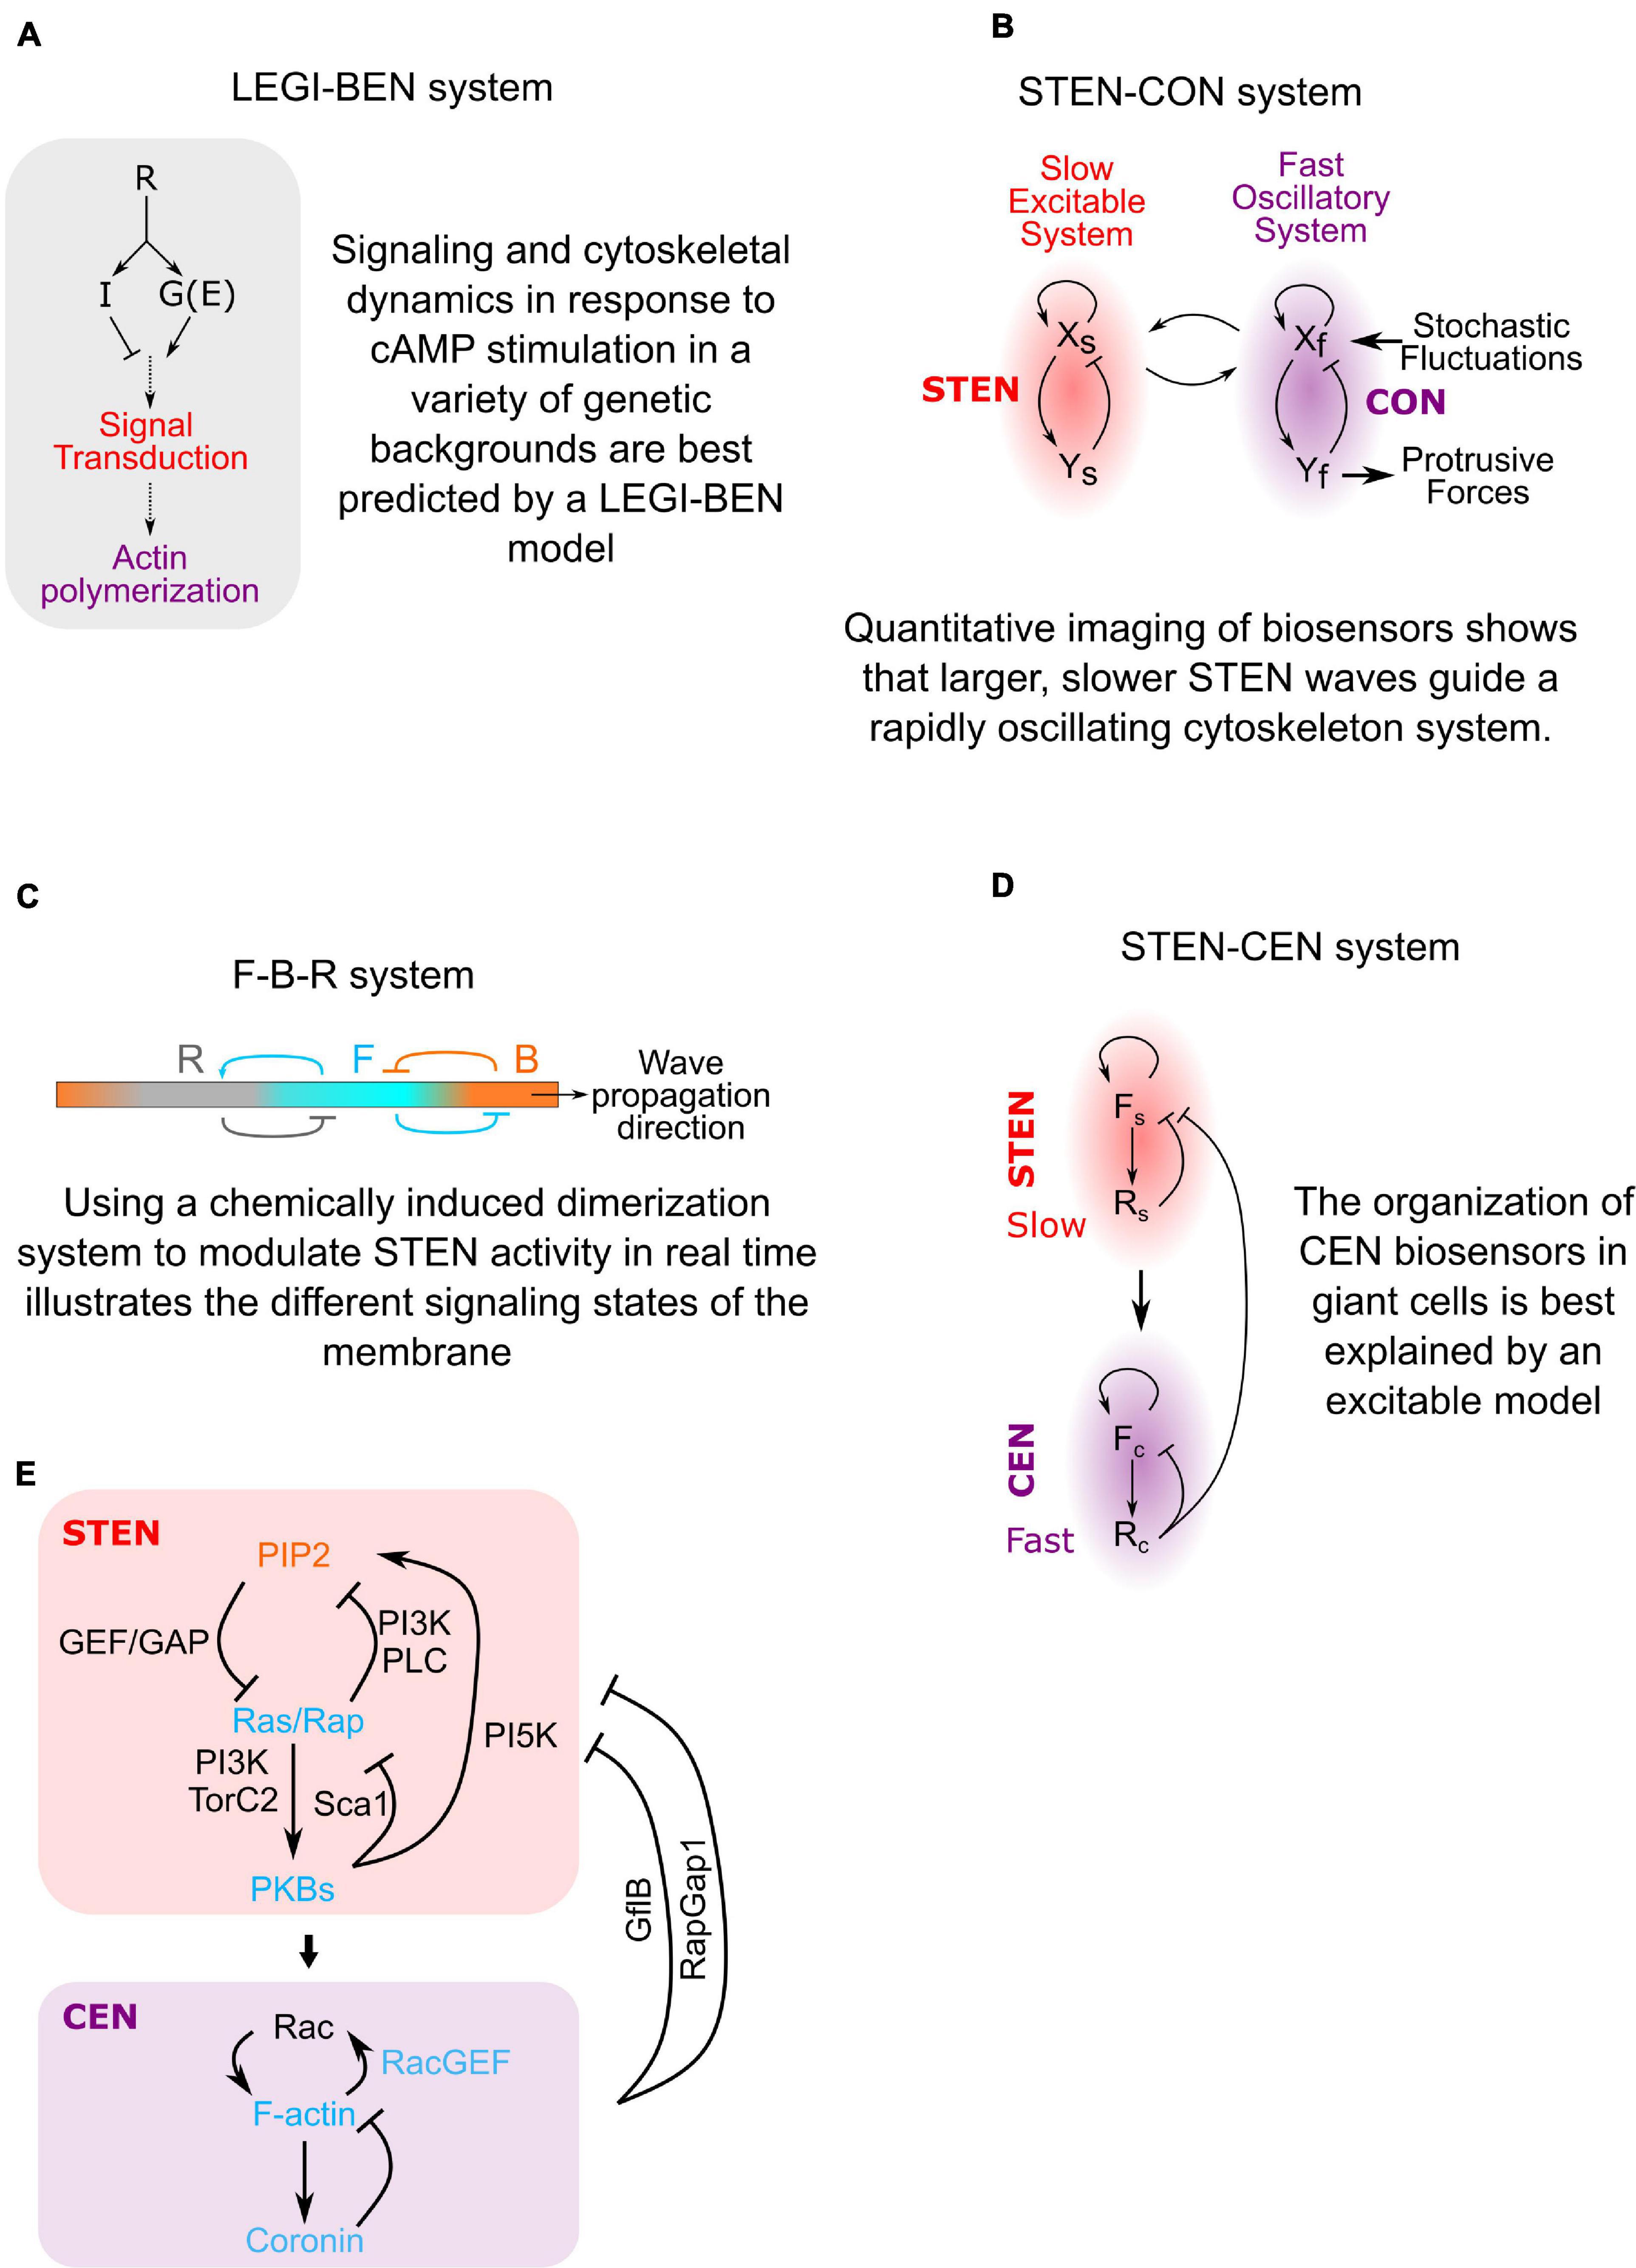
Figure 2. The evolution of directed migration models. (A) By monitoring how signaling and cytoskeletal dynamics change during cAMP stimulation in different genetic backgrounds we were able to build a model of gradient-sensing. The cell has two responses to Receptor (R) activation: locally, heterotrimeric G-proteins (G) create an Excitor (E) of signal transduction excitation. Globally, the cell produces an Inhibitor (I) which lowers the probability of excitation. This Local Excitation and Global Inhibition (LEGI) of a Biased Excitable Network (BEN) explains how cells moves in the correct direction even in shallow gradients. (B) Imaging of signaling biosensors independent of cytoskeletal proteins revealed excitable behavior. In the absence of signaling activity, cytoskeletal biosensors rapidly oscillate at small membrane patches. The Cytoskeletal Oscillatory Network (CON) is only able to form large, sustained protrusions when driven by the Signal Transduction Excitable Network (STEN). (C) Using data from chemically induced dimerization perturbations, a model of how cell front and back activities are segregated was created. The membrane sits in a resting state equivalent to the cell back state (B). STEN excitation converts a patch of the membrane to a front state (F). This F state inhibits the B state but also gradually creates its own inhibitor that converts F-state membrane to a refractory state (R). This explains how activities like Ras activation and actin polymerization propagates across cell membranes but is transient at any single location. (D) Biosensor dynamics show that the cytoskeletal network also has excitable properties. The Cytoskeletal Excitable Network (CEN) is coupled to the STEN but works on a faster timescale, explaining the structure of STEN-CEN waves on the bottom membrane of giant cells. (E) Diagram of the STEN-CEN network sketched out in panel (D) with specific molecules added.
In order to explain the coordination between signal transduction and cytoskeletal networks during cell migration, it has been proposed that these systems are directly coupled (Figures 2B-D; Vicker, 2002; Gerisch et al., 2012; Huang et al., 2013; Van Haastert et al., 2017). Measurements of signaling protein dynamics in Dictyostelium suggested that the signal transduction network had excitable properties similar to an action potential (Nishikawa et al., 2014; Tang et al., 2014). This Signal Transduction Excitable Network (STEN) exhibits classic characteristics of excitability, including wave propagation, refractoriness and maximal response to suprathreshold stimuli (Xiong et al., 2010; Nishikawa et al., 2014; Tang et al., 2014). This led to the discovery that STEN organizes the activity of a rapidly oscillating cytoskeletal network to localize and shape cell protrusions (Figure 2B).
Using chemically induced dimerization to acutely change STEN activity in migrating cells, it was shown how the STEN segregates the front and back of cells: At rest, the cell membrane is dominated by phosphatidylinositol 3,4-bisphosphate[PI(3,4)P2] and phosphatidylinositol 4,5-bisphosphate[PI(4,5)P2], representing an inactive B (“Back”) state (Miao et al., 2017). These signaling molecules discourage actin polymerization and activate actomyosin contraction (Weiner et al., 2002; Wong et al., 2005; Papakonstanti et al., 2007). When extracellular signals or internal noise raise STEN activity above a threshold, it converts the local membrane to a F (“Front”) state by activating Ras/Rap proteins (Kae et al., 2004; Sasaki et al., 2004; Bolourani et al., 2006; Cai et al., 2010; Gerisch et al., 2011; Kortholt et al., 2011, 2013). These signaling proteins activate actin polymerization, a hallmark of cell fronts. The excitable behavior of STEN relies on feedback loops within the network: Ras/Rap positive feedback loops on short timescales lead to rapid activation and propagation of the F state. Longer-term negative feedback generated by front molecules places recently activated parts of the membrane into a refractory (R) state which cannot immediately fire again (Miao et al., 2017; Figure 2C).
Finally, observing the shape and kinetics of cytoskeletal activity markers after altering various regulators of signaling and cytoskeletal activity demonstrated that the cytoskeletal network displayed many of the same hallmarks of excitability as the STEN (Figure 2D; Miao et al., 2019). The Cytoskeletal Excitable Network (CEN) model explains the organization of cytoskeletal activity biosensors relative to STEN waves on the bottom membrane of cells. The STEN-CEN model can predict signal transduction and cytoskeletal behavior in other cells, such as mammalian breast cancer cells (Xiong et al., 2016; Zhan et al., 2020).
To develop an understanding of the directed migration network, it was vital to image quantitative changes in activation and localization of dozens of molecules inside cells (Figure 2). While biochemical approaches to studying cell migration can be incredibly revealing, they nearly always eliminate spatial information and average differences across a heterogenous cell population. Comparing two fixed cell populations using immunofluorescence also has downsides: because many of the activities discussed here are variable between cells, it can be difficult to distinguish between real biological differences and noise. Imaging cellular processes in living cells circumvents these drawbacks and likely provides the most physiologically relevant information. However, studying activity changes in individual cells over time has many experimental hurdles: how can we measure changes in protein activity without damaging cells? How can we display and measure changes over time reliably? And most importantly, how can we make chemical perturbations to living cells in real time? By reviewing methods and best practices to measure and change the activity of molecules involved in cell migration, this review will provide a resource for others endeavoring to dissect complex and dynamic biological processes.
The dynamic localization of proteins within the cell contains important information about the organization and dynamics of the STEN and CEN networks. Many proteins localize toward a stimulus in the cell front or away from a stimulus in the cell back (Li et al., 2020). Using fluorescent fusion proteins that characterize the front or back (Table 1), we can determine the signaling state of the cell in response to a variety of perturbations. It is important to understand that while fluorescent fusion proteins indicate where a protein is, they do not report on the catalytic activity of the protein itself. For proteins that do not change activity by relocating, other types of sensors must be developed.
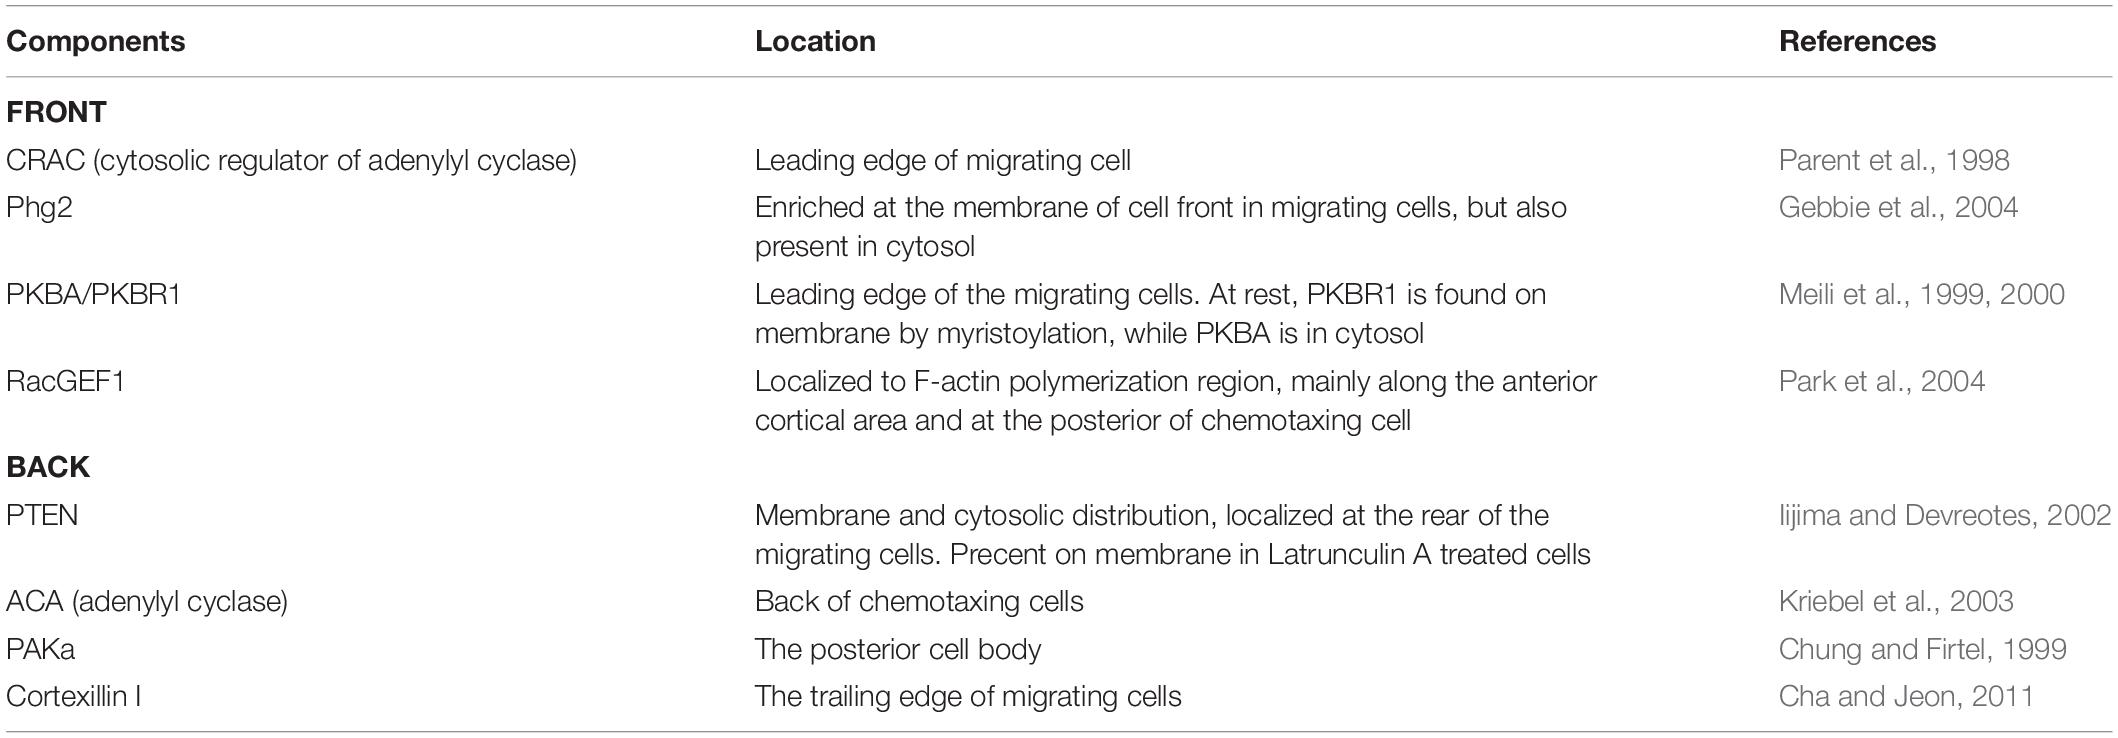
Table 1. Examples of endogenous proteins which can serve as fluorescent biomarkers of the cell front and back due to their well-characterized localization.
To understand changes in directed migration network dynamics, it is important to measure activities, not just localizations. This is because there is often not a direct correlation between activity and localization: for example, Ras GTPase localizes to the entire cell periphery, but activated Ras (Ras-GTP) only localizes to the front of cells (Sasaki et al., 2004). Many genetically encoded fluorescent or bioluminescent sensors have been developed to observe the spatial and temporal dynamics of signaling molecules in cells. Biosensors consists of two parts: one that recognizes the analyte (signal molecules) and a reporter (fluorescent or bioluminescent proteins) (Okumoto et al., 2012). For example, the biosensor RBD (Ras Binding Domain) (Table 2) uses a protein domain that binds Ras-GTP conjugated to a fluorescent protein in order to detect activated Ras in vivo (Taylor et al., 2001). Biosensors can also be used to localize molecules that cannot be detected by standard fluorescence techniques. For example, the PH domain of the protein Crac (Table 1) binds to the membrane lipid PI(3,4,5)P3 and can be used to monitor PIP3 localization in the cell (Dormann et al., 2002).
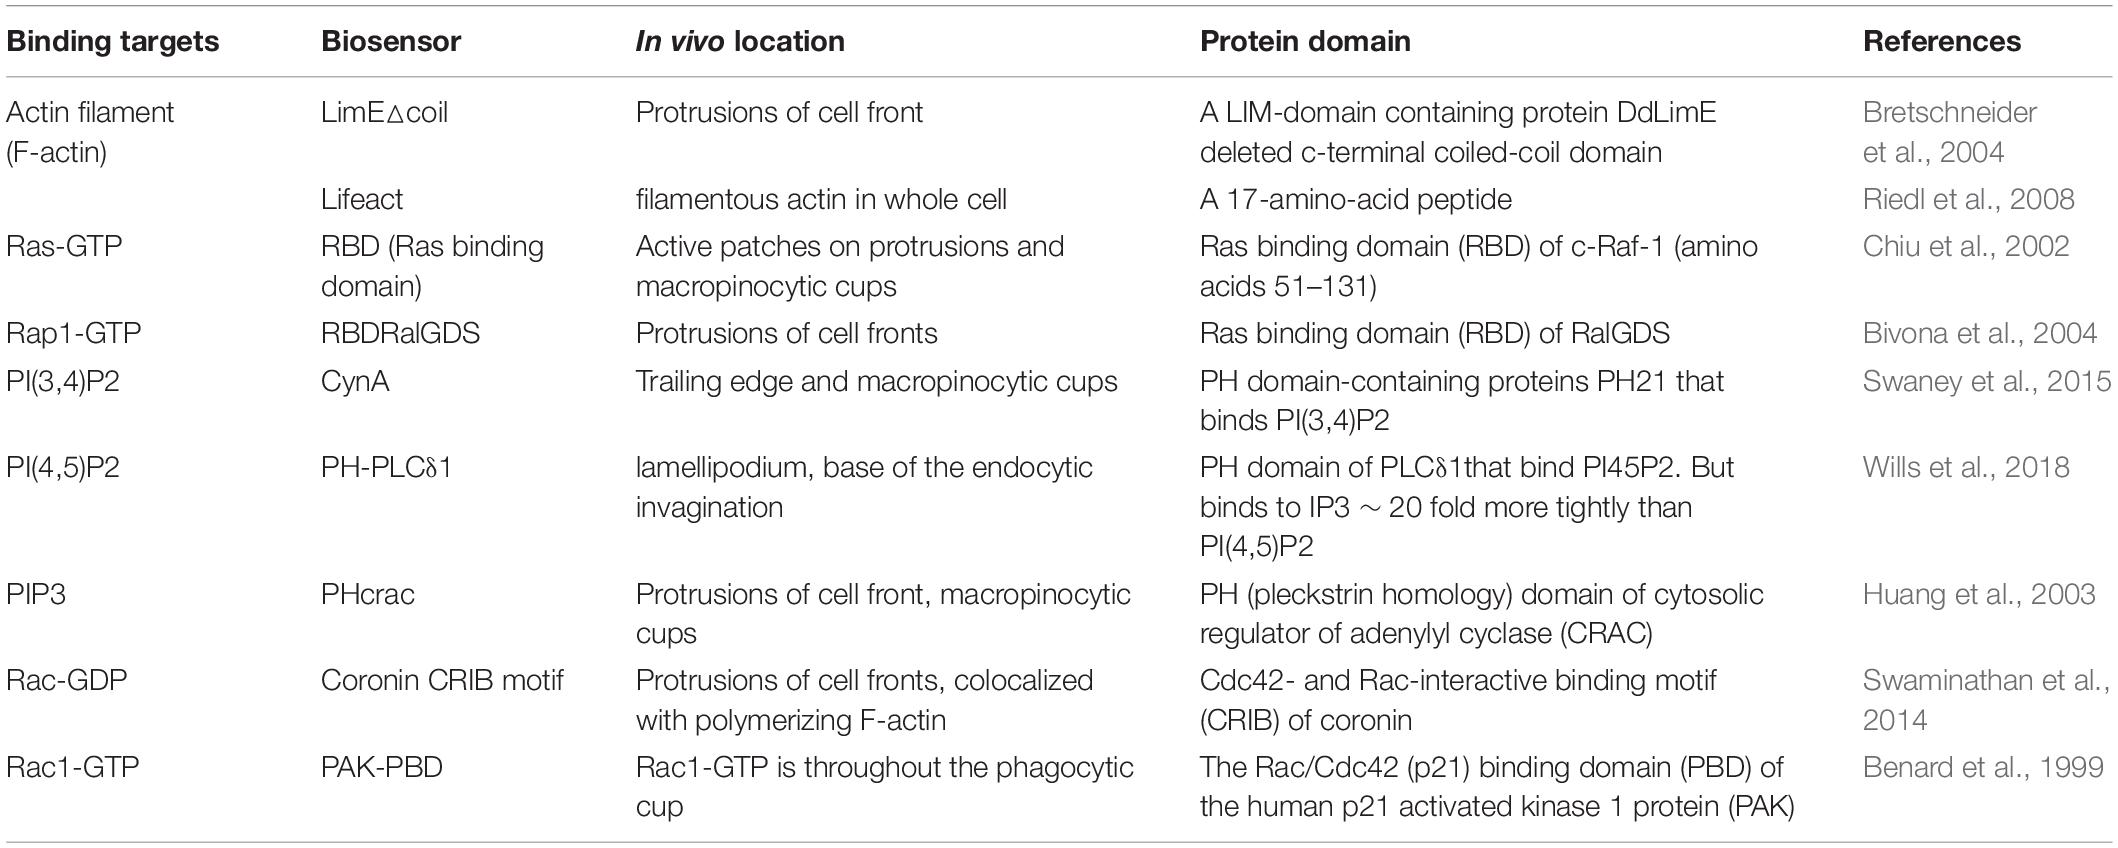
Table 2. Examples of well-characterized biosensors for important activities in the celll migration network.
One important note of caution is that biosensor localization does not linearly correlate with activity. Depending on expression level and affinity, only a fraction of the biosensor is bound to the analyte. For example, there are two main populations of RBD within a Dictyostelium cell: localized to the front region of the membrane and in the cytoplasm. The cytoplasmic pool of RBD contains unbound biosensor and does not indicate Ras activation. Therefore, the specific biology of the analyte must be considered when interpreting data from biosensor experiments.
In single cells, it is hard to dissect the temporal order of signals in same network because signaling events seems to all initiate spontaneously and stochastically. One reason for this is the small dimensions of a cell: protrusions formed on the cell periphery can quickly travel vertically out of the imaging plane (Figure 3). Meanwhile, signaling events starting on the center of the bottom membrane can quickly reach the periphery and go out of view. To gain insight in the spatiotemporal regulation of the chemotactic network, Gerisch and colleagues fused multiple Dictyostelium cells using electric pulses and described the generation and propagation of self-organized actin waves on the substrate-attached surface (Gerisch et al., 2013; Gerhardt et al., 2014). Subsequently, giant cells generated by electropulse-induced cell fusion have become a tool for studying the spatial organization of STEN and CEN molecules (Figure 3). The giant surface is an ideal platform for observing the propagation of signaling events: Ras, PIP3 and actin polymerization propagate along the surface in coordinated waves (Schroth-Diez et al., 2009; Arai et al., 2010; Shibata et al., 2012; Taniguchi et al., 2013; Gerhardt et al., 2014). Usually, active F state molecules like Ras-GTP, PIP3 form waves that appear to be surrounded by CEN waves (actin) (Miao et al., 2019). Outside the waves are B state molecules such as PTEN. The spatial “phase shift” between waves of the various sensors reveal the organization and kinetics of STEN and CEN. STEN biosensors show a one-peak wave with Rap activity leading Ras activity, in front of PIP3, and followed by PKB. CEN waves span the STEN region but also have an initial peak and a weaker trailing peak. This two peak structure is best explained by a model where the timescale of CEN activation and inhibition is much faster than STEN (Miao et al., 2019).
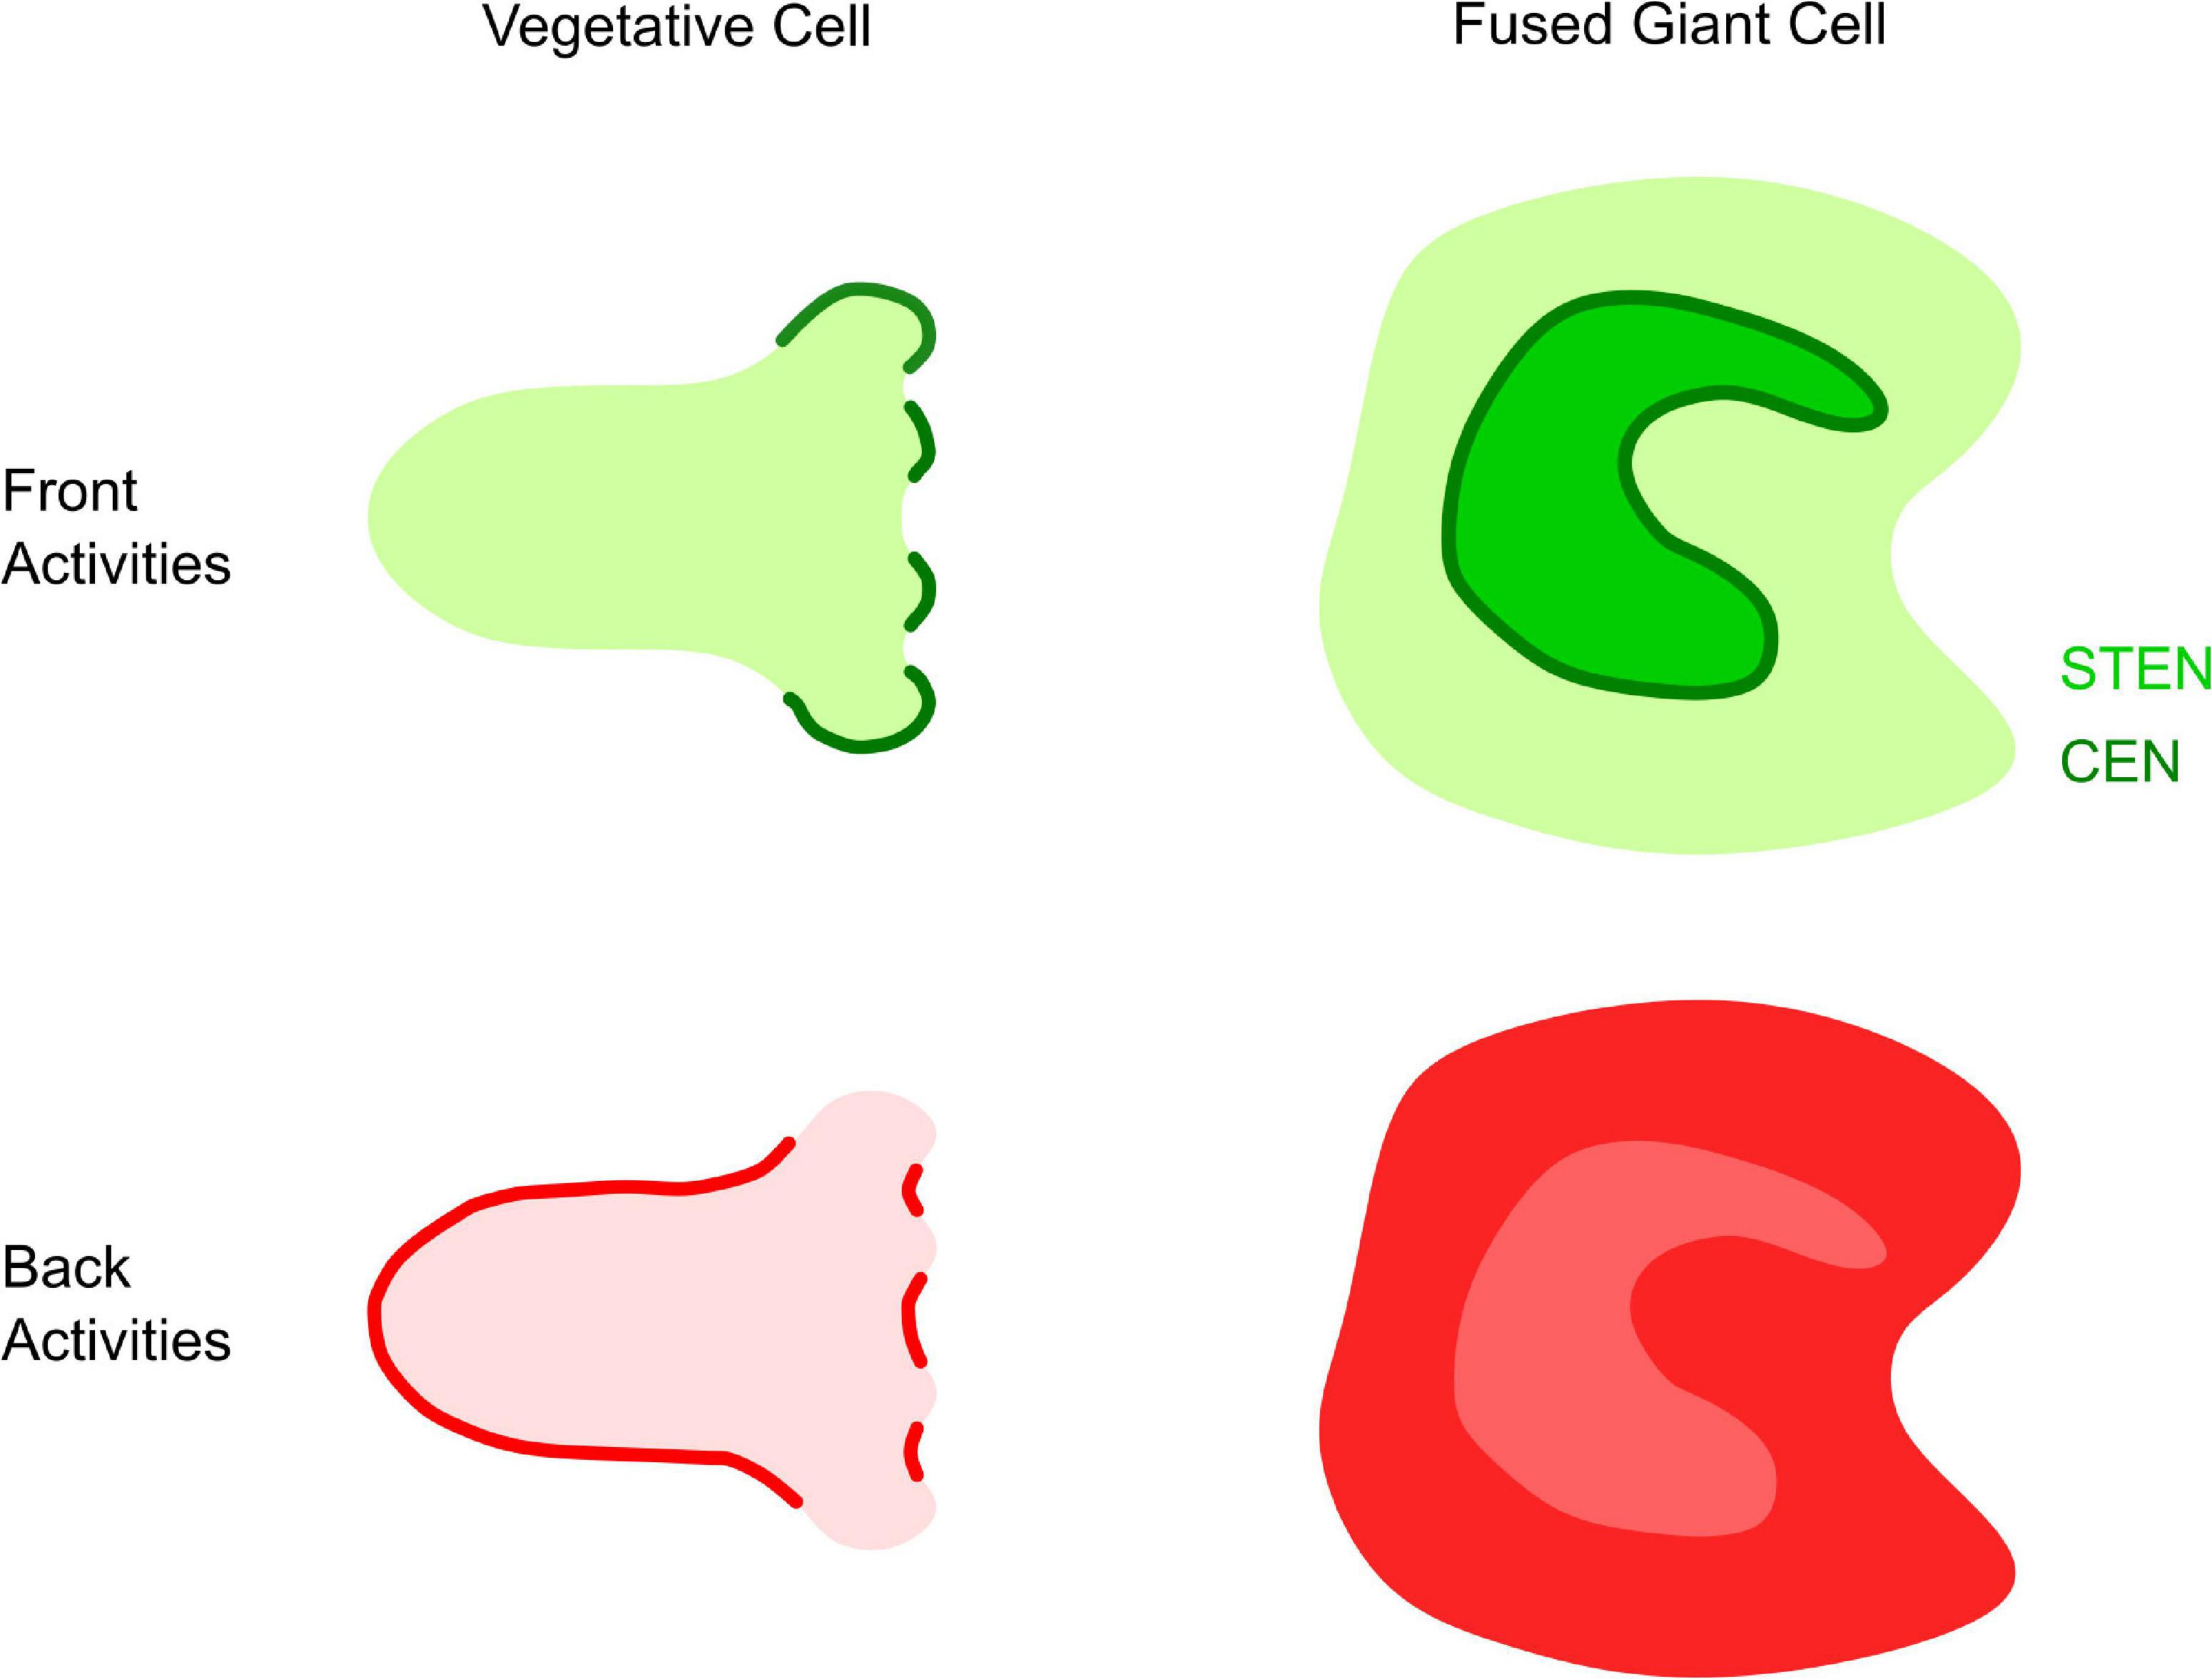
Figure 3. Front and back organization in Dictyostelium. Illustration of “front” and “back” activities in the middle focal plane of a single vegetative cells and the bottom membrane of giant cells. Left: in single cells, front (green) activities occur at protrusions or macropinocytic cups, while back (red) activities display complementary patterns at the trailing edge of macropinocytic cups or the cell. Right: in giant cells, front activities (green) propagate as cortical waves. STEN (light green) activities are enclosed by CEN (dark green). Back activities (dark red) are excluded from the area of front activity, creating “shadow waves” of low intensity when imaging back biosensors (light red).
The directed migration network contains hundreds of molecules which are linked in an intricate series of feedback loops. Because of this, assessing the role of one individual molecule is difficult: adaptive changes in the level or activity of other proteins can compensate for individual deletions, leading to unexpected phenotypes. Because of this, it is critical to observe how changes in protein activity affect the network immediately. For example, transiently raising Ras activity has different effects on cell morphology than expressing constitutively activated Ras (Miao et al., 2017; Edwards et al., 2018). While this section will focus on newer synthetic methods to alter cell chemistry, some older tools which remain in use today will be briefly noted.
For decades, researchers have been using the natural response of Dictyostelium to chemical signals to alter the directed migration pathway in real time. Cyclic AMP (cAMP) activates a chemotactic response in Dictyostelium by binding the GPCR cAR1, leading to elevated Ras activation and actin polymerization at the high end of the gradient. The localization and dynamics of a molecule during cAMP stimulation contain important information about that molecule’s position in the directed migration pathway (Devreotes et al., 2017). While representing the true chemotactic response, this approach has a few disadvantages for unraveling network architecture: it alters the activity of many proteins at once, making specific studies more difficult. Cells developed to respond to cAMP are also more polarized complicating direct comparison to the undeveloped cells. However, cAMP activation is fast (2-3 s), robust over many mutant lines, tunable at low concentrations, and does not require any genetic perturbations. This flexibility and accessibility make it a useful tool to place individual molecules within the chemotaxis pathway. Because it requires no molecular biology tools, cAR1 stimulation can even be combined with other techniques like chemical dimerization (Miao et al., 2017) to measure how acute changes in other molecules affect the pathway’s response to stimuli. Finally, if cAMP is not feasible, many orthogonal methods to activate the directed migration pathway exist: chemicals like folic acid which act on a different receptor, mechanical forces like shear flow, and electrical fields (Zhao et al., 2002; Décave et al., 2003; Artemenko et al., 2016).
Many Dictyostelium proteins involved in directed migration can be controlled with the use of small molecule inhibitors. Commonly used inhibitors like the actin depolymerizing agent latrunculin the PI3K inhibitor LY294002, the Myosin inhibitor blebbistatin, and the TORC2 inhibitor PP242 are effective in altering STEN and CEN activities in Dictyostelium (Gerisch et al., 2004; Shu et al., 2005; Loovers et al., 2006; Cai et al., 2010). There are significant advantages to pharmacological approaches: they are fast, potentially address only a single node in the network, and do not require genetic manipulations. The main drawback to these techniques is availability: most newly developed small molecule inhibitors are optimized to function in human cells for medical applications and may not function well in Dictyostelium. Additionally, inhibitors may have significant off-target effects which confound results.
Chemically Induced Dimerization (CID) is a flexible method for recruiting proteins to specific locations in the cell. In CID, a protein of interest (an “actuator”) is fused to a protein domain which, upon the addition of a chemical agent, will dimerize with another protein domain fused to an organelle (an “anchor”) (Figure 4). While there a few different versions of this system (Fegan et al., 2010), this section will focus on the well-established FKBP-FRB system. The FKBP-FRB system takes advantage of the ability of FK506 Binding Protein (FKBP) to heterodimerize with a domain of the signaling protein mTOR (the helpfully named FKBP-Rapamycin Binding domain, or FRB) in the presence of the small molecule Rapamycin (Derose et al., 2013). CID is capable of targeting protein activity to certain intracellular regions and is specific to the protein of interest. The FKBP-FRB system also acts within seconds of rapamycin addition and does not require any specialized equipment. These properties make CID an ideal tool to study a complex, dynamic network like the chemotaxis pathway.
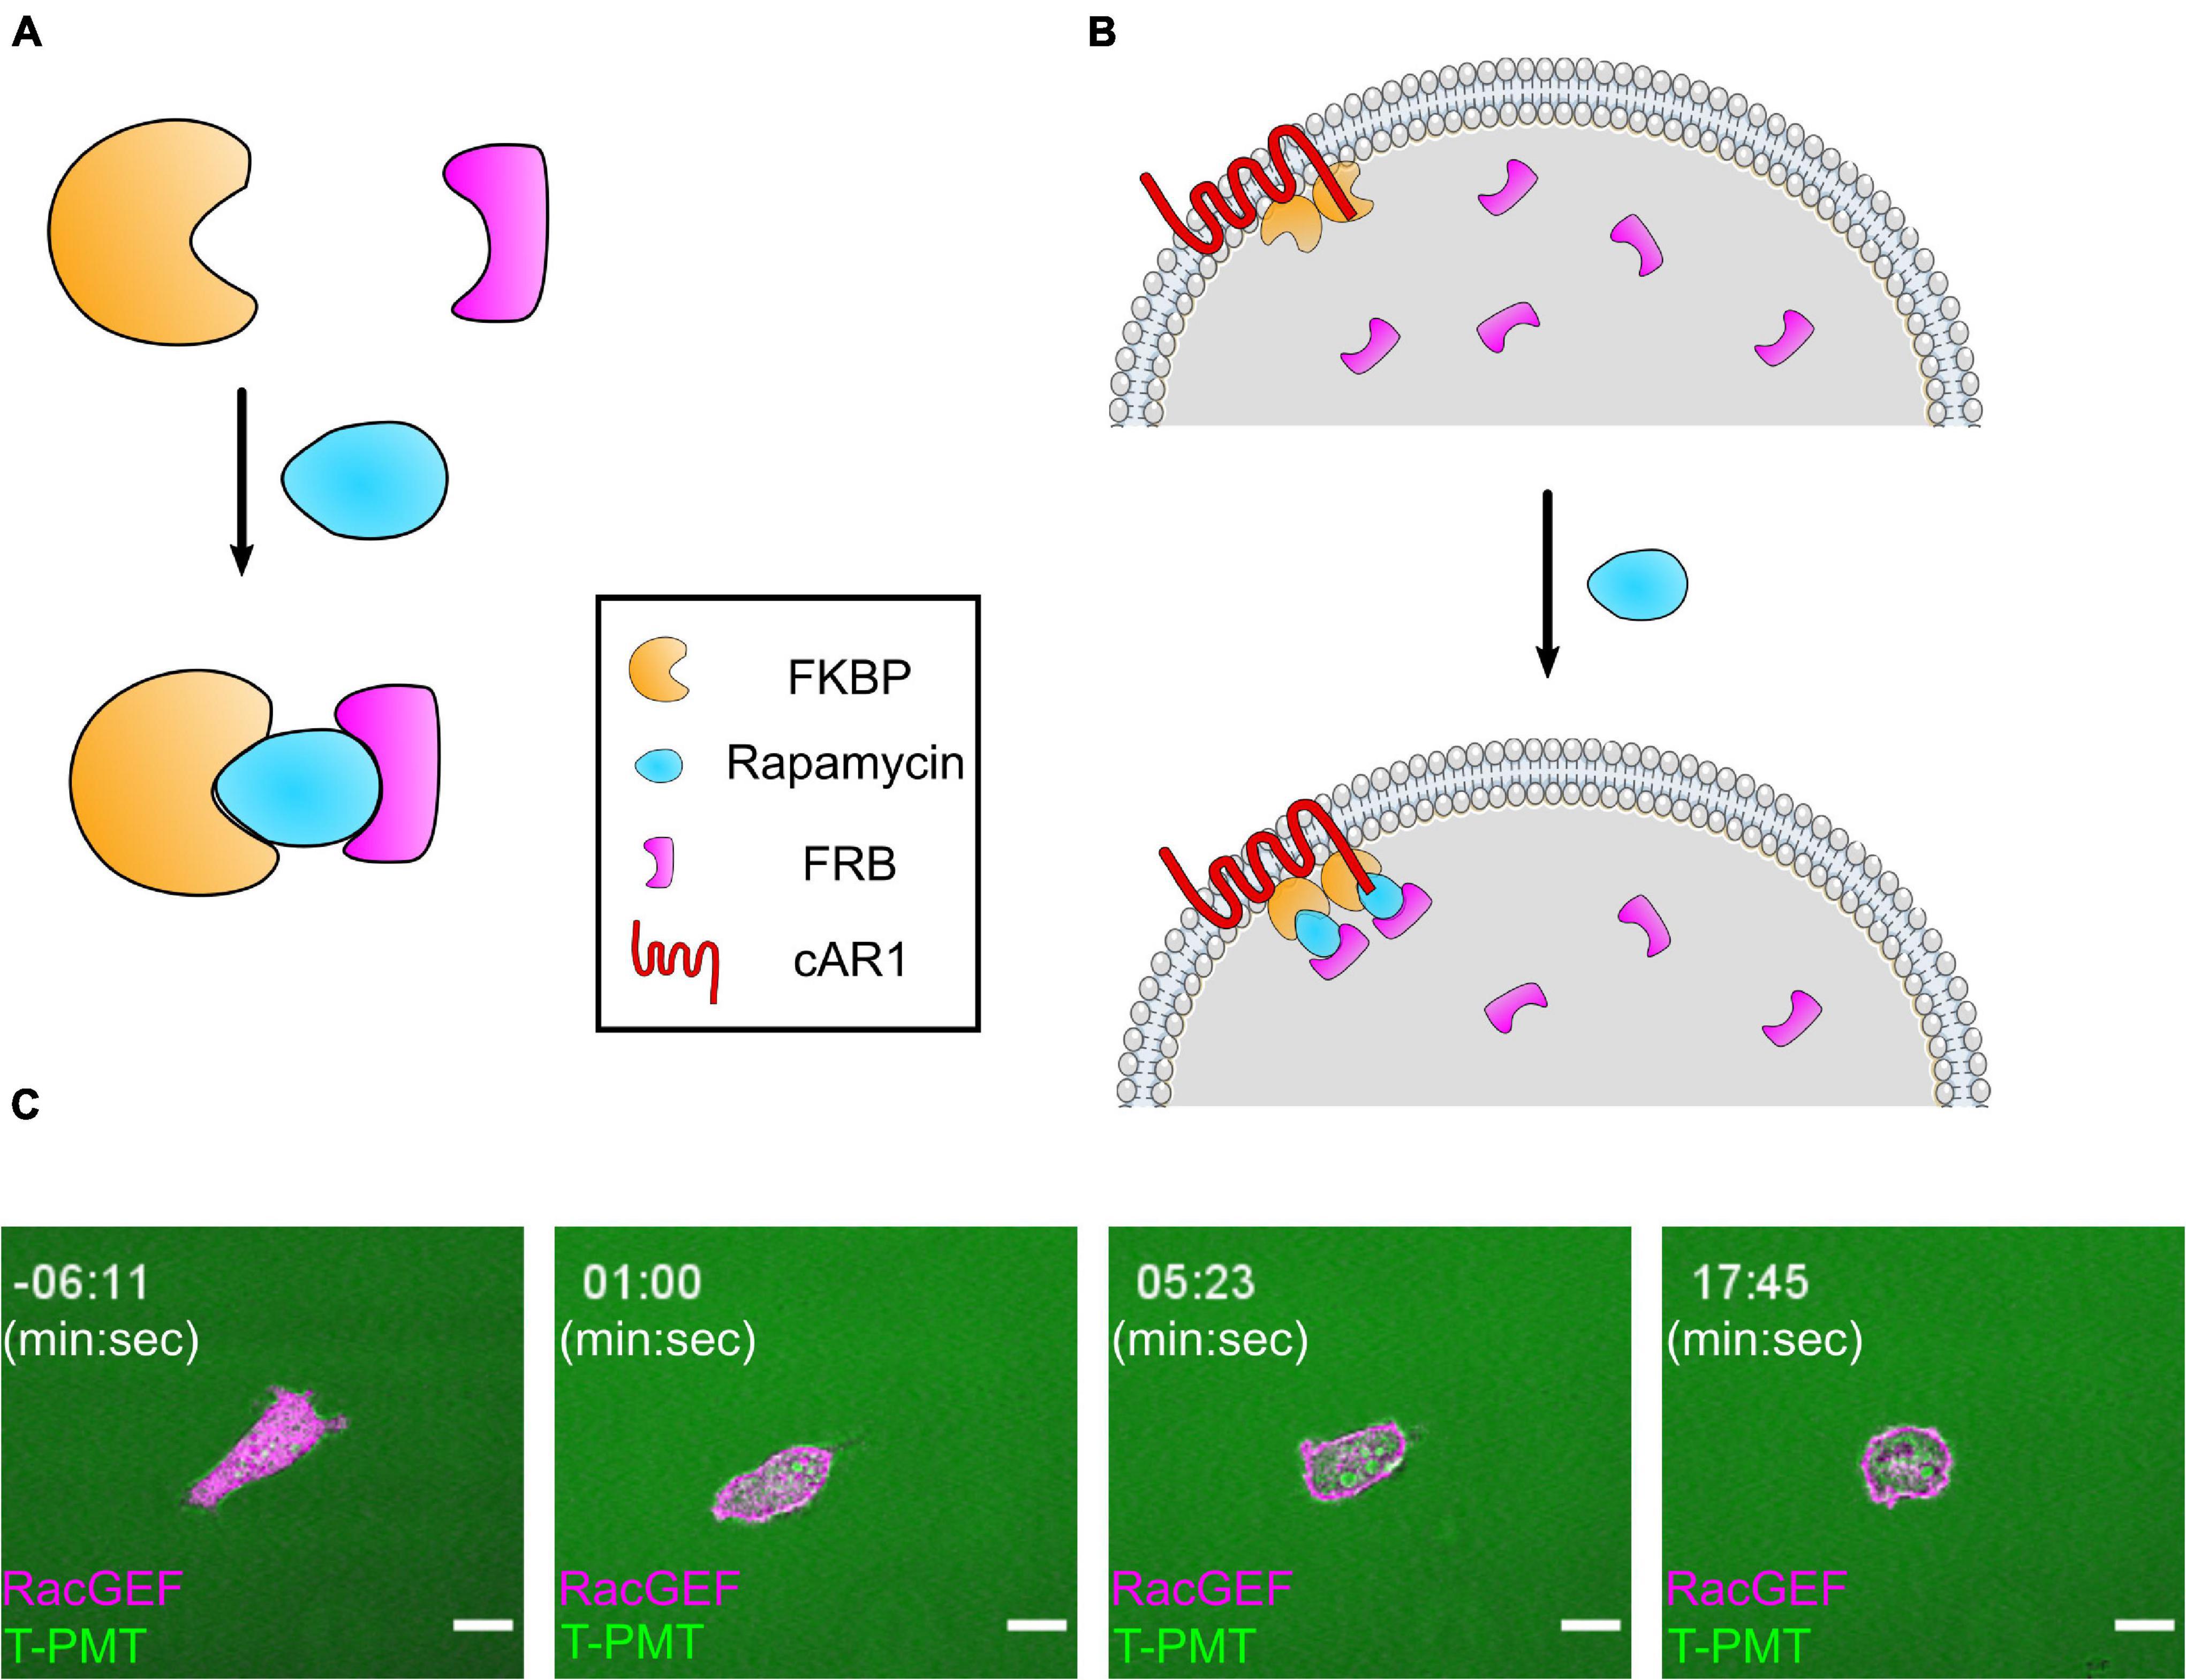
Figure 4. The FKBP/FRB system and its application in cells. (A) Diagram of FKBP/FRB system. FKBP and FRB form a heterodimer in the presence of rapamycin. (B) Illustration of an experimental setup for recruiting a protein to the membrane with the FKBP/FRB system in Dictyostelium. 2 FKBP domains (FX2) are anchored to membrane by cAR1, and the actuator attached to an FRB domain is diffusing in the cytosol. When rapamycin is added, the actuator is recruited to membrane by binding to FKBP. (C) Scanning confocal imaging of an AX3 Dictyostelium cell expressing a CID system designed to increase RacB and Rac1A activity. The cell is expressing cAR1-FKBP-FKBP (unlabeled) and mCherry-FRB-RacGEF1ΔN, an activator of Rac1 fused to an FRB domain. After rapamycin addition, RacGEF1ΔN is recruited to the membrane. Consistent with previous reports, the cell became very round with small, short-lived protrusions. Scale bars = 10 μm. t = 00:00 indicates rapamycin addition.
The CID system allows researchers to separate how changes in different parts of the directed migration network affect cell function. For example, a truncated, membrane-recruitable RacGEF1 can be used to increase actin polymerization across the cell membrane (Figure 4C and Supplementary Movie 1). While cAMP stimulation leads to actin polymerization through a signaling cascade, this perturbation directly activates the actin nucleator WASP. Similar to cAMP stimulation and STEN activation, RacGEF1 membrane recruitment causes cells to flatten out as actin polymerizes in all directions (Figure 4C and Supplementary Movie 1) (Miao et al., 2019). However, unlike upstream perturbations, direct upregulation of actin polymerization leads to a large decrease in Ras activation (Miao et al., 2019). This negative feedback from CEN to STEN was only uncovered by choosing a specific downstream entry point into the chemotaxis pathway. When designing FKBP-FRB experiments in Dictyostelium like this one, there are many important considerations in design and execution, which will be discussed below. For a summary of these considerations, see Quick Start Guide 1.
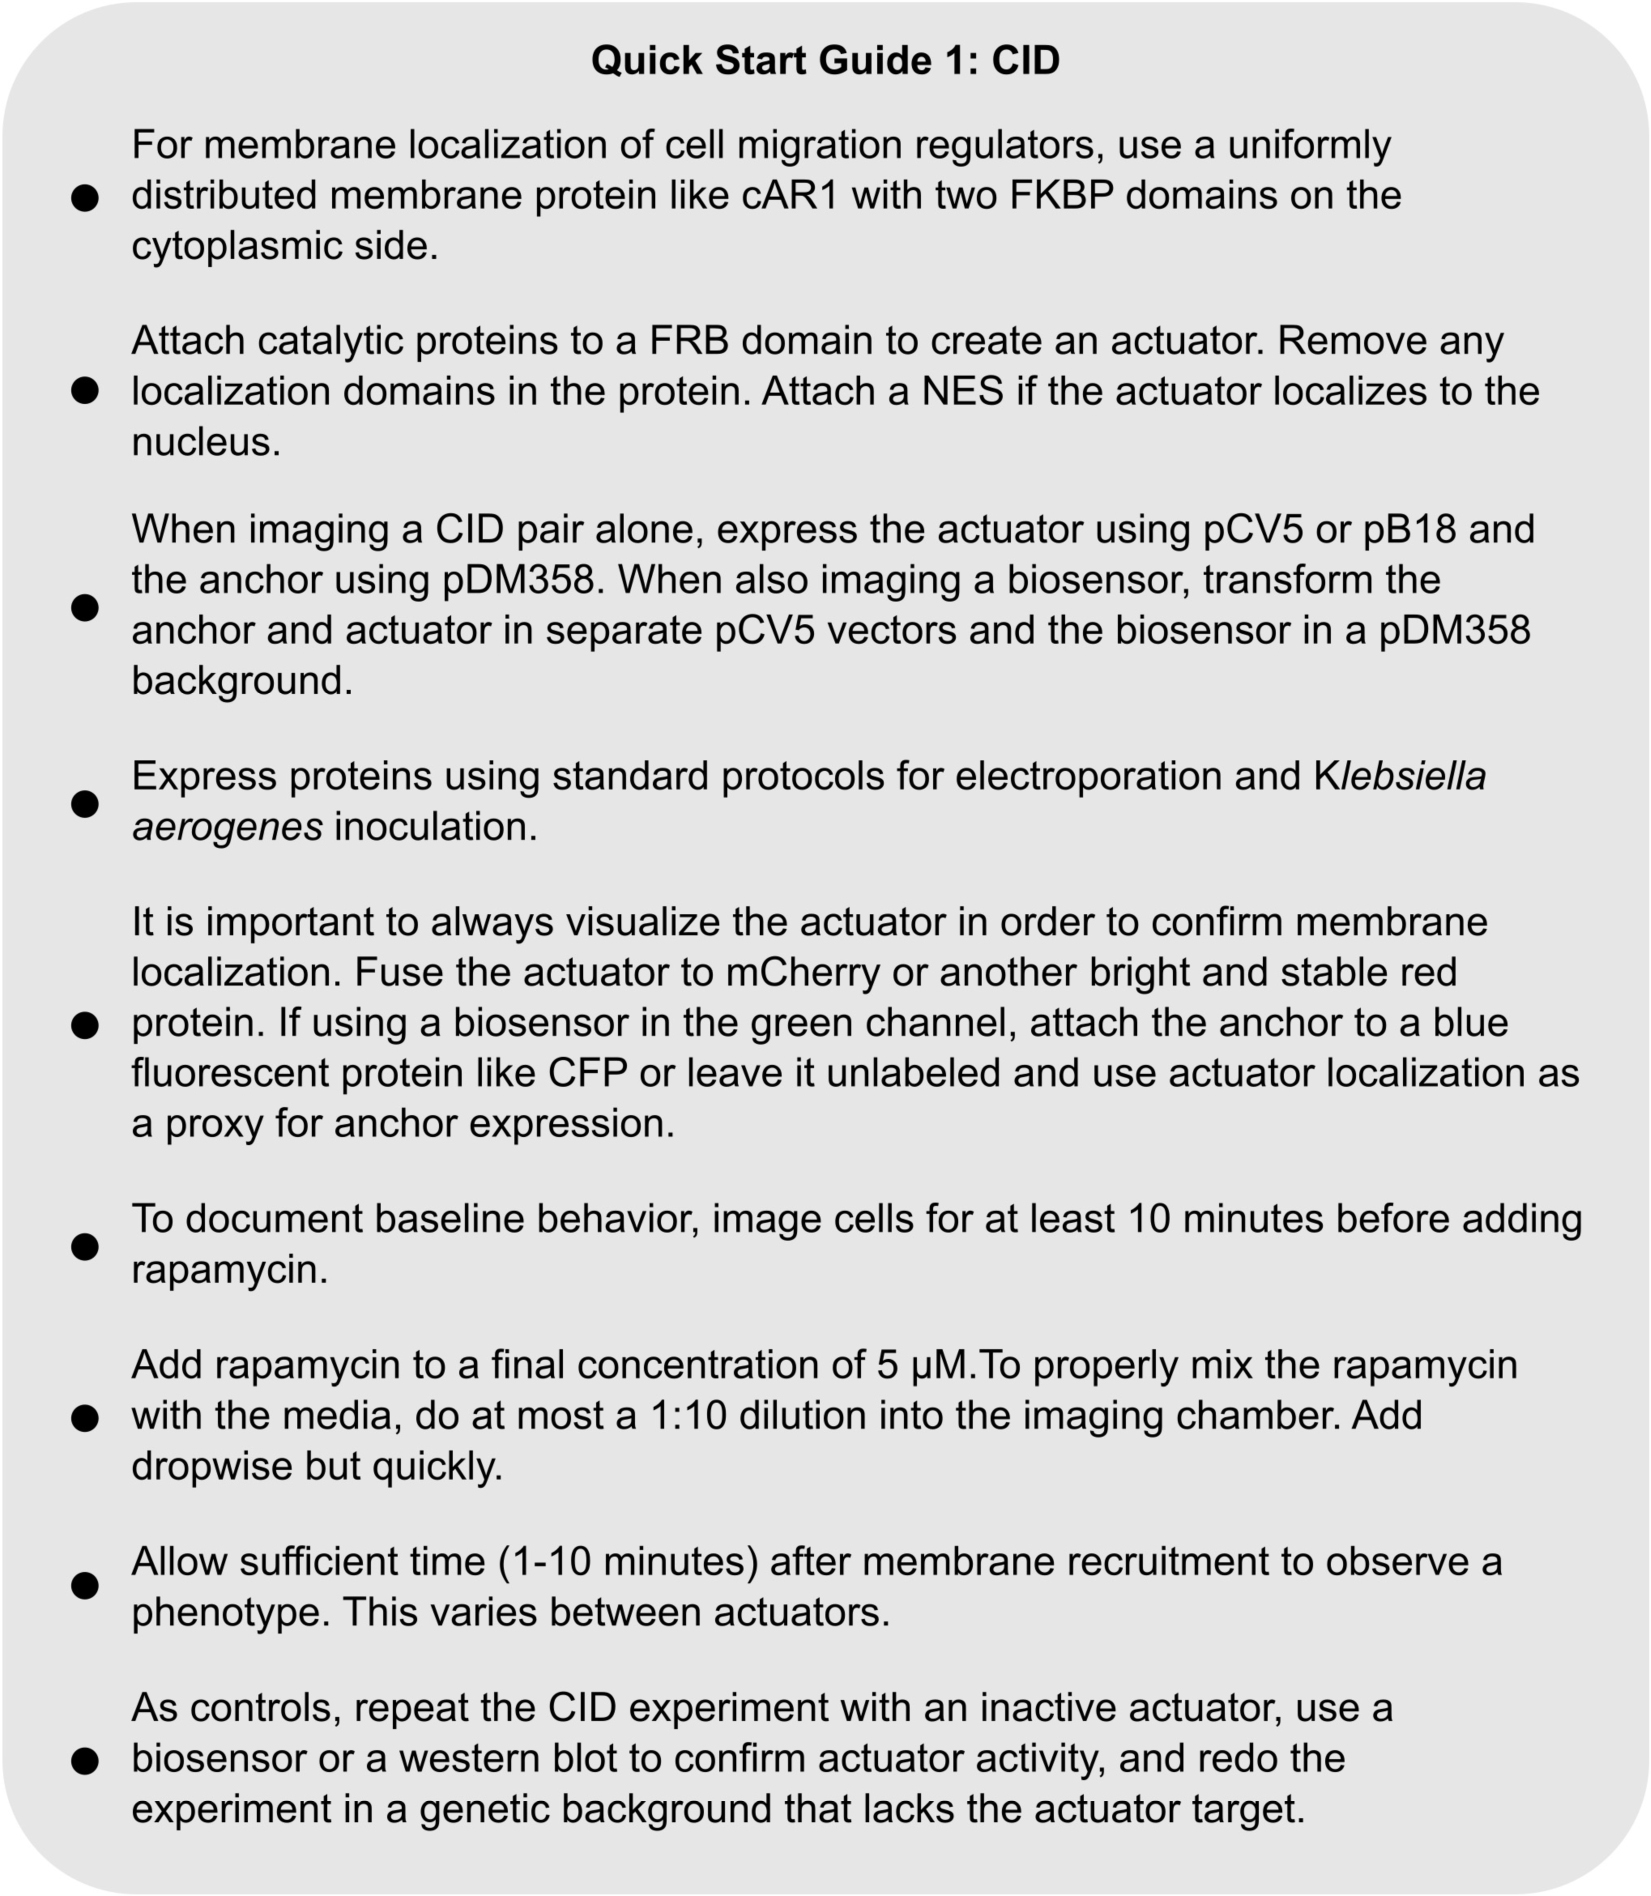
QUICK START GUIDE 1. Instructions for designing and carrying out a chemically induced dimerization experiment in Dictyostelium.
The anchor fusion protein determines where a protein of interest localizes within a cell once rapamycin is added. In order to function correctly, it must be stable, highly expressed, and uniformly distributed at the organelle of choice. Because most regulation of directed migration occurs at the membrane or close to it at the cortex, this guide will focus on anchors to recruit proteins to the inner side of the plasma membrane. For a list of other organelle localization strategies, see Derose et al. (2013). Designing a plasma membrane anchor is simple: the targeting sequence or protein must localize uniformly at the plasma membrane and not interfere with cell function. To ensure that the actuator localizes to the membrane instead of the reverse, the anchor must also have slow turnover rate within the plasma membrane. For specific details of recommended anchors, see the Supplementary Methods.
The design of actuators is more involved and varied than anchors. When adapting a protein for use in a CID system, it is important to take its specific biology into account. To illustrate, consider a system designed to transiently raise Ras activity. Because Ras targets involved in cell migration are primarily at the membrane, a constitutively active FRB-tagged RasC mutant (RasCQ62L) which could be recruited to the membrane was created. To prevent actuator expression from affecting the cell prior to rapamycin addition, the membrane localization domain (a C-terminal CAAX) was deleted (Miao et al., 2017). When this FRB-RasCQ62LΔCAAX was expressed along with a Myr-2XFKBP anchor, robust membrane localization of the actuator was observed only after rapamycin addition. FRB-RasCQ62LΔ CAAX membrane localization coincided with large increases in PIP3 levels, actin polymerization, and protrusion size. A similar approach can be taken to many classes of molecules, including kinases, phosphatases, and GEFs (Miao et al., 2019). As a general guideline, actuators must be catalytic (as opposed to structural), specific to a process of interest, and have low activity when not localized to the correct region of the cell.
The primary consideration for expressing CID components is actuator abundance. In previous experiments, transforming the actuator in a high copy number vector was required to observe a phenotype after recruitment (Miao et al., 2017, 2019). When imaging cells in a CID experiment, it is critical to confirm that the actuator is expressed at high levels and localizes to the membrane after rapamycin addition. Therefore, the actuator should always be fused to a bright fluorescent protein. While imaging the membrane anchor is helpful for confirming expression, it is often more useful to leave the anchor unlabeled and also express a fluorescent biosensor. For example, by imaging GFP-conjugated PIP3 and actin polymerization biosensors before and after recruitment of mCherry-FRB-RasCQ62LΔCAAX, the Devreotes Lab showed that transient increases in Ras activation led to larger fronts of Actin and PIP3 (Miao et al., 2017). Refer to the Supplementary Methods for more information.
To confirm that a CID system is working as intended, it is important to show that phenotypic changes are due to the activity of the localized protein rather than some effect of rapamycin addition or an off-target effect. Repeat the CID experiment with an inactive version of the activator, like a catalytic domain mutant. Additionally, confirm that the actuator is acting on its target: For example, membrane localization of a PI(4,5)P2 biosensor should drop after recruiting a PI(4,5) phosphatase (Miao et al., 2017). This can also be done by measuring bulk differences in the levels of a target protein using western blot. However heterogeneous expression of the CID system makes it difficult to observe population-level changes. Finally, confirm that the actuator is affecting the desired pathway by repeating the CID experiment in a knockout or knockdown strain of the intended target protein. For specific guidelines for setting up and performing a CID experiment, see the Supplementary Methods.
In cell biology, optogenetics is a tool for controlling the location and activity of proteins within living cells (Figure 5; Toettcher et al., 2011). Optogenetics takes advantage of protein domains that change conformation when exposed to a specific wavelength of light. This conformational change exposes a binding domain or separates protein domains (Kennedy et al., 2010; Strickland et al., 2012; Wang et al., 2016; Van Haren et al., 2018). In conjunction with a patterned illumination system like a Digital Micromirror Device (DMD) or a scanning confocal, optogenetic systems allow for temporal control of protein activity at the subcellular level. This review will focus two separate optogenetic systems which are relatively user-friendly: Cry2PHR-CIBN and iLID-SSBP (Kennedy et al., 2010; Guntas et al., 2015). Like CID, these systems can be used to recruit cell migration regulators to the cell membrane by attaching one domain to a uniform membrane protein and one to a catalytic domain. This has some distinct advantages over CID experiments, including subcellular control, reversibility, and the ability to perform many sequential experiments on one dish. However, optogenetics requires more specialized equipment than CID experiments and both systems are activated by 488 nm light (maximally at 440 nm), making it impossible to image green fluorescent proteins. For a summary of optogenetics instructions, see Quick Start Guide 2.
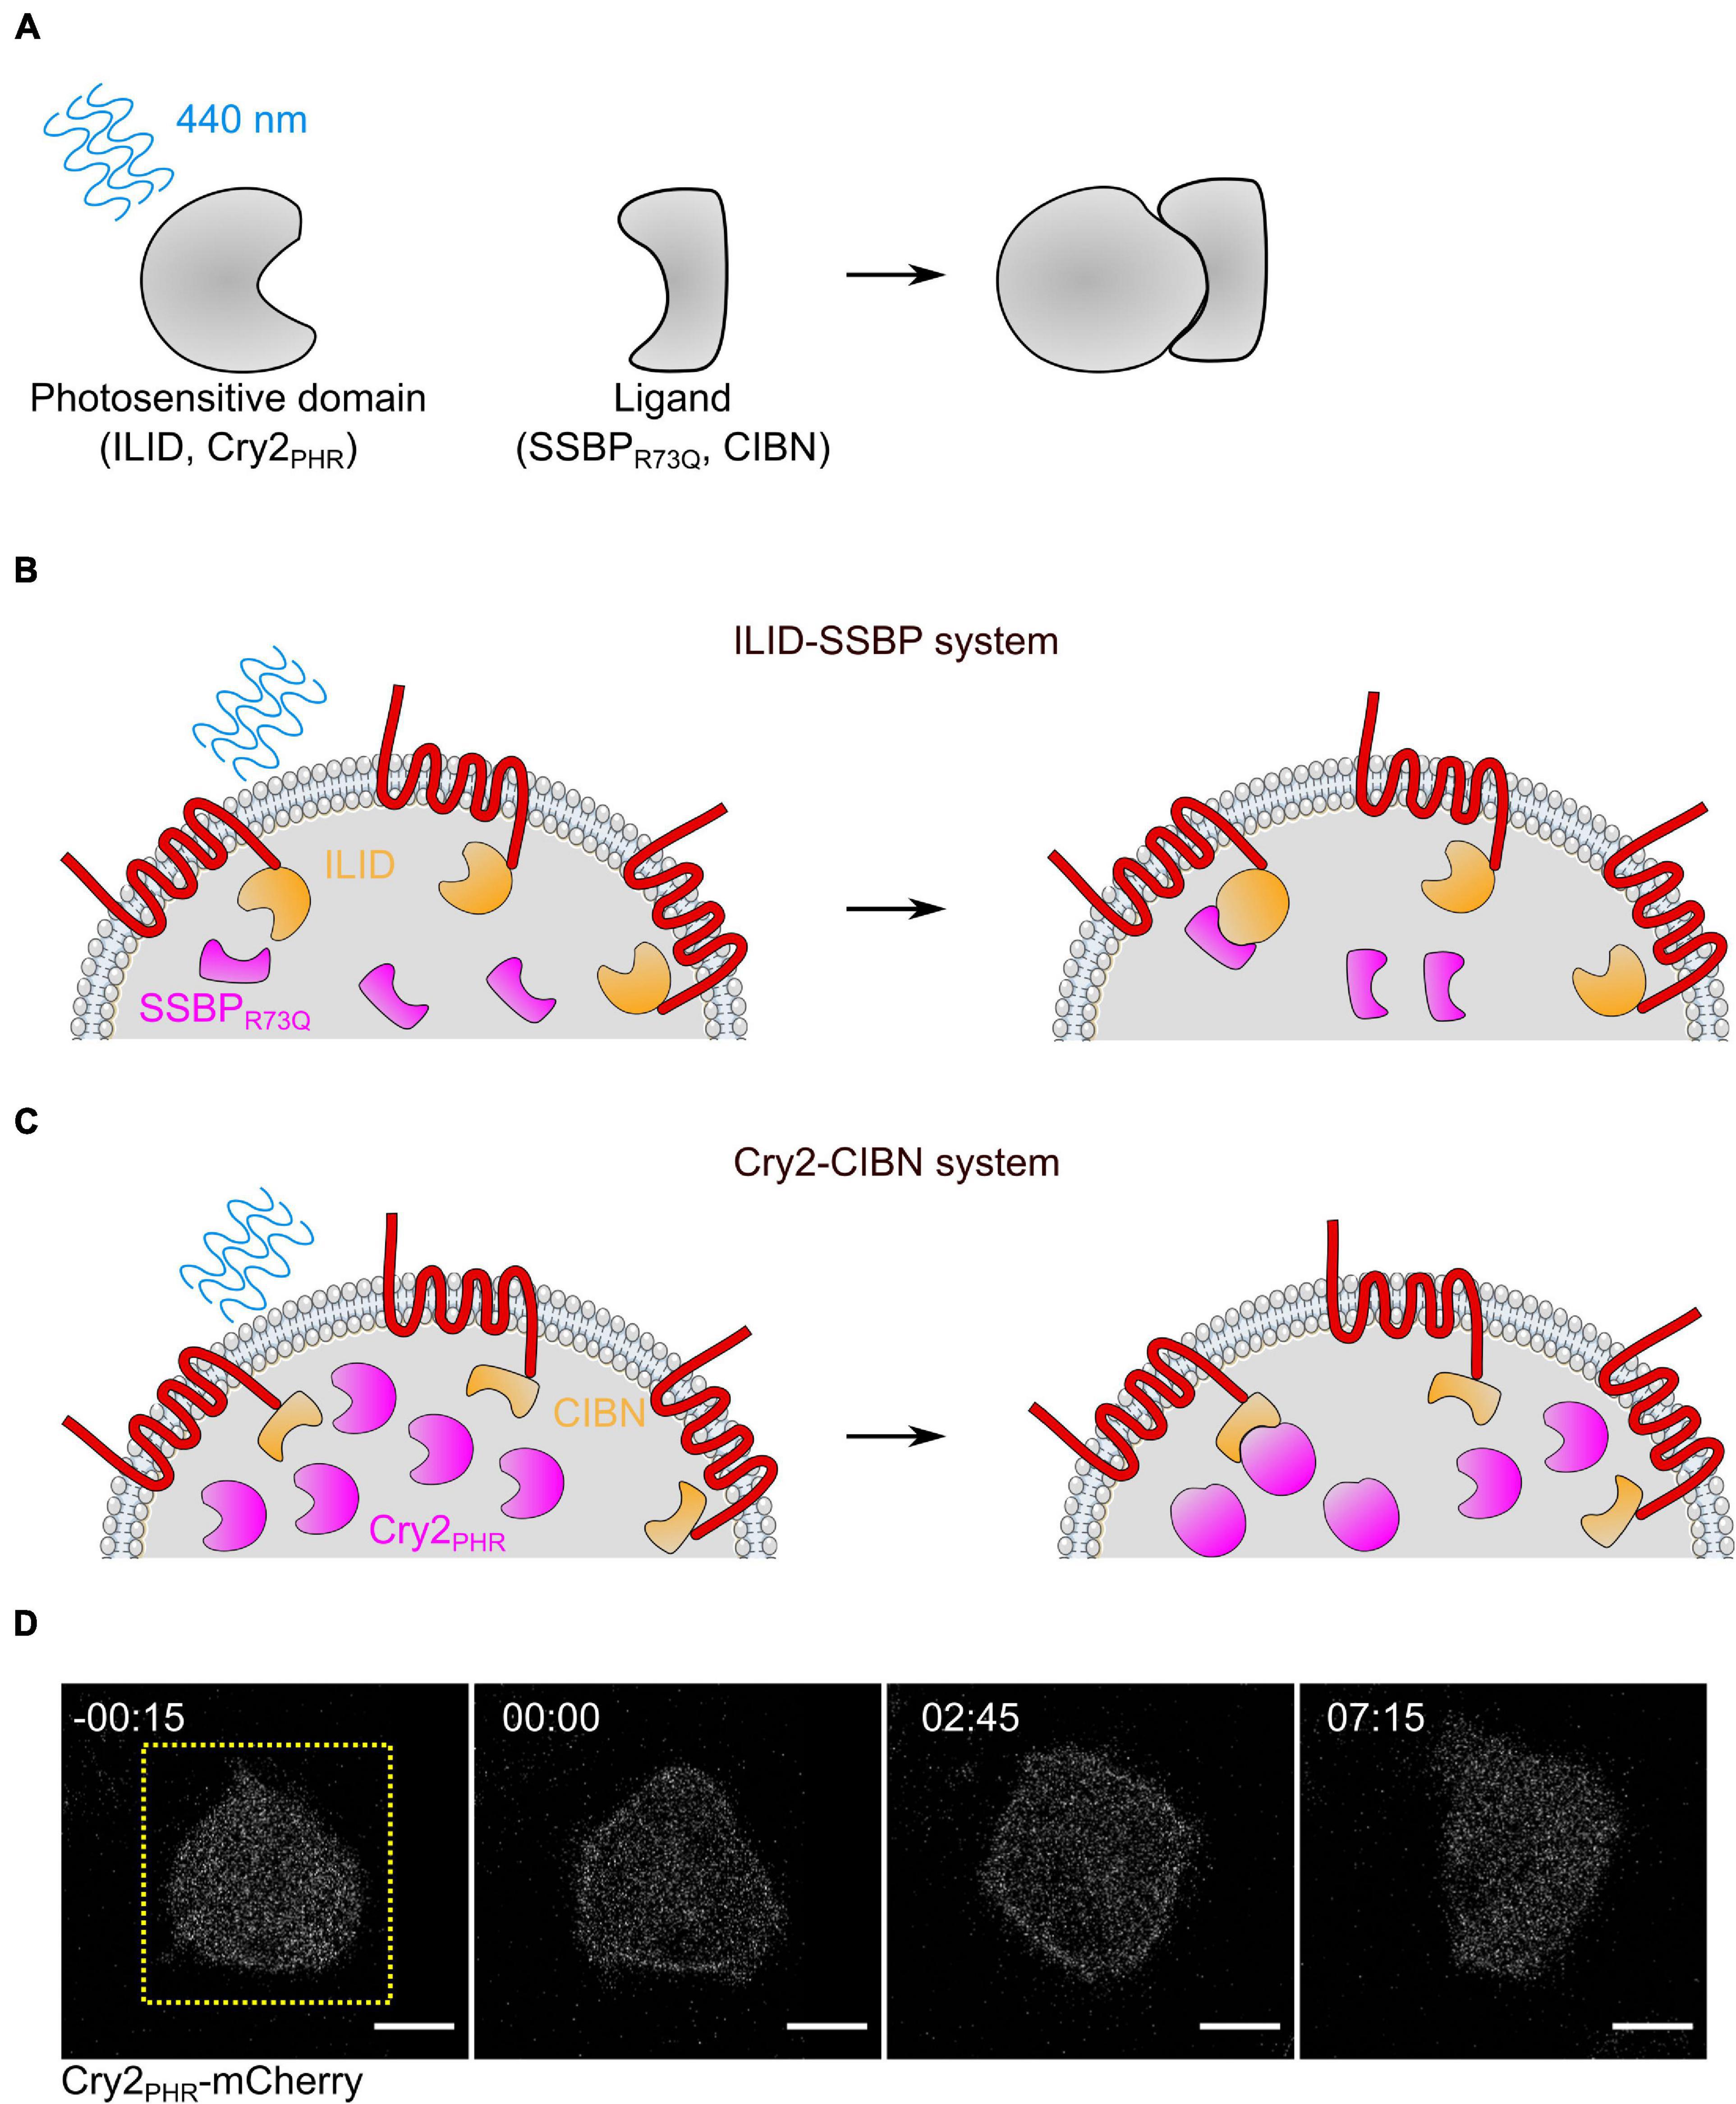
Figure 5. Optogenetic systems for controlling protein localization in Dictyostelium. (A) Diagram of blue light dimerization systems. In the dark, a photosensitive protein (iLID or Cry2PHR) has low affinity for its ligand (SSBPR73Q or CIBN, respectively). When exposed to 450 nm light, a conformational change in the photosensitive domain allows it to bind to the ligand with affinity. (B,C) Diagram of iLID-based (B) and Cry2-based (C) systems for recruiting proteins to the membrane in Dictyostelium. The actuator (magenta) is recruited to the uniformly distributed membrane anchor (orange) only at the area exposed to blue light. Note that in the iLID system, the photosensitive protein is attached to the membrane anchor, while in the Cry2 system, it is attached to the cytosolic actuator. (D) Scanning confocal imaging of Cry2PHR membrane recruitment in AX3 Dictyostelium cells. Cells are also expressing an unlabeled membrane anchor, cAR1-CIBN. Yellow dashed square indicates region illuminated with 488 nm light. Scale bars = 5 μm. t = 00:00 indicates blue light stimulation.
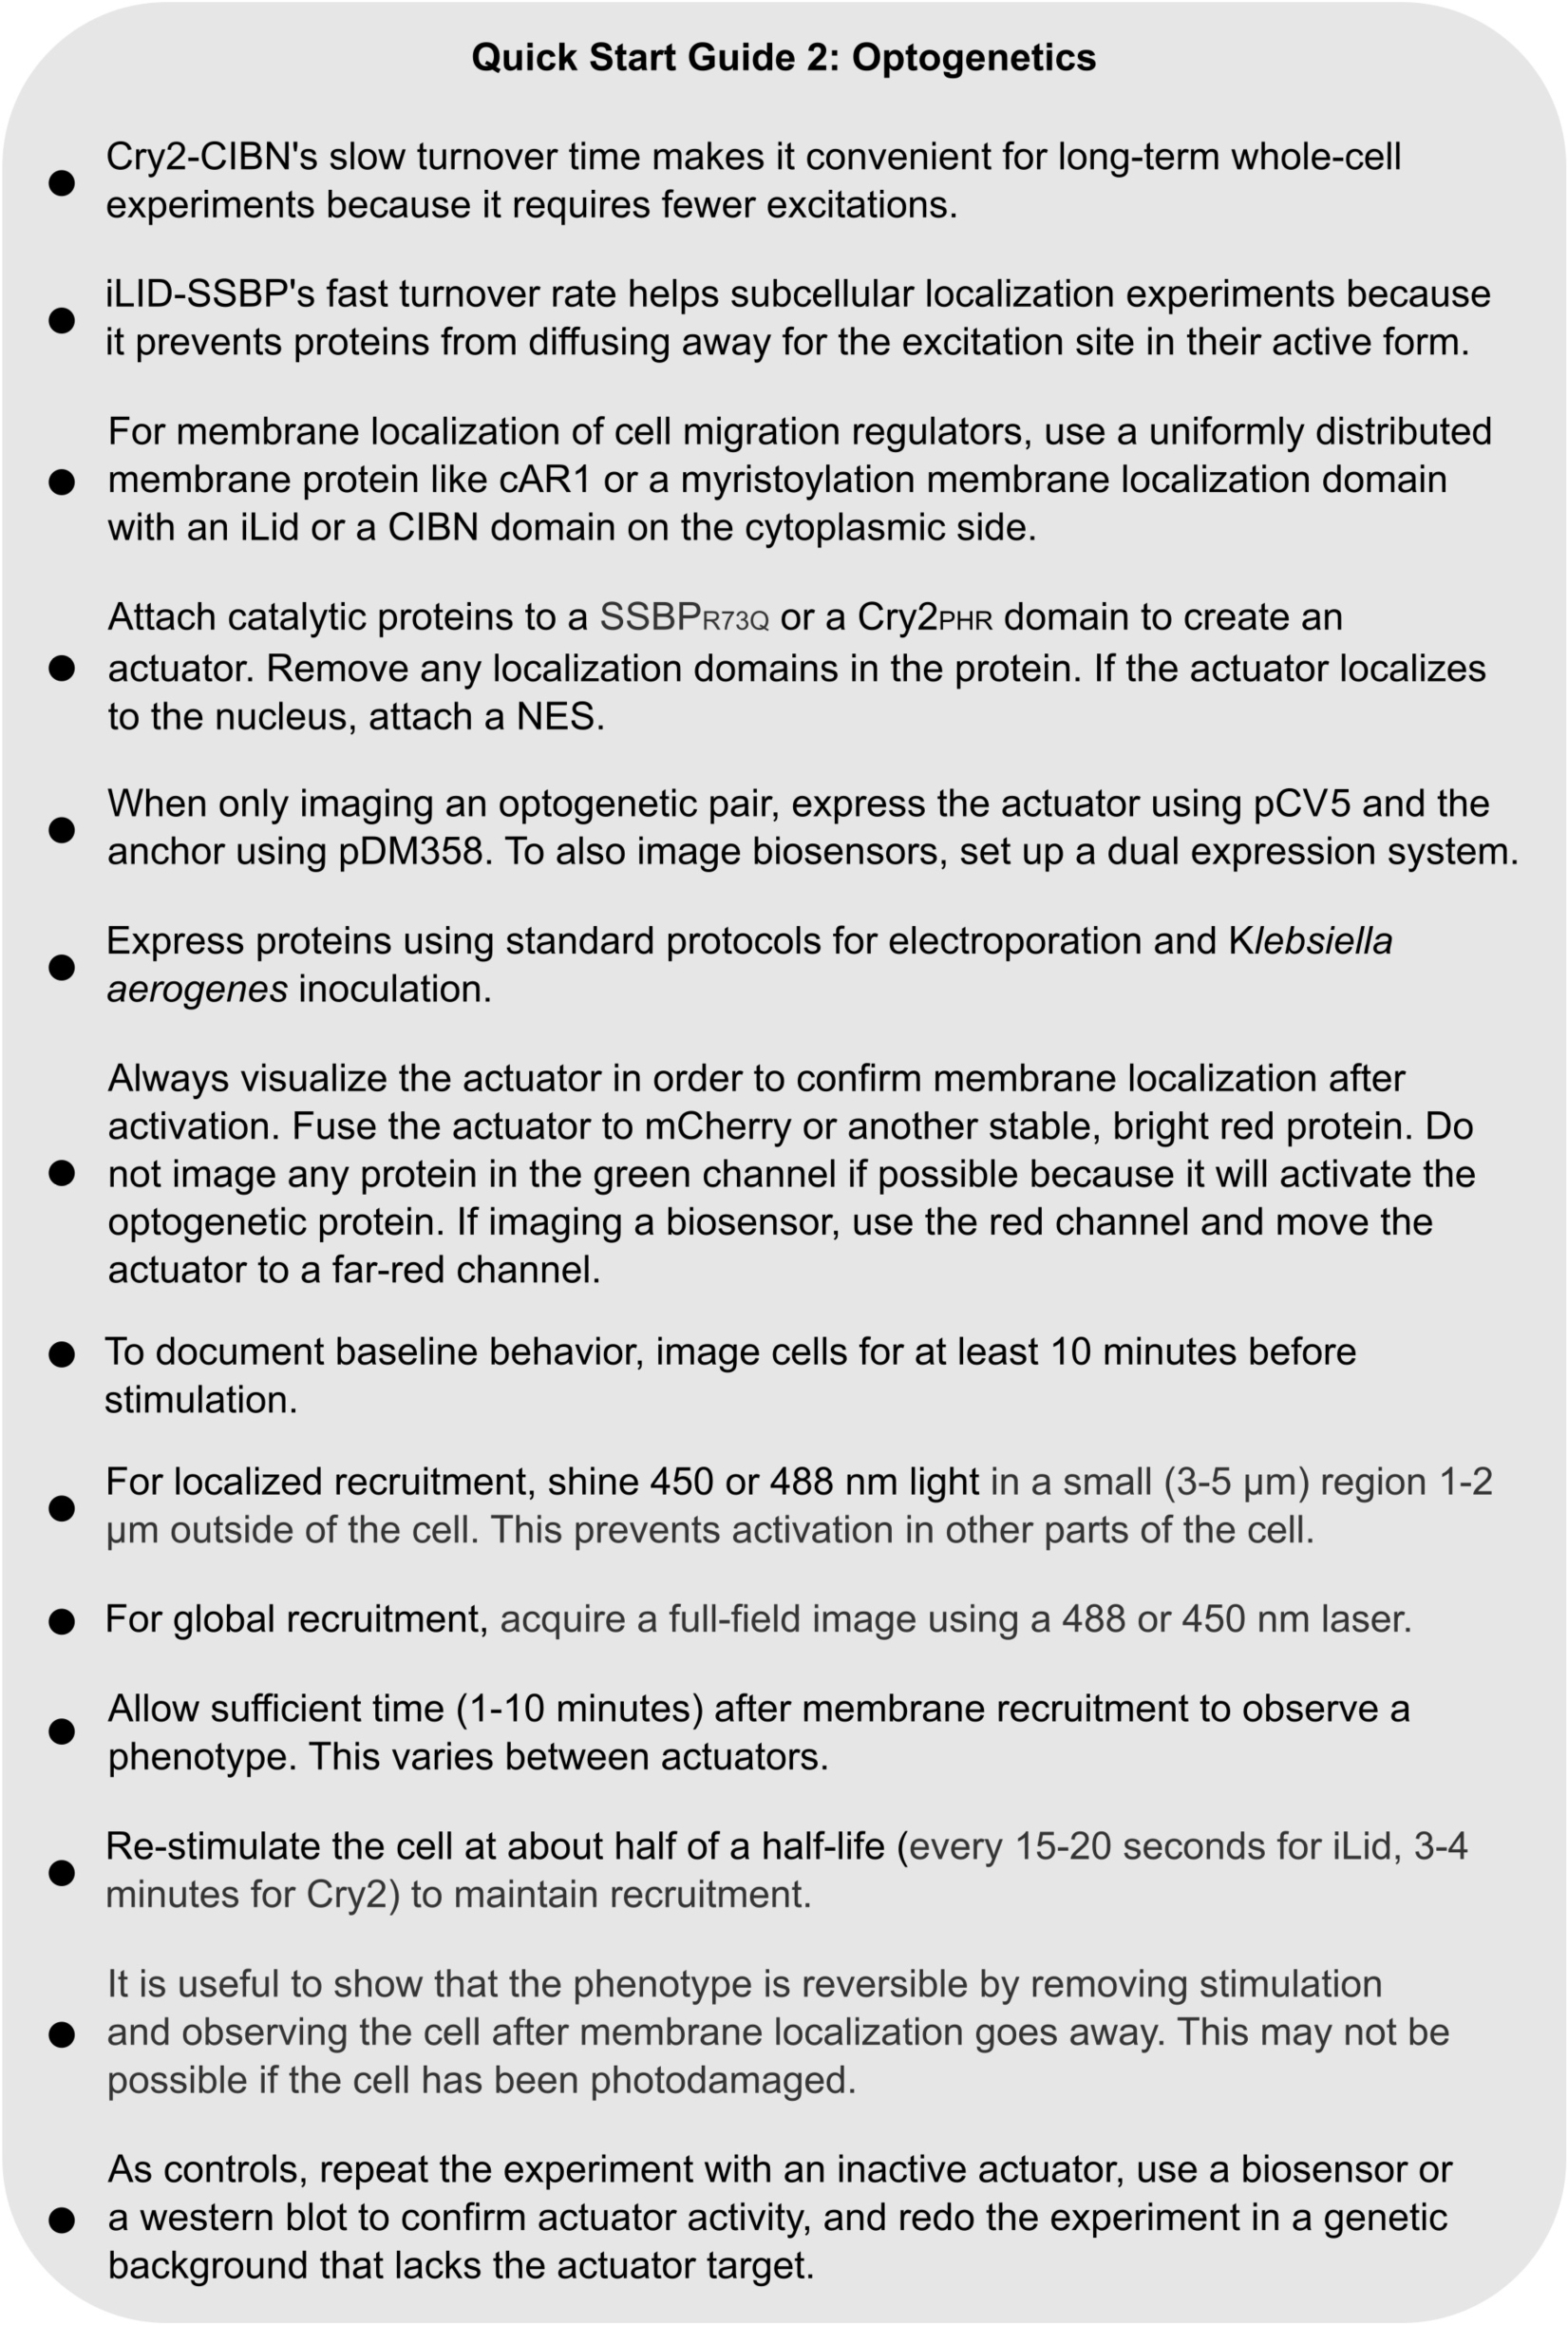
QUICK START GUIDE 2. Instructions for designing and carrying out an optogenetic experiment with Cry2-CIBN or an iLID system in Dictyostelium.
The Cry2PHR domain, based on a plant cryptochrome, binds to CIBN domains in the presence of 450 nm light (Kennedy et al., 2010). Similarly, iLID is a modified LOV domain from Avena sativa that binds to a small, engineered peptide – SSBP – when exposed to blue light (Guntas et al., 2015). The primary difference is turnover time: the Cry2-CIBN interaction has a half-life of 6 min while iLID-SSBP has a half-life of 30 seconds. The short half-life of iLID makes it ideal for subcellular localization because stimulated protein cannot diffuse far from the excitation site. In Cry2 systems, the activated protein can diffuse far away from the light source while remaining active. However, Cry2 requires less periodic reactivation to maintain recruitment, making it easier to work with for whole-cell experiments. In Dictyostelium, Cry2 rapidly localizes to the plasma membrane of cells expressing a CIBN membrane anchor, and remains localized minutes later (Figure 5D and Supplementary Movie 2). Which protein is more suitable for an experiment depends on the specific biology of the system to be perturbed. For more information about designing optogenetic constructs and performing optogenetic experiments, see the Supplementary Methods.
There are two primary experimental readouts to quantify after altering cell behavior: cell morphology and biosensor organization. Both properties provide important context that the other does not. For example, it has recently been observed that there are at least two mechanisms which lead to an increase in cell area: increased actin polymerization and increased cell adhesion (Thomas Lampert et al., 2017). Without imaging biosensors of actin polymerization, it would be difficult to determine why a particular actuator leads to cell flattening. The section below will describe how to quantify and display changes in cell morphology and biosensors before and after altering protein activities.
One of the most important parts of an image analysis pipeline is the initial design of the imaging experiment. There are many problems that are very difficult and time-consuming to fix when processing images which can be avoided when acquiring the data. For example, if two cells touch each other, simple segmentation algorithms often join them into one object, altering the cell area and shape. There are solutions to this problem (e.g., watershed algorithms, Gamarra et al., 2019), but they often need to be tuned dynamically between time points and cells. It is much simpler to plate cells at a low enough density to make two labeled cells touching unlikely. For specific recommendations for plating and imaging cells, see the Supplementary Methods and Quick Start Guide 3.
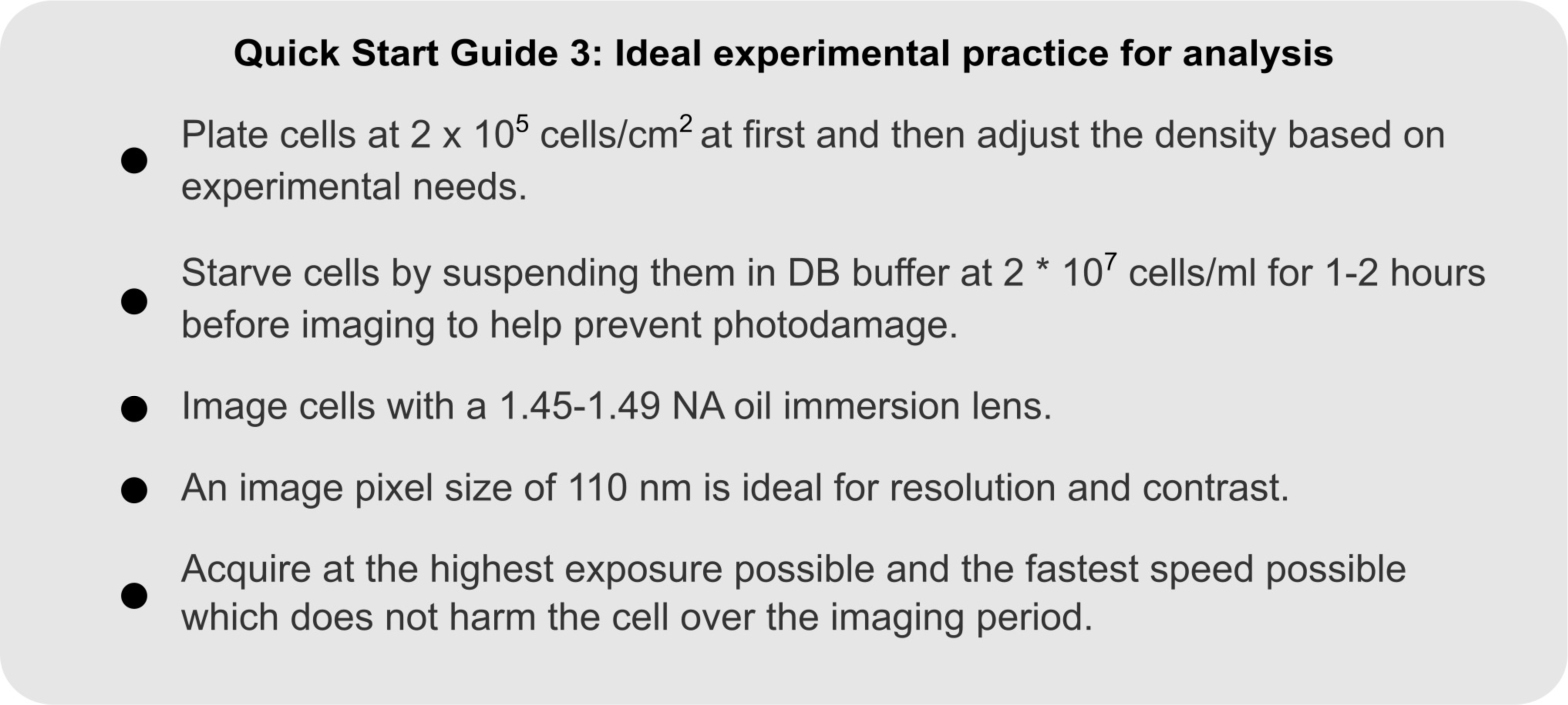
QUICK START GUIDE 3. Guidelines for optimizing Dictyostelium imaging conditions, with the goal of quantitatively analyzing the output.
Changing the activity or levels of cell migration regulators can effect cell size, shape, and speed (Devreotes et al., 2017). These properties can be quantified without specialized labels and contain important information about underlying biological changes. Cell shape and motion can be measured manually using a program like ImageJ (Schindelin et al., 2012) or automatically with ImageJ scripting or a coding platform like Matlab or Python’s OpenCV library. There are tradeoffs to both methods: identifying cells by hand can be slow and subject to bias. However, writing code that can consistently find and track cells across many different datasets can potentially be more time-consuming than simply tracing the outline of cells frame-by-frame. Some important guidelines for each approach are discussed below.
In a CID or optogenetic experiment, either the actuator or the anchor can be used to track cells. Transmitted light techniques like DIC or phase contrast can also be used, though it may produce slightly different results than fluorescence depending on the imaging modality. Manual tracking can quickly uncover changes in cell behavior after perturbing directed migration machinery. For example, in 2017 the Devreotes lab analyzed the motion of cells after lowering the STEN threshold by reducing PI(4,5)P2 levels. These cells exhibited one of three distinct migratory modes: amoeboid cells moved small distances and changed directions, fan-shaped cells moved large distances in a single direction, and oscillators intermittently stopped before moving in a new random direction. While these populations could be segregated based on motion alone, they also had different morphologies: amoeboid cells had consistently low areas, fan-shaped cells had larger areas and a clear long axis, and oscillators showed periodic changes in area over a movement cycle (Miao et al., 2017). The observation that altering STEN properties dramatically alters the morphology of a migrating cell suggests that varying STEN and CEN activity could be partially responsible for the diversity of migratory behavior in nature. For more information on how to measure cell shape and track cells, refer to the Supplementary Methods and Quick Start Guide 4.
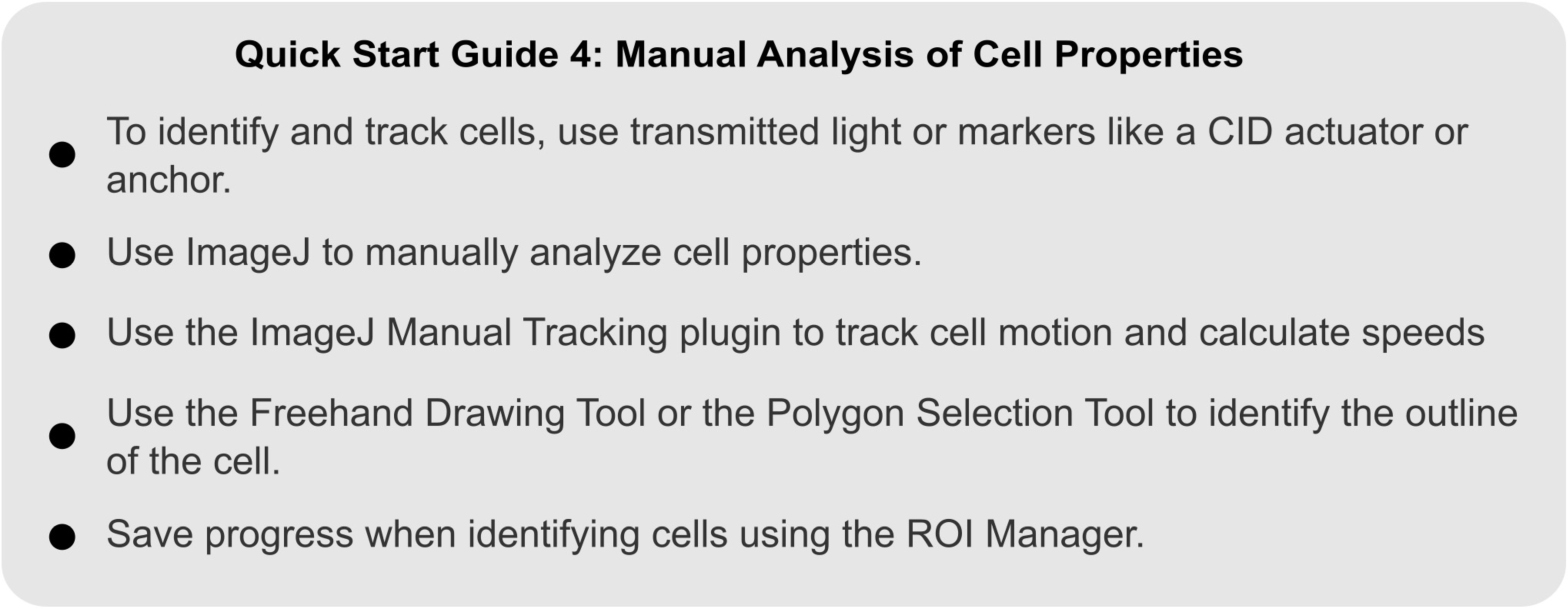
QUICK START GUIDE 4. Instructions for manually analyzing cell shape and motion in migrating Dictyostelium cells.
There are many pre-written programs designed to identify and track cells in motion (Emami et al., 2021), although they are not optimized for Dictyostelium. For tracking hundreds of cells adapting one of these approaches may be effective. For smaller sample sizes, manually tracking the cells in ImageJ using the Manual Tracking plugin is a simple way to skip a computationally difficult step. Then, with ImageJ, Matlab, or another analysis platform, use the actuator or anchor fluorescence to identify the shape of the cell. Refer to Supplementary Materials. Quick Start Guide 5 summarizes this segmentation protocol.
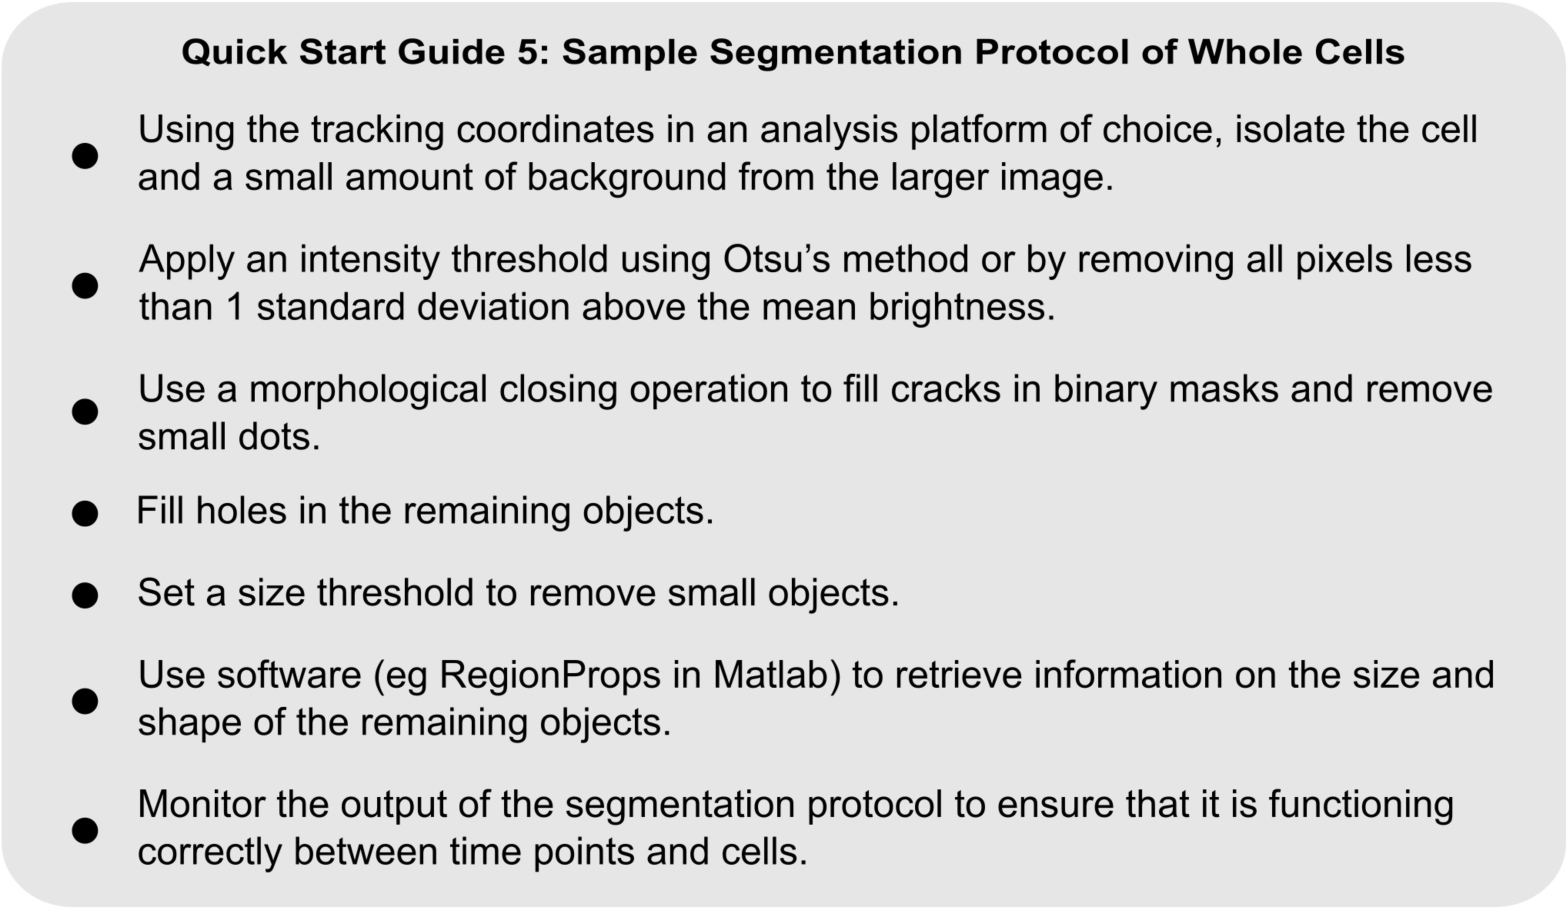
QUICK START GUIDE 5. Sample protocol for the automated identification of a Dictyostelium cell from microscopy images.
Fluorescent biosensors report on the level and location, and activity of specific molecules within the cell. In the context of directed cell migration, STEN and CEN biosensors localize along the cell periphery in patches to shape protrusions and travel along the bottom membrane as waves. The properties of these patches and waves (size, brightness, speed, location) contain important information about the properties of the directed migration network. How to quantify changes in STEN and CEN by monitoring bottom membrane waves and protrusions will be discussed here below.
Signal transduction excitable network and CEN biosensors travel in waves of front activity and complementary waves of back activity on the cell bottom (Figure 6A and Supplementary Movie 3). Previously, it has been shown that the peak-to-peak distance of STEN and CEN biosensors reports on their order in the directed migration pathway (Miao et al., 2019). Additionally, their speed, size, and propagation distance correspond to the timescale, activity, and threshold of STEN and CEN. Many of these properties can be measured by hand in ImageJ: using the line tool, draw a line in the direction of wave propagation which includes the wave and cellular background on both sides. Then, the Plot Profile tool can be used to obtain the intensity of all pixels along that line for each biosensor. Increasing the width of the line causes the tool to average over more pixels, decreasing measurement noise. After subtracting cellular background, the distance between two biosensors can be calculated by the difference between the maxima of each biosensor. This intensity profile can be also used to calculate the speed of the wave between frames and the integrated intensity of the biosensor (Figures 6B,C). For example, PI(3,4,5)P3 biosensor PHCRAC travels along the bottom membrane as a part of a front STEN wave (Figure 6A and Supplementary Movie 3). Back proteins, like PI(3,4,5)P3 phosphatase PTEN, are excluded from this same area. The speed of the STEN wave can be obtained by measuring the location of the PHCrac maxima over time (Figures 6B,C). This speed is directly influenced by STEN and CEN activity and can be increased by lowering the STEN threshold (Miao et al., 2019). Because these waves are bright and large structures, the previously described segmentation protocols can also be used for automated identification and analysis.
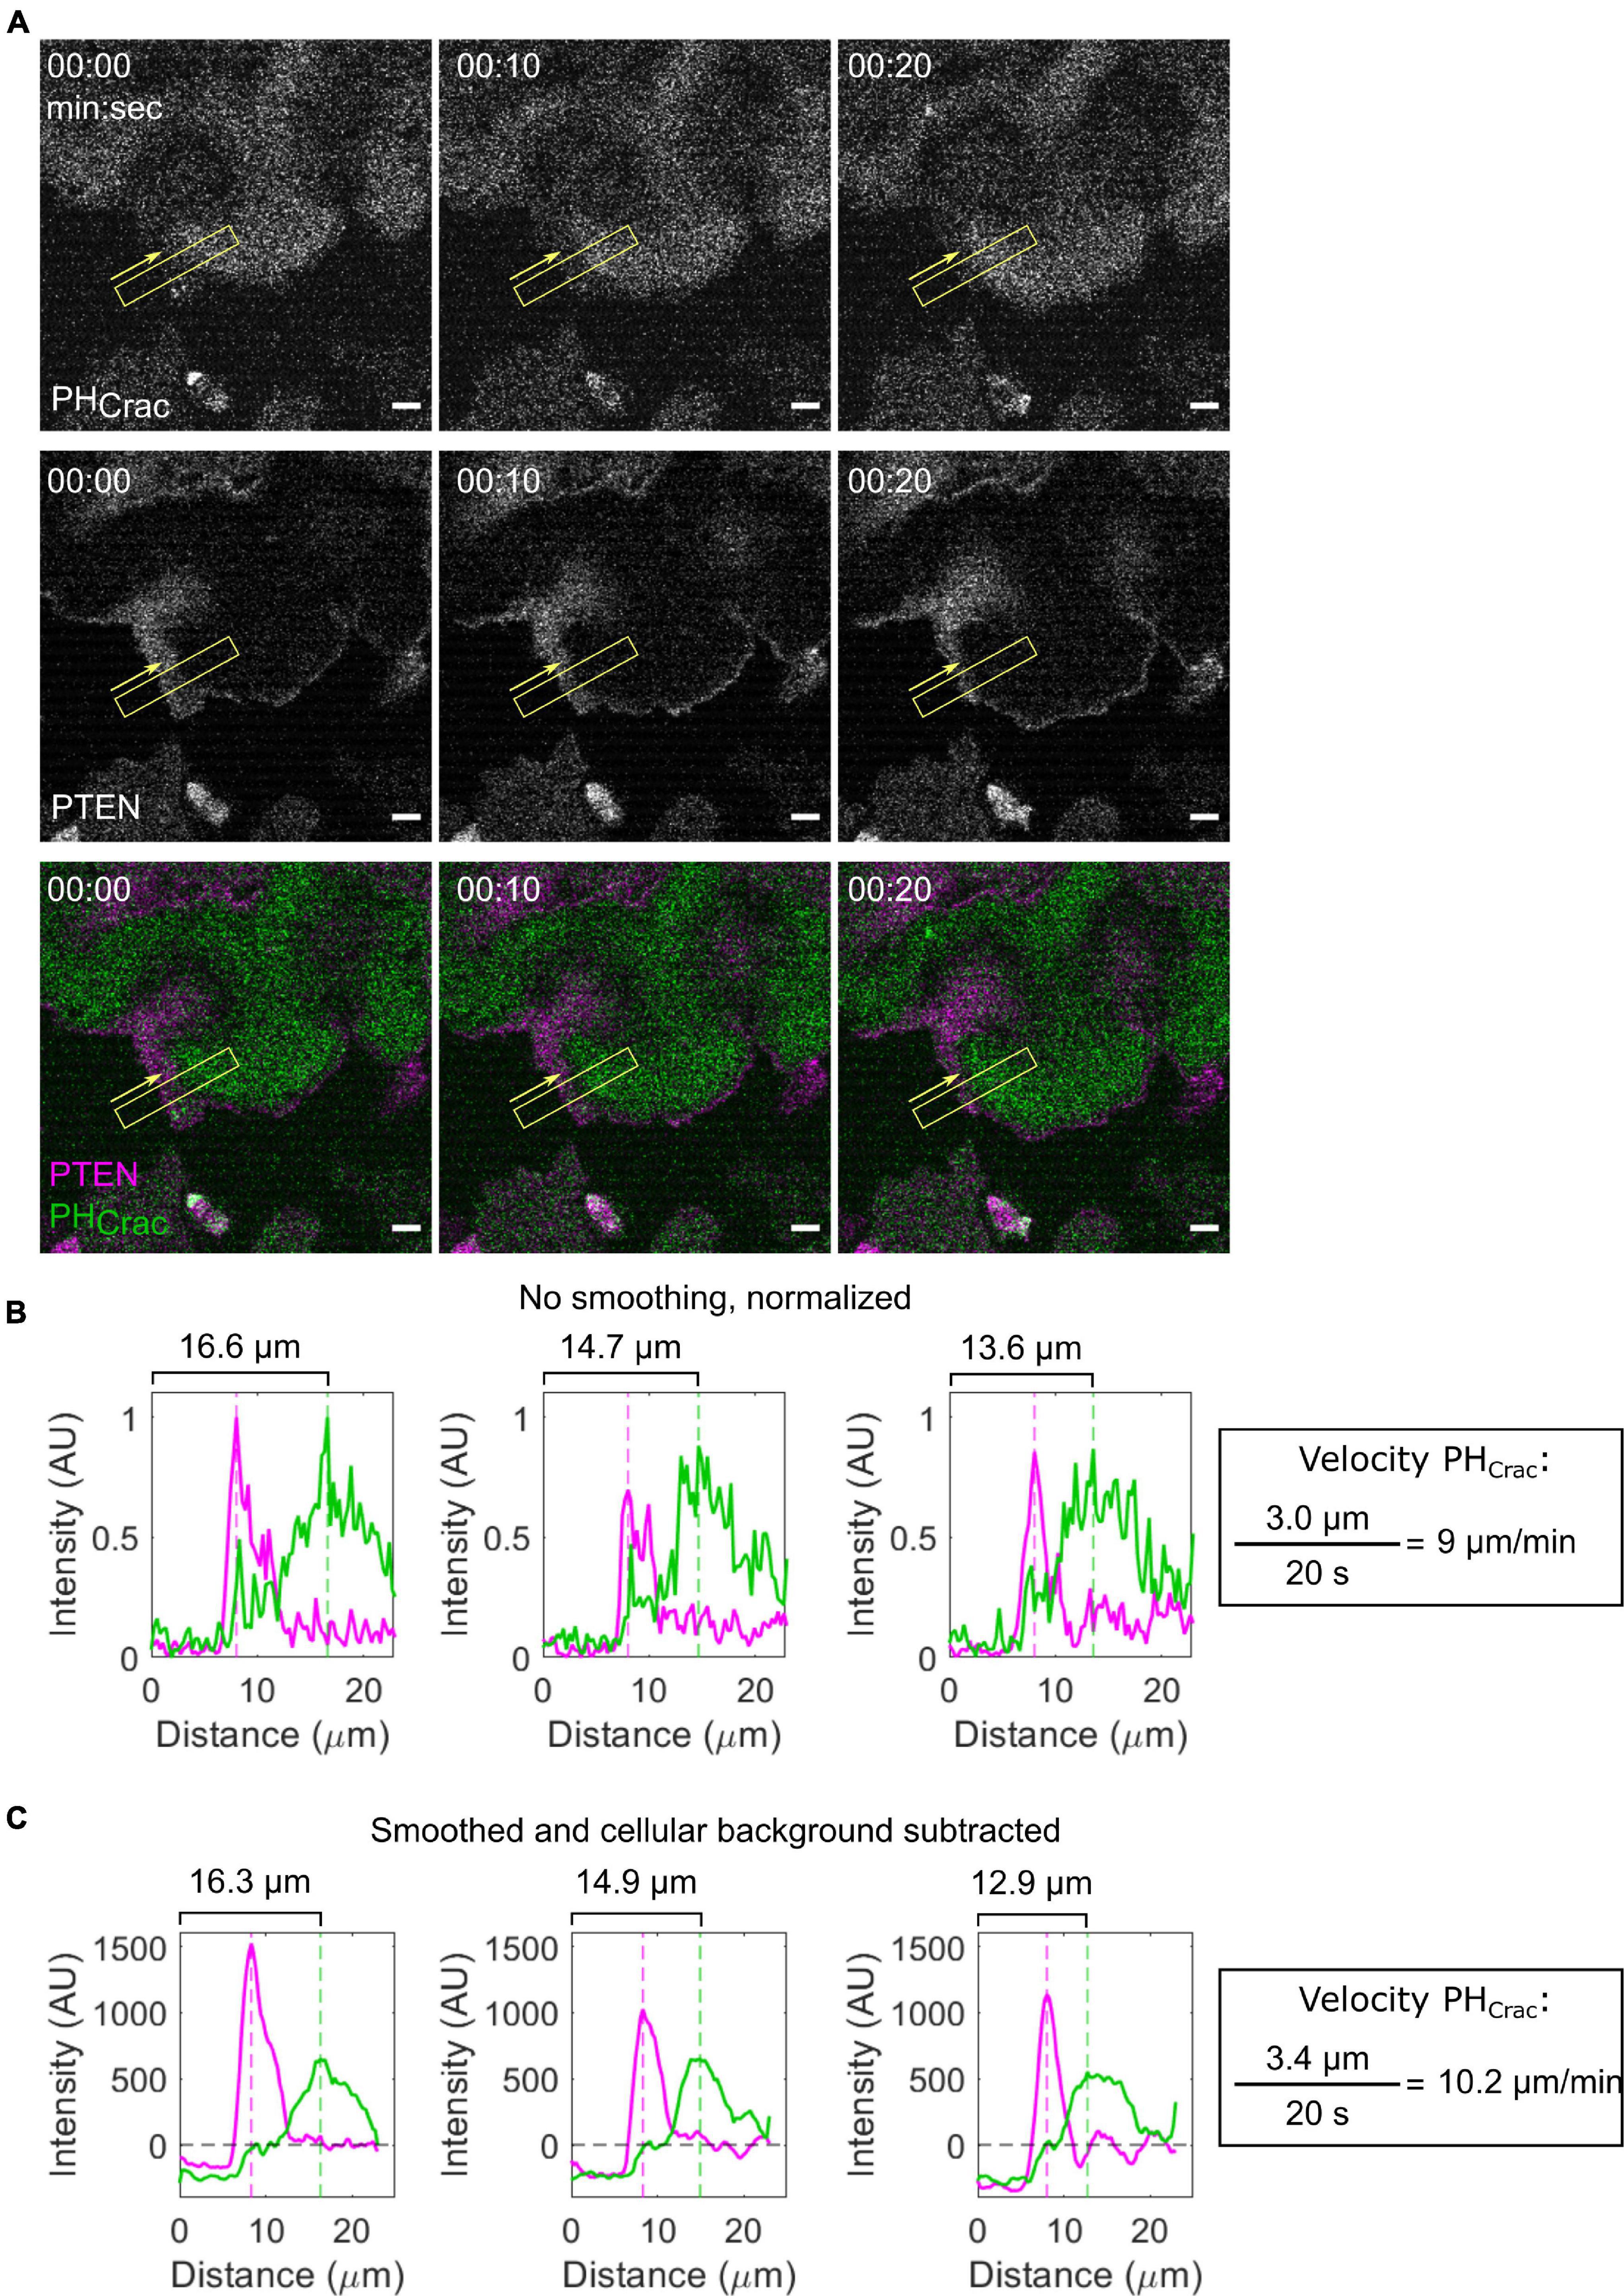
Figure 6. Measuring STEN wave properties. (A) Scanning confocal imaging of PIP3 (PHCrac) and a back protein (PTEN) in a giant AX2 Dictyostelium cell. Yellow boxes indicate the location and width of the intensity line scan across a membrane wave. Yellow arrows indicate the direction of the line scan. (B,C) Raw (B) and smoothed and background-corrected (C) Intensity line scans corresponding to the timepoints in panel (A). The position of the linescan area does not change, while the peak position of PHCRAC decreases. This change can be used to calculate the velocity of the front wave.
Like the bottom membrane, the size and shape of STEN-CEN events that create protrusions on the cell periphery contain important information about network properties (Miao et al., 2017). It is possible to measure the size of cell protrusions by hand using ImageJ. However, the number of measurements required per cell may be prohibitive. For example, actin polymerization biosensor LimEΔCoil and Ras activity biosensor RBD colocalize at multiple protrusions along the Dictyostelium cell perimeter (Figure 7A and Supplementary Movie 4). Each of these protrusions undergoes dramatic shape changes between frames, making the assessment of a protrusion’s behavior over longer times difficult. To measure signaling events on cell perimeter, creating membrane kymographs and t-stacks is recommended. The basic concept of a membrane kymograph is simple: trace the cell membrane at each frame, divide the traced line into equidistant points, and then display the biosensor intensity at each point as a vertical line. Finally, stack each timepoint’s vertical line horizontally to create a single image which reports on changes in biosensor intensity on the membrane across an entire movie. A single protrusion in the original image (Figure 7A, yellow line) is simplified to small region of the kymograph (Figure 7B, yellow line) where the height indicates the arc length on the membrane and the width indicates the duration. These quantities can be obtained with single measurements in ImageJ. The code to generate such a kymograph is flexible and available upon request. T-stacks are made by taking a timelapse movie of a migrating cell and creating a 3D projection where the third axis is time (Figure 7C). When viewed in the X-T plane (e.g., looking at the edge of the cell over time), the duration, movement, and width, and length of protrusions can be seen and measured. Quick Start Guide 6 details these options.
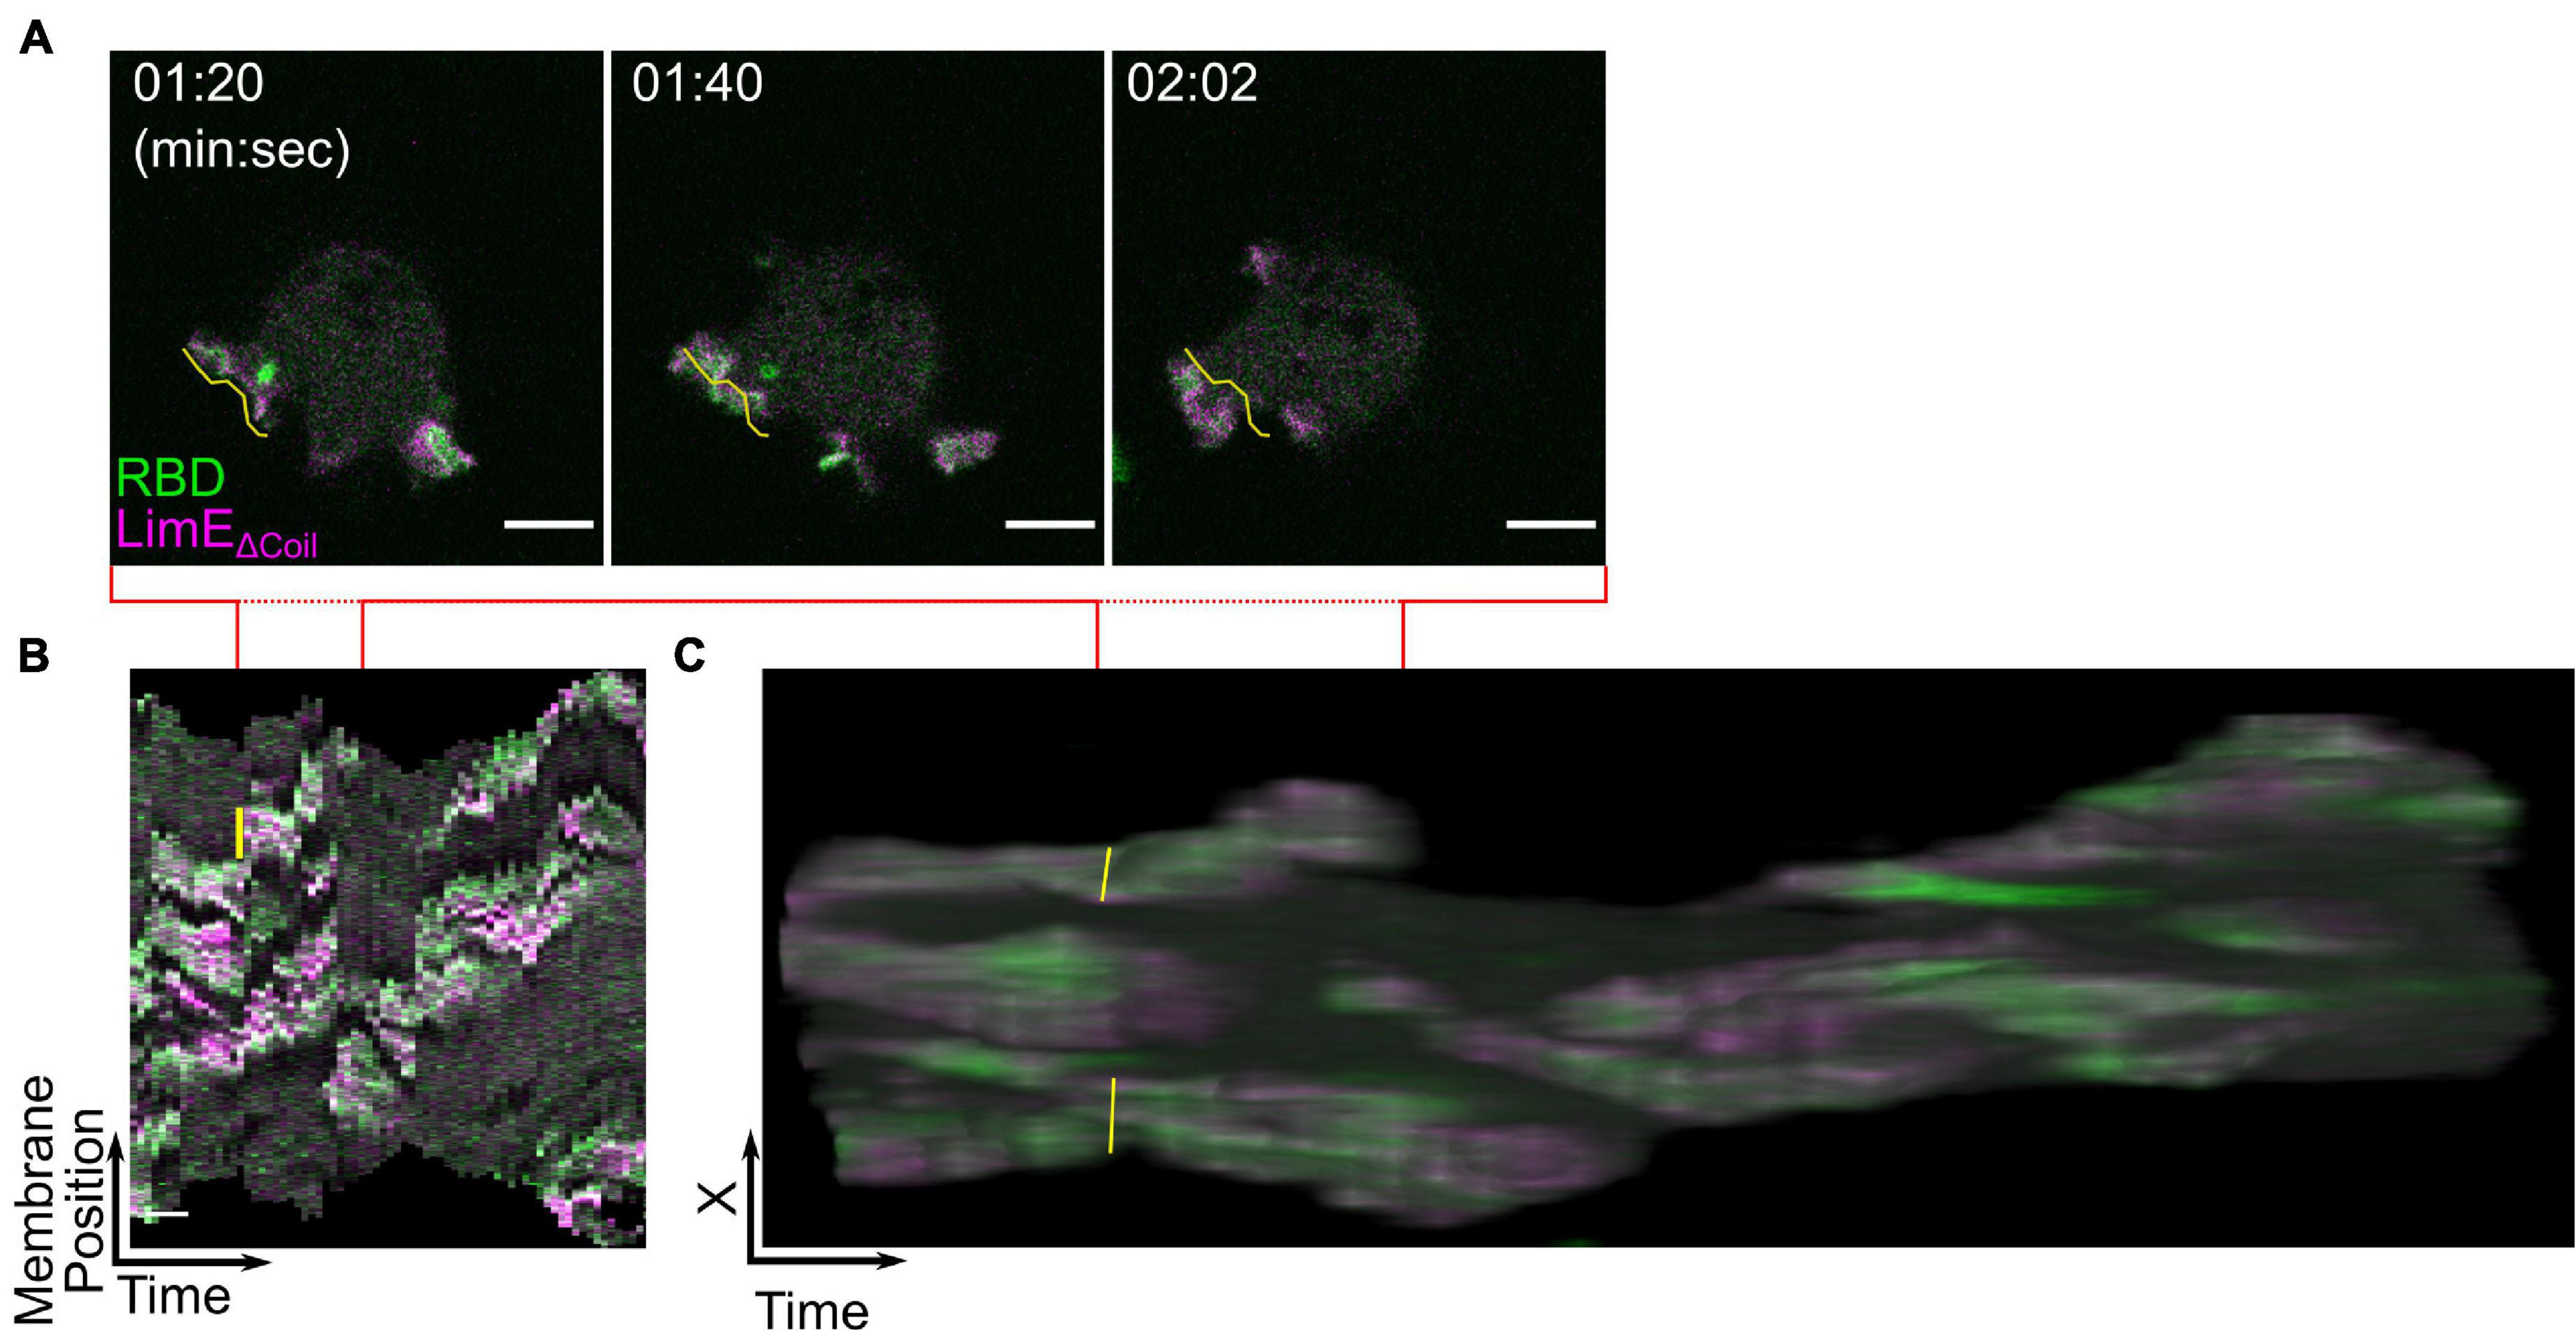
Figure 7. Displaying biosensors on cell protrusions. (A–C) Scanning confocal imaging (A), membrane kymograph (B), and t-stack (C) of Ras activation (RBD) and actin polymerization (LimEΔCoil) in AX3 Dictyostelium cells. The yellow line highlights the same protrusion in all three images. Scale bars in panels (A) = 5 μm and (B) = 30 s. t = 00:00 indicates the start of acquisition. Red lines indicate the span of time covered by the still images in panel (A).
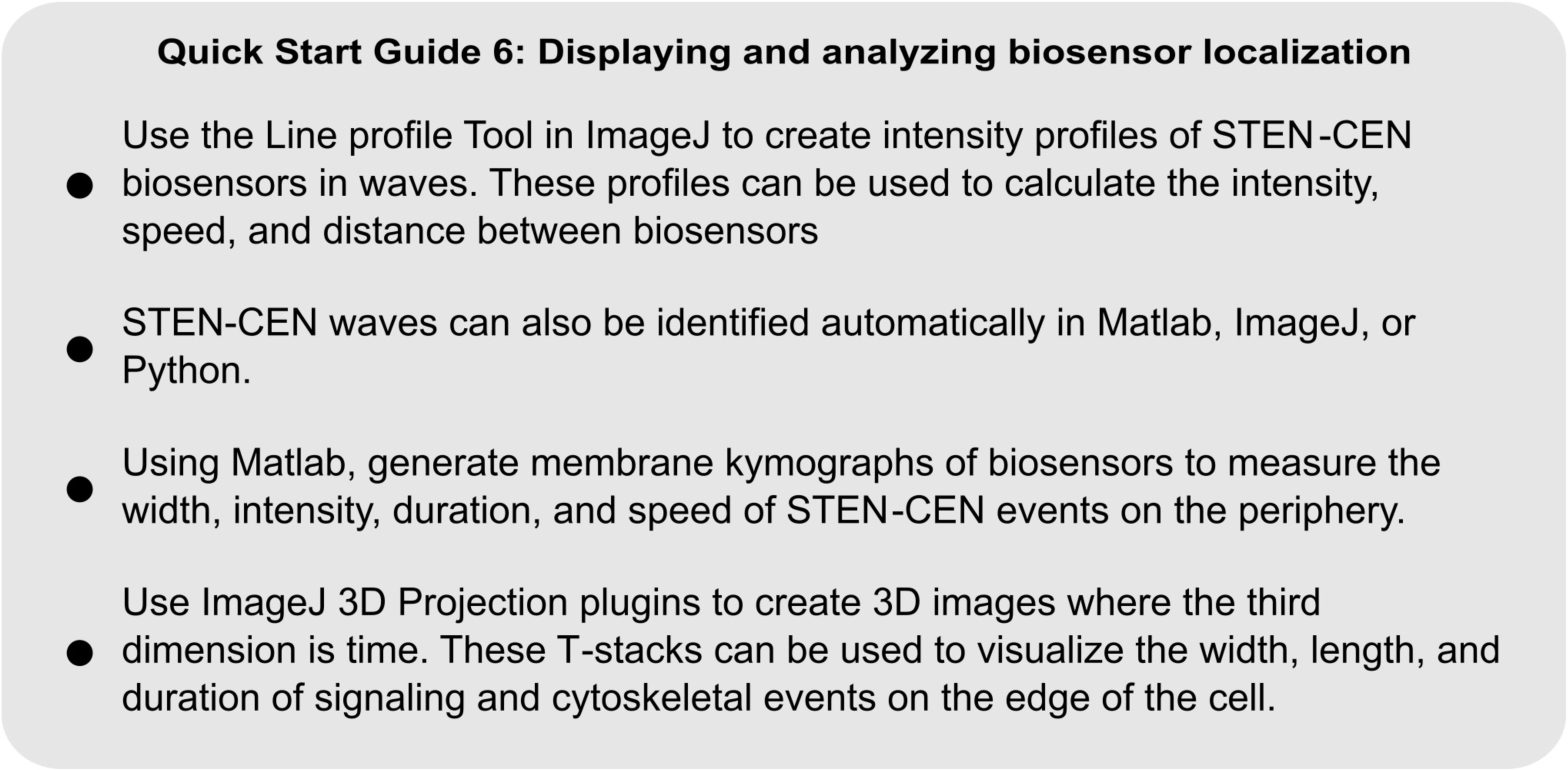
QUICK START GUIDE 6. Guidelines for displaying and analyzing fluorescent biosensor dynamics on the cell membrane.
In conjunction with other emerging technologies, CID and optogenetic techniques can help deepen our understanding of how cells move toward signals through difficult environments. For example, micropatterning and microfluidic techniques can subject cells to geometrical and mechanical challenges like they may encounter in a dynamic tissue (Reversat et al., 2020). Acutely altering the activity of individual molecules in a cell in this situation can teach us what is and is not sufficient for robust migration. Additionally, it is possible to use modern imaging technologies like Lattice Lightsheet Microscopy (LLSM) to get dynamic three-dimensional images of cellular structures at high resolution (Gao et al., 2012; Fritz-Laylin et al., 2017). LLSM could allow us to measure how the true structure of a protrusion or STEN-CEN wave changes in response to changes in network regulators. Finally, machine learning algorithms capable of automatically identifying cells and subcellular structures (Al-Kofahi et al., 2018) could help identify subtle changes to cell shape and activity which are not apparent in small datasets. Together, these approaches will help to develop and refine the current working model of directed migration in eukaryotes.
Many of the same techniques described here for studying cell migration can also be applied to other biological problems. For example, Dictyostelium are commonly used to study mechanotransduction and cytokinesis (Liu and Robinson, 2018). Recruiting a Myosin regulator to the cortex or an Aurora Kinase effector to the midzone during cytokinesis may give important quantitative insight about the network that localizes and contracts the cytokinetic ring. Additionally, the formation of multicellular slugs and fruiting bodies during the Dictyostelium life cycle is a popular model for multicellular organization (Williams, 2010). Changing the activity of specific molecules at particular times during development many have large effects on body shape which would not be apparent from longer-term genetic manipulations. Finally, Dictyostelium is an excellent model for studying micropinocytosis and phagocytosis (Vogel et al., 1980; Bloomfield et al., 2015; Dunn et al., 2018). Macropinocytosis and phagocytosis are tightly regulated in time and share many regulators with directed migration. This similarity makes them an excellent candidate for study using the tools described above. Emerging techniques in synthetic and computational biology will allow us to study old problems in Dictyostelium with new levels of detail and insight.
As a model organism, Dictyostelium has expanded our understanding of chemotaxis. Importantly, lessons learned in Dictyostelium can be applied to other systems. For example, in Dictyostelium chemotaxis: gradient sensing, signal transduction and cell motility. These processes all require interactions with receptors on the cell surface which trigger polarized distribution of downstream effectors located at front and back. This distribution rearranges the cytoskeleton in order to move toward a gradient. The signaling network discovered in Dictyostelium is also highly conserved in eukaryotic cells (Artemenko et al., 2014). Because of this, and because Dictyostelium is easy to culture, manipulate, and image, it is a good platform for designing and testing CID and optogenetic tools for use in other cell migration models. For example, an actuator which lowers PIP2 levels was recently adapted for use in mammalian breast epithelial cells (Zhan et al., 2020). We propose using Dictyostelium as a system to rapidly generate hypotheses and build models which can then be broadly applied.
JK and YL wrote the manuscript, acquired the data, and made figures. PD provided conceptual guidance and edited the manuscript. All authors contributed to the article and approved the submitted version.
NIGMS GM118177 was an R35 MIRA grant. The AFOSR MURI grant was an interdisciplinary award shared with the University of Maryland. All funders are responsible for all aspects of the research.
The authors declare that the research was conducted in the absence of any commercial or financial relationships that could be construed as a potential conflict of interest.
All claims expressed in this article are solely those of the authors and do not necessarily represent those of their affiliated organizations, or those of the publisher, the editors and the reviewers. Any product that may be evaluated in this article, or claim that may be made by its manufacturer, is not guaranteed or endorsed by the publisher.
We thank members of the Devreotes lab for feedback and help in preparing the manuscript.
The Supplementary Material for this article can be found online at: https://www.frontiersin.org/articles/10.3389/fcell.2021.740205/full#supplementary-material
Supplementary Movie 1 | Increasing RacB and Rac1A activity using a CID system. Scanning confocal imaging of an AX3 Dictyostelium cell (transmitted light, green) expressing a CID system designed to increase RacB and Rac1A activity. The cell is expressing cAR1-FKBP-FKBP (unlabeled) and mCherry-FRB-RacGEF1Δ N (magenta), an activator of Rac1 fused to an FRB domain. After rapamycin addition, RacGEF1Δ N is recruited to the membrane. Consistent with previous reports, the cell became very round with small, short-lived protrusions. t = 00:00 indicates rapamycin addition. Playback is 18 frames per second.
Supplementary Movie 2 | The Cry2PHR-CIBN system in Dictyostelium. Scanning confocal imaging of Cry2PHR membrane recruitment in AX3 Dictyostelium cells. Cells are also expressing an unlabeled membrane anchor, cAR1-CIBN. Yellow square indicates region illuminated with 488 nm light. t = 00:00 indicates blue light stimulation. Playback is 22 frames per second.
Supplementary Movie 3 | Traveling STEN waves on the bottom of a giant cell. Scanning confocal imaging of PIP3 (PHCrac, green) and a back protein (PTEN, magenta) in a giant AX2 Dictyostelium cell. Playback is 2 frames per second.
Supplementary Movie 4 | Signal transduction excitable network-CEN protrusions on the cell periphery. Scanning confocal imaging of Ras activation (RBD, green) and actin polymerization (LimEΔ Coil, magenta) in AX3 Dictyostelium cells. Playback is 15 frames per second.
Al-Kofahi, Y., Zaltsman, A., Graves, R., Marshall, W., and Rusu, M. (2018). A deep learning-based algorithm for 2-D cell segmentation in microscopy images. BMC Bioinformatics 19:365. doi: 10.1186/s12859-018-2375-z
Annesley, S. J., and Fisher, P. R. (2009). Dictyostelium discoideum-a model for many reasons. Mol. Cell. Biochem. 329, 73–91. doi: 10.1007/s11010-009-0111-8
Arai, Y., Shibata, T., Matsuoka, S., Sato, M. J., Yanagida, T., and Ueda, M. (2010). Self-organization of the phosphatidylinositol lipids signaling system for random cell migration. Proc. Natl. Acad. Sci. U. S. A. 107, 12399–12404. doi: 10.1073/pnas.0908278107
Arrieumerlou, C., and Meyer, T. (2005). A local coupling model and compass parameter for eukaryotic chemotaxis. Dev. Cell 8, 215–227. doi: 10.1016/j.devcel.2004.12.007
Artemenko, Y., Axiotakis, L., Borleis, J., Iglesias, P. A., and Devreotes, P. N. (2016). Chemical and mechanical stimuli act on common signal transduction and cytoskeletal networks. Proc. Natl. Acad. Sci. U. S. A. 113, E7500–E7509. doi: 10.1073/pnas.1608767113
Artemenko, Y., Lampert, T. J., and Devreotes, P. N. (2014). Moving towards a paradigm: common mechanisms of chemotactic signaling in Dictyostelium and mammalian leukocytes. Cell. Mol. Life Sci. 71, 3711–3747. doi: 10.1007/s00018-014-1638-8
Benard, V., Bohl, B. P., and Bokoch, G. M. (1999). Characterization of Rac and Cdc42 activation in chemoattractant- stimulated human neutrophils using a novel assay for active GTPases. J. Biol. Chem. 274, 13198–13204. doi: 10.1074/jbc.274.19.13198
Bivona, T. G., Wiener, H. H., Ahearn, I. M., Silletti, J., Chiu, V. K., and Philips, M. R. (2004). Rap1 up-regulation and activation on plasma membrane regulates T cell adhesion. J. Cell Biol. 164, 461–470. doi: 10.1083/JCB.200311093
Bloomfield, G., Traynor, D., Sander, S. P., Veltman, D. M., Pachebat, J. A., and Kay, R. R. (2015). Neurofibromin controls macropinocytosis and phagocytosis in Dictyostelium. Elife 4:e04940. doi: 10.7554/eLife.04940
Bolourani, P., Spiegelman, G. B., and Weeks, G. (2006). Delineation of the roles played by RasG and RasC in cAMP-dependent signal transduction during the early development of Dictyostelium discoideum. Mol. Biol. Cell 17, 4543–4550. doi: 10.1091/mbc.E05-11-1019
Bretschneider, T., Diez, S., Anderson, K., Heuser, J., Clarke, M., Müller-Taubenberger, A., et al. (2004). Dynamic Actin Patterns and Arp2/3 Assembly at the Substrate-Attached Surface of Motile Cells. Curr. Biol. 14, 1–10. doi: 10.1016/J.CUB.2003.12.005
Cai, H., Das, S., Kamimura, Y., Long, Y., Parent, C. A., and Devreotes, P. N. (2010). Ras-mediated activation of the TORC2-PKB pathway is critical for chemotaxis. J. Cell Biol. 190, 233–245. doi: 10.1083/jcb.201001129
Cha, I., and Jeon, T. J. (2011). Dynamic localization of the actin-bundling protein cortexillin i during cell migration. Mol. Cells 32, 281–287. doi: 10.1007/s10059-011-0072-0
Chiu, V. K., Bivona, T., Hach, A., Sajous, J. B., Silletti, J., Wiener, H., et al. (2002). Ras signalling on the endoplasmic reticulum and the Golgi. Nat. Cell Biol. 4, 343–350.
Chung, C. Y., and Firtel, R. A. (1999). PAKa, a putative PAK family member, is required for cytokinesis and the regulation of the cytoskeleton in Dictyostelium discoideum cells during chemotaxis. J. Cell Biol. 147, 559–575. doi: 10.1083/jcb.147.3.559
Décave, E., Rieu, D., Dalous, J., Fache, S., Brechet, Y., Fourcade, B., et al. (2003). Shear flow-induced motility of Dictyostelium discoideum cells on solid substrate. J. Cell Sci. 116, 4331–4343. doi: 10.1242/jcs.00726
Derose, R., Miyamoto, T., and Inoue, T. (2013). Manipulating signaling at will: chemically-inducible dimerization (CID) techniques resolve problems in cell biology. Pflugers Arch. 465, 409–417. doi: 10.1007/s00424-012-1208-6
Devreotes, P. N., Bhattacharya, S., Edwards, M., Iglesias, P. A., Lampert, T., and Miao, Y. (2017). Excitable Signal Transduction Networks in Directed Cell Migration. Annu. Rev. Cell Dev. Biol. 33, 103–125. doi: 10.1146/annurev-cellbio-100616-060739
Dormann, D., Weijer, G., Parent, C. A., Devreotes, P. N., and Weijer, C. J. (2002). Visualizing PI3 kinase-mediated cell-cell signaling during Dictyostelium development. Curr. Biol. 12, 1178–1188. doi: 10.1016/S0960-9822(02)00950-8
Dunn, J. D., Bosmani, C., Barisch, C., Raykov, L., Lefrançois, L. H., Cardenal-Muñoz, E., et al. (2018). Eat prey, live: dictyostelium discoideum as a model for cell-autonomous defenses. Front. Immunol. 8:1906. doi: 10.3389/fimmu.2017.01906
Edwards, M., Cai, H., Abubaker-Sharif, B., Long, Y., Lampert, T. J., and Devreotes, P. N. (2018). Insight from the maximal activation of the signal transduction excitable network in Dictyostelium discoideum. Proc. Natl. Acad. Sci. U. S. A. 115, E3722–E3730. doi: 10.1073/pnas.1710480115
Emami, N., Sedaei, Z., and Ferdousi, R. (2021). Computerized cell tracking: current methods, tools and challenges. Vis. Informatics 5, 1–13. doi: 10.1016/j.visinf.2020.11.003
Fegan, A., White, B., Carlson, J. C. T., and Wagner, C. R. (2010). Chemically controlled protein assembly: techniques and applications. Chem. Rev. 110, 3315–3336. doi: 10.1021/cr8002888
Fritz-Laylin, L. K., Riel-Mehan, M., Chen, B. C., Lord, S. J., Goddard, T. D., Ferrin, T. E., et al. (2017). Actin-Based protrusions of migrating neutrophils are intrinsically lamellar and facilitate direction changes. Elife 6:e26990. doi: 10.7554/eLife.26990
Gamarra, M., Zurek, E., Escalante, H. J., Hurtado, L., and San-Juan-Vergara, H. (2019). Split and merge watershed: a two-step method for cell segmentation in fluorescence microscopy images. Biomed. Signal Process. Control 53:101575. doi: 10.1016/j.bspc.2019.101575
Gao, L., Shao, L., Higgins, C. D., Poulton, J. S., Peifer, M., Davidson, M. W., et al. (2012). Noninvasive imaging beyond the diffraction limit of 3D dynamics in thickly fluorescent specimens. Cell 151, 1370–1385. doi: 10.1016/j.cell.2012.10.008
Gebbie, L., Benghezal, M., Cornillon, S., Froquet, R., Cherix, N., Malbouyres, M., et al. (2004). Phg2, a Kinase Involved in Adhesion and Focal Site Modeling in Dictyostelium. Mol. Biol. Cell 15, 3915–3925. doi: 10.1091/MBC.E03-12-0908
Gerhardt, M., Ecke, M., Walz, M., Stengl, A., Beta, C., and Gerisch, G. (2014). Actin and PIP3 waves in giant cells reveal the inherent length scale of an excited state. J. Cell Sci. 127, 4507–4517. doi: 10.1242/jcs.156000
Gerisch, G., Bretschneider, T., Müller-Taubenberger, A., Simmeth, E., Ecke, M., Diez, S., et al. (2004). Mobile actin clusters and traveling waves in cells recovering from actin depolymerization. Biophys. J. 87, 3493–3503. doi: 10.1529/biophysj.104.047589
Gerisch, G., Ecke, M., Neujahr, R., Prassler, J., Stengl, A., Hoffmann, M., et al. (2013). Membrane and actin reorganization in electropulseinduced cell fusion. J. Cell Sci. 126, 2069–2078. doi: 10.1242/jcs.124073
Gerisch, G., Ecke, M., Wischnewski, D., and Schroth-Diez, B. (2011). Different modes of state transitions determine pattern in the Phosphatidylinositide-Actin system. BMC Cell Biol. 12:42. doi: 10.1186/1471-2121-12-42
Gerisch, G., Schroth-Diez, B., Müller-Taubenberger, A., and Ecke, M. (2012). PIP3 waves and PTEN dynamics in the emergence of cell polarity. Biophys. J. 103, 1170–1178. doi: 10.1016/j.bpj.2012.08.004
Guntas, G., Hallett, R. A., Zimmerman, S. P., Williams, T., Yumerefendi, H., Bear, J. E., et al. (2015). Engineering an improved light-induced dimer (iLID) for controlling the localization and activity of signaling proteins. Proc. Natl. Acad. Sci. U. S. A. 112, 112–117. doi: 10.1073/pnas.1417910112
Hecht, I., Kessler, D. A., and Levine, H. (2010). Transient localized patterns in noise-driven reaction-diffusion systems. Phys. Rev. Lett. 104:158301. doi: 10.1103/physrevlett.104.158301
Huang, C. H., Tang, M., Shi, C., Iglesias, P. A., and Devreotes, P. N. (2013). An excitable signal integrator couples to an idling cytoskeletal oscillator to drive cell migration. Nat. Cell Biol. 15, 1307–1316. doi: 10.1038/ncb2859
Huang, Y. E., Iijima, M., Parent, C. A., Funamoto, S., Firtel, R. A., and Devreotes, P. (2003). Receptor-mediated regulation of PI3Ks confines PI(3,4,5)P3 to the leading edge of chemotaxing cells. Mol. Biol. Cell 14, 1913–1922. doi: 10.1091/mbc.E02-10-0703
Iijima, M., and Devreotes, P. (2002). Tumor suppressor PTEN mediates sensing of chemoattractant gradients. Cell 109, 599–610. doi: 10.1016/S0092-8674(02)00745-6
Janetopoulos, C., Ma, L., Devreotes, P. N., and Iglesias, P. A. (2004). Chemoattractant-induced phosphatidylinositol 3,4,5-trisphosphate accumulation is spatially amplified and adapts, independent of the actin cytoskeleton. Proc. Natl. Acad. Sci. U. S. A. 101, 8951–8956. doi: 10.1073/pnas.0402152101
Kae, H., Lim, C. J., Spiegelman, G. B., and Weeks, G. (2004). Chemoattractant-induced Ras activation during Dictyostelium aggregation. EMBO Rep. 5, 602–606. doi: 10.1038/sj.embor.7400151
Kennedy, M. J., Hughes, R. M., Peteya, L. A., Schwartz, J. W., Ehlers, M. D., and Tucker, C. L. (2010). Rapid blue-light-mediated induction of protein interactions in living cells. Nat. Methods 7, 973–975. doi: 10.1038/nmeth.1524
Kortholt, A., Kataria, R., Keizer-Gunnink, I., Van Egmond, W. N., Khanna, A., and Van Haastert, P. J. M. (2011). Dictyostelium chemotaxis: essential Ras activation and accessory signalling pathways for amplification. EMBO Rep. 12, 1273–1279. doi: 10.1038/embor.2011.210
Kortholt, A., Keizer-Gunnink, I., Kataria, R., and Haastert, P. J. M. V. (2013). Ras activation and symmetry breaking during dictyostelium chemotaxis. J. Cell Sci. 126, 4502–4513. doi: 10.1242/jcs.132340
Kriebel, P. W., Barr, V. A., and Parent, C. A. (2003). Adenylyl cyclase localization regulates streaming during chemotaxis. Cell 112, 549–560. doi: 10.1016/S0092-8674(03)00081-3
Levine, H., Kessler, D. A., and Rappel, W. J. (2006). Directional sensing in eukaryotic chemotaxis: a balanced inactivation model. Proc. Natl. Acad. Sci. U. S. A. 103, 9761–9766. doi: 10.1073/pnas.0601302103
Li, X., Miao, Y., Pal, D. S., and Devreotes, P. N. (2020). Excitable networks controlling cell migration during development and disease. Semin. Cell Dev. Biol. 100, 133–142. doi: 10.1016/j.semcdb.2019.11.001
Liu, Y., and Robinson, D. (2018). Recent advances in cytokinesis: understanding the molecular underpinnings [version 1; referees: 2 approved]. F1000Res. 7:1849. doi: 10.12688/f1000research.16502.1
Loovers, H. M., Postma, M., Keizer-Gunnink, I., Huang, Y. E., Devreotes, P. N., and Van Haastert, P. J. M. (2006). Distinct roles of PI(3,4,5)P3 during chemoattractant signaling in Dictyostelium: a quantitative in vivo analysis by inhibition of PI3-kinase. Mol. Biol. Cell 17, 1503–1513. doi: 10.1091/mbc.E05-09-0825
Mato, J. M., Losada, A., Nanjundiah, V., and Konijn, T. M. (1975). Signal input for a chemotactic response in the cellular slime mold Dictyostelium discoideum. Proc. Natl. Acad. Sci. U. S. A. 72, 4991–4993. doi: 10.1073/pnas.72.12.4991
Meili, R., Ellsworth, C., and Firtel, R. A. (2000). A novel Akt/PKB-related kinase is essential for morphogenesis in Dictyostelium. Curr. Biol. 10, 708–717. doi: 10.1016/S0960-9822(00)00536-4
Meili, R., Ellsworth, C., Lee, S., Reddy, T. B. K., Ma, H., and Firtel, R. A. (1999). Chemoattractant-mediated transient activation and membrane localization of Akt/PKB is required for efficient chemotaxis to cAMP in Dictyostelium. EMBO J. 18, 2092–2105. doi: 10.1093/EMBOJ/18.8.2092
Meinhardt, H. (1999). Orientation of chemotactic cells and growth cones: models and mechanisms. J. Cell Sci. 112, 2867–2874. doi: 10.1242/jcs.112.17.2867
Meinhardt, H., and Gierer, A. (2000). Pattern formation by local self-activation and lateral inhibition. Bioessays 22, 753–760. doi: 10.1002/1521-1878
Miao, Y., Bhattacharya, S., Banerjee, T., Abubaker-Sharif, B., Long, Y., Inoue, T., et al. (2019). Wave patterns organize cellular protrusions and control cortical dynamics. Mol. Syst. Biol. 15:e8585. doi: 10.15252/msb.20188585
Miao, Y., Bhattacharya, S., Edwards, M., Cai, H., Inoue, T., Iglesias, P. A., et al. (2017). Altering the threshold of an excitable signal transduction network changes cell migratory modes. Nat. Cell Biol. 19, 329–340. doi: 10.1038/ncb3495
Neilson, M. P., Veltman, D. M., van Haastert, P. J. M., Webb, S. D., Mackenzie, J. A., and Insall, R. H. (2011). Chemotaxis: a feedback-based computational model robustly predicts multiple aspects of real cell behaviour. PLoS Biol. 9:e1000618. doi: 10.1371/journal.pbio.1000618
Nichols, J. M. E., Veltman, D., and Kay, R. R. (2015). Chemotaxis of a model organism: progress with Dictyostelium. Curr. Opin. Cell Biol. 36, 7–12. doi: 10.1016/j.ceb.2015.06.005
Nishikawa, M., Hörning, M., Ueda, M., and Shibata, T. (2014). Excitable signal transduction induces both spontaneous and directional cell asymmetries in the phosphatidylinositol lipid signaling system for eukaryotic chemotaxis. Biophys. J. 106, 723–734. doi: 10.1016/j.bpj.2013.12.023
Okumoto, S., Jones, A., and Frommer, W. B. (2012). Quantitative imaging with fluorescent biosensors. Annu. Rev. Plant Biol. 63, 663–706. doi: 10.1146/annurev-arplant-042110-103745
Papakonstanti, E. A., Ridley, A. J., and Vanhaesebroeck, B. (2007). The p110δ isoform of PI 3-kinase negatively controls RhoA and PTEN. EMBO J. 26, 3050–3061. doi: 10.1038/sj.emboj.7601763
Parent, C. A., Blacklock, B. J., Froehlich, W. M., Murphy, D. B., and Devreotes, P. N. (1998). G protein signaling events are activated at the leading edge of chemotactic cells. Cell 95, 81–91. doi: 10.1016/S0092-8674(00)81784-5
Park, J., Holmes, W. R., Lee, S. H., Kim, H. N., Kim, D. H., Kwak, M. K., et al. (2017). Mechanochemical feedback underlies coexistence of qualitatively distinct Cell polarity patterns within diverse cell populations. Proc. Natl. Acad. Sci. U. S. A. 114, E5750–E5759. doi: 10.1073/pnas.1700054114
Park, K. C., Rivero, F., Meili, R., Lee, S., Apone, F., and Firtel, R. A. (2004). Rac regulation of chemotaxis and morphogenesis in Dictyostelium. EMBO J. 23, 4177–4189. doi: 10.1038/SJ.EMBOJ.7600368
Reversat, A., Gaertner, F., Merrin, J., Stopp, J., Tasciyan, S., Aguilera, J., et al. (2020). Cellular locomotion using environmental topography. Nature 582, 582–585. doi: 10.1038/s41586-020-2283-z
Riedl, J., Crevenna, A. H., Kessenbrock, K., Yu, J. H., Neukirchen, D., Bista, M., et al. (2008). Lifeact: a versatile marker to visualize F-actin. Nat. Methods 5, 605–607. doi: 10.1038/nmeth.1220
Sasaki, A. T., Chun, C., Takeda, K., and Firtel, R. A. (2004). Localized Ras signaling at the leading edge regulates PI3K, cell polarity, and directional cell movement. J. Cell Biol. 167, 505–518. doi: 10.1083/jcb.200406177
Schindelin, J., Arganda-Carreras, I., Frise, E., Kaynig, V., Longair, M., Pietzsch, T., et al. (2012). Fiji: an open-source platform for biological-image analysis. Nat. Methods 9, 676–682. doi: 10.1038/nmeth.2019
Schroth-Diez, B., Gerwig, S., Ecke, M., Heger, R., Diez, S., and Gerisch, G. (2009). Propagating waves separate two states of actin organization in living cells. HFSP J. 3, 412–427. doi: 10.2976/1.3239407
Shibata, T., Nishikawa, M., Matsuoka, S., and Ueda, M. (2012). Modeling the self-organized phosphatidylinositol lipid signaling system in chemotactic cells using quantitative image analysis. J. Cell Sci. 125, 5138–5150. doi: 10.1242/jcs.108373
Shu, S., Liu, X., and Korn, E. D. (2005). Blebbistatin and blebbistatin-inactivated myosin II inhibit myosin II-independent processes in Dictyostelium. Proc. Natl. Acad. Sci. U. S. A. 102, 1472–1477. doi: 10.1073/pnas.0409528102
Song, L., Nadkarni, S. M., Bödeker, H. U., Beta, C., Bae, A., Franck, C., et al. (2006). Dictyostelium discoideum chemotaxis: threshold for directed motion. Eur. J. Cell Biol. 85, 981–989. doi: 10.1016/j.ejcb.2006.01.012
Strickland, D., Lin, Y., Wagner, E., Hope, C. M., Zayner, J., Antoniou, C., et al. (2012). TULIPs: tunable, light-controlled interacting protein tags for cell biology. Nat. Methods 9, 379–384. doi: 10.1038/nmeth.1904
Swaminathan, K., Müller-Taubenberger, A., Faix, J., Rivero, F., and Noegel, A. A. (2014). A Cdc42- and Rac-interactive binding (CRIB) domain mediates functions of coronin. Proc. Natl. Acad. Sci. U. S. A. 111, E25–E33. doi: 10.1073/pnas.1315368111
Swaney, K. F., Borleis, J., Iglesias, P. A., and Devreotes, P. N. (2015). Novel protein Callipygian defines the back of migrating cells. Proc. Natl. Acad. Sci. U. S. A. 112, E3845–E3854. doi: 10.1073/pnas.1509098112
Swaney, K. F., Huang, C. H., and Devreotes, P. N. (2010). Eukaryotic chemotaxis: a network of signaling pathways controls motility, directional sensing, and polarity. Annu. Rev. Biophys. 39, 265–289. doi: 10.1146/annurev.biophys.093008.131228
Takeda, K. (2012). Incoherent feedforward control governs adaptation of activated ras in a eukaryotic chemotaxis pathway. Sci. Signal. 5:ra2. doi: 10.1126/scisignal.2002413
Tang, L., Franca-Koh, J., Xiong, Y., Chen, M. Y., Long, Y., Bickford, R. M., et al. (2008). tsunami, the Dictyostelium homolog of the Fused kinase, is required for polarization and chemotaxis. Genes Dev. 22, 2278–2290. doi: 10.1101/gad.1694508
Tang, M., Wang, M., Shi, C., Iglesias, P. A., Devreotes, P. N., and Huang, C. H. (2014). Evolutionarily conserved coupling of adaptive and excitable networks mediates eukaryotic chemotaxis. Nat. Commun. 5, 1–13. doi: 10.1038/ncomms6175
Taniguchi, D., Ishihara, S., Oonuki, T., Honda-Kitahara, M., Kaneko, K., and Sawai, S. (2013). Phase geometries of two-dimensional excitable waves govern self-organized morphodynamics of amoeboid cells. Proc. Natl. Acad. Sci. U. S. A. 110, 5016–5021. doi: 10.1073/pnas.1218025110
Taylor, S. J., Resnick, R. J., and Shalloway, D. (2001). Nonradioactive determination of Ras-GTP levels using activated Ras interaction assay. Methods Enzymol. 333, 333–342. doi: 10.1016/S0076-6879(01)33067-7
Thomas, M. A., Kleist, A. B., and Volkman, B. F. (2018). Decoding the chemotactic signal. J. Leukoc. Biol. 104, 359–374. doi: 10.1002/JLB.1MR0218-044
Thomas Lampert, J., Kamprad, N., Edwards, M., Borleis, J., Watson, A. J., and Tarantola, M. (2017). Shear force-based genetic screen reveals negative regulators of cell adhesion and protrusive activity. Proc. Natl. Acad. Sci. U. S. A. 114, E7727–E7736. doi: 10.1073/pnas.1616600114
Toettcher, J. E., Voigt, C. A., Weiner, O. D., and Lim, W. A. (2011). The promise of optogenetics in cell biology: interrogating molecular circuits in space and time. Nat. Methods 8, 35–38. doi: 10.1038/nmeth.f.326
Tranquillo, R. T., Lauffenburger, D. A., and Zigmond, S. H. (1988). A stochastic model for leukocyte random motility and chemotaxis based on receptor binding fluctuations. J. Cell Biol. 106, 303–309. doi: 10.1083/jcb.106.2.303
Van Haastert, P. J. M., and Devreotes, P. N. (2004). Chemotaxis: signalling the way forward. Nat. Rev. Mol. Cell Biol. 5, 626–634. doi: 10.1038/nrm1435
Van Haastert, P. J. M., Keizer-Gunnink, I., and Kortholt, A. (2017). Coupled excitable Ras and F-actin activation mediates spontaneous pseudopod formation and directed cell movement. Mol. Biol. Cell 28, 922–934. doi: 10.1091/mbc.E16-10-0733
Van Haren, J., Charafeddine, R. A., Ettinger, A., Wang, H., Hahn, K. M., and Wittmann, T. (2018). Local control of intracellular microtubule dynamics by EB1 photodissociation. Nat. Cell Biol. 20, 252–261. doi: 10.1038/s41556-017-0028-5
Vicker, M. G. (2002). F-actin assembly in Dictyostelium cell locomotion and shape oscillations propagates as a self-organized reaction-diffusion wave. FEBS Lett. 510, 5–9. doi: 10.1016/S0014-5793(01)03207-0
Vogel, G., Thilo, L., Schwarz, H., and Steinhart, R. (1980). Mechanism of phagocytosis in dictyostelium discoideum: phagocytosis is mediated by different recognition sites as disclosed by mutants with altered phagocytotic properties. J. Cell Biol. 86, 456–465. doi: 10.1083/jcb.86.2.456
Wang, H., Vilela, M., Winkler, A., Tarnawski, M., Schlichting, I., Yumerefendi, H., et al. (2016). LOVTRAP: an optogenetic system for photoinduced protein dissociation. Nat. Methods 13, 755–758. doi: 10.1038/nmeth.3926
Wang, M.-J., Iglesias, P. A., and Devreotes Correspondence, P. N. (2014). The Directional Response of Chemotactic Cells Depends on a Balance between Cytoskeletal Architecture and the External Gradient Overall directional response depends on gradient and internal polarity. Cell Rep. 9, 1110–1121. doi: 10.1016/j.celrep.2014.09.047
Weiner, O. D., Neilsen, P. O., Prestwich, G. D., Kirschner, M. W., Cantley, L. C., and Bourne, H. R. (2002). A PtdInsP3- and Rho GTPase-mediated positive feedback loop regulates neutrophil polarity. Nat. Cell Biol. 4, 509–512. doi: 10.1038/ncb811
Williams, J. G. (2010). Dictyostelium finds new roles to model. Genetics 185, 717–726. doi: 10.1534/genetics.110.119297
Wills, R. C., Goulden, B. D., and Hammond, G. R. V. (2018). Genetically encoded lipid biosensors. Mol. Biol. Cell 29, 1526–1532. doi: 10.1091/mbc.E17-12-0738
Wong, R., Hadjiyanni, I., Wei, H. C., Polevoy, G., McBride, R., Sem, K. P., et al. (2005). PIP2 hydrolysis and calcium release are required for cytokinesis in Drosophila spermatocytes. Curr. Biol. 15, 1401–1406. doi: 10.1016/j.cub.2005.06.060
Xiong, D., Xiao, S., Guo, S., Lin, Q., Nakatsu, F., and Wu, M. (2016). Frequency and amplitude control of cortical oscillations by phosphoinositide waves. Nat. Chem. Biol. 12, 159–166. doi: 10.1038/nchembio.2000
Xiong, Y., Huang, C. H., Iglesias, P. A., and Devreotes, P. N. (2010). Cells navigate with a local-excitation, global-inhibition-biased excitable network. Proc. Natl. Acad. Sci. U. S. A. 107, 17079–17086. doi: 10.1073/pnas.1011271107
Yamada, K. M., and Cukierman, E. (2007). Modeling tissue morphogenesis and cancer in 3D. Cell 130, 601–610.
Yamada, K. M., and Sixt, M. (2019). Mechanisms of 3D cell migration. Nat. Rev. Mol. Cell Biol. 20, 738–752. doi: 10.1038/s41580-019-0172-9
Zhan, H., Bhattacharya, S., Cai, H., Iglesias, P. A., Huang, C. H., and Devreotes, P. N. (2020). An Excitable Ras/PI3K/ERK Signaling Network Controls Migration and Oncogenic Transformation in Epithelial Cells. Dev. Cell 54, 608–623.e5. doi: 10.1016/j.devcel.2020.08.001
Zhao, M., Jin, T., McCaig, C. D., Forrester, J. V., and Devreotes, P. N. (2002). Genetic analysis of the role of G protein-coupled receptor signaling in electrotaxis. J. Cell Biol. 157, 921–927. doi: 10.1083/jcb.200112070
Keywords: migration, chemotaxis, signaling, imaging, synthetic & systems biology
Citation: Kuhn J, Lin Y and Devreotes PN (2021) Using Live-Cell Imaging and Synthetic Biology to Probe Directed Migration in Dictyostelium. Front. Cell Dev. Biol. 9:740205. doi: 10.3389/fcell.2021.740205
Received: 12 July 2021; Accepted: 08 September 2021;
Published: 05 October 2021.
Edited by:
Robert J. Huber, Trent University, CanadaReviewed by:
Arjan Kortholt, University of Groningen, NetherlandsCopyright © 2021 Kuhn, Lin and Devreotes. This is an open-access article distributed under the terms of the Creative Commons Attribution License (CC BY). The use, distribution or reproduction in other forums is permitted, provided the original author(s) and the copyright owner(s) are credited and that the original publication in this journal is cited, in accordance with accepted academic practice. No use, distribution or reproduction is permitted which does not comply with these terms.
*Correspondence: Peter N. Devreotes, pnd@jhmi.edu
Disclaimer: All claims expressed in this article are solely those of the authors and do not necessarily represent those of their affiliated organizations, or those of the publisher, the editors and the reviewers. Any product that may be evaluated in this article or claim that may be made by its manufacturer is not guaranteed or endorsed by the publisher.
Research integrity at Frontiers
Learn more about the work of our research integrity team to safeguard the quality of each article we publish.