 Lei Fan1‡
 Tao Liu
 Chao Ma
94% of researchers rate our articles as excellent or good
Learn more about the work of our research integrity team to safeguard the quality of each article we publish.
Find out more
ORIGINAL RESEARCH article
Front. Cell Dev. Biol. , 06 September 2021
Sec. Molecular and Cellular Oncology
Volume 9 - 2021 | https://doi.org/10.3389/fcell.2021.718624
Background: The tumor microenvironment (TME) mainly comprises tumor cells and tumor-infiltrating immune cells mixed with stromal components. Latestresearch hasdisplayed that tumor immune cell infiltration (ICI) is associated with the clinical outcome of patients with osteosarcoma (OS). This work aimed to build a gene signature according to ICI in OS for predicting patient outcomes.
Methods: The TARGET-OS dataset was used for model training, while the GSE21257 dataset was taken forvalidation. Unsupervised clustering was performed on the training cohort based on the ICI profiles. The Kaplan–Meier estimator and univariate Cox proportional hazards models were used to identify the differentially expressed genes between clusters to preliminarily screen for potential prognostic genes. We incorporated these potential prognostic genes into a LASSO regression analysis and produced a gene signature, which was next assessed with the Kaplan–Meier estimator, Cox proportional hazards models, ROC curves, IAUC, and IBS in the training and validation cohorts. In addition, we compared our signature to previous models. GSEAswere deployed to further study the functional mechanism of the signature. We conducted an analysis of 22 TICsfor identifying the role of TICs in the gene signature’s prognosis ability.
Results: Data from the training cohort were used to generate a nine-gene signature. The Kaplan–Meier estimator, Cox proportional hazards models, ROC curves, IAUC, and IBS validated the signature’s capacity and independence in predicting the outcomes of OS patients in the validation cohort. A comparison with previous studies confirmed the superiority of our signature regarding its prognostic ability. Annotation analysis revealed the mechanism related to the gene signature specifically. The immune-infiltration analysis uncoveredkey roles for activated mast cells in the prognosis of OS.
Conclusion: We identified a robust nine-gene signature (ZFP90, UHRF2, SELPLG, PLD3, PLCB4, IFNGR1, DLEU2, ATP6V1E1, and ANXA5) that can predict OS outcome precisely and is strongly linked to activated mast cells.
Osteosarcoma (OS) is a rare malignant tumor that mainly affects children and adolescents (Yang et al., 2021). Since the introduction of chemotherapy in 1970, the 5-year survival rate of patients with non-metastatic OS has reached 70% (Li et al., 2021). In addition, most patients can receive limb salvage surgery and obtain proper postoperative limb function (Li et al., 2021). Despite advances in surgical techniques, multi-agent systemic chemotherapy, precise radiotherapy, and immunotherapy, the 5-year survival rate of a localized tumor remains at 60%–70%, while that of metastasis and recurrence is less than 20% (Zhang H. et al., 2019). Therefore, studying the molecular mechanism of the occurrence and development of osteosarcoma, looking for new possible molecular therapeutic targets and prognostic criteria has become a key measure to improve the prognosis of patients with osteosarcoma (Yiqi et al., 2020).
Recently, attention has been paid to the tumor microenvironment (TME), which plays a vital role in the occurrence and development of cancer. Tumor microenvironment comprises tumor cells, fibroblasts, endothelial cells, immune cells, various signal molecules, and extracellular matrix (Cortini et al., 2016; Chen Y. et al., 2020; Luo et al., 2020). Osteosarcomasare inextricably linked to their local TME, composed of bone, stromal, vascular, and immune cells (Corre et al., 2020). The OS TME is now considered to be essential and supportive for growth and dissemination (Corre et al., 2020). One latest study has shown that tumor immune cell infiltration (ICI)is associated with the clinical outcomes of OS patients (Chen Y. et al., 2020). Extensive research on the TME has shown that infiltrating immune cells play a vital role in tumor spread, recurrence, metastasis, and the response to immunotherapy (Ma et al., 2020; Zhang X. et al., 2020). However, the detailed profile of immune cells infiltrating in OS has not been elucidated (Zhang X. et al., 2020).
Previous studieshaveprimarily focused on one or two kinds of immune cells or key genes, which could bias OS microenvironment exploration. The identification of multiple genes from tumor-infiltrating immune cell profiles can help to construct a gene signature with better and more accurate prognostic potential. To fill in the gaps and find potential diagnostic approaches targeting OS prognosis, this work clustered patients based on the ICI content to identify a prognostic gene signature. More importantly, the signature was validated in another independent cohort and compared to previous prognosis models. Also, the functional annotation and analysis of 22 tumor-infiltrating immune cells (TICs) were performed to further study the gene signature.
The Therapeutically Applicable Research to Generate Effective Treatments (TARGET) is an open childhood cancer database that aims to use comprehensive genomic methods to identify molecular changes in the occurrence and development of difficult-to-treat childhood cancers (Gao et al., 2020; Zhang F. et al., 2020). One project named TARGET-OS (n = 88) in the TARGET database was treated as the training cohort, and the level 3 gene expression data and clinical characteristics of OS cases were downloadedon the GDC Xena Hub.1 The GSE21257 dataset was downloaded from the Gene Expression Omnibus (GEO) database (Buddingh et al., 2011) and was taken as the validation cohort. This dataset includes data from 53 unique diagnostic biopsy specimens analyzed on the GPL10295 platform (Illumina human-6 v2.0 expression beadchip).
CIBERSORT can describe the cell composition of complex tissues based on the gene expression profile of complex tissues. It uses linear support vector regression (a machine learning method) to deconvolute a mixture of gene expressions (Newman et al., 2015, 2019; Thorsson et al., 2018). The infiltration levels of distinct immune cells in OS patients in the training cohort were quantified by using the “CIBERSORT” R package and employing the 22 TIC signature and 1,000 permutations (Newman et al., 2015, 2019; Thorsson et al., 2018). The ESTIMATE (Estimation of STromal and Immune cells in MAlignant Tumor tissues using Expression data) algorithm provides researchers with a score of tumor purity, stromal cell presence level, and ICI level in tumor tissue based on expression data (Yoshihara et al., 2013). The “ESTIMATE” R package was used to assess the immune score and stromal score for OSsusing the gene expression data from the training cohort. The combination of CIBERSORT and ESTIMATE results from each OS sample was defined as the tumor ICI pattern. The “ConsensusClusterPlus” R package was used to cluster the samples according to the ICI pattern of each sample (repeat time = 1000). Pam and Euclidean distances were used as the clustering algorithm and distance measure, respectively.
This section tries to study genes associated with the ICI patterns. Based on the ICI cluster we have produced, DEGs were identified between the ICI clusters using the “limma” R package (Ritchie et al., 2015), with cutoffs of | log2(fold-change)| > 0.2 and p-value < 0.05.
The Kaplan–Meier estimator and univariate Cox proportional hazards model were adopted to identify the potential prognostic DEGs using the data of the training cohort. Genes with p-values < 0.05 in both tests were considered to be potential prognostic genes. To minimize the risk of overfitting, the LASSO Cox regression analysis was used to construct a prognostic model. The LASSO algorithm was run using the “glmnet” R package for variable selection and shrinkage of these identified potential prognostic genes (Tibshirani, 1997;Sauerbrei et al., 2007; Friedman et al., 2010; Goeman, 2010). The “glmnet” R package outputted genes with coefficients. The risk score of each patient could be obtained according to the following formula:
(n: hub genes; Expi: gene expression level; βi: coefficient).
Osteosarcoma (OS) patients were classified into high-risk or low-risk groups according to the median risk score. The Kaplan–Meier estimator was used to validate the survival difference between high- and low-risk groups. Univariate and multivariate Cox proportional hazards models were applied to test the prognostic ability of the gene signature we constructed. Additionally, ROC curve analysis, integrated AUC analysis (IAUC, also known as time-dependent AUC), and integrated Brier score analysis (IBS, also known as time-dependent BS) were performed to confirm the predictive capacity of the signature.
We searched PubMed2 using the keyword “gene signature prognosis osteosarcoma” and set the following screening criteria: (1) the impact factor of the journal was greater than 4, and (2) the online publication date was in the most recent year, from May 18, 2020, to May 18, 2021. After finding suitable studies, the gene signatures were extracted. We applied these signatures to the training cohort to obtain coefficients via the multivariate Cox proportional hazards model. We adopted the Kaplan–Meier estimator and Cox proportional hazards models to test these signatures in the training and validation cohorts to compare the prognostic ability difference between previous studies and ours.
GSEA is a computational method used to determine whether an a priori defined gene set shows a statistically significant difference between two biological states (Subramanian et al., 2005). In our study, GSEA was run using Hallmark gene set collections (v7.43) via GSEA software (v4.1.0 for Windows4) to reveal potential mechanisms of gene signature in OS prognosis. In this analysis, the significant cutoff should meet all the following indicators: | NES | > 1, NOM p-value (nominal p-value) < 0.05, and FD R q-value < 0.25.
We used the CIBERSORT algorithm for the calculation of the relative contents of 22 TICs in the training cohort (Newman et al., 2015, 2019; Thorsson et al., 2018). For identifying the inner relationships among the 22 TICs, the Pearson coefficient was equipped for the analysis. Also, for obtaining the correlations between the 22 TICs and the signature, we adopt comprehensive analyses, including the Spearman coefficient and Wilcoxon rank-sum test. We used the univariate and multivariate Cox proportional hazards models and the Kaplan–Meier estimator to test 22 TICs to know which kind of TICs were impacting the OS prognosis. In this section, we learned about the relationships between 22 TICs and the gene signature and the prognostic ability of 22 TICs. Combining the above evidence, potential candidate TICs could be inferred, which played a vital role in the prognosis of the gene signature.
We used the “glmnet” R package for performing the LASSO regression analysis. A Kaplan–Meier estimator was built by applying the “survival” and “survminer” R packages. Additionally, the “survival” R package was used to build Cox proportional hazards models. The “timeROC” and “survival” R packages were used to plot the ROC curves and call the IAUC analysis. Moreover, the “Rcpp,” “ranger,” and “survival” R packages were used to calculate the IBS. All the processes were run in R software (version 4.0.4, 2021-02-15). In the present study, a p-value < 0.05 indicates statistical significance.
Figure 1 shows the flowchart of this study. Eighty-eight OS patients from the TARGET-OS cohort were used to train the model. The dataset GSE21257, containing 53 OS cases, was selected to validate the model. We collected the clinical characteristics of the OS patients in these two cohorts and showed them in Table 1 in detail.
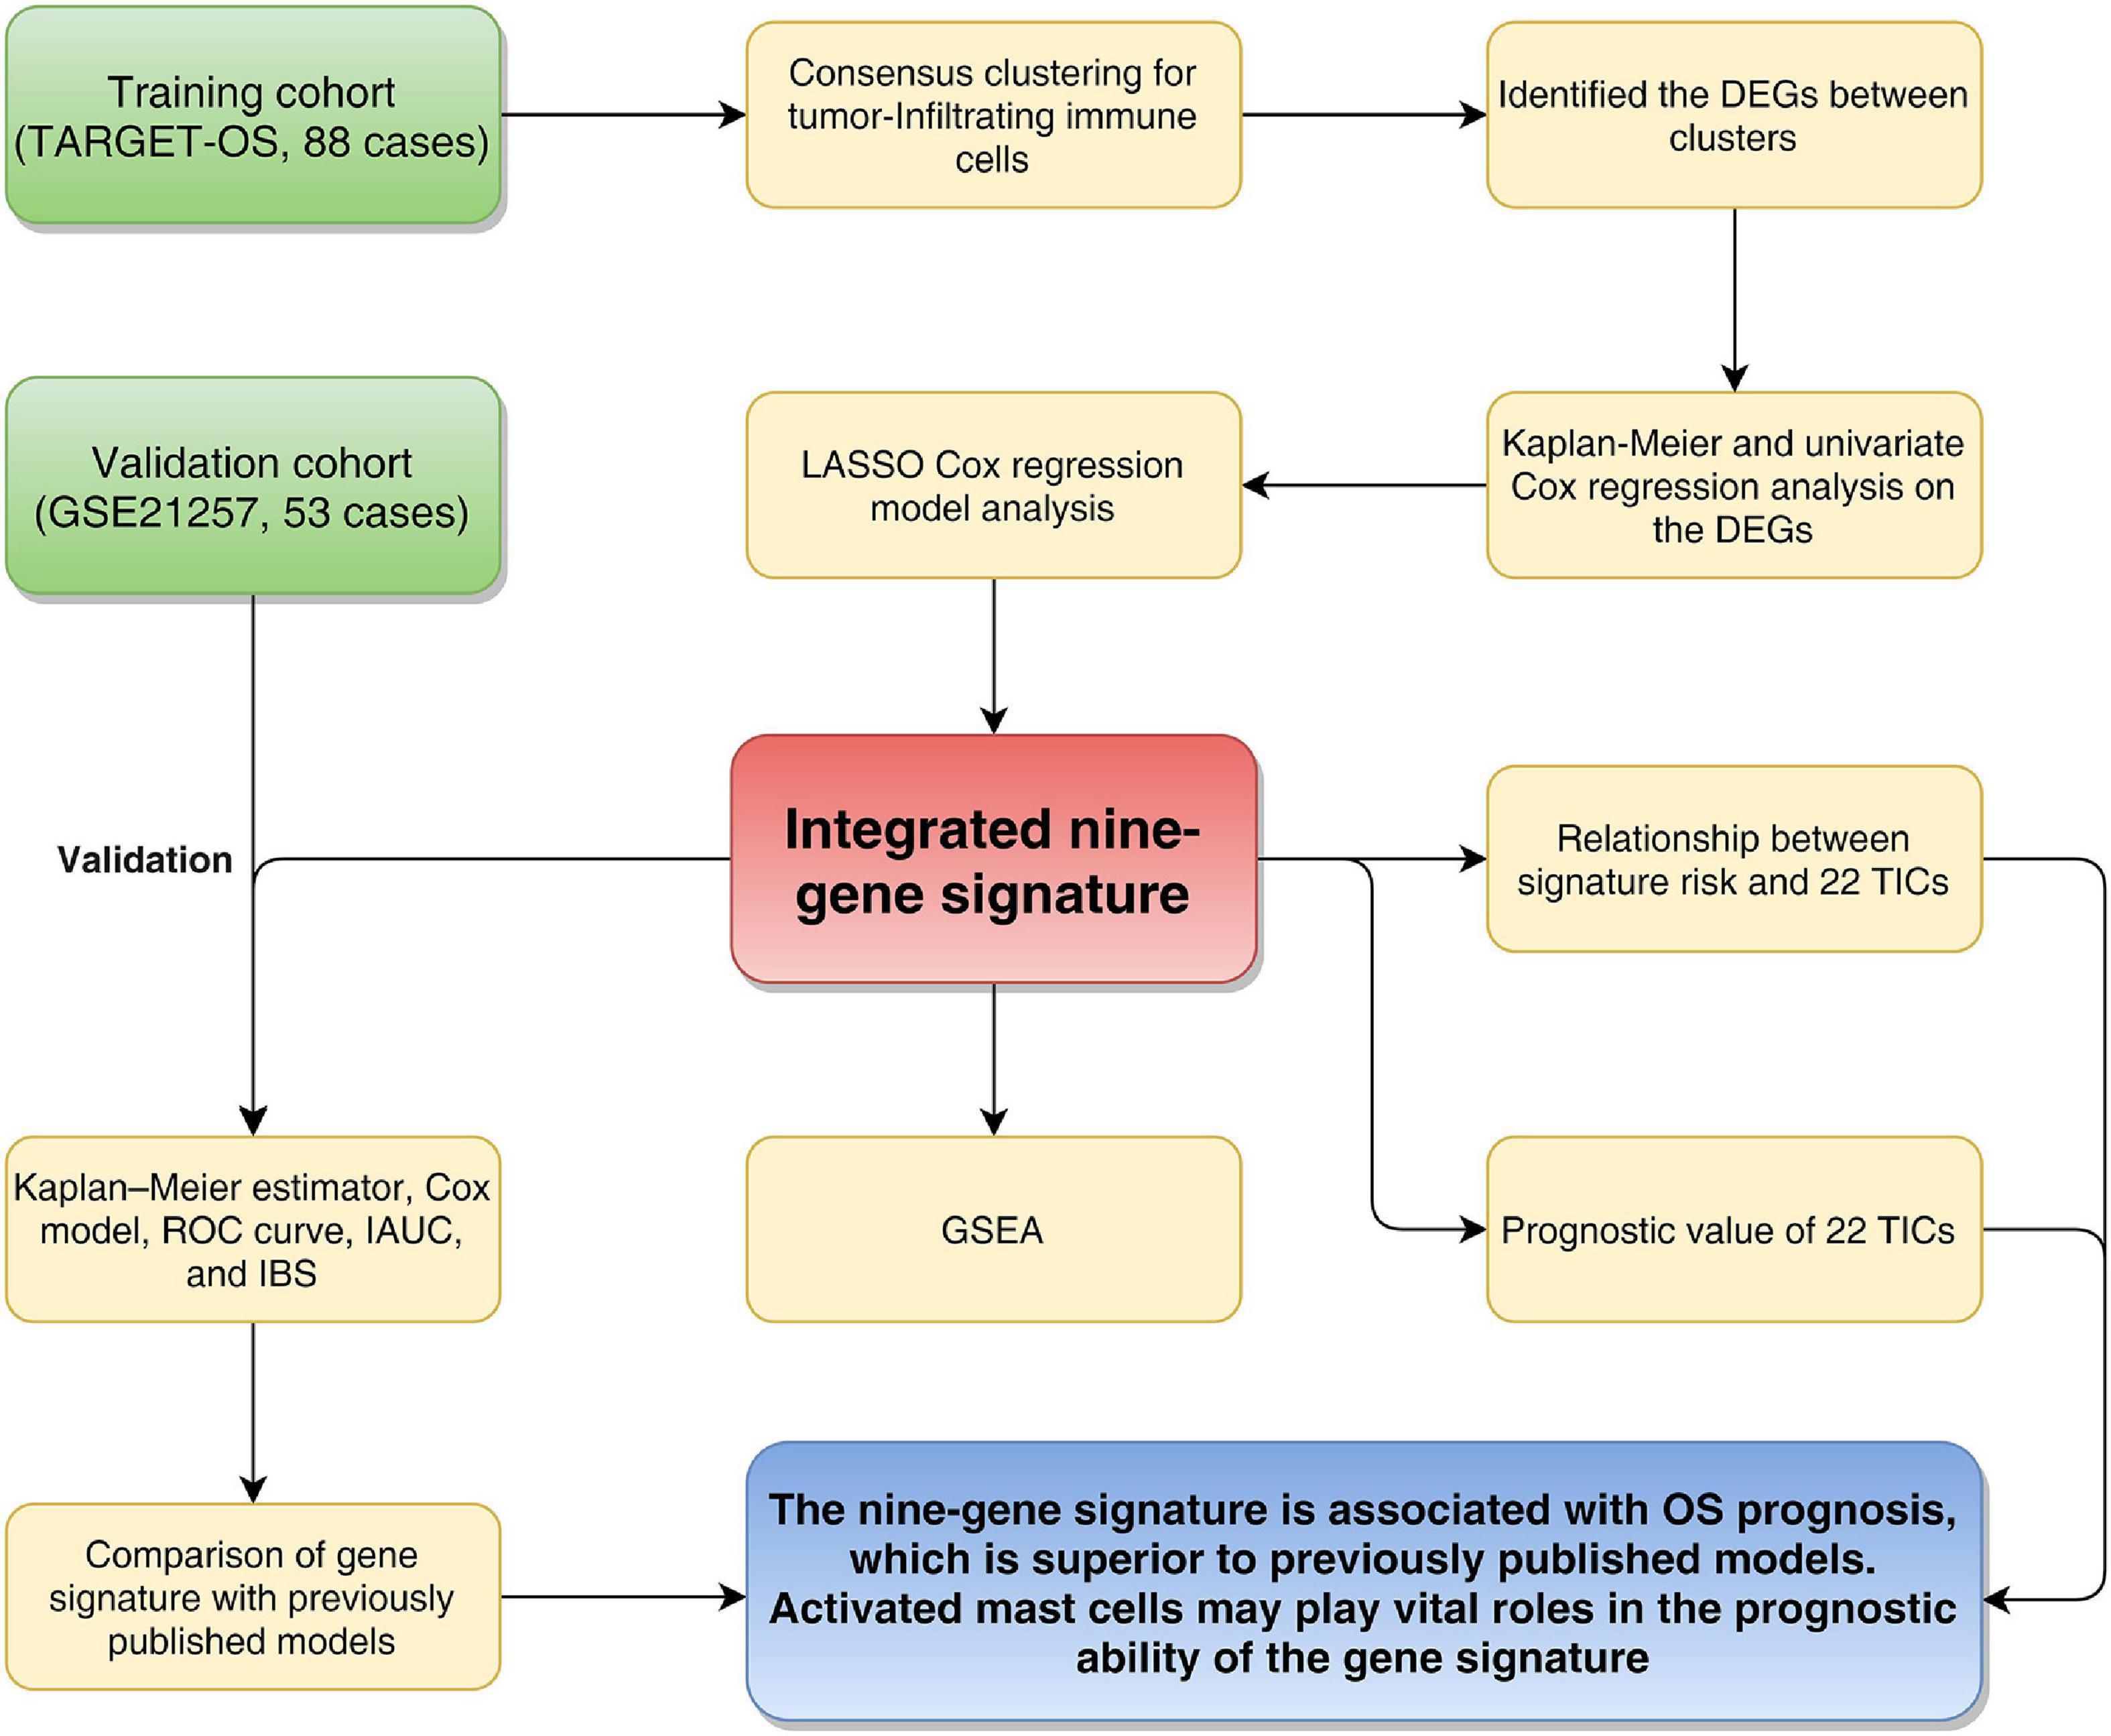
Figure 1. Flowchart of the study. TARGET: therapeutically applicable research to generate effective treatments; OS, osteosarcoma; DEGs, differentially expressed genes; LASSO, least absolute shrinkage and selection operator Cox regression model; AUC, area under the ROC curve; IAUC, integrated AUC; ROC, receiver operating characteristic; IBS, integrated Brier score; GSEA, Gene Set Enrichment Analysis; TICs, tumor-infiltrating immune cells.
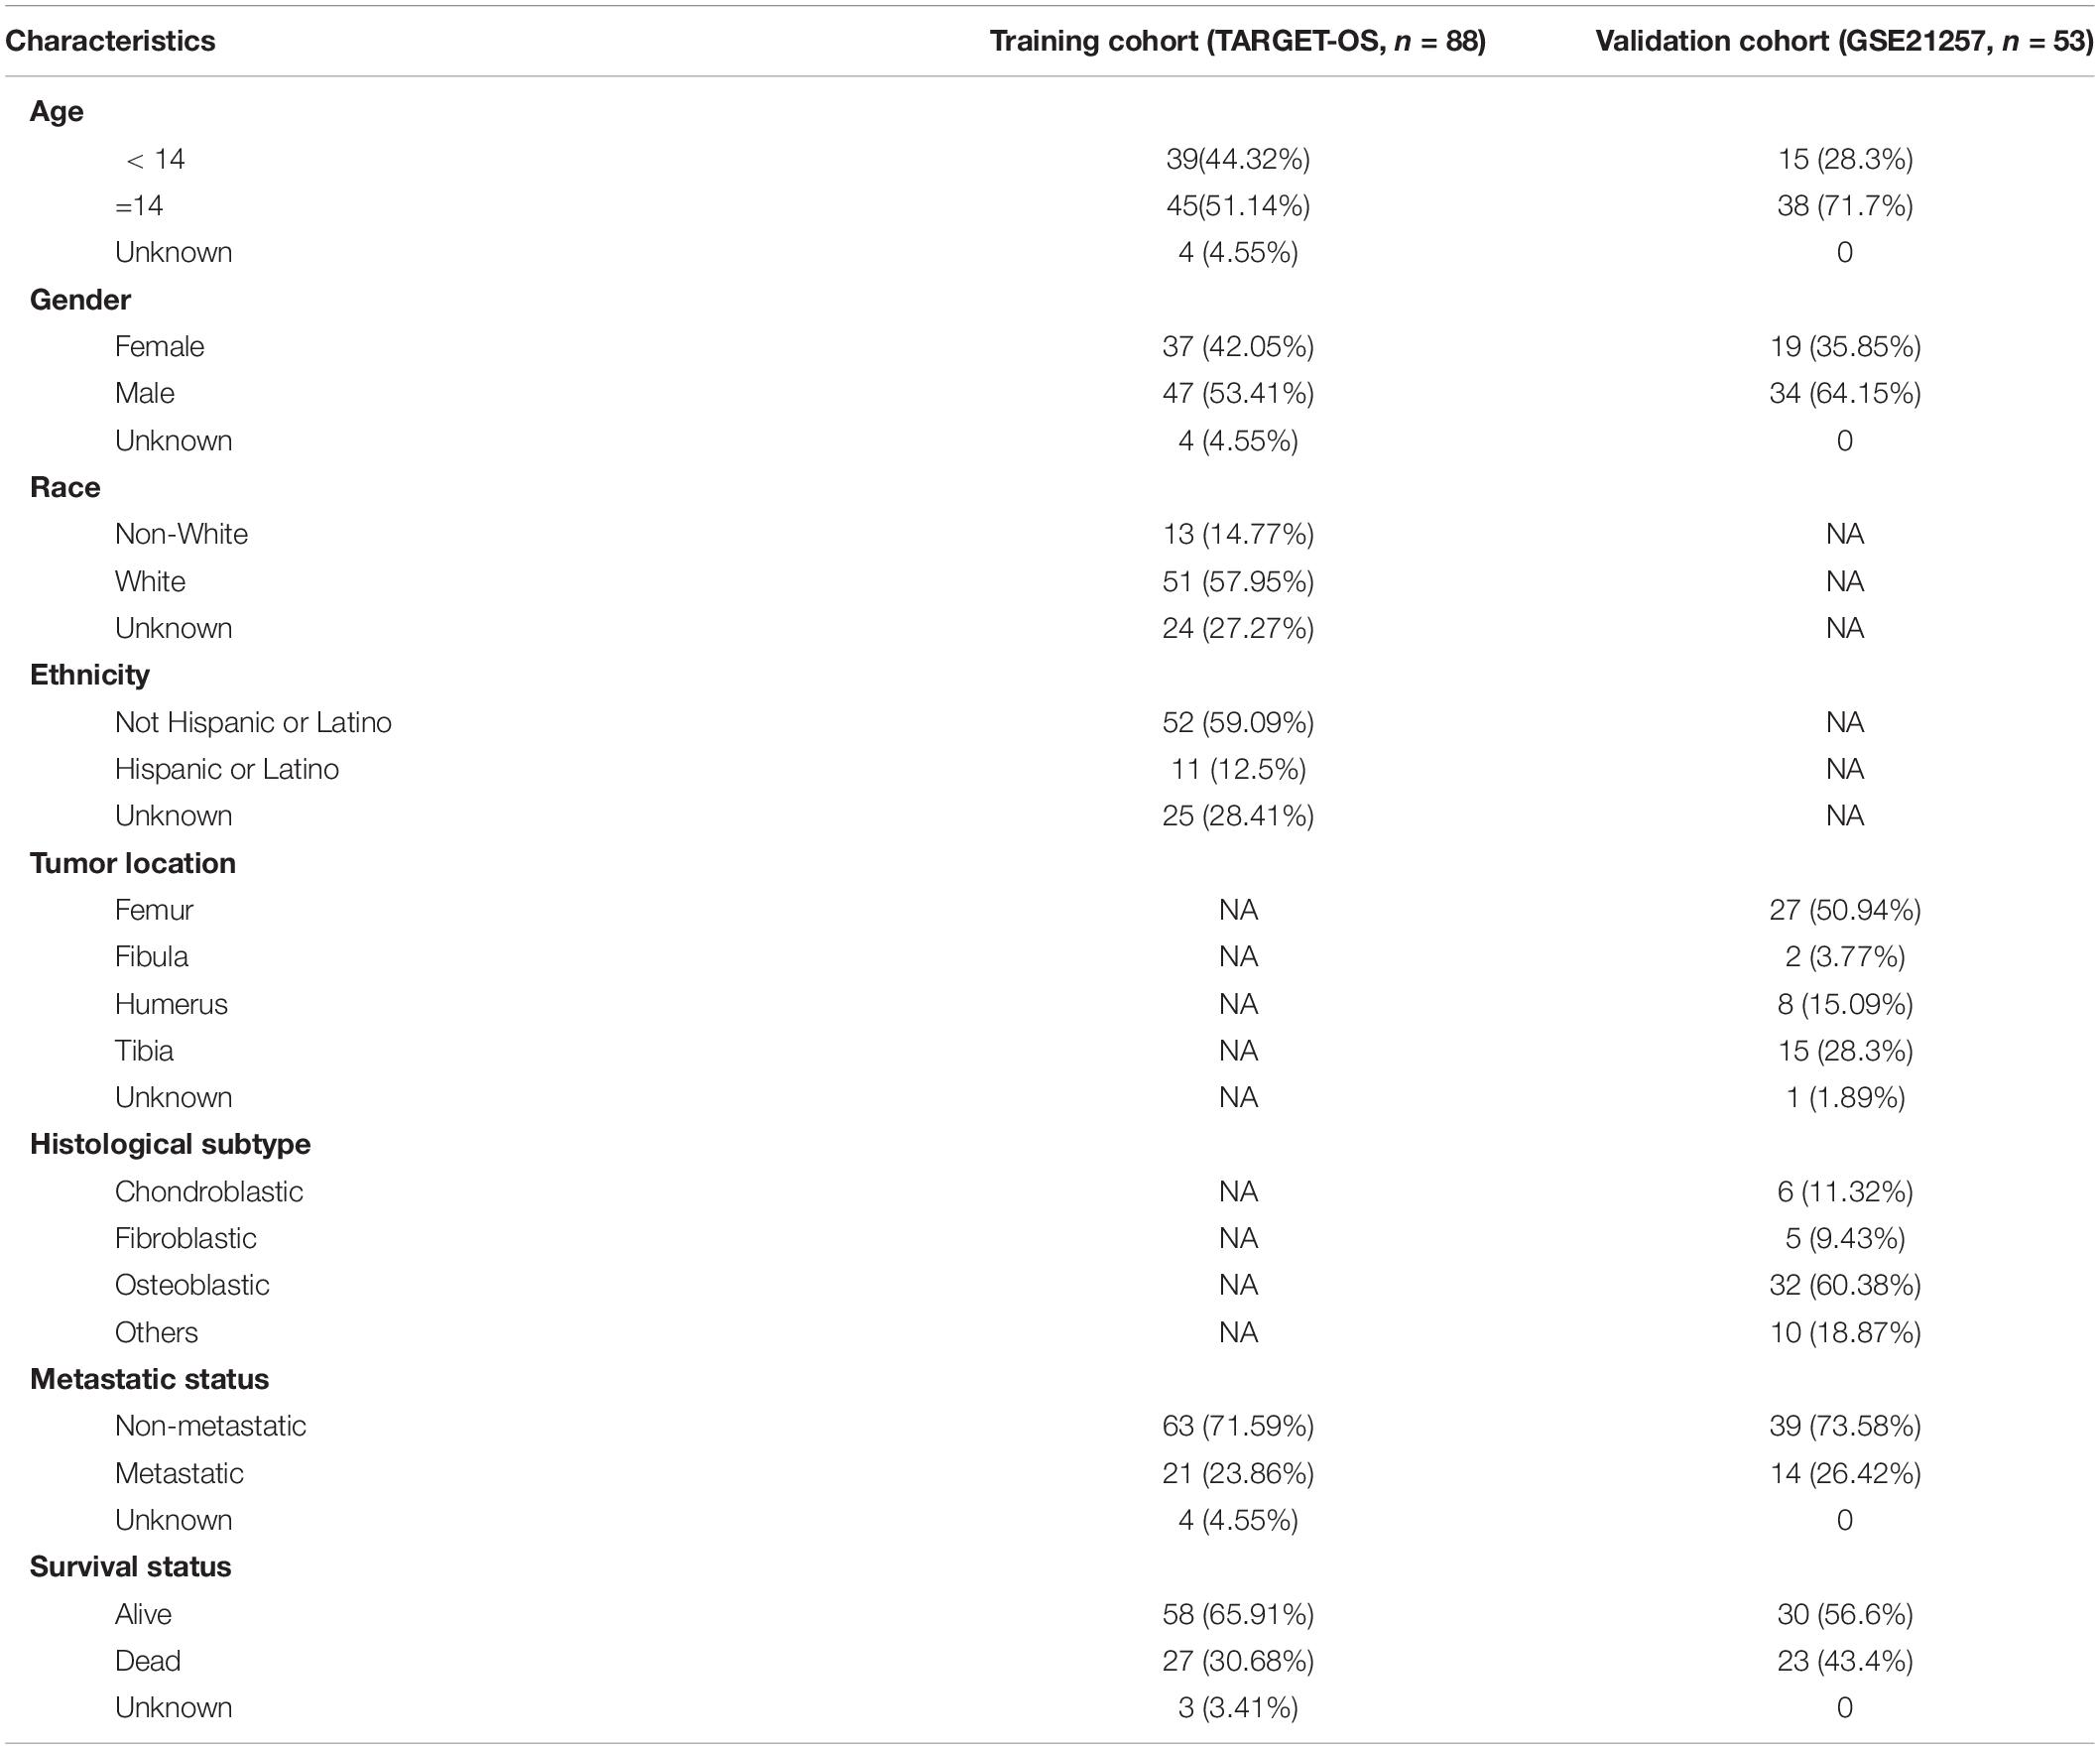
Table 1. Clinical characteristics of patients involved in the study.
To obtain the ICI profile of each OS sample, we adopted the CIBERSORT and ESTIMATE algorithms. The CIBERSORT algorithm could output the relative content of 22 TICs for each patient, and the ESTIMATE algorithm calculated the immune score and stromal score. Combining the results above, we got the ICI profiles for all samples. We found two independent ICI subtypes (Figure 2A and Supplementary Figure 1) from the clustering results generated from the “ConsesusClusterPlus” R package, which runs based on the tumor samples with matched ICI profiles in the training cohort. More importantly, in the subsequent Kaplan–Meier analysis, we discovered significant survival differences (log-rank test, p = 0.046; Figure 2B) between these two subgroups. In detail, ICI cluster A correlated with a good prognosis, while ICI cluster B witnessed a shorter overall survival.
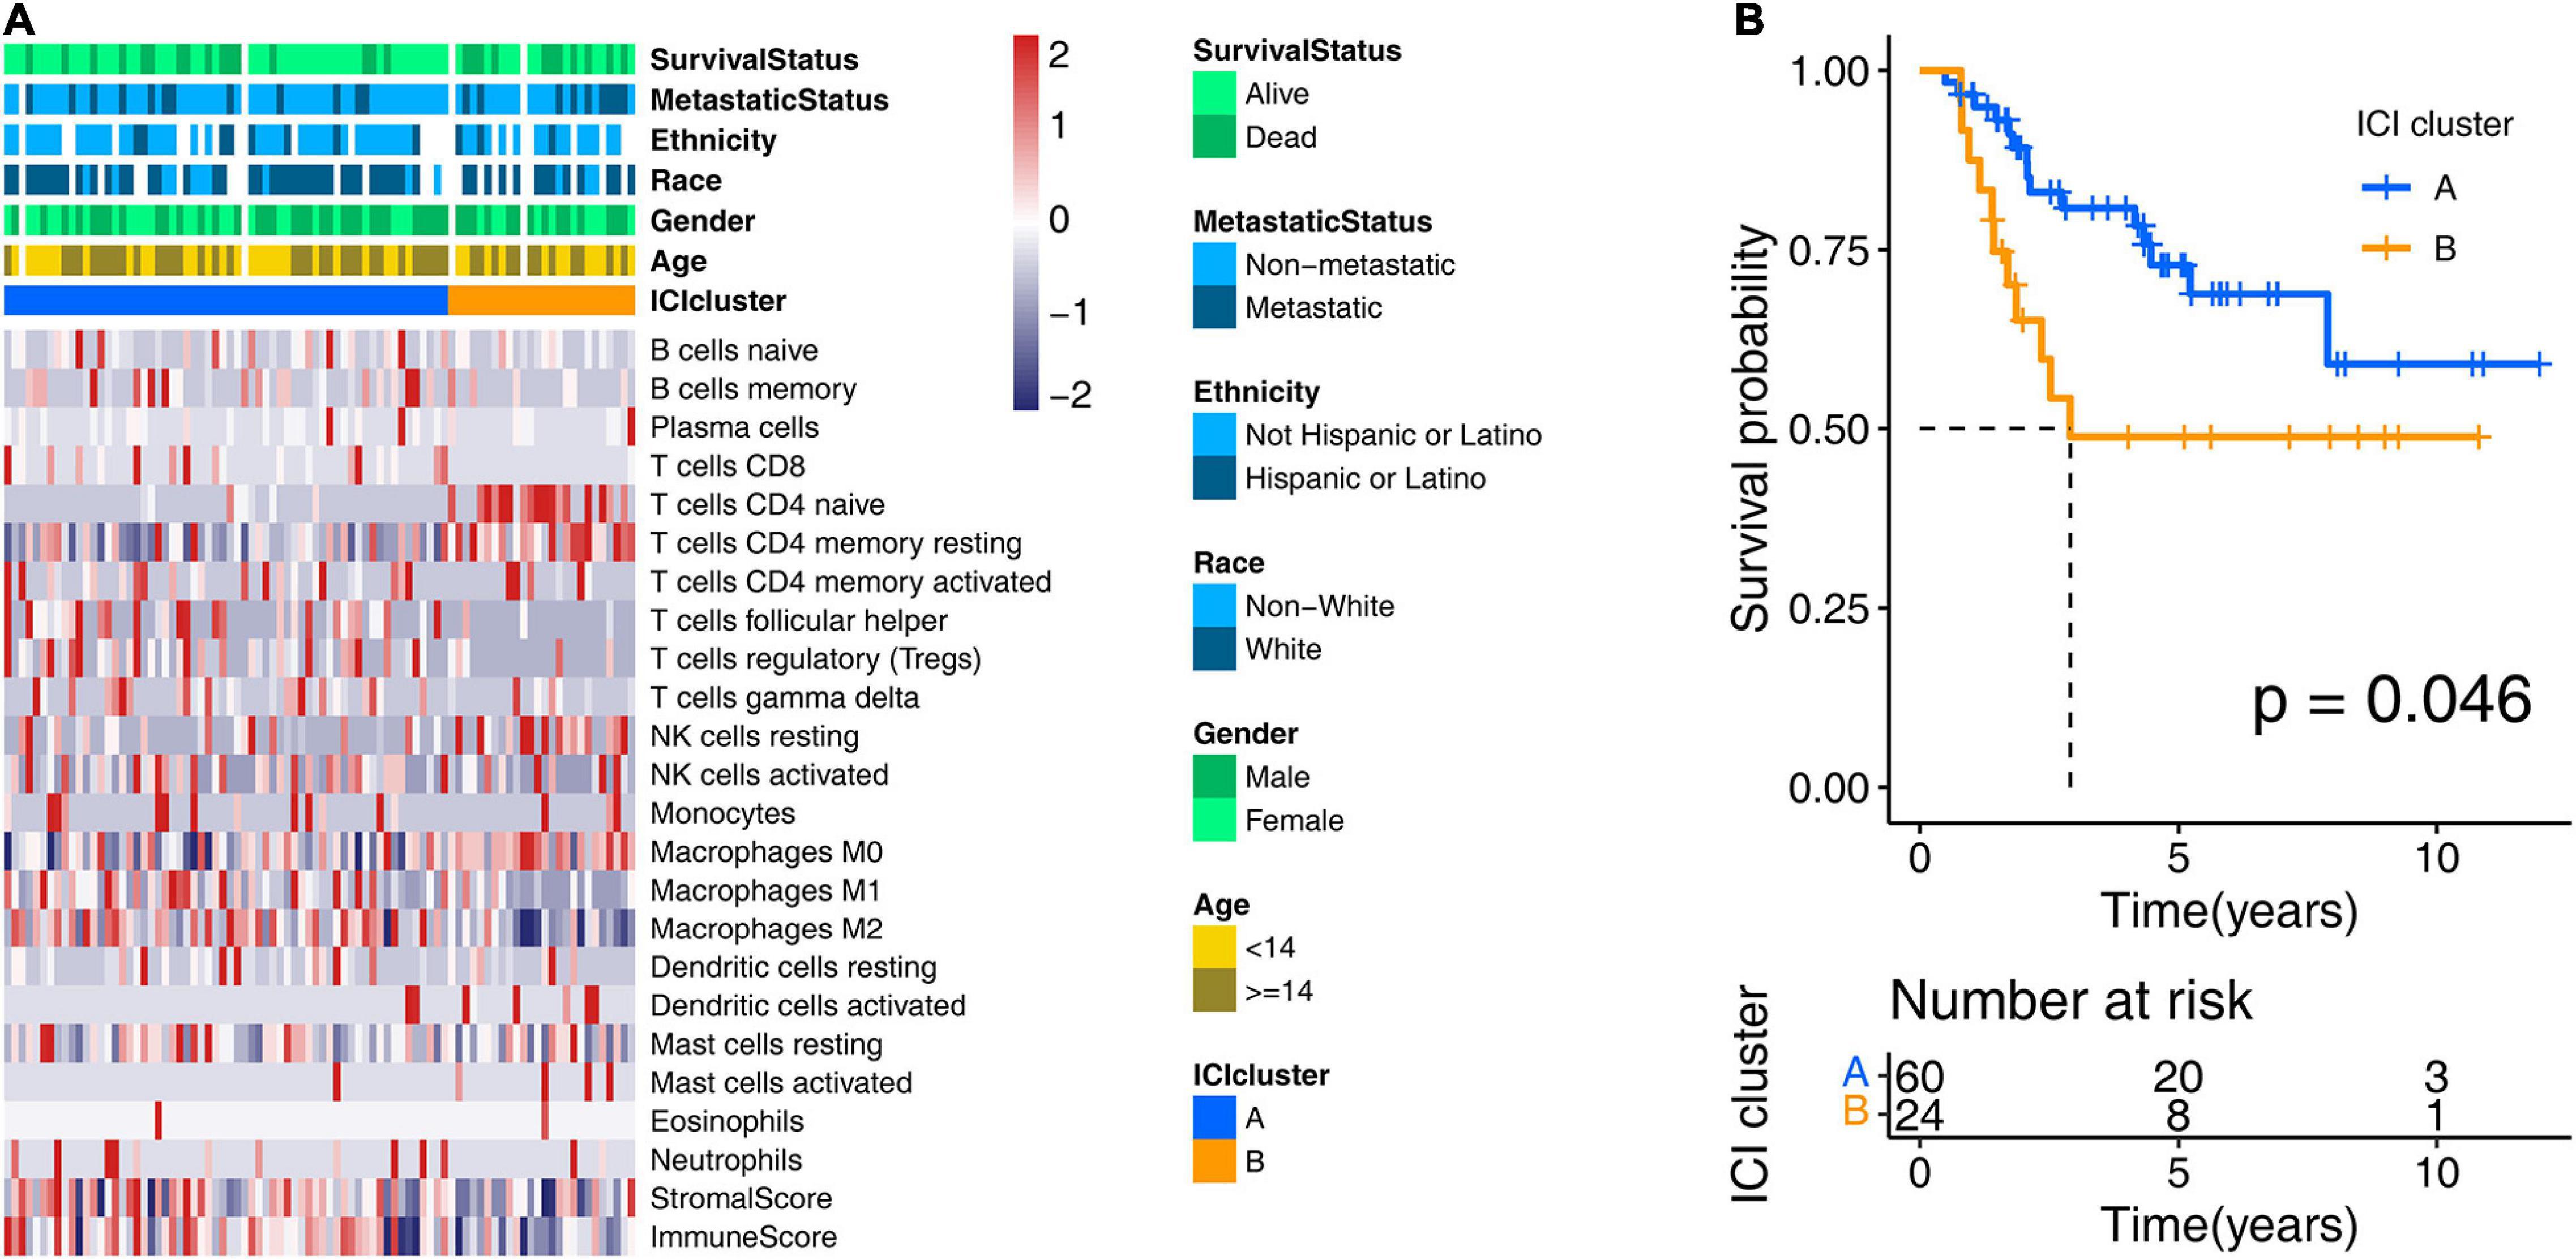
Figure 2. Consensus clustering for tumor-infiltrating immune cells. (A) Two ICI clusters were generated from unsupervised clustering of the ICI profile data of the training cohort. Rows represent ICI types, and columns represent OS samples. (B) Overall survival-based Kaplan–Meier estimator of two ICI clusters in the training cohort. The log-rank test showed an overall p = 0.046. ICI, immune cell infiltration; OS, osteosarcoma.
We conducted a differential analysis using the “limma” R package to determine the transcriptome variation between the two ICI clusters to reveal the potential biological characteristics of different immunophenotypes. A total of 4,501 DEGs were found (Supplementary Table 1). In the subsequent analysis, a Kaplan–Meier estimator and univariate Cox proportional hazards model were constructed to test the DEGs’ prognostic capacities. We only treated the DEGs with a p-value < 0.05 in both tests as potential prognostic genes. There were 15 genes that passed our tests and were determined as potential prognostic genes (Supplementary Table 2). We then put them into an overall survival-based Cox model with Lasso regression (Figure 3A) for further shrinkage and selection. The Lasso algorithm outputted the result, showing that it could achieve the optimal performance when the model had nine genes (Figure 3B). The regression coefficient of each gene was generated by the “glmnet” R package and is shown inTable 2.
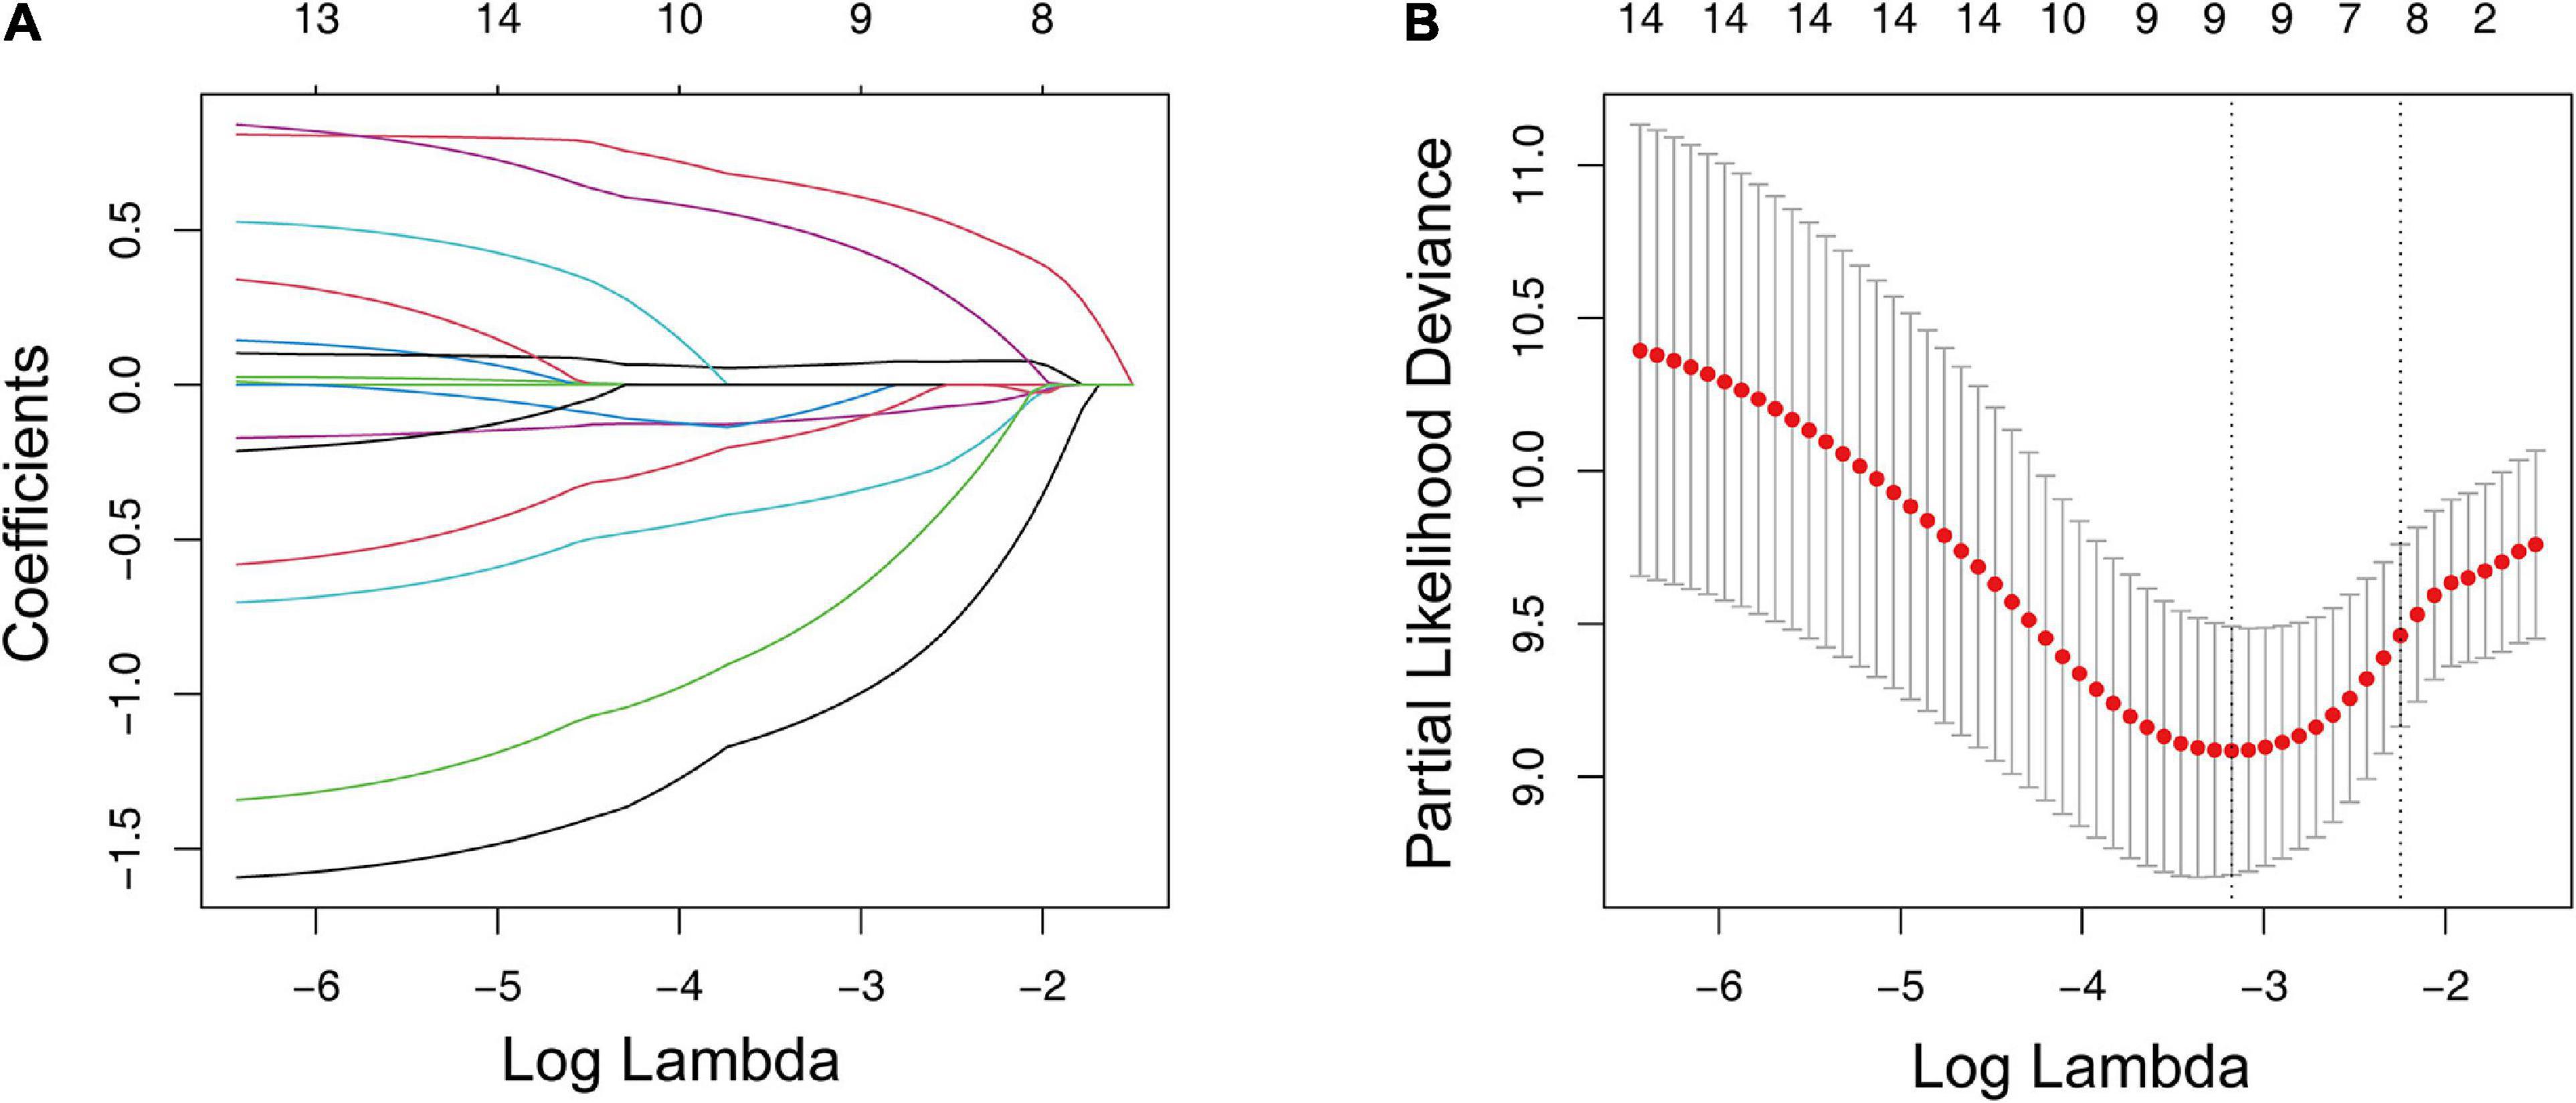
Figure 3. LASSO regression analysis for the construction of a prognostic gene signature. (A) Cross-validation for tuning parameter screening upon LASSO regression analysis. (B) Screening of the optimal parameter (lambda) at which the vertical lines were drawn. LASSO, the least absolute shrinkage and selection operator Cox regression model.
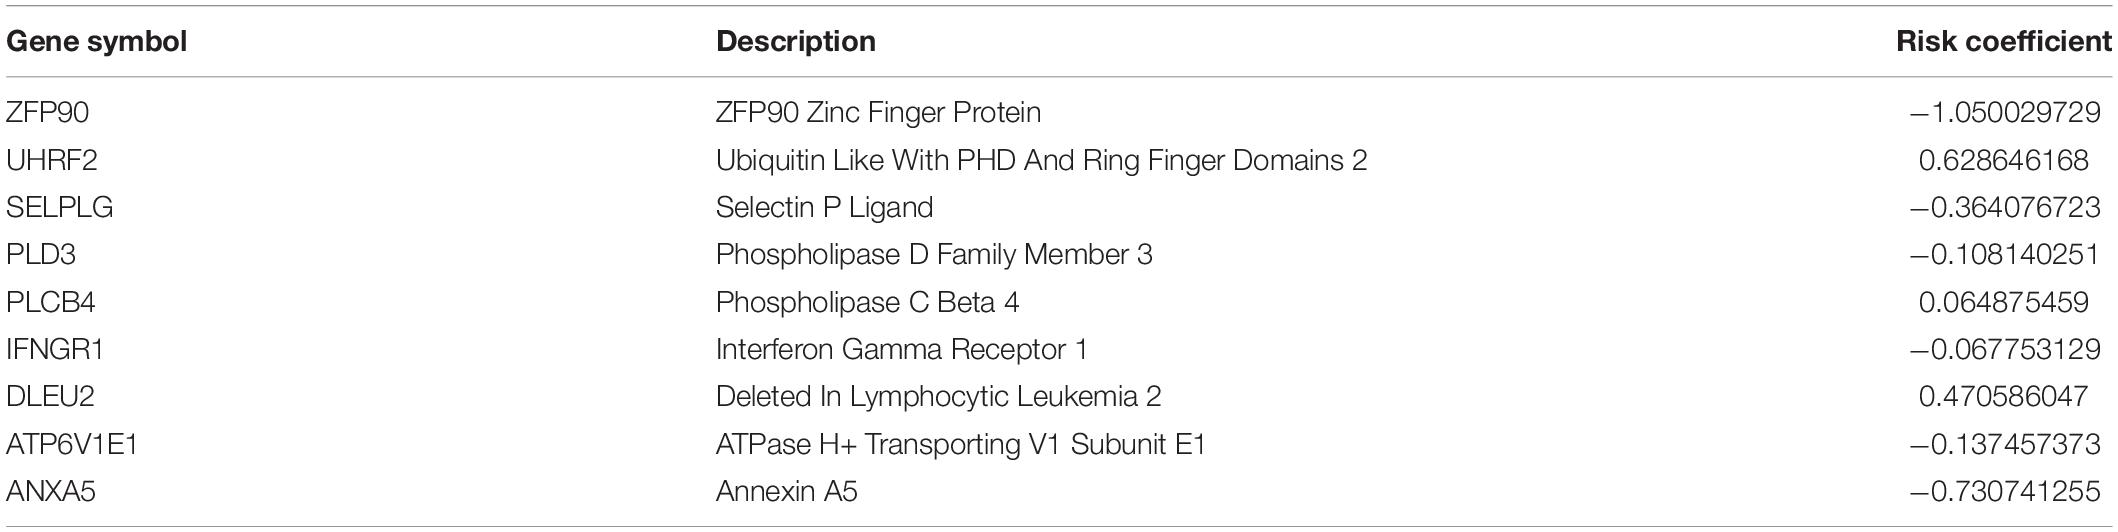
Table 2. Prognostic genes obtained from the LASSO Cox regression model.
According to the median risk score, OSs were assigned to the high-risk group or low-risk group. In Figure 4, we showed the overall view of the signature in the OS cohorts, including the risk score distribution, the survival status/time distribution maps, and the expression heat maps. As exhibited in Supplementary Figure 2, in the training cohort and the validation cohort, ANXA5, ZFP90, ATP6V1E1, SELPLG, PLD3, and IFNGR1 were associated with favorable prognoses for OS patients, while DLEU2, UHRF2, and PLCB4 were associated with unfavorable prognoses.
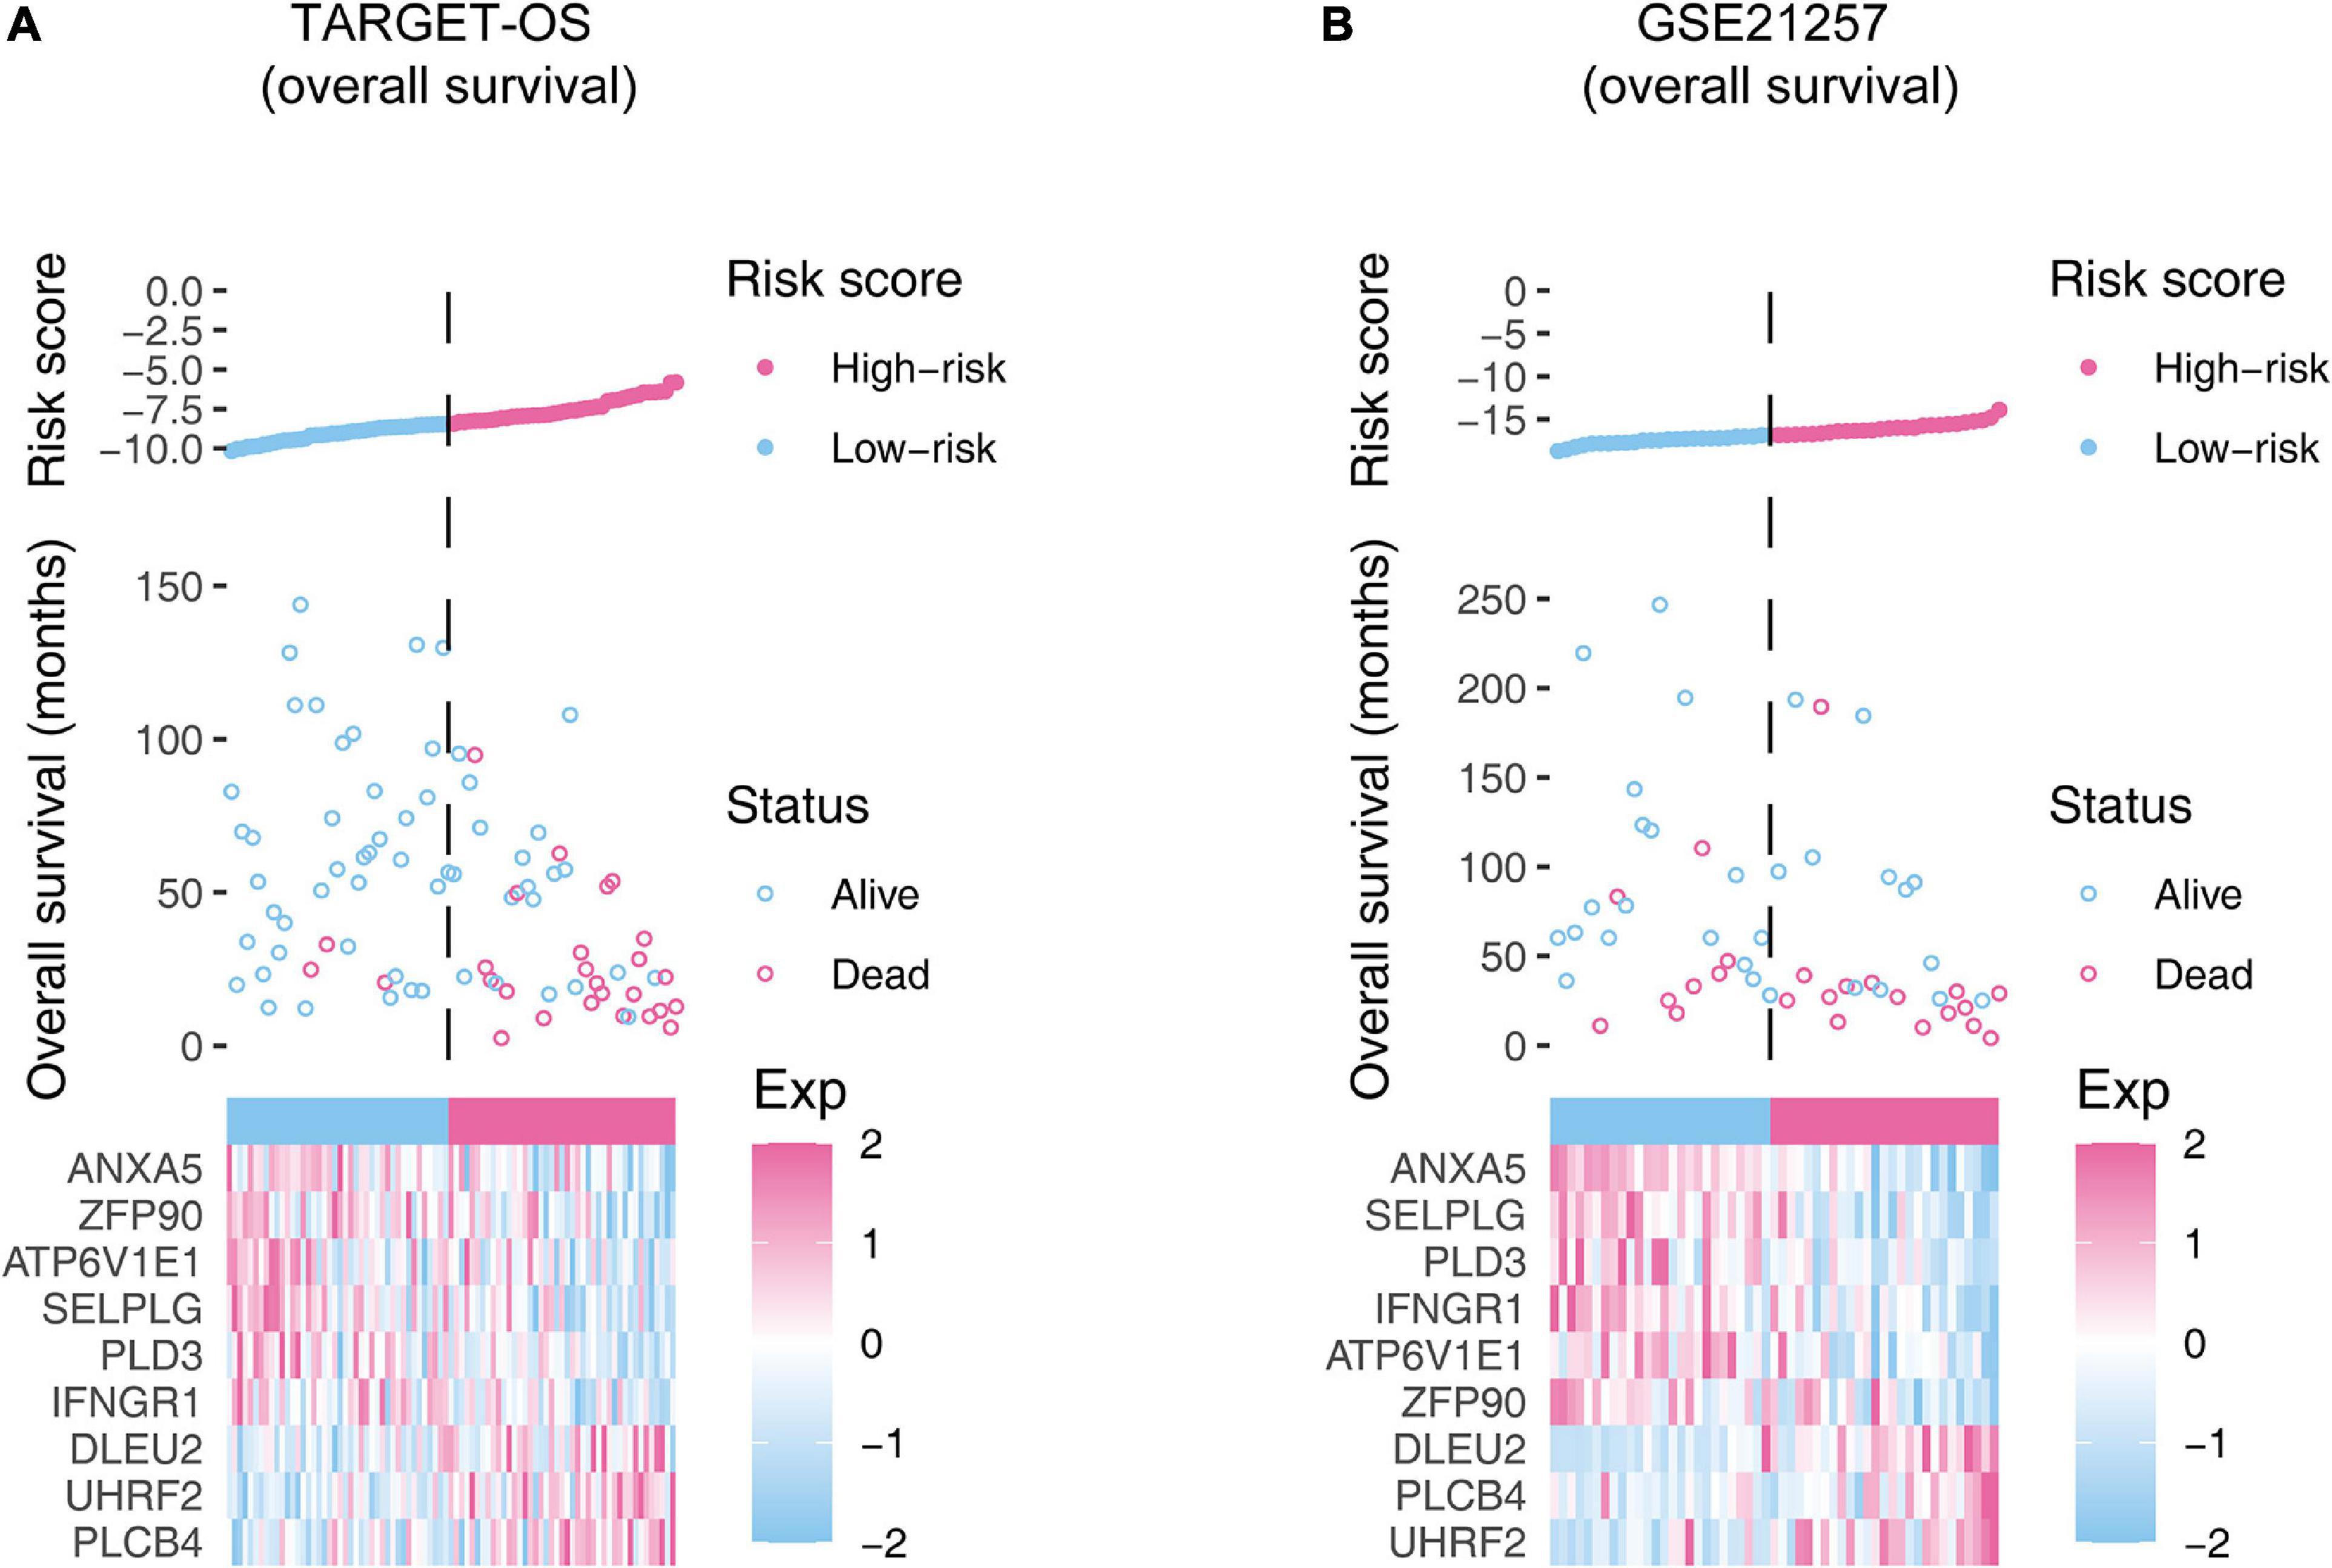
Figure 4. The overall distributions of the risk score (upper), survival status (middle), and gene expression profiles (bottom) of the nine-gene signature in the training (A) and validation (B) cohorts. The top parts show the distributions of the risk score. The center parts show the distributions of the patient survival time and status. The bottom parts indicate heatmaps of the nine gene expression profiles.
The Kaplan–Meier estimators built in the TARGET-OS cohort and the GSE21257 cohort witnessed significant survival differences between the high- and low-risk groups. These analyses showed that the high-risk groups had poorer survival possibilities than those in the low-risk groups (TARGET-OS: Figure 5A, p-value < 0.0001; GSE21257: Figure 5B, p-value = 0.012). We constructed univariate and multivariate Cox proportional hazard models using the available clinical covariables of the training and validation cohorts to validate the nine-gene signature’s prognostic and independence ability (Figure 6). The covariables we included were as follows: risk score, sex, age, race, ethnicity, metastasis status, tumor location, and histological subtype. The Cox models built in the training cohort showed that the risk score is the only factor that significantly affects the prognosis of OS in both univariate (p-value = 3.84e–09) and multivariate (p-value = 1.46e–05) analyses. Consistent with the training cohort, the Cox proportional hazards models construed in the validation cohort also confirmed the strong predictive ability of the gene signature (p-value = 1.36e–02). In this analysis, the metastasis factor also validated having prognosis ability but was weaker than the risk score after comparing p-values. Based on the evidence mentioned above, we can reasonably infer that the nine-gene signature has a strong independent prognostic ability.
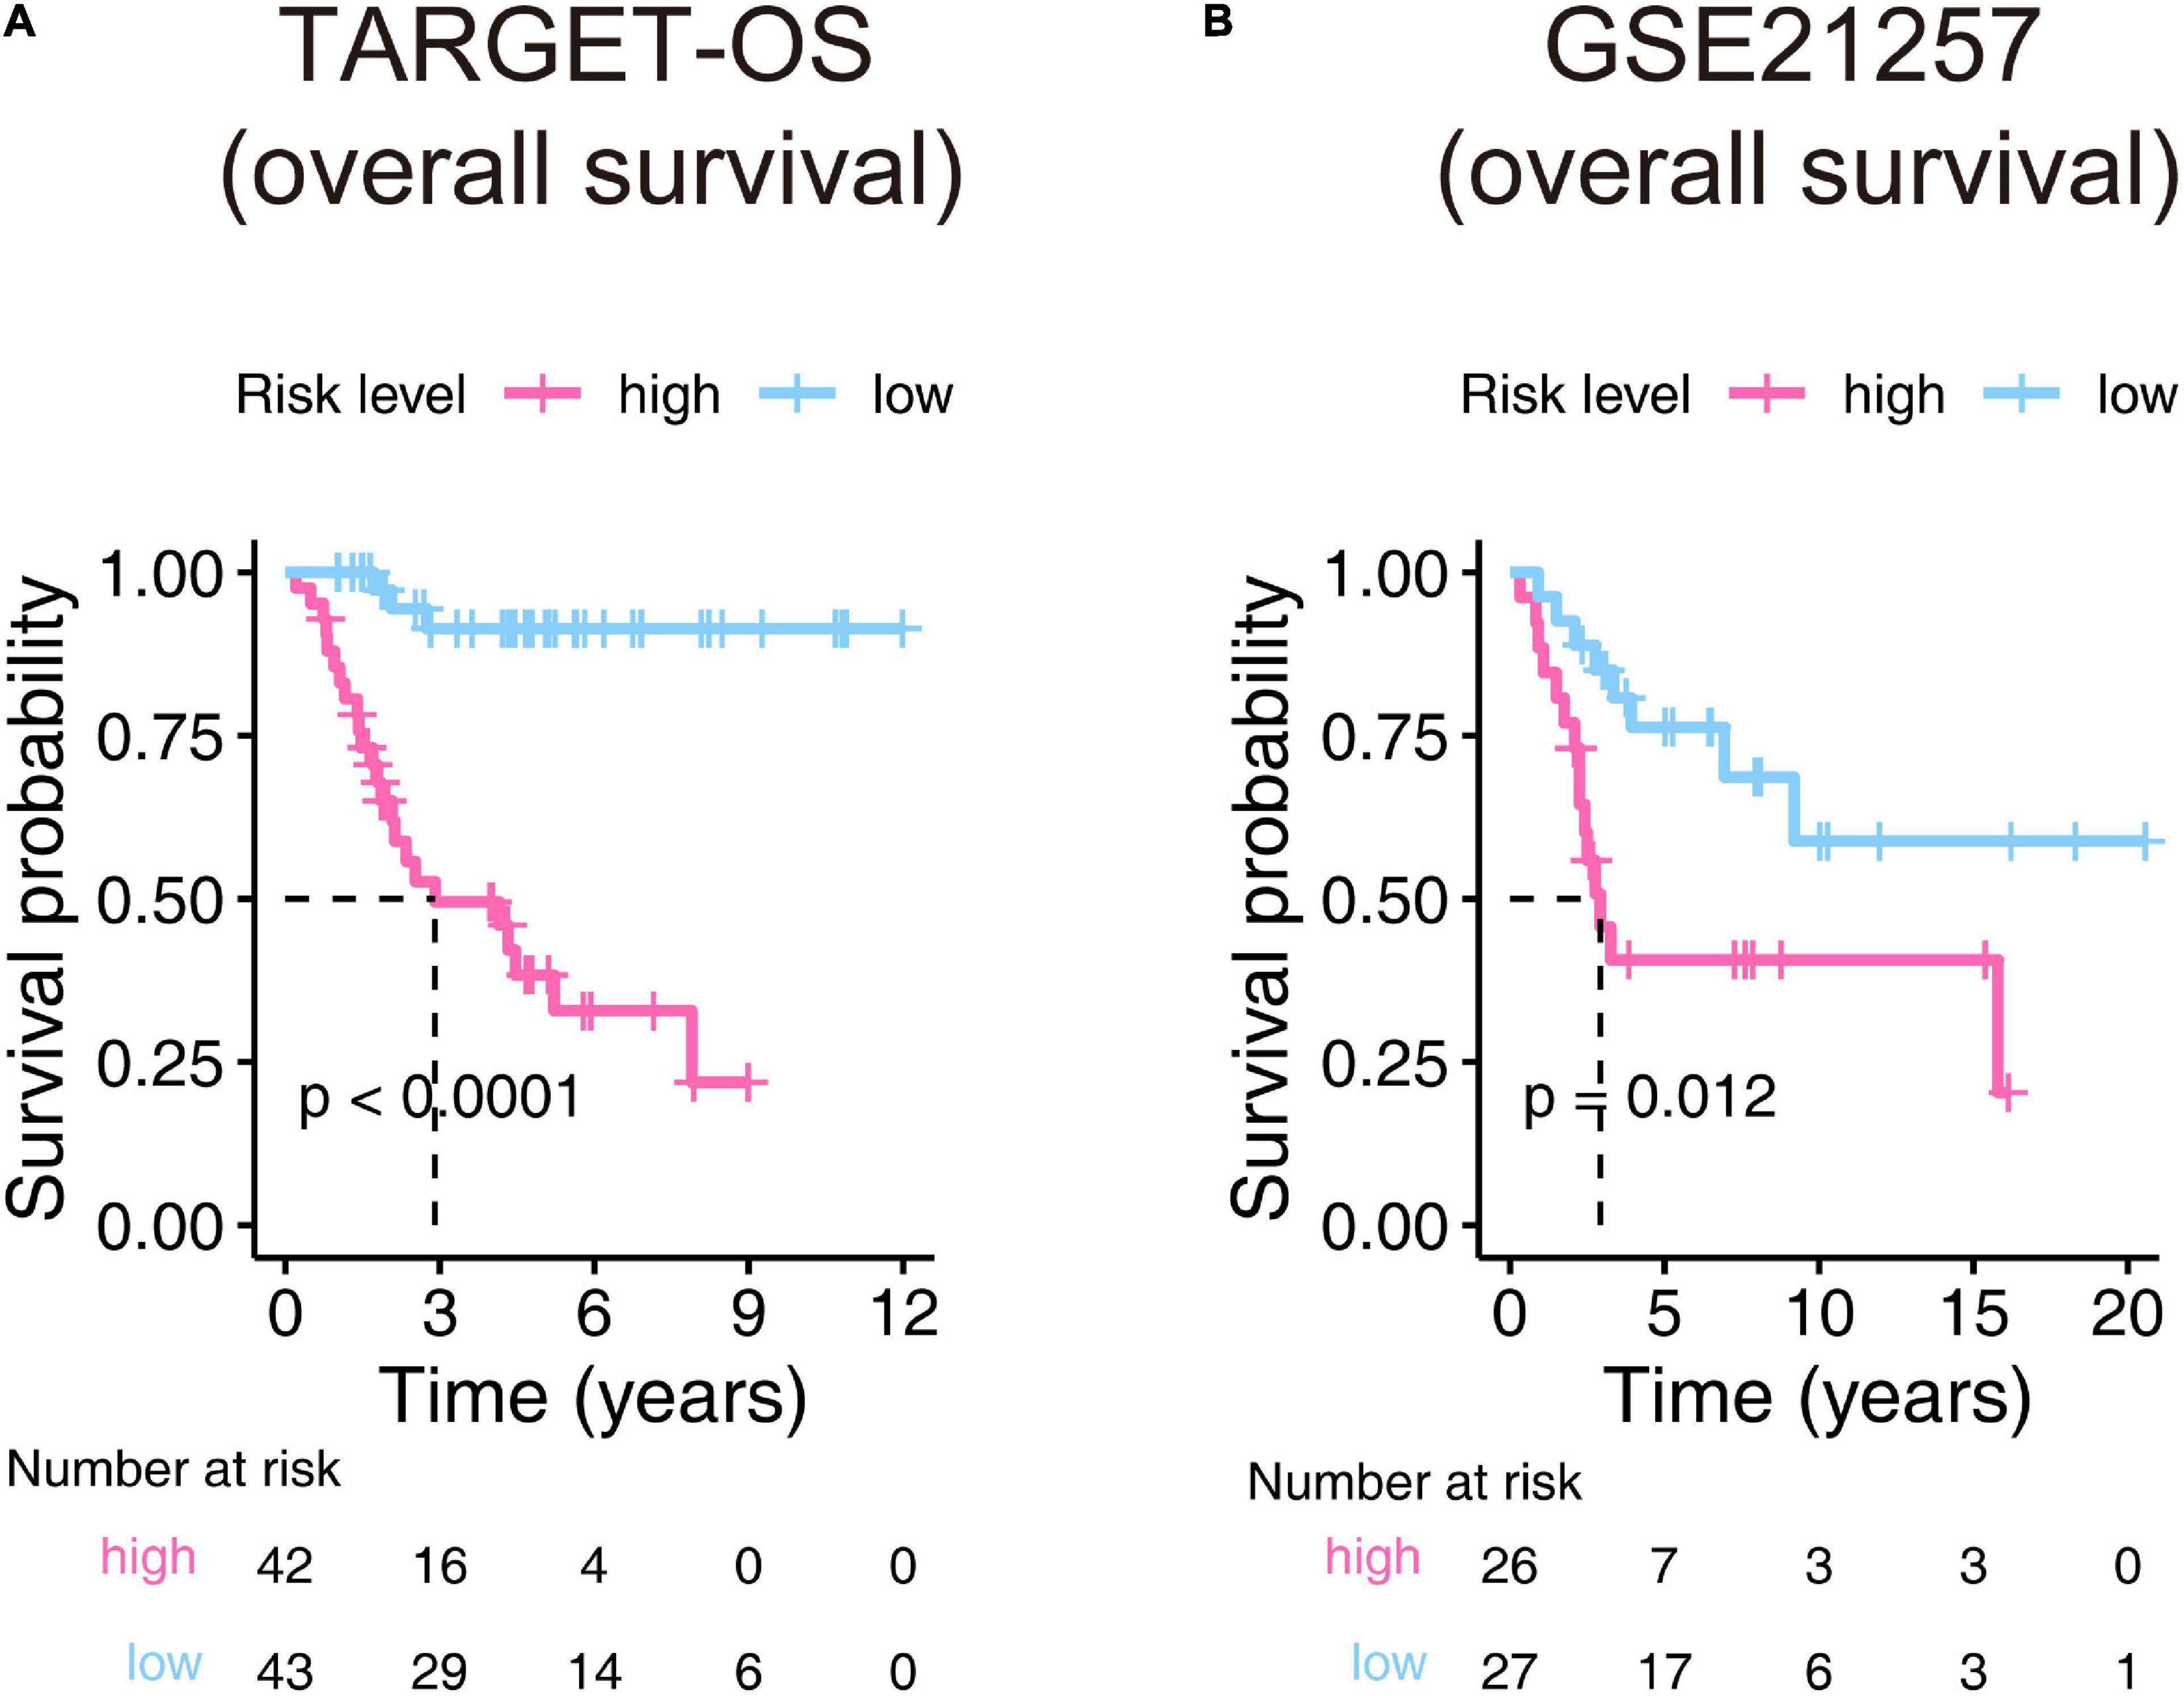
Figure 5. Kaplan–Meier estimator evaluates the nine-gene signature’s prognostic capacity in the training (A) and validation (B) cohorts. The bottom parts indicate the number of patients at risk. The two-sided log-rank test measured the differences between the high- and low-risk groups with a p-value < 0.05.
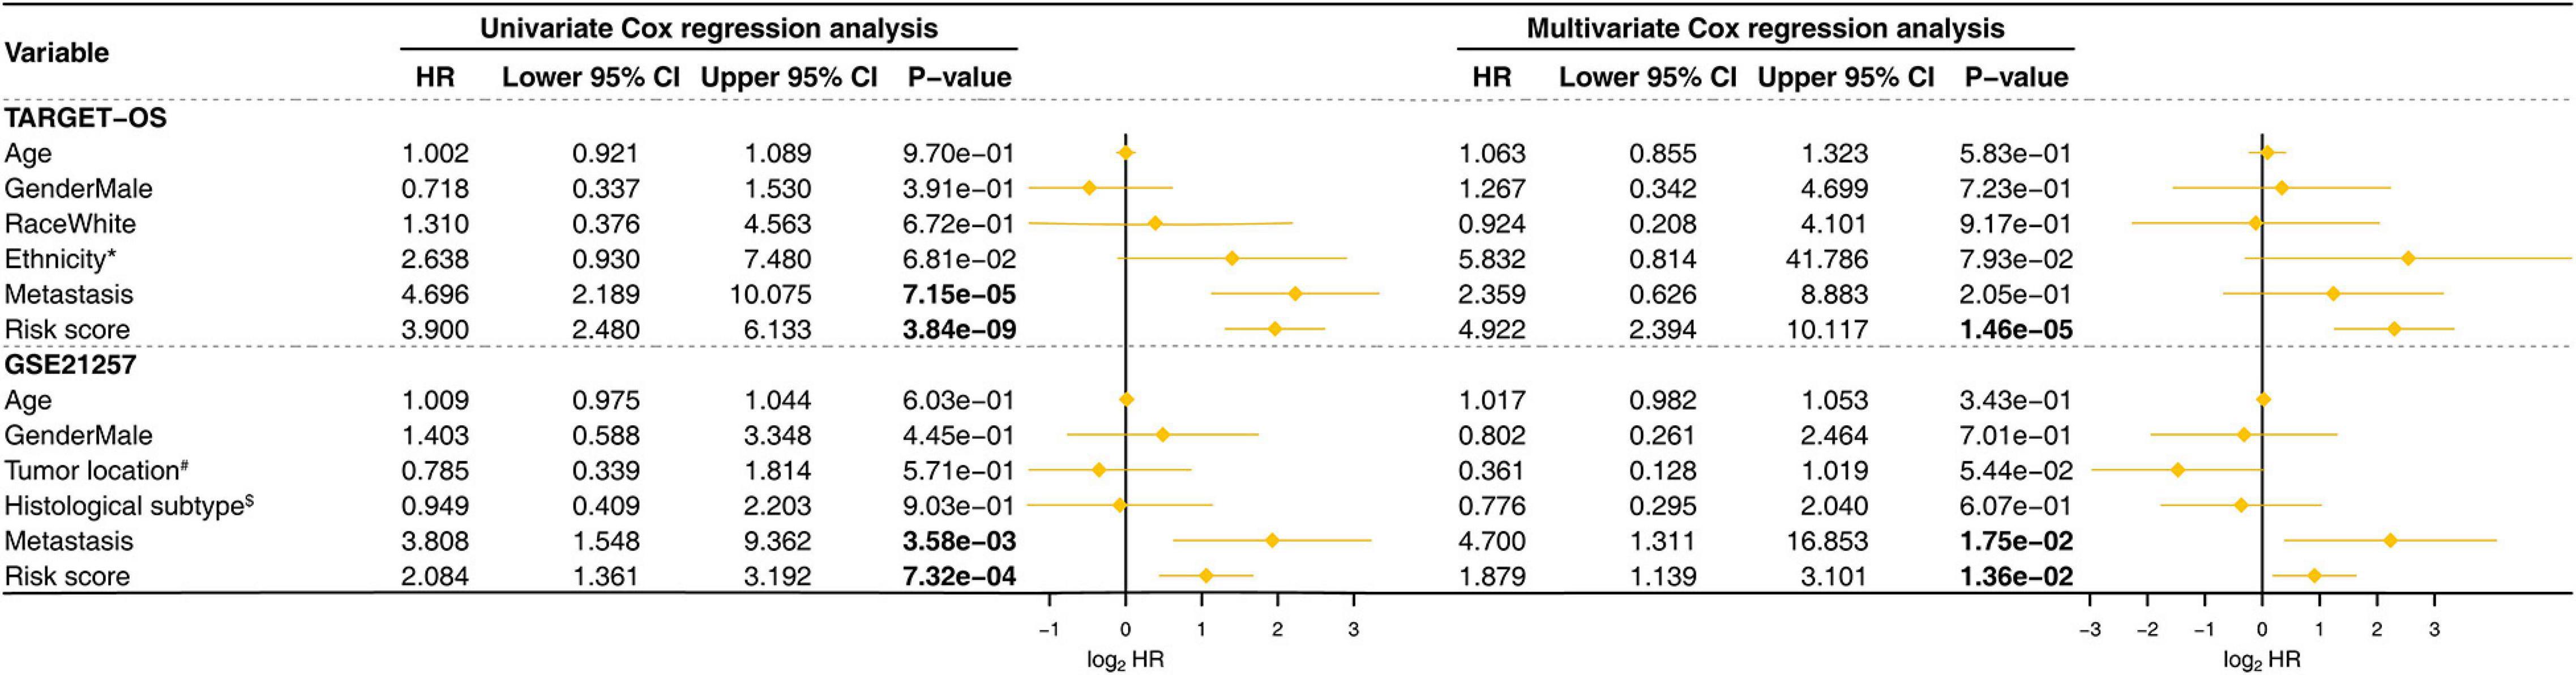
Figure 6. Univariate and multivariate Cox proportional hazards models were built to test the predictive ability of the nine-gene signature in the training and validation cohorts. HR, hazard ratio; CI, confidence interval; The bold p-value indicates that<0.05, which considers significant. *Hispanic or Latino vs. Non-Hispanic or Latino; #Femur vs. Non-Femur; $Osteoblastic vs. Non-Osteoblastic.
The area under the ROC curve, called AUC, is currently considered the standard method for evaluating the accuracy of predictive distribution models (Kamarudin et al., 2017). IAUC is an efficient tool in assessing the performance of a candidate marker given the true disease status of individuals at specific time points (Kamarudin et al., 2017). IBS is an overall measure for the prediction of the model at all times (Kronek and Reddy, 2008). This section used ROC curves, IAUC, and IBS to validate the nine-gene signature’s predictive ability and compare it with other variables. As displayed in Figure 7A, for the analyses performed in the training cohort, the gene signature’s AUCs were 0.874, 0.830, and 0.883 at 1, 3, and 5 years, respectively, and the IAUC results showed that the risk score stayed at a higher level compared to all other factors at all time points. Also, the IBS remained at the lowest level the whole time. Consistently, the risk score’s AUC in GSE21257 (Figure 7B) was=0.724 at the 1-, 3-, and 5-year time points and were greater than those of the other variates at any time. The signature’s IBS also stayed lower than other clinical characteristics at all time points. The above results indicated that the gene signature we found was superior to other clinical factors.
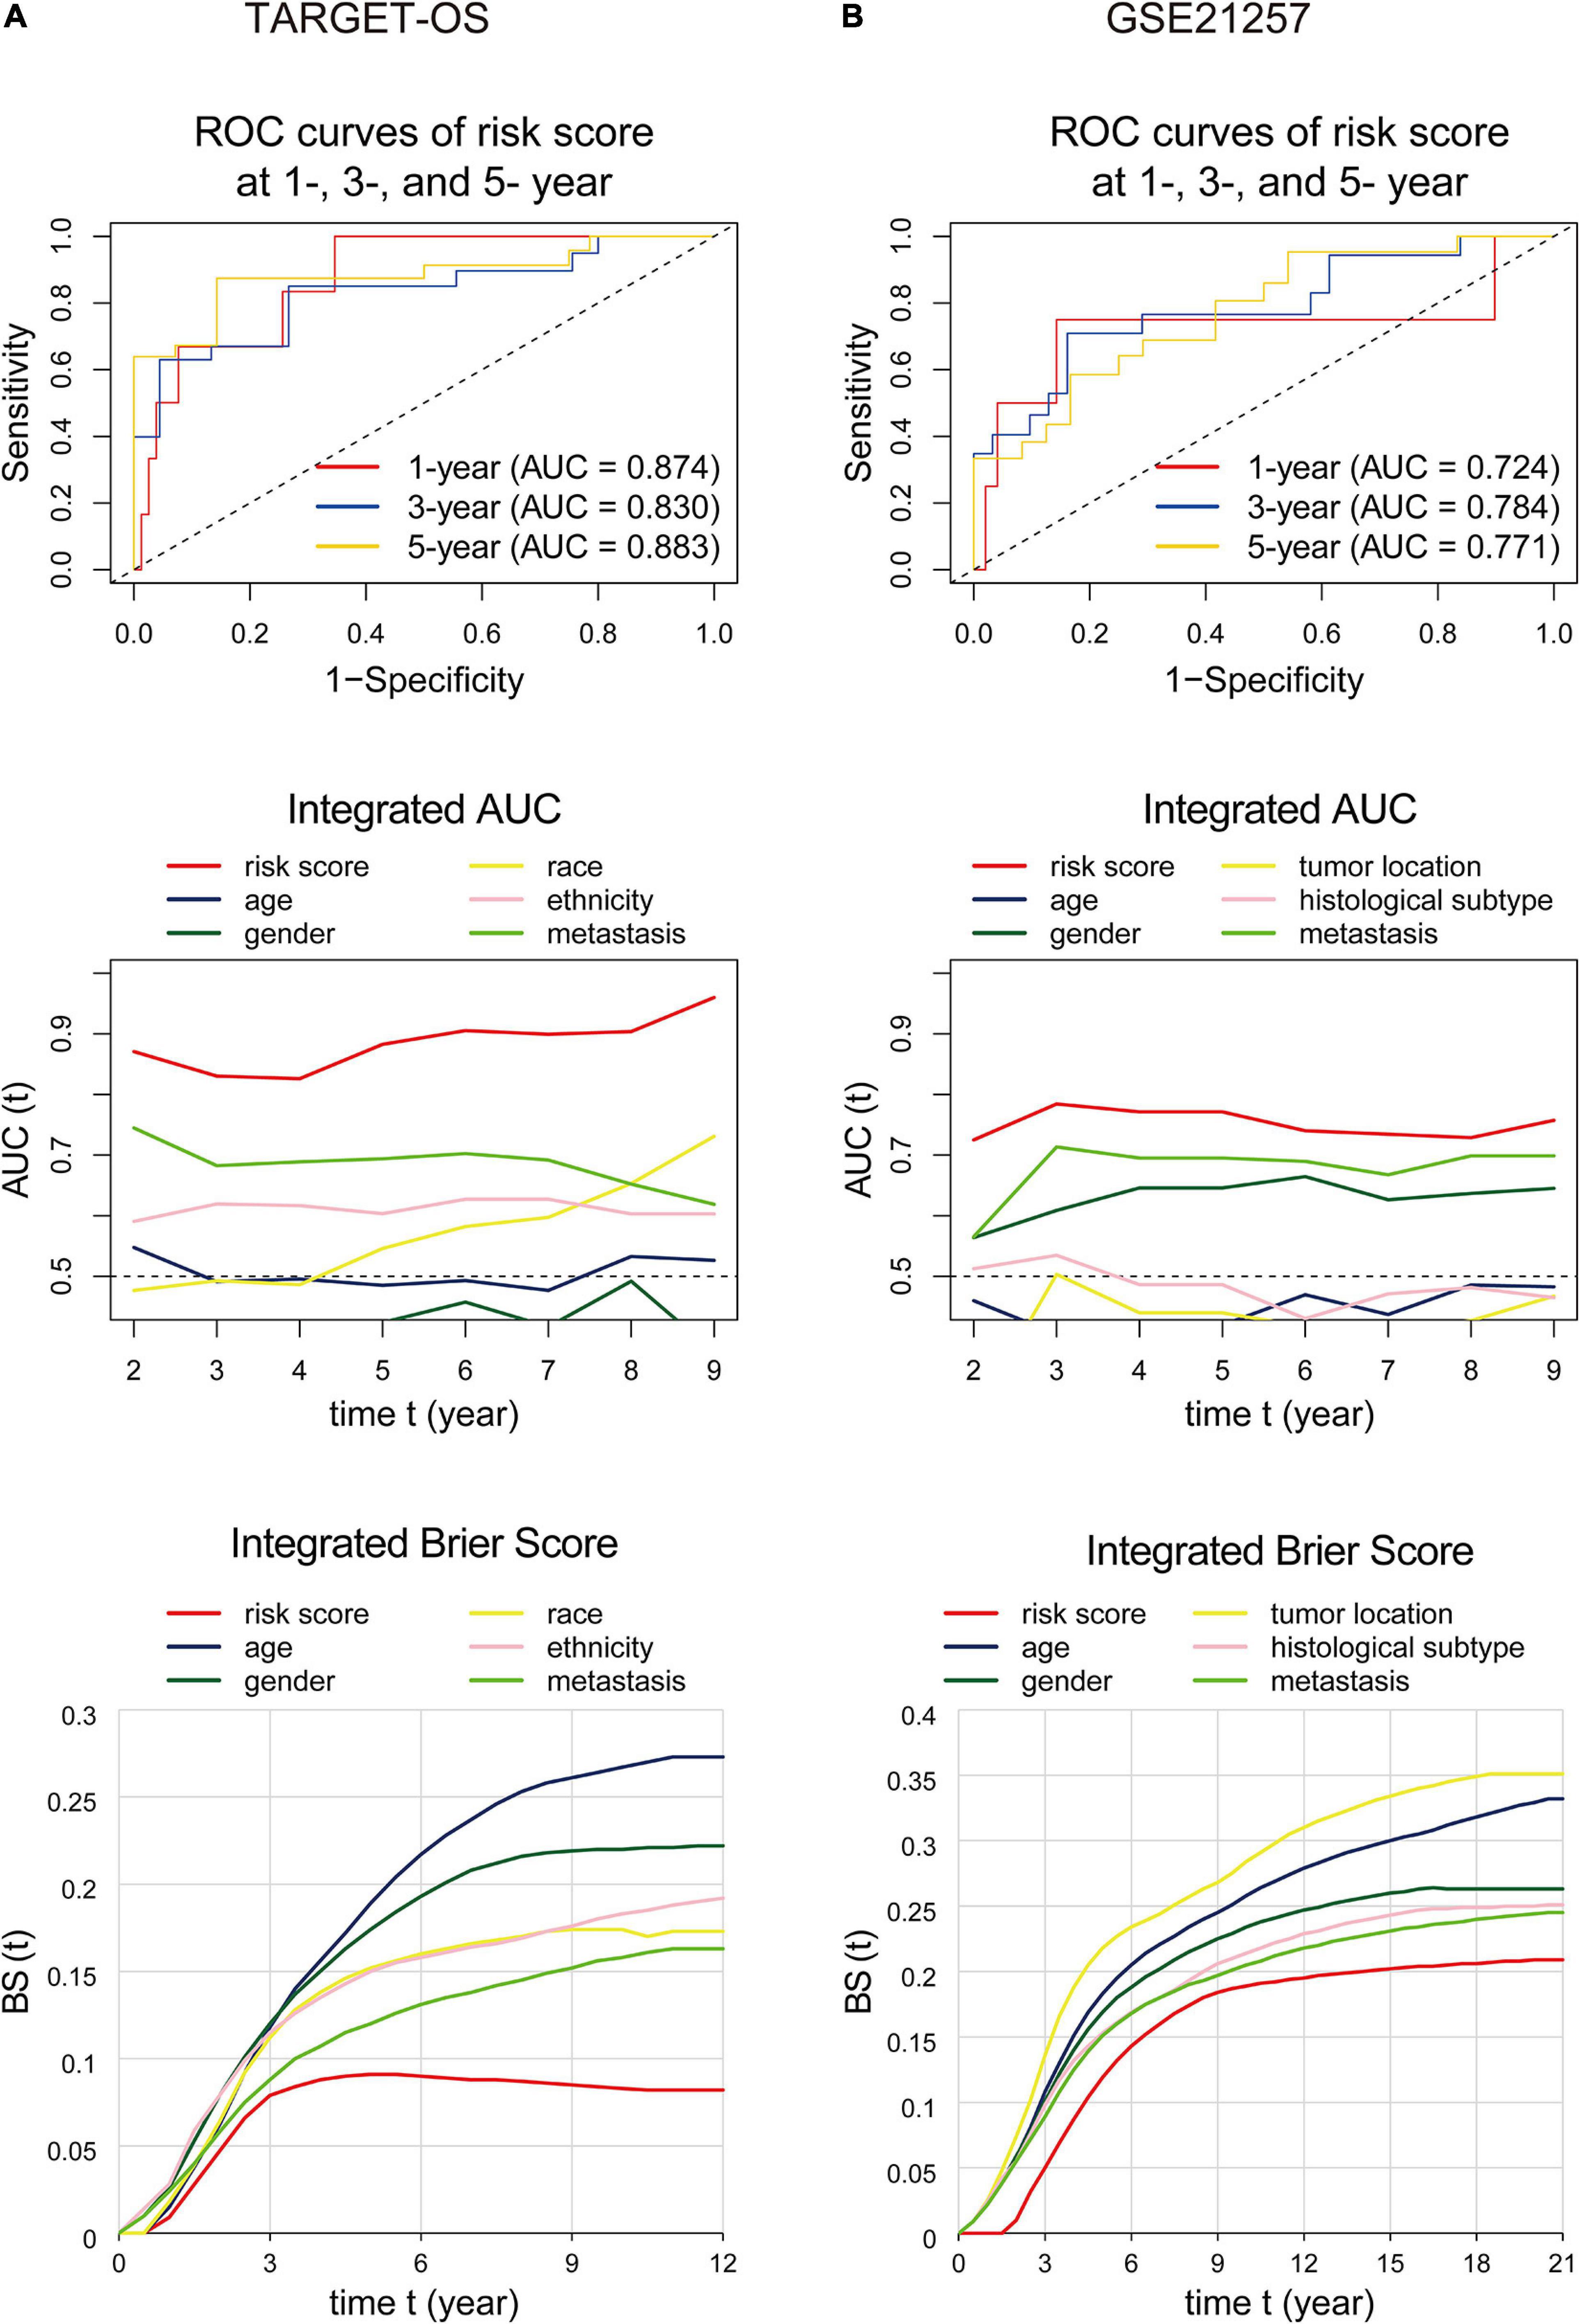
Figure 7. ROC curves, integrated AUC analysis, and integrated Brier score analysis performed to examine the predictive ability of the nine-gene signature in the training (A) and validation (B) cohorts. The ROC curvesdisplay prognostic capacities with the nine-gene signature at 1-, 3-, and 5-year time points. The integrated AUC and integrated Brier score analysis show the predictive ability comparisons between the nine-gene signature and other clinical factors. ROC, receiver operating characteristic; AUC, area under the ROC curve.
According to the screening criteria, nine studies were selected as candidates. The details are shown inTable 3. Kaplan–Meier curves were plotted against our nine-gene signature and the candidate signatures in the training and validation cohorts (Figure 8). Kaplan–Meier plots indicated that only the nine-gene signature and that of Yang et al. signature could predict prognosis in both the TARGET-OS and GSE21257 cohorts. However, the p-value of our nine-gene signature (p-value = 1.208e–02) witnessed more strength than that of Yang et al. (p-value = 3.602e–02). Additionally, univariate Cox models were built using these gene signatures in the training and validation cohorts (Figure 9). The univariate Cox regression results showed that only our nine-gene signature exhibited prognosis capable in these cohorts (p-value = 7.32e–04). From the evidence mentioned above, the nine-gene signature is superior to our predecessors.
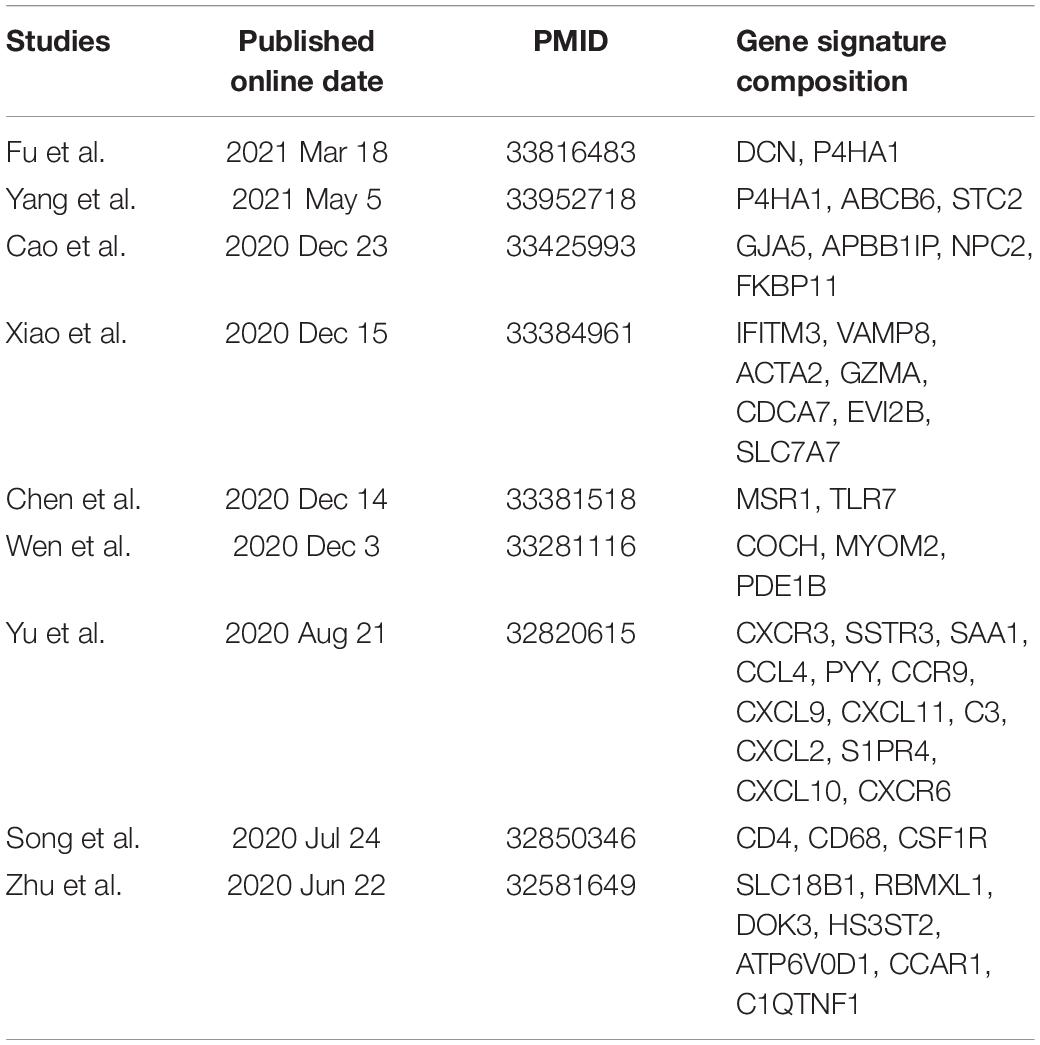
Table 3. Candidate research for comparison to our signature.
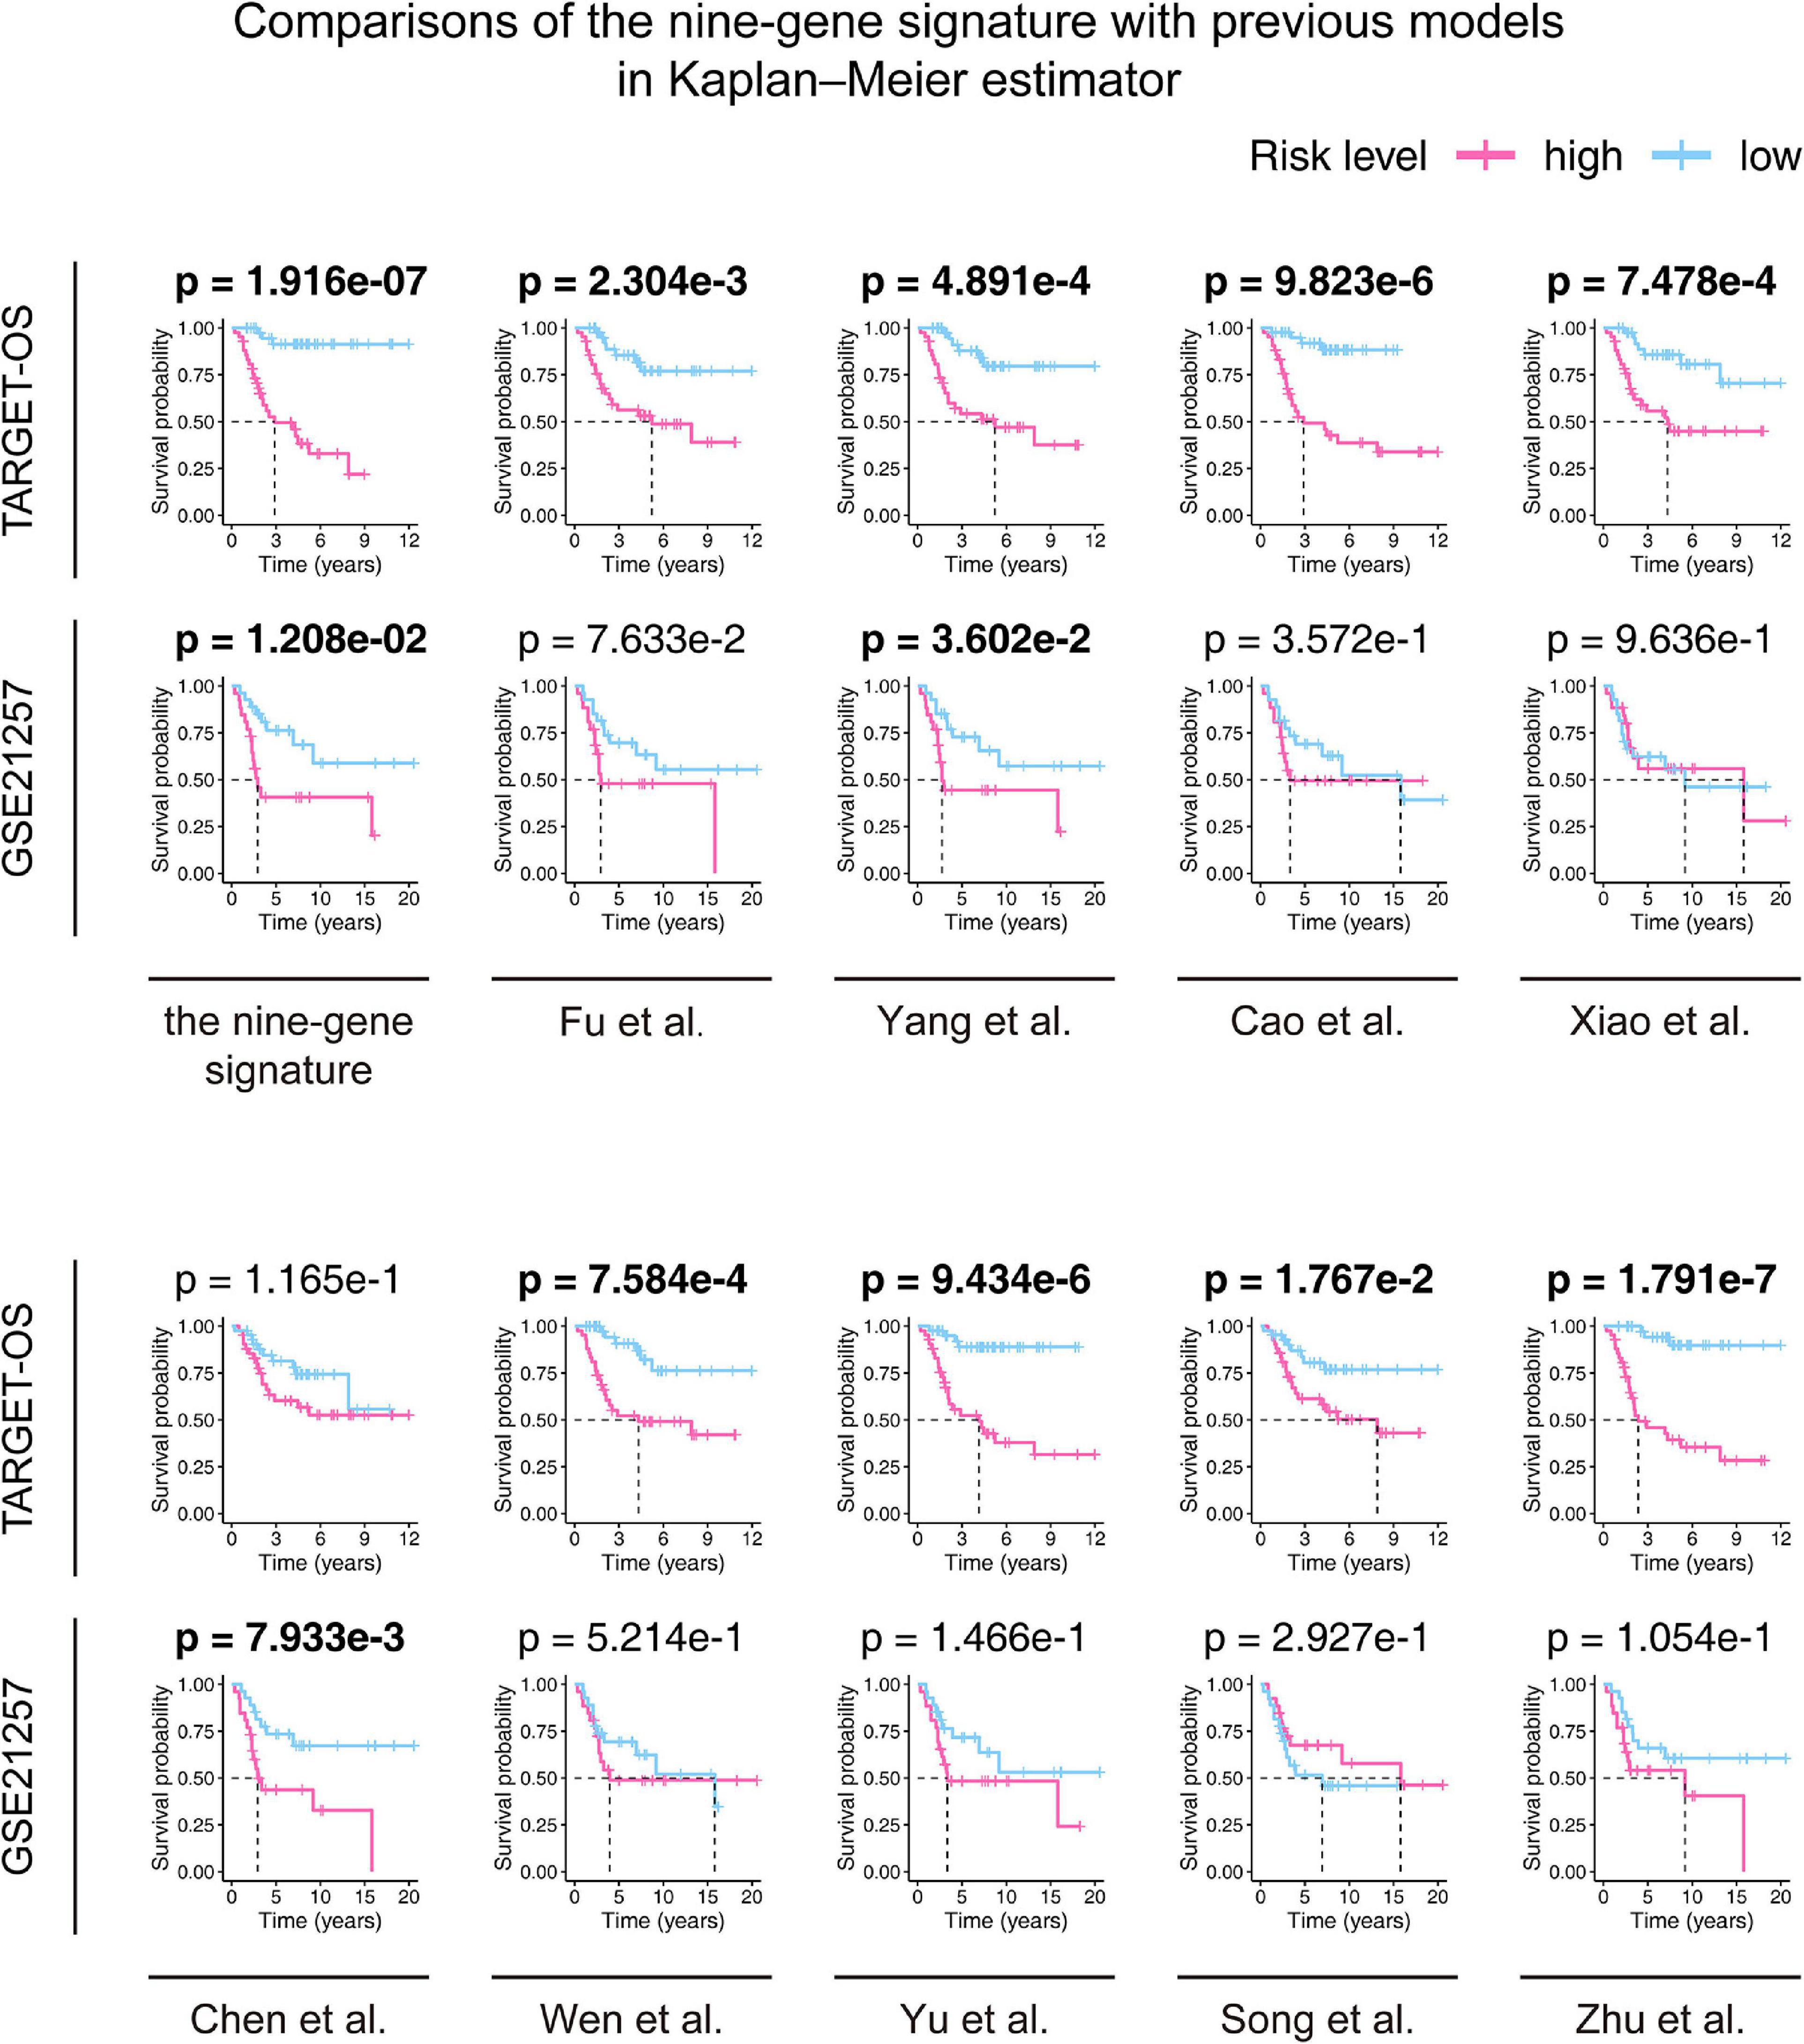
Figure 8. Comparisons between the nine-gene signature and previous studies conducted in the training and validation cohorts using the Kaplan–Meier estimator. The two-sided log-rank test measured the differences between the high- and low-risk groups. The bold p-value indicates<0.05, which is considered significant.
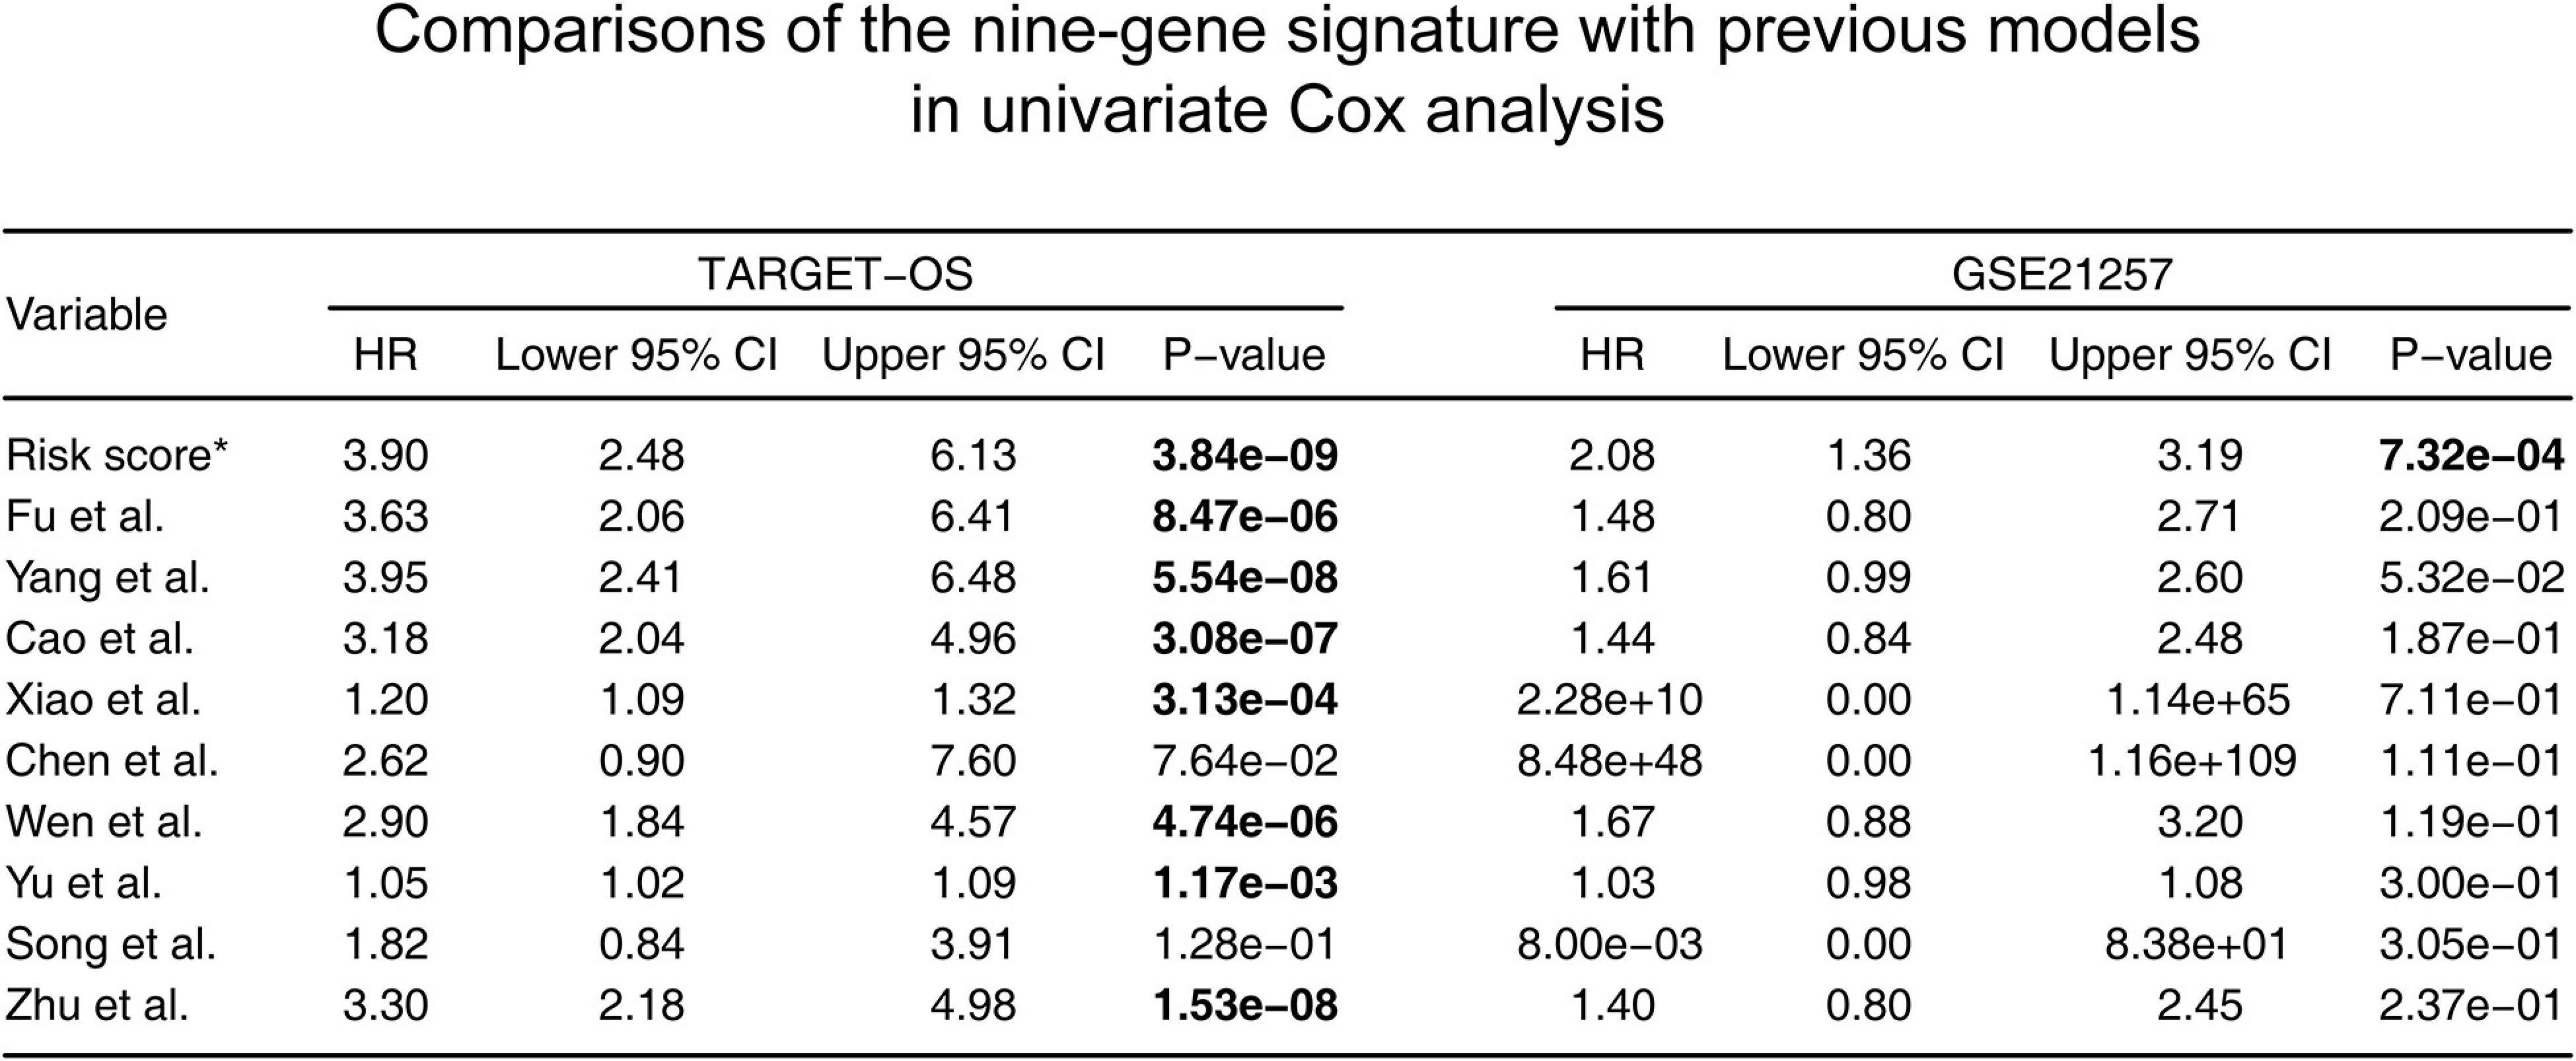
Figure 9. Comparisons between the nine-gene signature and previous studies conducted in the training and validation cohorts using the univariate Cox proportionalhazards model. HR, hazard ratio; CI, confidence interval. *: the nine-gene signature identified in this study; the bold p-value indicates that<0.05, which is considered significant.
For understanding the underlying molecular mechanisms of the signature, we performed GSEA comparing the high-risk group with the low-risk group in the TARGET-OS cohort. As displayed in Supplementary Figure 3, enriched gene sets were all detected in the low-risk group and were primarily involved in mechanisms related to transplant rejection, blood coagulation system, IL-6/JAK/STAT3 signaling axis, drug metabolism, inflammatory response, interferon response, apical junction complex, apical surface of epithelial cells, and innate immune system.
The annotation analysis indicated that the differences between the two groups were related to immunity, so we carried out analyses on 22 TICs to further study the interactions between the gene signature and the immune microenvironment. Firstly, the CIBERSORT algorithm was adopted to draw the 22 TIC profiles in preparation for the next analyses. Supplementary Figure 4 shows the overall view of the distribution of the 22 TICs and their inner association. The Wilcoxon rank-sum test (Figure 10A) found five kinds of TICs associated with the signature, and the Spearman coefficient (Figure 10B and Supplementary Table 3) discovered eight kinds of TICs having correlations with the risk score. We built a Venn diagram to visualize these results and found that there were five TICs (Figure 10C) showing significant relationships with the gene signature risk score, which included CD4 naïve T cells, CD8 T cells, activated mast cells, monocytes, and regulatory T cells (Tregs). Specifically, the risk score was positively correlated with CD4 T cells and activated mast cells and negatively correlated with the remaining.
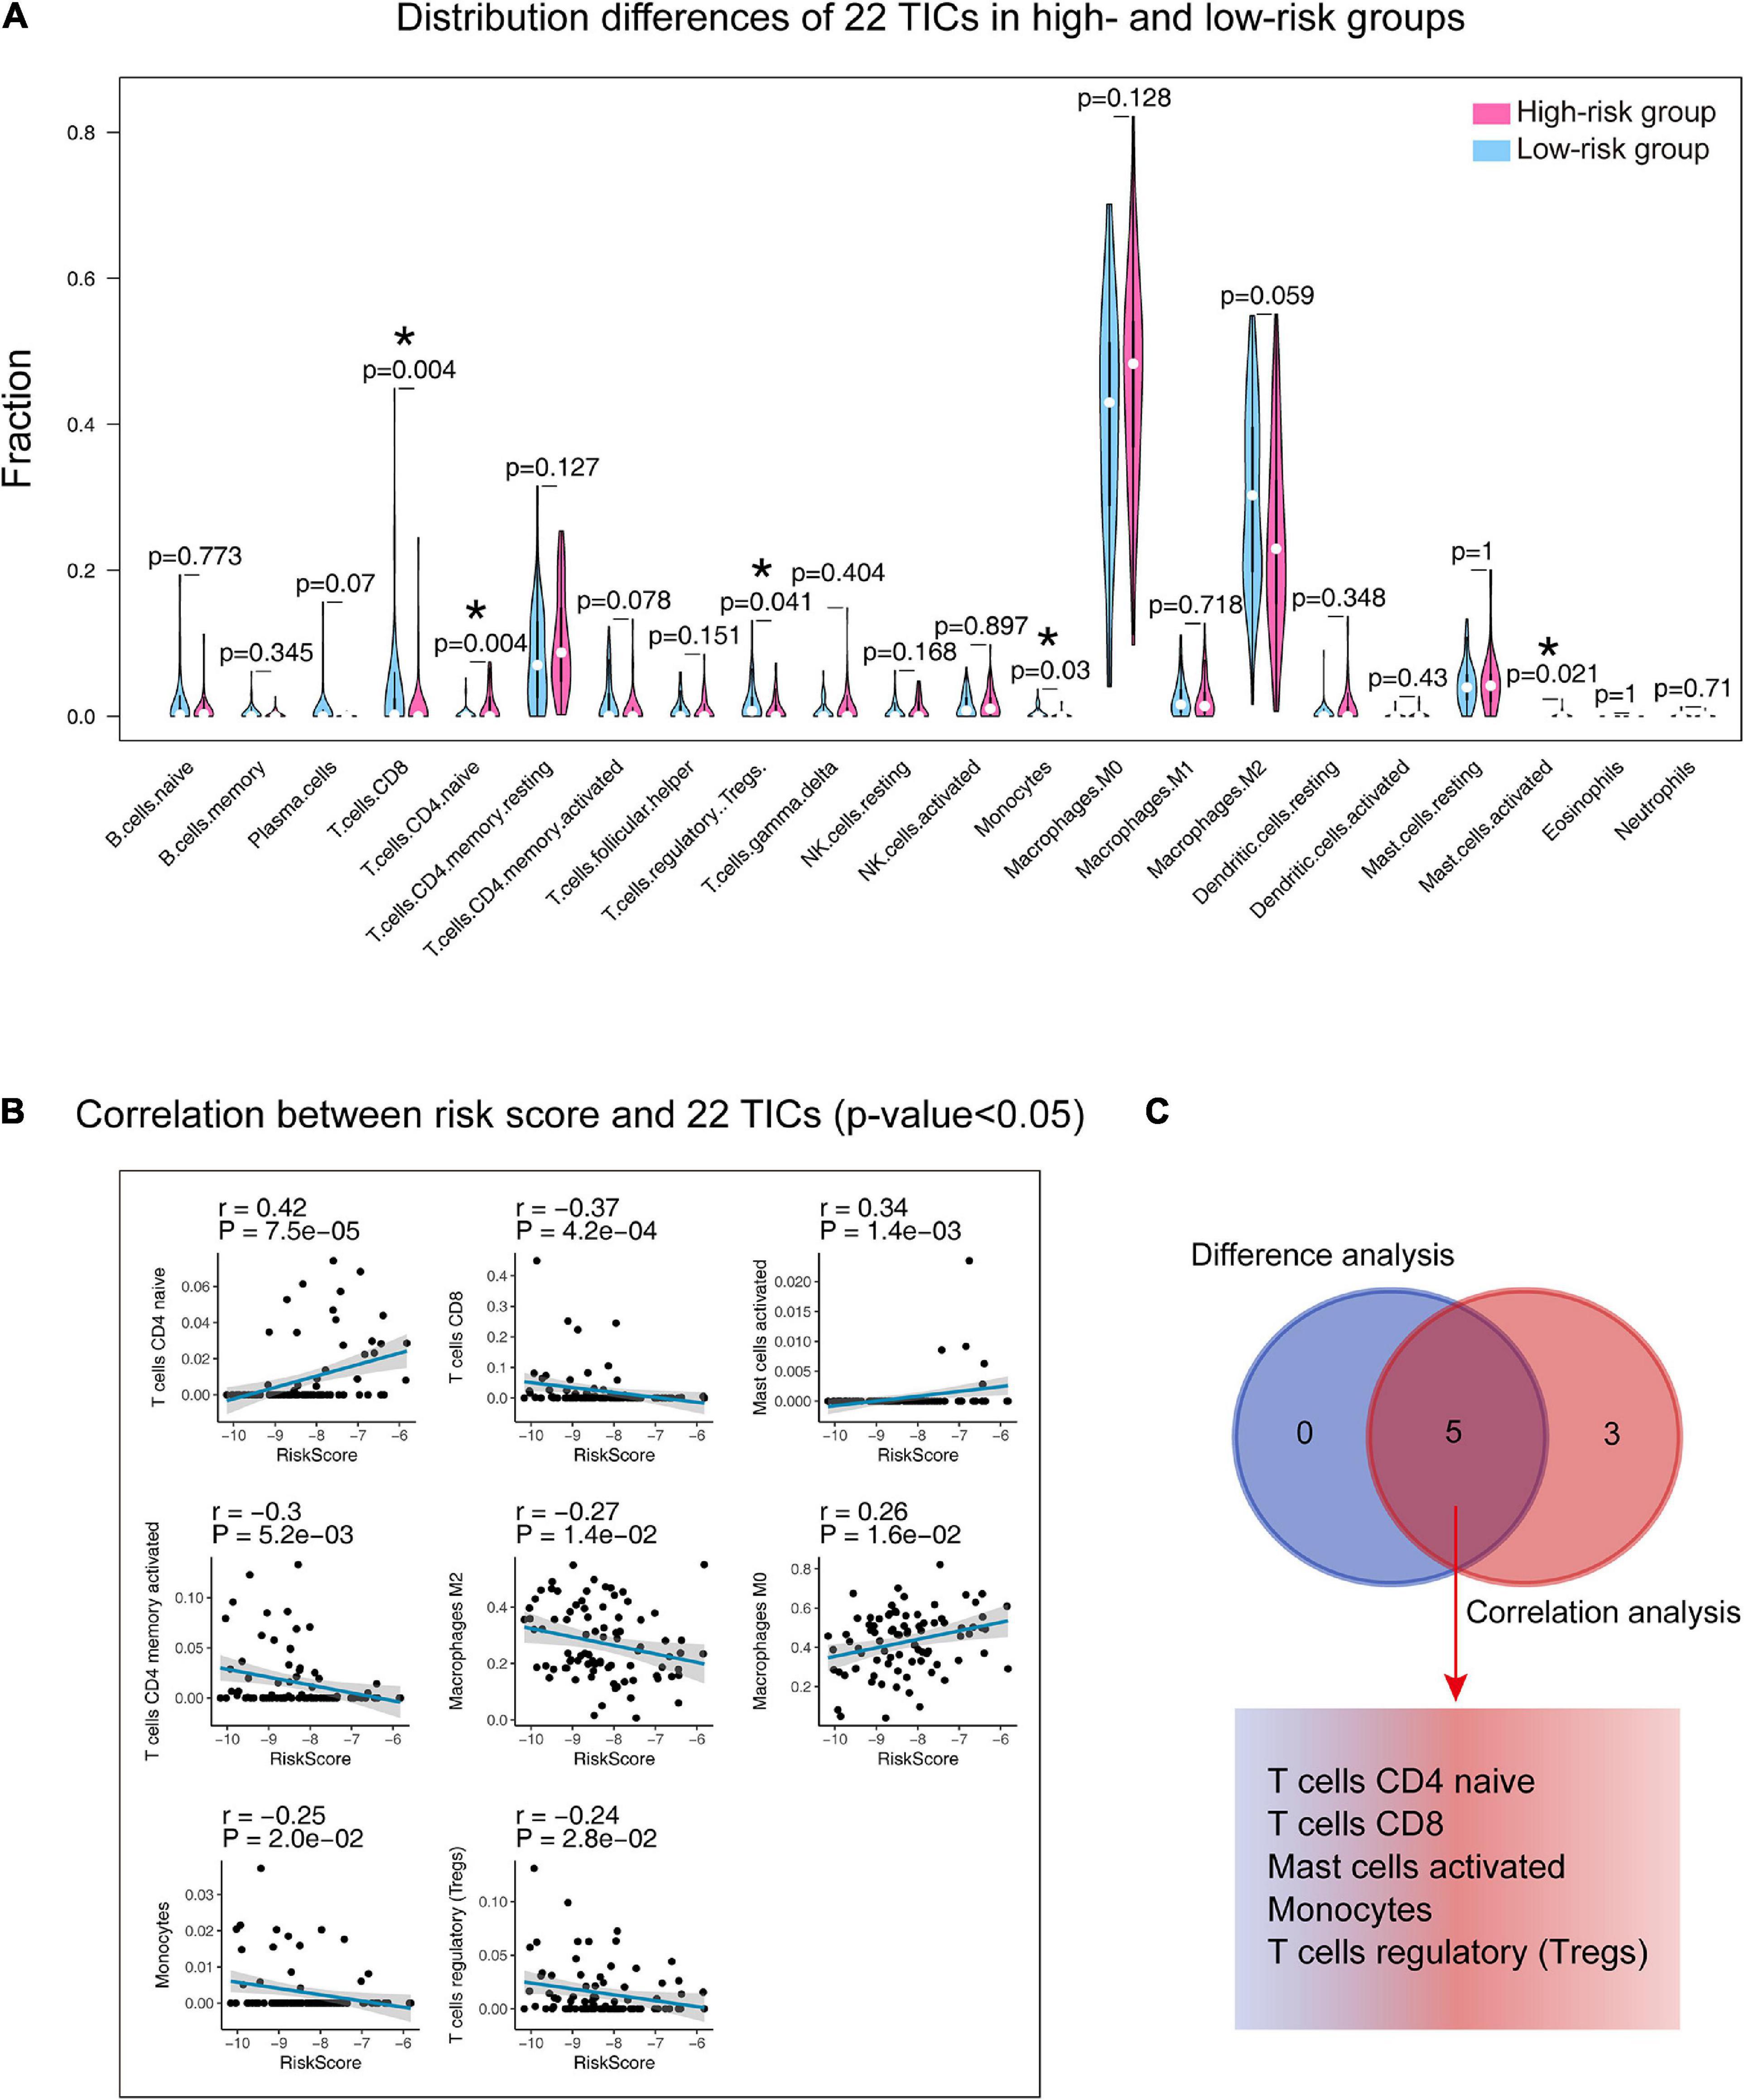
Figure 10. Integrating analysis for identifying the relationship between 22 TICs and the nine-gene signature. (A) Wilcoxon rank-sum was adopted to test the differences in each TIC distributed in the high- and low-risk groups. (B) The Spearman coefficient examines the correlation between each TIC and the nine-gene signature. Only correlations with p-value < 0.05 were plotted. The blue line displays the trend of the TIC and risk score. The shading besides the blue line characterizes the 95% CI. (C) Venn diagram integrating the results from (A) and (B). TIC: tumor-infiltrating immune cell; *: p-value < 0.05; CI: confidence interval; p-value < 0.05 was considered statistically significant.
We further tested the prognostic abilities of the 22 TICs by consulting the Kaplan-Meier estimator and Cox proportional hazards model. As we displayed the results in Figure 11A, the Cox models pointed that activated mast cells impacted OS outcomes not only in the univariate but also in the multivariate Cox regression. Additionally, the Kaplan–Meier estimator (Figure 11B and Supplementary Table 4) indicated that activated mast cells, CD4 T cells, and CD8 naïve T cellswere able to predict OS prognosis. Activated mast cells have potential prognostic ability in OS.
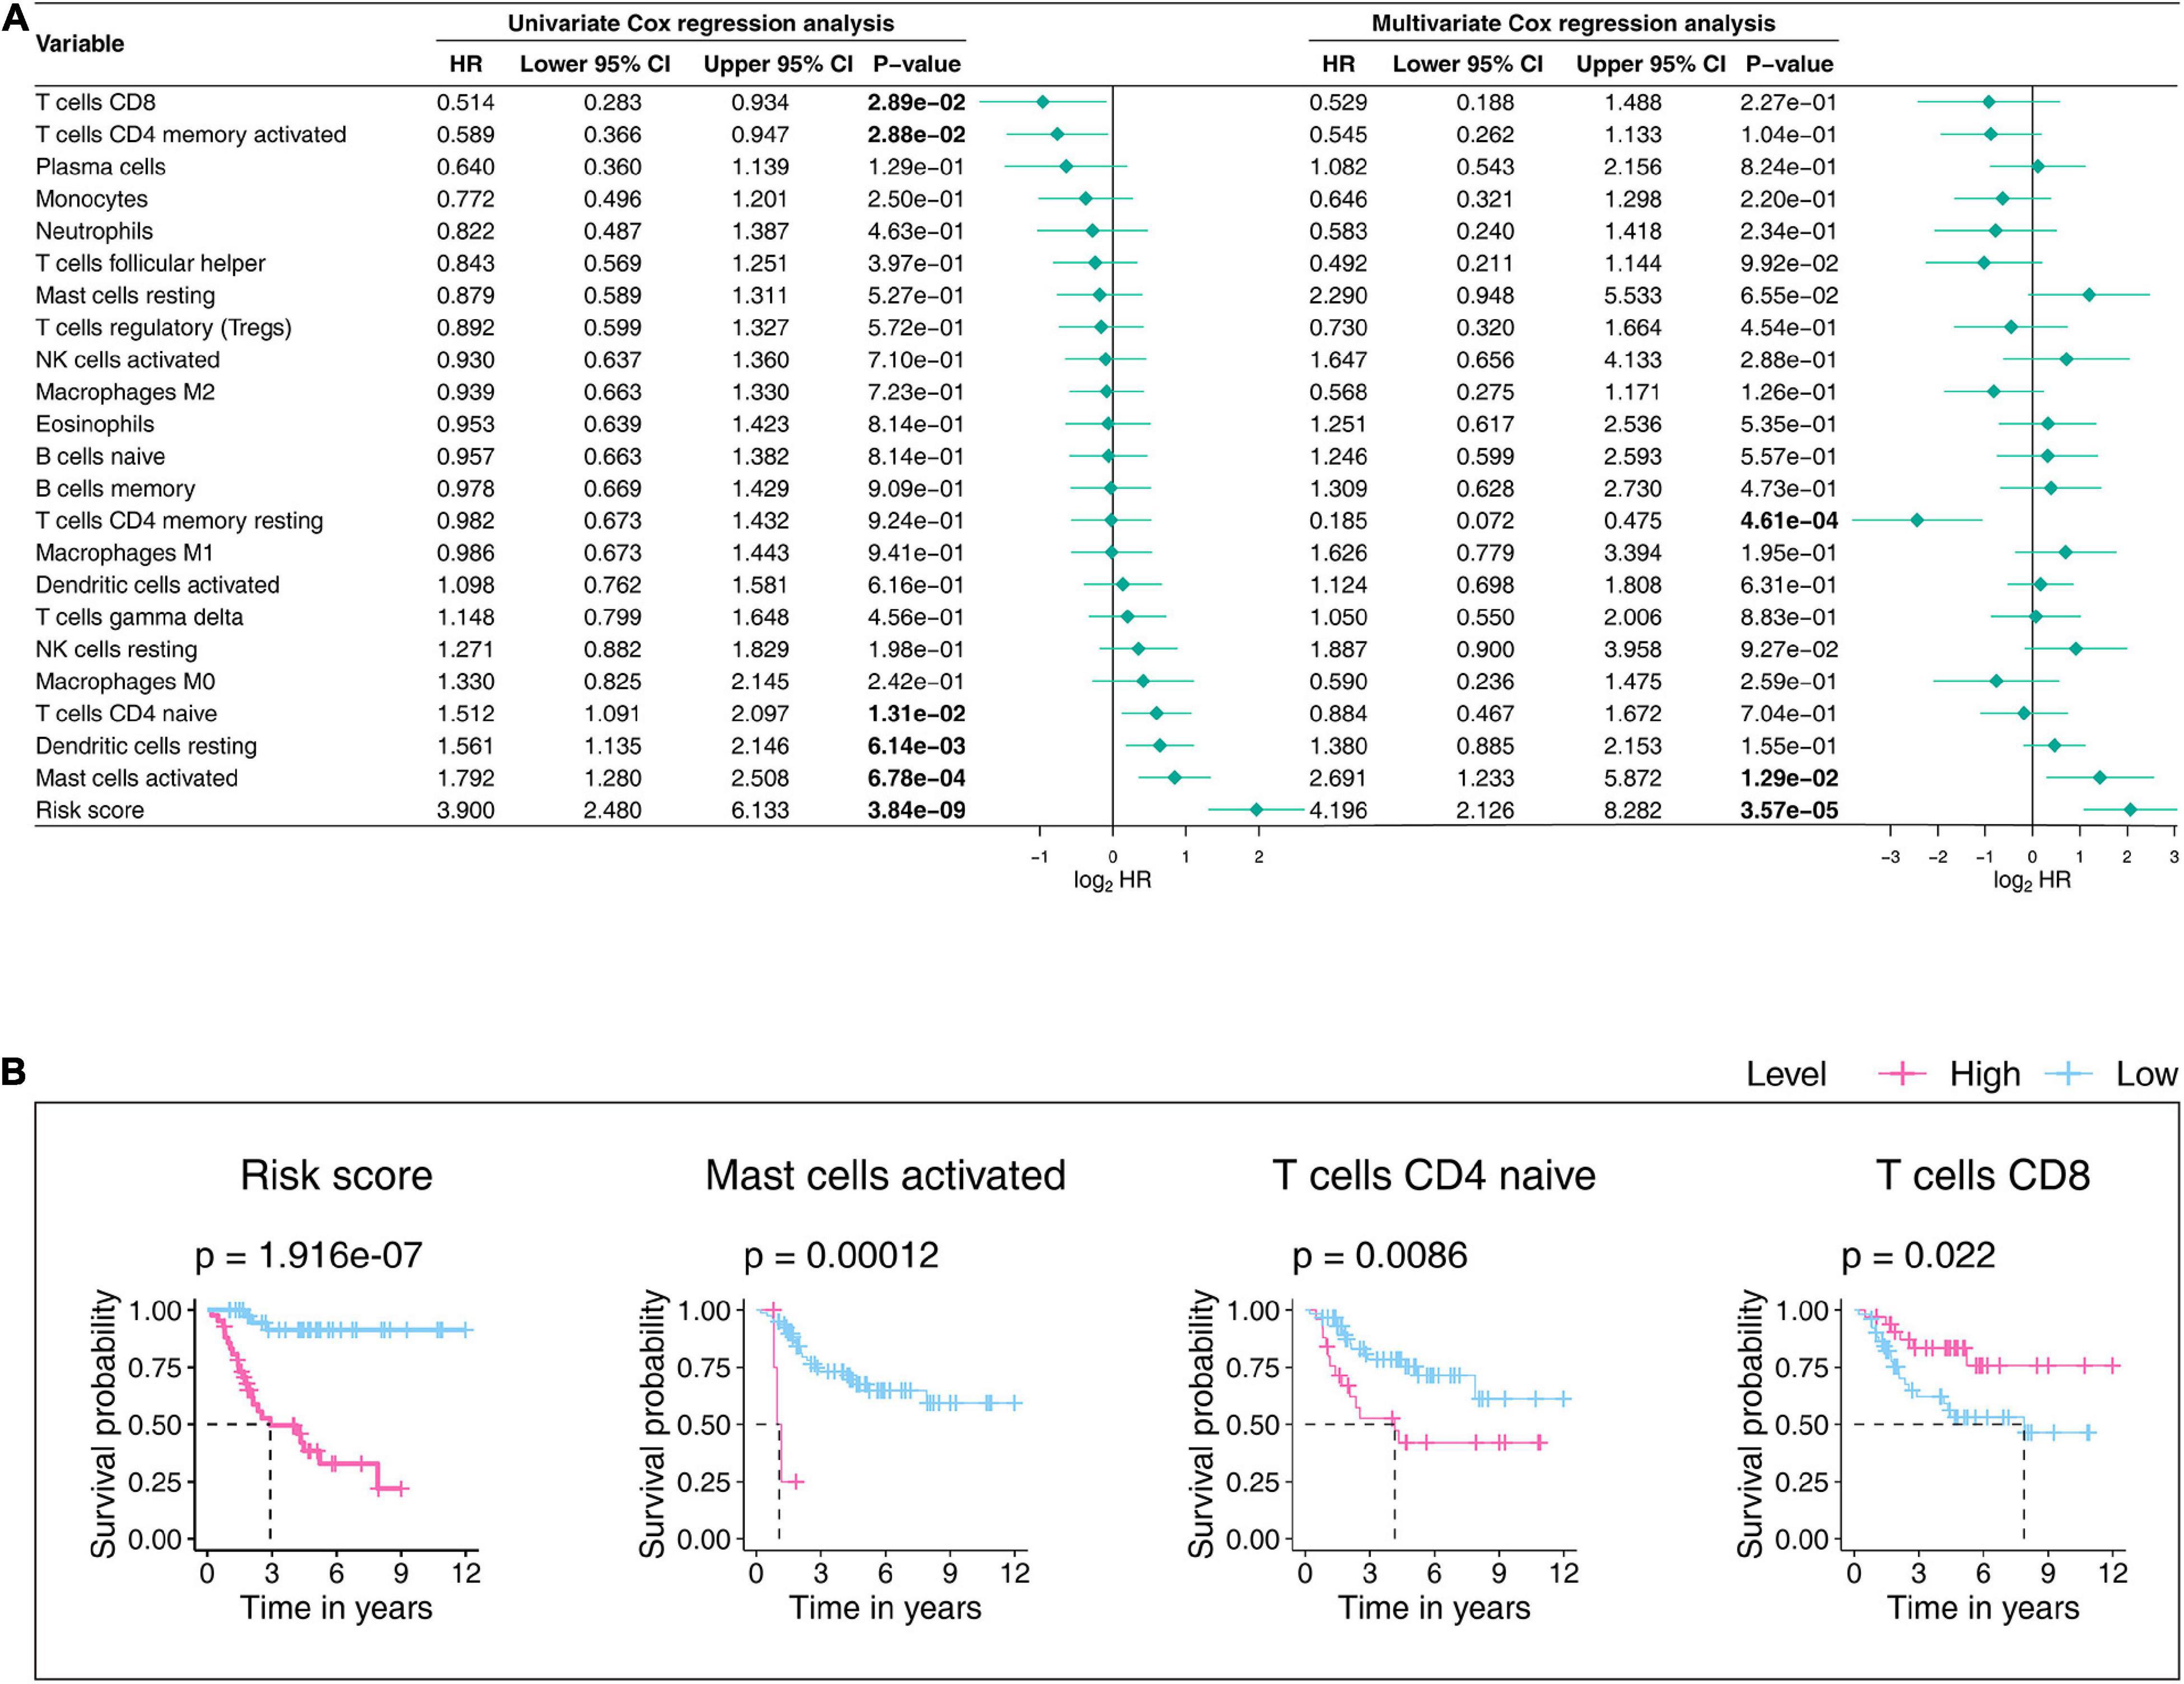
Figure 11. Univariateand multivariate Cox proportionalhazards models (A) and Kaplan–Meier estimators (B) evaluate the 22 TICs’prognostic ability. (A) The bold p-value indicates that<0.05. (B) In the established Kaplan–Meier estimators, we only selected those with a p-value less than 0.05 for display. A p-value < 0.05 was considered statistically significant; TIC, tumor-infiltrating immune cell.
Combining all the analysis results shown in this part, we noticed that activated mast cells not only are significantly related to the gene signature but also predict OS prognosis. Accordingly, the significant infiltration of activated mast cells mayplaykey roles in the prognostic ability of the nine-gene signature in OS patients.
In the present research, we found a novel nine-gene signature for OS prognosis from the comprehensive characterization of ICI profiles by mining the TARGET and GEO databases. After ICI clusters of the OS patients with survival differences in the training cohort were subtyped, DEGs were found. Kaplan–Meier analysis, univariate Cox analysis, and LASSO Cox regression analysis were applied to the DEGs, and a nine-gene signature was produced that was associatedwith the prognosis of OS patients.
We specially applied the nine-gene signature to the training and validation cohorts to the constructed Kaplan–Meier estimator, Cox proportional-hazards model, ROC curve, IAUC, and IBS and found significant statistical differences in these analyses, proving that this gene signature is effective and applicable for the OS prognosis prediction. In addition, comparisons with other discovered signatures were performed, which exhibited the superiority of our nine-gene signature. The immune infiltration results showed vital roles that activated mast cells may play that allows the nine-gene signature toinfluence the prognosis of OS. Compared with previous research, we are the first to adopt ICI profiles and use the LASSO method for model training and validate the model in an independent cohort. This work aimed to present future OS research with more hints.
The nine-gene signature that we found exhibited powerful prediction abilities not only in the TARGET-OS cohort but also in the independent validation cohort after being tested by a wide range of statistical approaches. The signature consisted of nine genes (Table 2), which were ZFP90, UHRF2, SELPLG, PLD3, PLCB4, IFNGR1, DLEU2, ATP6V1E1, and ANXA5. In our research, PLCB4, DLEU2, and UHRF2 unfavorably impacted OS prognosis, while the remaining factors exhibited protective effects (Supplementary Figure 2). PLCB4 encodes the β4 isoform of PLC isoenzymes, a superfamily that adjusts the metabolism of inositol lipids (Wu et al., 2019). Boosted expression of PLCB4 is correlated with a decrease in survival rates in patients with solid tumors, including mesothelioma, melanoma, and gastrointestinal tumors (Wu et al., 2019). However, there is still no research to reveal the mechanism of PLCB4 in the occurrence and development of OS. LncRNA DLEU2 is a cancer-related lncRNA thatregulates tumor progression in a variety of cancers (Liu W. et al., 2020). Compared with that in normal tissues, DLEU2 displaysan upregulated expression in pancreatic cancer tissues (Liu W. et al., 2020). Liu et al. reported that DLEU2 is highly expressed in OS and revealed that DLEU2 overexpression helps in the migration and proliferation of OS cells (Liu W. et al., 2020). They found that DLEU2 promotes the expansion of OS cells by sponging miR-337-3p and couldcontrol the expression of JAK2, thus participating in the progression of OS (Liu W. et al., 2020). UHRF1 is a well-known epigenetic regulator. A significant overexpression of UHRF1has been detected in several kinds of cancers (Liu W. et al., 2016). Liu et al. reported that UHRF1 promotes the proliferation of human OS cells and increases the invasiveness of human OS cells by downregulating the expression of E-cadherin and increasing EMT in an Rb1-dependent manner (Liu W. et al., 2016).
Recently, with the widespread application of bioinformatics, we can mine for possible gene signatures associated with OS prognosis from the publicly available TARGET and GEO databases. In addition, more and more studies are involved. For example, in the nine studies (Cao et al., 2020; Chen Z. et al., 2020; Song et al., 2020; Wen et al., 2020; Xiao et al., 2020; Yu et al., 2020; Zhu et al., 2020; Fu et al., 2021; Yang et al., 2021) we included in the study based on the inclusion criteria, they all looked for potential survival-related OS gene signatures from public datasets. However, after we validated them in the training and validation cohorts, we found that the nine-gene signature we generated was superior to others in predicting OS prognosis. Among the nine studies, the one by Yang et al. (2021)revealed a gene signature that closely resembled ours. Yang et al. first filtered genes through GSEAand then established a three-gene signature prognostic model, which they claimed can accurately predict the prognosis of OS. However, in our validation, although the three-gene signature’s ability was similar to ours in Kaplan–Meier analysis, it could not show stable prognostic capacity via Cox regression analysis (Yang et al., 2021).
Gene Set Enrichment Analysis (GSEA) of the HALLMARK collection found that the IL-6/JAK/STAT3 signaling axis plays a key role in gene signature functioning. The IL-6/JAK/STAT3 pathway is important to the growth and advancement of many human cancers (Johnson et al., 2018). IL-6 produced in the TME activates the JAK/STAT3 signaling pathway, favoring tumor growth and metastasis (Wang et al., 2019). IL-6 has been identified as a primary mediator of lung tropism in OS and suggests pleiotropic, redundant mechanisms that might affect metastasis (Gross et al., 2018). The JAK/STAT3 signaling pathway has been demonstrated to be a target to inhibit the growth and metastasis of osteosarcoma (Wang et al., 2019). Upstream kinase signals trigger the STAT3 signal cascade (Lee et al., 2019). It undergoes phosphorylation, homodimerization, translocation into the nucleus, and binding to DNA, leading to the expression of target genes involved in tumor cell proliferation, angiogenesis, metastasis, and immune editing (Lee et al., 2019). There is evidence that dysregulated STAT3 plays a carcinogenic role in OS by promoting processes including cell transformation, tumor growth, invasion, metastasis, chemotherapy resistance, and immune evasion (Liu Y. et al., 2021). STAT3 inhibitors may directly or indirectly downregulate the expression of target genes involved in OS (Liu Y. et al., 2021). Liu and colleagues reported that STAT3 is a potential target for the treatment of OS and may be effective for the treatment of OS (Liu Y. et al., 2021). Further study is needed to develop more about the connections between IL-6/JAK/STAT3 signaling and the signature we found and the therapeutic approach targeting the IL-6/JAK/STAT3 pathway.
In addition, based on the CIBERSORT algorithm and survival analysis, we revealed that activated mast cells have clear correlations with the gene signature and strong prognostic abilities as well, indicating that the infiltration of these cells may play a key role in the predictive ability of the gene signature. Mast cells can elevate tumor expansion by inducing angiogenesis and promote tissue remodeling by inducing changes in the composition of the extracellular matrix, and they can also promote pro-inflammatory pathways that can lead to impaired tumor progression (Maciel et al., 2015). Mast cells have also been shown to influence the extent of the dendritic cells, tumor-associated macrophages, and lymphocyte infiltrate through the release of mediators, enhancing the migration and proliferation of these cells (Inagaki et al., 2016). Activated mast cells can enhance the tissue homeostasis of TME disorders and facilitate the growth and spread of tumors (Oldford and Marshall, 2015). Studies have confirmed that some mechanisms triggered by mast cells can affect the OS homeostasis, impacting the occurrence and development of OS (Campillo-Navarro et al., 2014; Maciel et al., 2015; Inagaki et al., 2016). Our research shows that activated mast cells can potentially target the gene signature in OS therapy, which suggests that we should make more effort to these immune cells in future study.
This research has certain limitations. Our nine-gene signature was produced from retrospective data. Its clinical adaptability should be further confirmed by more prospective data. In addition, although we have confirmed that the nine-gene signature is superior to previous findings, there is still no wet-lab experiment data backing up these 9 genes’ prognostic abilities and their roles in the immune infiltration. Accordingly, further study is needed to uncover the relationships between the nine-gene signature and OS progression.
The present study defined a novel, robust nine-gene signature from OS ICI characteristics. The signature was closely associated with OS prognosis and can acutely determine the risk score of OS patients. In addition, we determined the signature’s stability and wide applicability by applying it to one independent validation cohort and proved that our signature is superior to previous signatures. We identified the vital role of activated mast cells in the signature’s prognostic ability. Our efforts may advance the unearthing of OS treatment approaches.
Publicly available datasets were analyzed in this study. This data can be found here: The following publicly available datasets were used in this study: TARGET-OS: https://ocg.cancer.gov/programs/target/projects/osteosarcoma; GSE21257: https://www.ncbi.nlm.nih.gov/geo/query/acc.cgi?acc=GSE21257.
LF and CM organized and wrote the manuscript. JR produced the figures and visualized the data. TL revised the manuscript. All authors reviewed the manuscript and approved the manuscript for publication.
The authors declare that the research was conducted in the absence of any commercial or financial relationships that could be construed as a potential conflict of interest.
All claims expressed in this article are solely those of the authors and do not necessarily represent those of their affiliated organizations, or those of the publisher, the editors and the reviewers. Any product that may be evaluated in this article, or claim that may be made by its manufacturer, is not guaranteed or endorsed by the publisher.
CM thanks the China Scholarship Council (No. 201708410121). CM thanks the Zhengzhou University Overseas Virtual Research Institute. We acknowledge support from the German Research Foundation (DFG) and the Open Access Publication Fund of Charité – Universitätsmedizin Berlin.
The Supplementary Material for this article can be found online at: https://www.frontiersin.org/articles/10.3389/fcell.2021.718624/full#supplementary-material
Supplementary Figure 1 | Consensus clustering for tumor-infiltrating immune cells. Consensus matrixes of the samples in the training cohort for each k (k = 2–5), displaying the clustering stability using 1000 iterations of hierarchical clustering.
Supplementary Figure 2 | The prognostic prediction ability of each gene in the nine-gene signature tested using the Kaplan–Meier estimator in the training (A) and validation (B) cohorts. The two-sided log-rank test measured the differences between the high and low expression level groups. P-value < 0.05 was considered as significantly.
Supplementary Figure 3 | GSEA conducted using HALLMARK collection. GSEA: Gene Set Enrichment Analysis; NES: Normalized Enrichment Score; NOM: Nominal; FDR: False Discovery Rate; A gene set with | NES | > 1, NOM p-value < 0.05, and FDR q-value < 0.25 was considered significantly enriched.
Supplementary Figure 4 | Profiles and correlation analysis of the 22 TICs in OS tumor samples of the training cohort. (A) The distribution of 22 TICs in high- and low-risk OS patients in the training cohort, which are displayed in the form of bar plots. (B) The inner correlations between 22 TICs, which are shown in the form of a heatmap and performed via the Pearson coefficient. P-value < 0.05 was considered as significantly. TIC: tumor-infiltrating immune cell; OS: osteosarcoma.
Supplementary Table 1 | Differentially expressed genes identified between two ICI clusters (p-value < 0.05 and log2| fold-change| > 0.2).
Supplementary Table 2 | Potential prognostic genes identified in the training cohort (p-value < 0.05).
Supplementary Table 3 | Correlations that determined between the nine-gene signature and the 22 TICs by the Spearman coefficient.
Supplementary Table 4 | The prognostic ability of 22 TICs tested by the Kaplan-Meier estimator.
Buddingh, E. P., Kuijjer, M. L., Duim, R. A., Bürger, H., Agelopoulos, K., Myklebost, O., et al. (2011). Tumor-infiltrating macrophages are associated with metastasis suppression in high-grade osteosarcoma: a rationale for treatment with macrophage activating agents. Clin. Cancer Res. 17, 2110–2119. doi: 10.1158/1078-0432.ccr-10-2047
Campillo-Navarro, M., Chavez-Blanco, A. D., Wong-Baeza, I., Serafín-López, J., Flores-Mejía, R., Estrada-Parra, S., et al. (2014). Mast cells in lung homeostasis: beyond type I hypersensitivity. Curr. Respir. Med. Rev. 10, 115–123. doi: 10.2174/1573398x10666141024220151
Cao, M., Zhang, J., Xu, H., Lin, Z., Chang, H., Wang, Y., et al. (2020). Identification and development of a novel 4-gene immune-related signature to predict osteosarcoma prognosis. Front. Mol. Biosci. 7:608368.
Chen, Y., Zhao, B., and Wang, X. (2020). Tumor infiltrating immune cells (TIICs) as a biomarker for prognosis benefits in patients with osteosarcoma. BMC Cancer20:1022.
Chen, Z., Huang, H., Wang, Y., Zhan, F., and Quan, Z. (2020). Identification of immune-related genes MSR1 and TLR7 in relation to macrophage and Type-2 T-helper cells in osteosarcoma tumor micro-environments as anti-metastasis signatures. Front. Mol. Biosci. 7:576298.
Corre, I., Verrecchia, F., Crenn, V., Redini, F., and Trichet, V. (2020). The osteosarcoma microenvironment: a complex but targetable ecosystem. Cells9, 976. doi: 10.3390/cells9040976
Cortini, M., Massa, A., Avnet, S., Bonuccelli, G., and Baldini, N. (2016). Tumor-activated mesenchymal stromal cells promote osteosarcoma stemness and migratory potential via IL-6 secretion. PLoS One11:e0166500. doi: 10.1371/journal.pone.0166500
Friedman, J., Hastie, T., and Tibshirani, R. (2010). Regularization paths for generalized linear models via coordinate descent. J. Stat. Softw. 33, 1–22.
Fu, Y., Bao, Q., Liu, Z., He, G., Wen, J., Liu, Q., et al. (2021). Development and validation of a hypoxia-associated prognostic signature related to osteosarcoma metastasis and immune infiltration. Front. Cell Dev. Biol. 9:633607.
Gao, L., Lin, P., Chen, P., Gao, R. Z., Yang, H., He, Y., et al. (2020). A novel risk signature that combines 10 long noncoding RNAs to predict neuroblastoma prognosis. J. Cell Physiol. 235, 3823–3834. doi: 10.1002/jcp.29277
Goeman, J. J. (2010). L1 penalized estimation in the Cox proportional hazards model. Biomed. J. 52, 70–84.
Gross, A. C., Cam, H., Phelps, D. A., Saraf, A. J., Bid, H. K., Cam, M., et al. (2018). IL-6 and CXCL8 mediate osteosarcoma-lung interactions critical to metastasis. JCI Insight3:e99791.
Inagaki, Y., Hookway, E., Williams, K. A., Hassan, A. B., Oppermann, U., Tanaka, Y., et al. (2016). Dendritic and mast cell involvement in the inflammatory response to primary malignant bone tumours. Clin. Sarcoma Res. 6:13.
Johnson, D. E., O’Keefe, R. A., and Grandis, J. R. (2018). Targeting the IL-6/JAK/STAT3 signalling axis in cancer. Nat. Rev. Clin. Oncol. 15, 234–248. doi: 10.1038/nrclinonc.2018.8
Kamarudin, A. N., Cox, T., and Kolamunnage-Dona, R. (2017). Time-dependent ROC curve analysis in medical research: current methods and applications. BMC Med. Res. Methodol. 17:53.
Kronek, L. P., and Reddy, A. (2008). Logical analysis of survival data: prognostic survival models by detecting high-degree interactions in right-censored data. Bioinformatics24, i248–i253.
Lee, H., Jeong, A. J., and Ye, S. K. (2019). Highlighted STAT3 as a potential drug target for cancer therapy. BMB Rep. 52, 415–423. doi: 10.5483/bmbrep.2019.52.7.152
Li, L. Q., Zhang, L. H., Yuan, Y. B., Lu, X. C., Zhang, Y., Liu, Y. K., et al. (2021). Signature based on metabolic-related gene pairs can predict overall survival of osteosarcoma patients. Cancer Med. 10, 4493–4509. doi: 10.1002/cam4.3984
Liu, W., Liu, P. C., Ma, K., Wang, Y. Y., Chi, Q. B., and Yan, M. (2020). LncRNA DLEU2 promotes tumour growth by sponging miR-337-3p in human osteosarcoma. Cell Biochem. Funct. 38, 886–894. doi: 10.1002/cbf.3509
Liu, W., Qiao, R. H., Wang, D. M., Huang, X. W., Li, B., and Wang, D. (2016). UHRF1 promotes human osteosarcoma cell invasion by downregulating the expression of Ecadherin in an Rb1dependent manner. Mol. Med. Rep. 13, 315–320. doi: 10.3892/mmr.2015.4515
Liu, Y., Liao, S., Bennett, S., Tang, H., Song, D., Wood, D., et al. (2021). STAT3 and its targeting inhibitors in osteosarcoma. Cell Prolif. 54:e12974.
Luo, Z. W., Liu, P. P., Wang, Z. X., Chen, C. Y., and Xie, H. (2020). Macrophages in osteosarcoma immune microenvironment: implications for immunotherapy. Front. Oncol. 10:586580.
Ma, C., Luo, H., Cao, J., Zheng, X., Zhang, J., Zhang, Y., et al. (2020). Identification of a novel tumor microenvironment-associated eight-gene signature for prognosis prediction in lung adenocarcinoma. Front. Mol. Biosci. 7:571641.
Maciel, T. T., Moura, I. C., and Hermine, O. (2015). The role of mast cells in cancers. F1000Prime Rep. 7:09.
Newman, A. M., Liu, C. L., Green, M. R., Gentles, A. J., Feng, W., Xu, Y., et al. (2015). Robust enumeration of cell subsets from tissue expression profiles. Nat. Methods12, 453–457. doi: 10.1038/nmeth.3337
Newman, A. M., Steen, C. B., Liu, C. L., Gentles, A. J., Chaudhuri, A. A., Scherer, F., et al. (2019). Determining cell type abundance and expression from bulk tissues with digital cytometry. Nat. Biotechnol. 37, 773–782. doi: 10.1038/s41587-019-0114-2
Oldford, S. A., and Marshall, J. S. (2015). Mast cells as targets for immunotherapy of solid tumors. Mol Immunol. 63, 113–124. doi: 10.1016/j.molimm.2014.02.020
Ritchie, M. E., Phipson, B., Wu, D., Hu, Y., Law, C. W., Shi, W., et al. (2015). limma powers differential expression analyses for RNA-sequencing and microarray studies. Nucleic Acids Res. 43:e47. doi: 10.1093/nar/gkv007
Sauerbrei, W., Royston, P., and Binder, H. (2007). Selection of important variables and determination of functional form for continuous predictors in multivariable model building. Stat. Med. 26, 5512–5528. doi: 10.1002/sim.3148
Song, Y. J., Xu, Y., Zhu, X., Fu, J., Deng, C., Chen, H., et al. (2020). Immune landscape of the tumor microenvironment identifies prognostic gene signature CD4/CD68/CSF1R in osteosarcoma. Front. Oncol. 10:1198.
Subramanian, A., Tamayo, P., Mootha, V. K., Mukherjee, S., Ebert, B. L., Gillette, M. A., et al. (2005). Gene set enrichment analysis: a knowledge-based approach for interpreting genome-wide expression profiles. Proc. Natl. Acad. Sci. U.S.A. 102, 15545–15550. doi: 10.1073/pnas.0506580102
Thorsson, V., Gibbs, D. L., Brown, S. D., Wolf, D., Bortone, D. S., Ou Yang, T. H., et al. (2018). The immune landscape of cancer. Immunity48, 812–830 e14.
Tibshirani, R. (1997). The lasso method for variable selection in the Cox model. Stat. Med. 16, 385–395. doi: 10.1002/(sici)1097-0258(19970228)16:4<385::aid-sim380>3.0.co;2-3
Wang, W., Li, J., Ding, Z., Li, Y., Wang, J., Chen, S., et al. (2019). Tanshinone I inhibits the growth and metastasis of osteosarcoma via suppressing JAK/STAT3 signalling pathway. J. Cell Mol. Med. 23, 6454–6465. doi: 10.1111/jcmm.14539
Wen, C., Wang, H., Wang, H., Mo, H., Zhong, W., Tang, J., et al. (2020). A three-gene signature based on tumour microenvironment predicts overall survival of osteosarcoma in adolescents and young adults. Aging (Albany NY)13, 619–645. doi: 10.18632/aging.202170
Wu, S., Zhang, W., Shen, D., Lu, J., and Zhao, L. (2019). PLCB4 upregulation is associated with unfavorable prognosis in pediatric acute myeloid leukemia. Oncol. Lett. 18, 6057–6065.
Xiao, B., Liu, L., Li, A., Xiang, C., Wang, P., Li, H., et al. (2020). Identification and verification of immune-related gene prognostic signature based on ssGSEA for osteosarcoma. Front. Oncol. 10:607622.
Yang, M., Ma, X., Wang, Z., Zhang, T., Hua, Y., and Cai, Z. (2021). Identification of a novel glycolysis-related gene signature for predicting the prognosis of osteosarcoma patients. Aging (Albany NY)13, 12896–12918. doi: 10.18632/aging.202958
Yiqi, Z., Ziyun, L., Qin, F., Xingli, W., and Liyu, Y. (2020). Identification of 9-gene epithelial-mesenchymal transition related signature of osteosarcoma by integrating multi cohorts. Technol. Cancer Res. Treat. 19:1533033820980769.
Yoshihara, K., Shahmoradgoli, M., Martinez, E., Vegesna, R., Kim, H., Torres-Garcia, W., et al. (2013). Inferring tumour purity and stromal and immune cell admixture from expression data. Nat. Commun. 4:2612.
Yu, Y., Zhang, H., Ren, T., Huang, Y., Liang, X., Wang, W., et al. (2020). Development of a prognostic gene signature based on an immunogenomic infiltration analysis of osteosarcoma. J. Cell Mol. Med. 24, 11230–11242. doi: 10.1111/jcmm.15687
Zhang, F., Zeng, L., Cai, Q., Xu, Z., Liu, R., Zhong, H., et al. (2020). Comprehensive analysis of a long noncoding rna-associated competing endogenous RNA network in wilms tumor. Cancer Control. 27:1073274820936991.
Zhang, H., Guo, L., Zhang, Z., Sun, Y., Kang, H., Song, C., et al. (2019). Co-expression network analysis identified gene signatures in osteosarcoma as a predictive tool for lung metastasis and survival. J. Cancer10, 3706–3716. doi: 10.7150/jca.32092
Zhang, X., Shi, M., Chen, T., and Zhang, B. (2020). Characterization of the immune cell infiltration landscape in head and neck squamous cell carcinoma to aid immunotherapy. Mol. Ther. Nucleic Acids22, 298–309. doi: 10.1016/j.omtn.2020.08.030
Keywords: osteosarcoma, immune cell infiltration, ICI, tumor microenvironment, gene signature
Citation: Fan L, Ru J, Liu T and Ma C (2021) Identification of a Novel Prognostic Gene Signature From the Immune Cell Infiltration Landscape of Osteosarcoma. Front. Cell Dev. Biol. 9:718624. doi: 10.3389/fcell.2021.718624
Received: 01 June 2021; Accepted: 09 August 2021;
Published: 06 September 2021.
Edited by:
Santos Mañes, Consejo Superior de Investigaciones Científicas (CSIC), SpainReviewed by:
Amei Amei, University of Nevada, Las Vegas, United StatesCopyright © 2021 Fan, Ru, Liu and Ma. This is an open-access article distributed under the terms of the Creative Commons Attribution License (CC BY). The use, distribution or reproduction in other forums is permitted, provided the original author(s) and the copyright owner(s) are credited and that the original publication in this journal is cited, in accordance with accepted academic practice. No use, distribution or reproduction is permitted which does not comply with these terms.
*Correspondence: Tao Liu, dGFvbGl1MDA1NUBzaW5hLmNvbQ==; Chao Ma, Y2hhby5tYUBjaGFyaXRlLmRl
†ORCID: Chao Ma, orcid.org/0000-0003-1444-4668
‡These authors have contributed equally to this work
Disclaimer: All claims expressed in this article are solely those of the authors and do not necessarily represent those of their affiliated organizations, or those of the publisher, the editors and the reviewers. Any product that may be evaluated in this article or claim that may be made by its manufacturer is not guaranteed or endorsed by the publisher.
Research integrity at Frontiers
Learn more about the work of our research integrity team to safeguard the quality of each article we publish.