
95% of researchers rate our articles as excellent or good
Learn more about the work of our research integrity team to safeguard the quality of each article we publish.
Find out more
ORIGINAL RESEARCH article
Front. Cell Dev. Biol. , 26 August 2021
Sec. Molecular and Cellular Pathology
Volume 9 - 2021 | https://doi.org/10.3389/fcell.2021.710461
This article is part of the Research Topic Tumor Microenvironment in Cancer Hallmarks and Therapeutics View all 57 articles
 Yuqi Han1,2†
 Lingling Zhang3†
 Shuzi Niu4
 Shuguang Chen5Bo Yang6
 Hongyan Chen3
 Fei Zheng3
 Yuying Zang3Hongbo Zhang7*
 Yu Xin8*
 Xuzhu Chen3*
Background: Differentiation between cerebral glioblastoma multiforme (GBM) and solitary brain metastasis (MET) is important. The existing radiomic differentiation method ignores the clinical and routine magnetic resonance imaging (MRI) features.
Purpose: To differentiate between GBM and MET and between METs from the lungs (MET-lung) and other sites (MET-other) through clinical and routine MRI, and radiomics analyses.
Methods and Materials: A total of 350 patients were collected from two institutions, including 182 patients with GBM and 168 patients with MET, which were all proven by pathology. The ROI of the tumor was obtained on axial postcontrast MRI which was performed before operation. Seven radiomic feature selection methods and four classification algorithms constituted 28 classifiers in two classification strategies, with the best classifier serving as the final radiomics model. The clinical and combination models were constructed using the nomograms developed. The performance of the nomograms was evaluated in terms of calibration, discrimination, and clinical usefulness. Student’s t-test or the chi-square test was used to assess the differences in the clinical and radiological characteristics between the training and internal validation cohorts. Receiver operating characteristic curve analysis was performed to assess the performance of developed models with the area under the curve (AUC).
Results: The classifier fisher_decision tree (fisher_DT) showed the best performance (AUC: 0.696, 95% CI:0.608-0.783) for distinguishing between GBM and MET in internal validation cohorts; the classifier reliefF_random forest (reliefF_RF) showed the best performance (AUC: 0.759, 95% CI: 0.613-0.904) for distinguishing between MET-lung and MET-other in internal validation cohorts. The combination models incorporating the radiomics signature and clinical-radiological characteristics were superior to the clinical-radiological models in the two classification strategies (AUC: 0.764 for differentiation between GBM in internal validation cohorts and MET and 0.759 or differentiation between MET-lung and MET-other in internal validation cohorts). The nomograms showed satisfactory performance and calibration and were considered clinically useful, as revealed in the decision curve analysis.
Data Conclusion: The combination of radiomic and non-radiomic features is helpful for the differentiation among GBM, MET-lung, and MET-other.
Cerebral glioblastoma multiforme (GBM) and solitary brain metastasis (MET) are the most common brain tumors in adults (Ohgaki and Kleihues, 2005; Platta et al., 2010). Both GBM and MET show ring enhancement with peripheral edema on routine magnetic resonance imaging (MRI). Owing to the different treatment strategies available, a similar radiological appearance proposed a diagnostic dilemma for differentiation between the two lesions (Weller et al., 2014). Accurate differentiation between these two lesions is essential and has been one of the main focuses in radiological research for many years.
To date, studies aimed at the differentiation between GBM and MET have mainly shown two tendencies. The first tendency is to improve the performance of imaging modalities, and the second is to explore the differences among METs from different primary sites. For the first tendency, many imaging modalities have been proposed, including routine MRI and various advanced MRI modalities, such as magnetic resonance spectroscopy, diffusion-weighted imaging (DWI), diffusion tensor imaging, diffusion kurtosis imaging, perfusion-weighted imaging (PWI), arterial spin labeling, and amide proton transfer-weighted imaging (Chen et al., 2012; Tan et al., 2015; Salice et al., 2016; Durmo et al., 2018; Holly et al., 2018; Kamimura et al., 2019; Xi et al., 2019). For the second tendency, the relative cerebral blood volume showed no difference among METs from the lungs (MET-lung), breasts, gastrointestinal tract, and skin (Askaner et al., 2019). Another study showed that independent component analyses of dynamic susceptibility contrast PWI can show differences between breast MET and non-small-cell lung cancer (Chakhoyan et al., 2019). Moreover, breast METs were found to be less likely to be located in the posterior cerebral artery territory than MET-lung, kidneys, colon, and skin (Mampre et al., 2019).
Radiomics analysis has been proven to be useful in the diagnosis, prognosis assessment, and prediction of therapeutic responses in cancers by extracting exhaustive features from medical images (Aerts et al., 2014; Lambin et al., 2017). It has been used successfully in many studies of brain tumors, including those for tumor grading and genotype and overall survival assessment (Zacharaki et al., 2009; Grabowski et al., 2014; Li et al., 2018c; Chaddad et al., 2019). In particular, radiomics analysis was used to differentiate among METs from the breasts, lungs, and other sites in one study (Artzi et al., 2019). It was also used to differentiate METs among breast cancer, small-cell lung cancer, non-small-cell lung cancer, gastrointestinal cancer, and melanoma (Kniep et al., 2019). MET-lung, breasts, and skin also differed in texture features (Ortiz-Ramon et al., 2017; Ortiz-Ramón et al., 2018).
To date, the existing studies on the differentiation between GBM and MET have only focused on radiological data without consideration of clinical factors. Analyses of MET subtypes mainly considered the radiomic features without the routine MRI features. In addition, the subtypes of METs to be differentiated were not consistent in the existing studies. Of all METs, the top primary tumor is lung cancer (>50%) (Füreder et al., 2018; Rotta et al., 2018; Ascha et al., 2019). Therefore, we explored the differences between GBM and MET-lung and other sites (MET-other) with regard to the clinical and routine MRI and radiomic features in this study.
This retrospective study was approved by the committees of two institutions; the need for obtaining informed consent from the patients was waived.
Cerebral GBM was searched in the pathological database of our institution between January 2014 and December 2015. The inclusion and exclusion criteria are shown in Supplementary Material 1. A total of 152 patients with GBM were included from the first institution, and 30 patients with GBM were included from the second institution. All patients showed a supratentorial enhanced lesion in the cerebral parenchyma.
Solitary supratentorial MET was searched in the pathological database of the two institutions between January 2010 and December 2017. The inclusion and exclusion criteria are shown in Supplementary Material 1. Finally, a total of 76 patients with MET-lung and 62 patients with MET-other were included from the first institution, and 15 patients with MET-lung and 15 patients with MET-other were included from the second institution. The detailed primary cancers are shown in Supplementary Material 2.
All patients underwent MRI scanning within 2 weeks before cerebral operation. The tumor size was represented by the maximal diameter on the postcontrast axial image. Peritumoral edema was represented by the maximal diameter of the high signal around the tumor on the axial T2-weighted image (T2WI). The two parameters were manually measured using the Neurosoft PACS software1. The edema ratio was calculated by dividing the peritumoral edema by the tumor size. The location (left side/right side) was also reviewed by an experienced radiologist. The detailed scanning protocol and parameters are shown in Supplementary Material 3.
Using the ITK-SNAP software2 version 3.x, we opened the postcontrast axial sequence for each case and manually drew the outline of the enhanced lesion on each slice showing the tumor, which was saved as the segmented region of interest (ROI). The segmentation was performed by a radiologist with 14 years of experience and reviewed by another radiologist with 28 years of experience. Any discrepancy was resolved through discussion. The details of the drawing are illustrated in Supplementary Material 4.
The radiomic features were extracted using PyRadiomics, which is an open-source python package for the extraction of radiomic features from medical images (Van Griethuysen et al., 2017). For each ROI, we extracted three types of radiomic features, including non-textural, textural, and wavelet features. The non-textural features included 13 shape features and 18 first-order features, and 74 textural features were calculated on the basis of 5 texture matrices: the gray level co-occurrence matrix (GLCM), gray level dependence matrix (GLDM), gray level run-length matrix (GLRLM), gray level size zone matrix (GLSZM), and neighborhood gray-tone difference matrix (NGTDM). The three-dimensional wavelet transformation decomposed the original image set into eight filtered images set in three directions. Finally, a total of 841 radiomic features were extracted, consisting of shape features in the original image, first-order features, and textural features in all images. A detailed description is provided in Supplementary Material 5.
First, we randomly selected 50 patients and translated (three pixels in the up, down, left, and right directions) and rotated (3° in clockwise and anticlockwise directions) their ROIs to evaluate the stability of the features through the intraclass correlation coefficients (threshold = 0.8). After the prescreening, all features were standardized using the z-scores derived from the training cohort. Thereafter, seven feature selection methods were used, including information theoretical-based feature selection: conditional mutual information maximization (CMIM), minimal-redundancy and maximal-relevance (MRMR), and double input symmetrical relevance (DISR); similarity-based feature selection: Fisher score and reliefF; and sparse learning-based feature selection: multi-cluster feature selection (MCFS) and robust feature selection (RFS), to recognize the most discriminating features. For each feature selection method, we ranked the features by their relevance score, and the best features were selected for the later classifiers.
Four algorithms were used to build the radiomics model: logistic regression (LR), support vector machine (SVM), decision tree (DT), and random forest (RF). These algorithms were implemented on the basis of the selected features and classification categories. The LR algorithm was used by tuning the regular term and penalty term. The SVM algorithm was used by tuning the penalty and gamma of the kernel function, where the kernel function is “rbf.” The DT algorithm was used by tuning two parameters: the maximum sample of the leaf and the maximum node. The RF algorithm was used by tuning the number of DTs and the maximum sample of the leaf. Fivefold cross validation was used for all 28 classifiers. The optimal classifier served as the final radiomics model. These algorithms were implemented using the Python version 3.6.5 “scikit-learn” package.
The clinical characteristics (patient age and sex) and the routine radiological index (tumor size, edema ratio, and location) were used to construct the clinical-radiological model for differentiating between GBM and MET using an LR model (denoted as the clinicalGBM model). To distinguish MET-lung from MET-other, we used the same method to obtain the clinical-radiological model (denoted as the clinicalMET model). The clinical and routine radiological characteristics and radiomics signature were integrated to construct the combination models using the LR algorithm, and the optimal model was selected using AIC with a stepwise regression algorithm (denoted as the combinationGBM model and combinationMET model, respectively).
Receiver operating characteristic (ROC) curve analysis of each model was performed, and the areas under the curve (AUCs) were calculated in both the training and validation cohorts. The optimal cutoff value in the training cohort was applied to obtain accuracy, sensitivity, and specificity. The DeLong test was used to evaluate the statistical differences between the models. All assessments were performed in both the training and validation cohorts.
Nomogram analysis was applied to assess the potential clinical utility of the combination models. Calibration curves were drawn to evaluate the degree of deviation between the predictions and actual outcomes obtained using the Hosmer–Lemeshow test. Additionally, to evaluate the clinical utility of the nomograms, we performed a decision curve analysis by calculating the net benefits at different threshold probabilities (Rios Velazquez et al., 2017).
Patient age and sex, tumor size, and edema ratio were compared between the patients with GBM and MET and between those with MET-lung and MET-other using Student’s t-test or the chi-square test between the training, internal and external validation cohorts. P- values of <0.05 were considered to indicate a significant difference. The Spearman correlation coefficient was used to assess the relationship between the clinical and radiolocial characteristics and radiomic features. Statistical analysis was performed using IBM SPSS Statistics version 22.
The first institution included 152 patients with GBM and 138 patients with MET, which were randomly divided into a training cohort (n = 193) and an internal validation cohort (n = 97) with a ratio of 2:1. In addition, the patients with MET were also randomly divided into the training (n = 92) and validation cohorts (n = 46) at a ratio of 2:1. The second institute included 30 patients with GBM and 30 patients with MET, which were used as the external validation cohort.
The baseline characteristics are summarized in Table 1. There was no significant difference between the training and internal validation cohort for the two classification strategies. And, no significant difference between the training and external validation cohort for the two classification strategies.
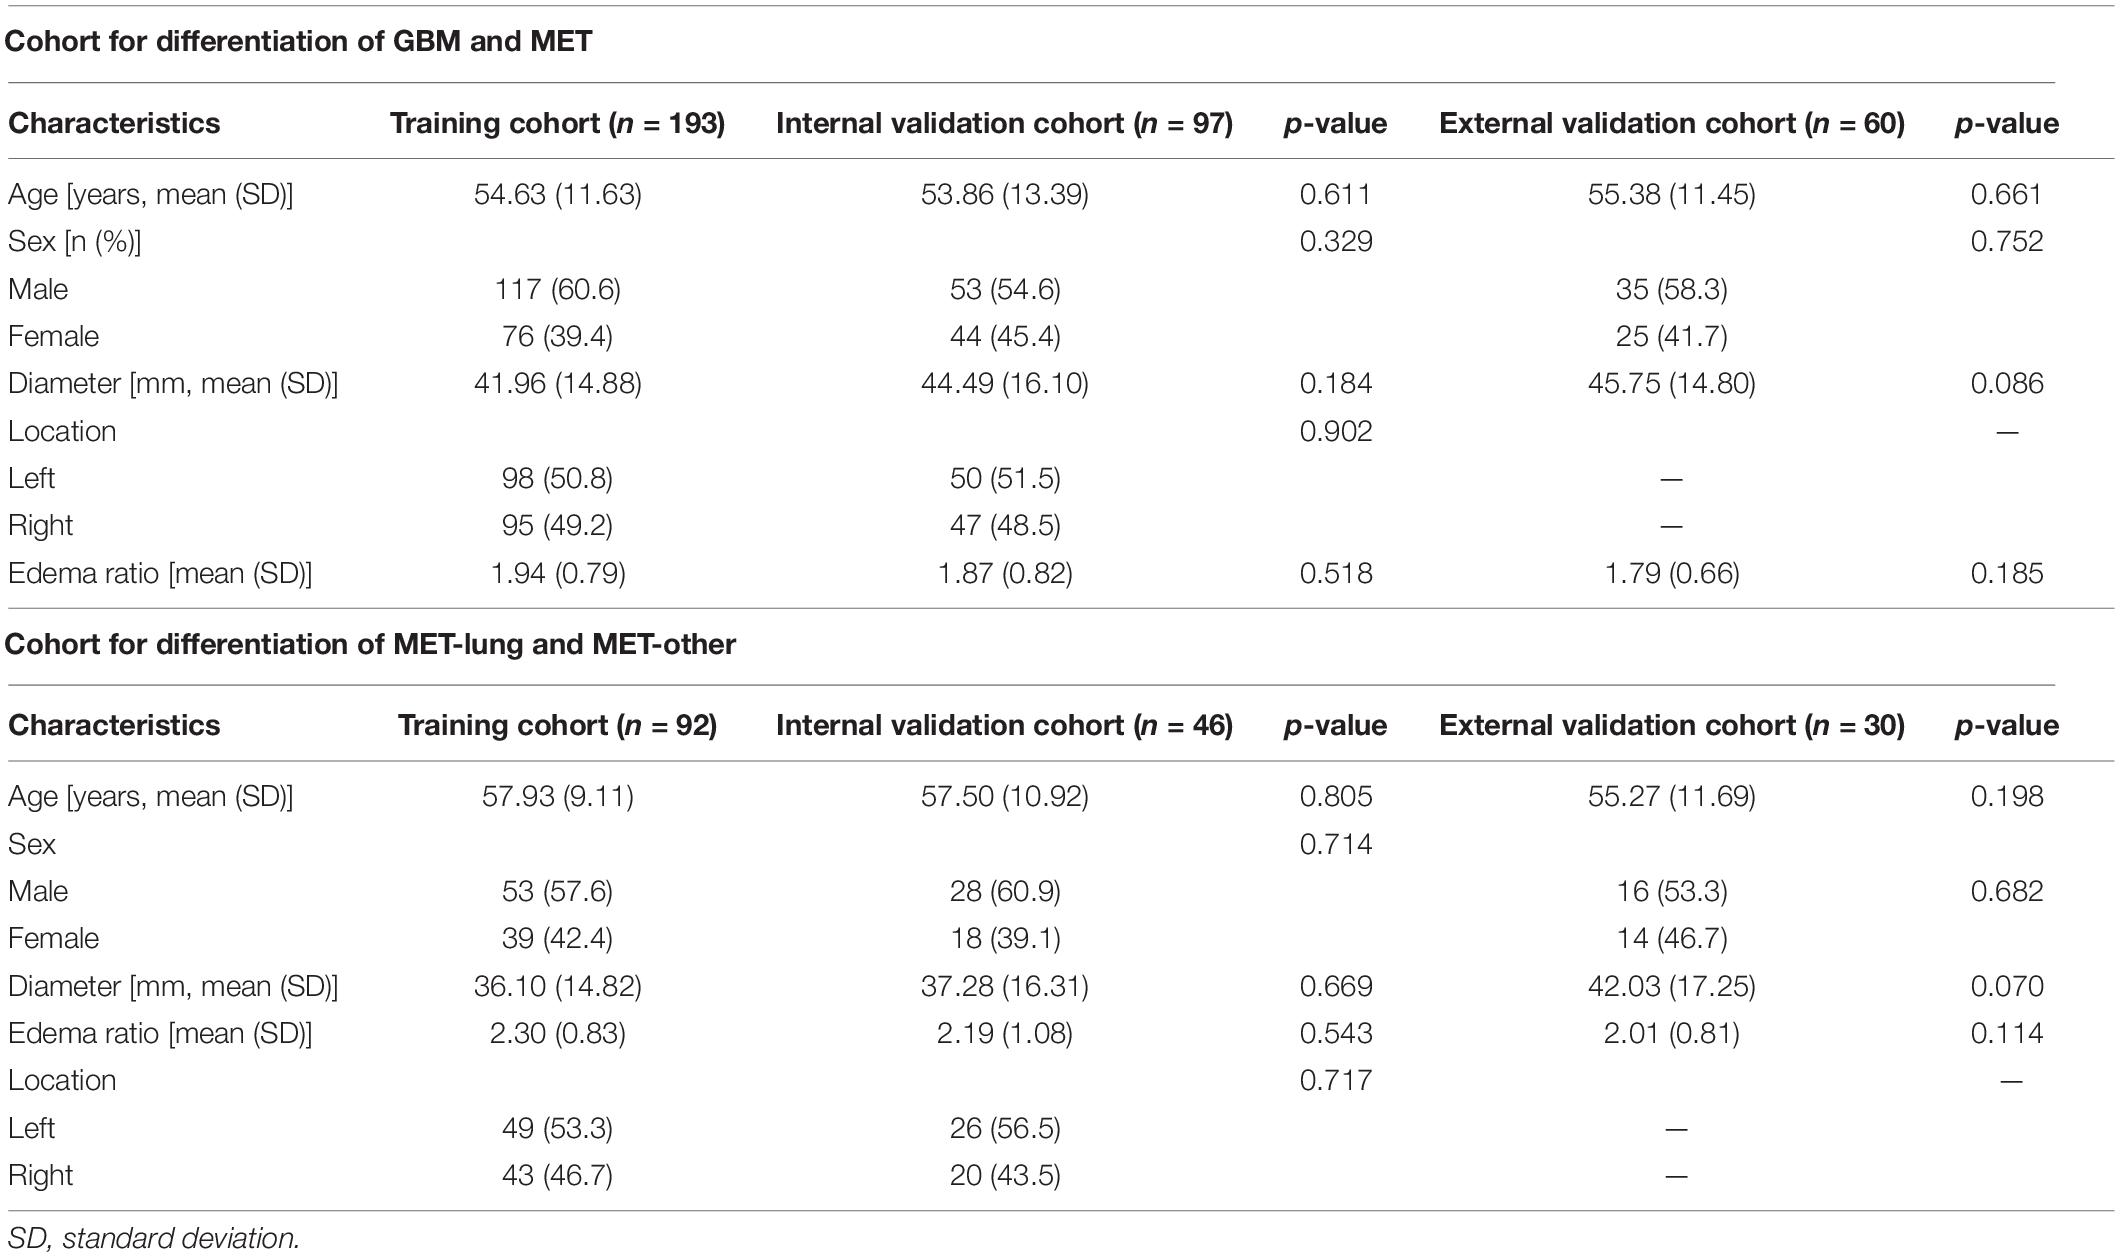
Table 1. Cohort demographics.
A total of 841 radiomic features were calculated for each patient. After prescreening using the intraclass correlation coefficients, 687 radiomic features with high stability were retained for subsequent analysis (Figure 1). Thereafter, the top 20 best features in each feature selection method were reserved to construct the radiomics models. Thus, seven feature subsets were formed for the two classification strategies. The detailed radiomic features are shown in Supplementary Material 6.
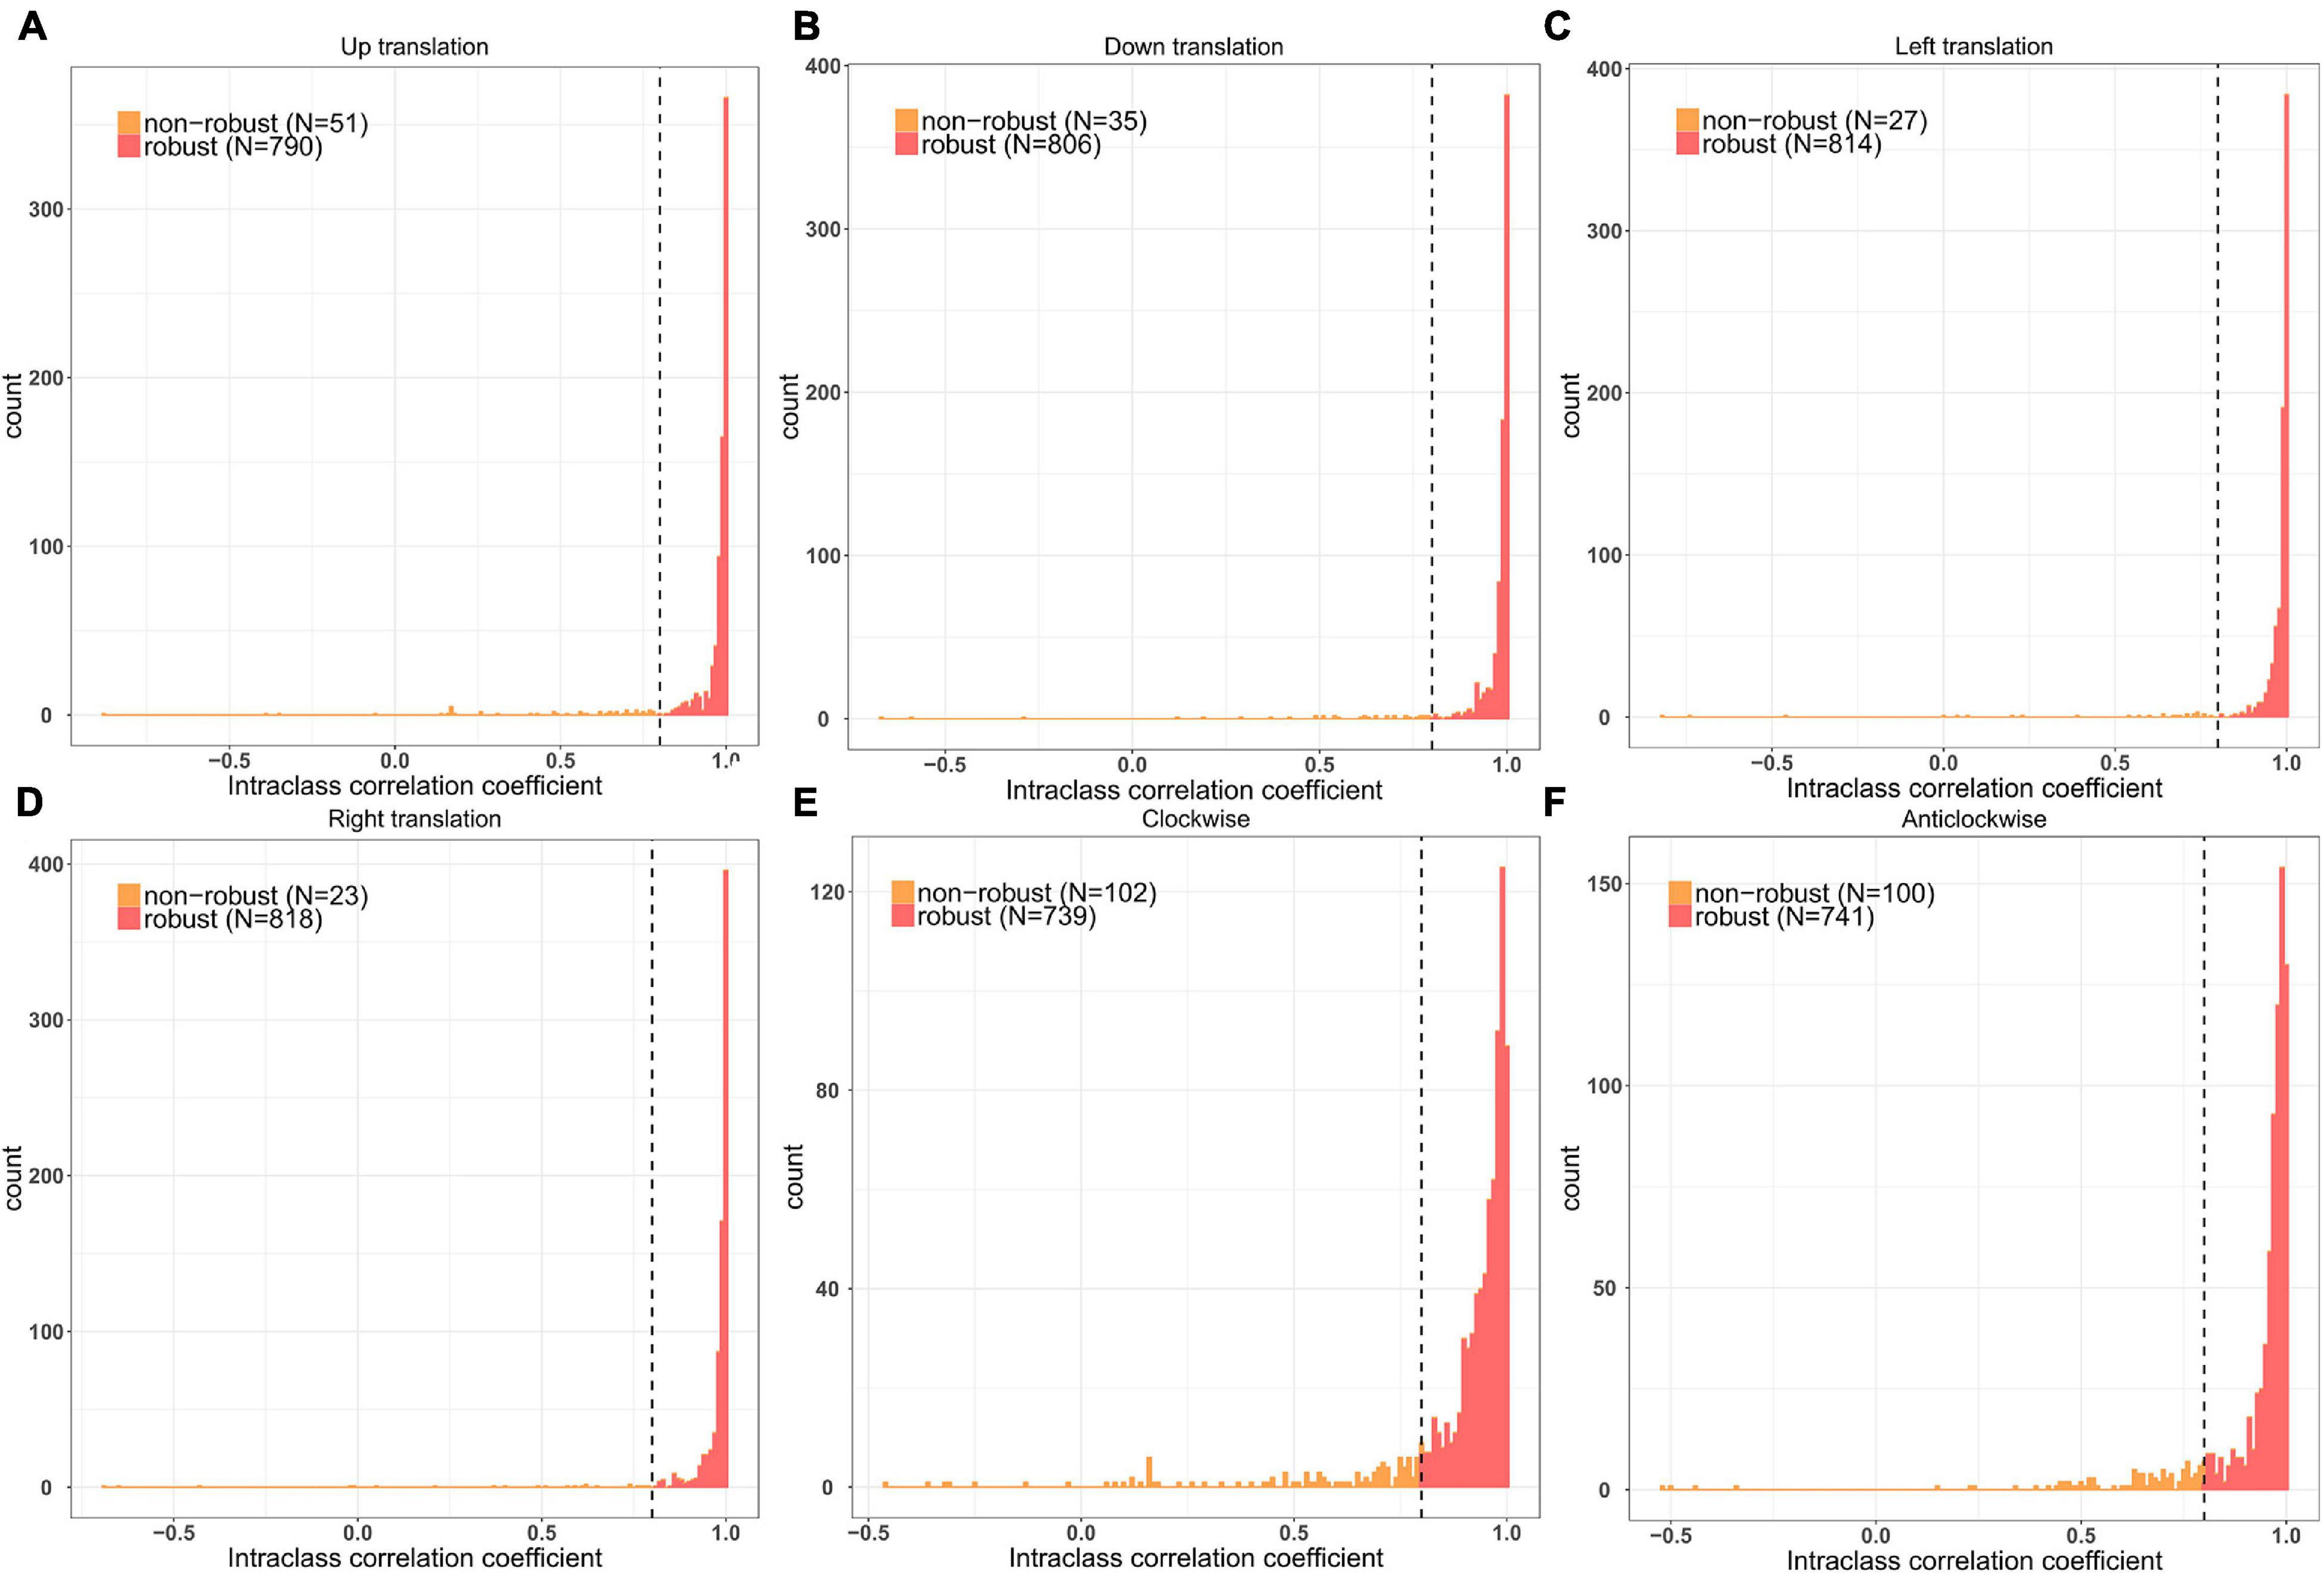
Figure 1. Remaining feature numbers after stability analyses for each disturbance. (A,B) The ROI was translated 3 pixels in the up and down directions; (C,D) The ROI was translated 3 pixels in the left and right directions; (E,F) The ROI was rotated 3° in clockwise and anticlockwise directions.
The performance of each of the 28 classifiers in the training and internal validation cohorts was reserved and is listed in Supplementary Material 7. For distinguishing between GBM and MET, the classifier fisher_decision tree (fisher_DT) showed the best performance in the internal validation cohort (AUC: 0.696, 95% CI: 0.608-0.783 Figure 2A and Supplementary Material 7). For differentiating between MET-lung and MET-other, the classifier reliefF_random forest (reliefF_RF) showed the best performance in the internal validation cohort (0.759,95% CI: 0.613-0.904, Figure 2B and Supplementary Material 7). The classifiers fisher_DT and reliefF_RF were selected as the optimal radiomics models in the two classification strategies, which were denoted as the radiomicsGBM model and radiomicsMET model, respectively. These two models are shown in Supplementary Material 8.
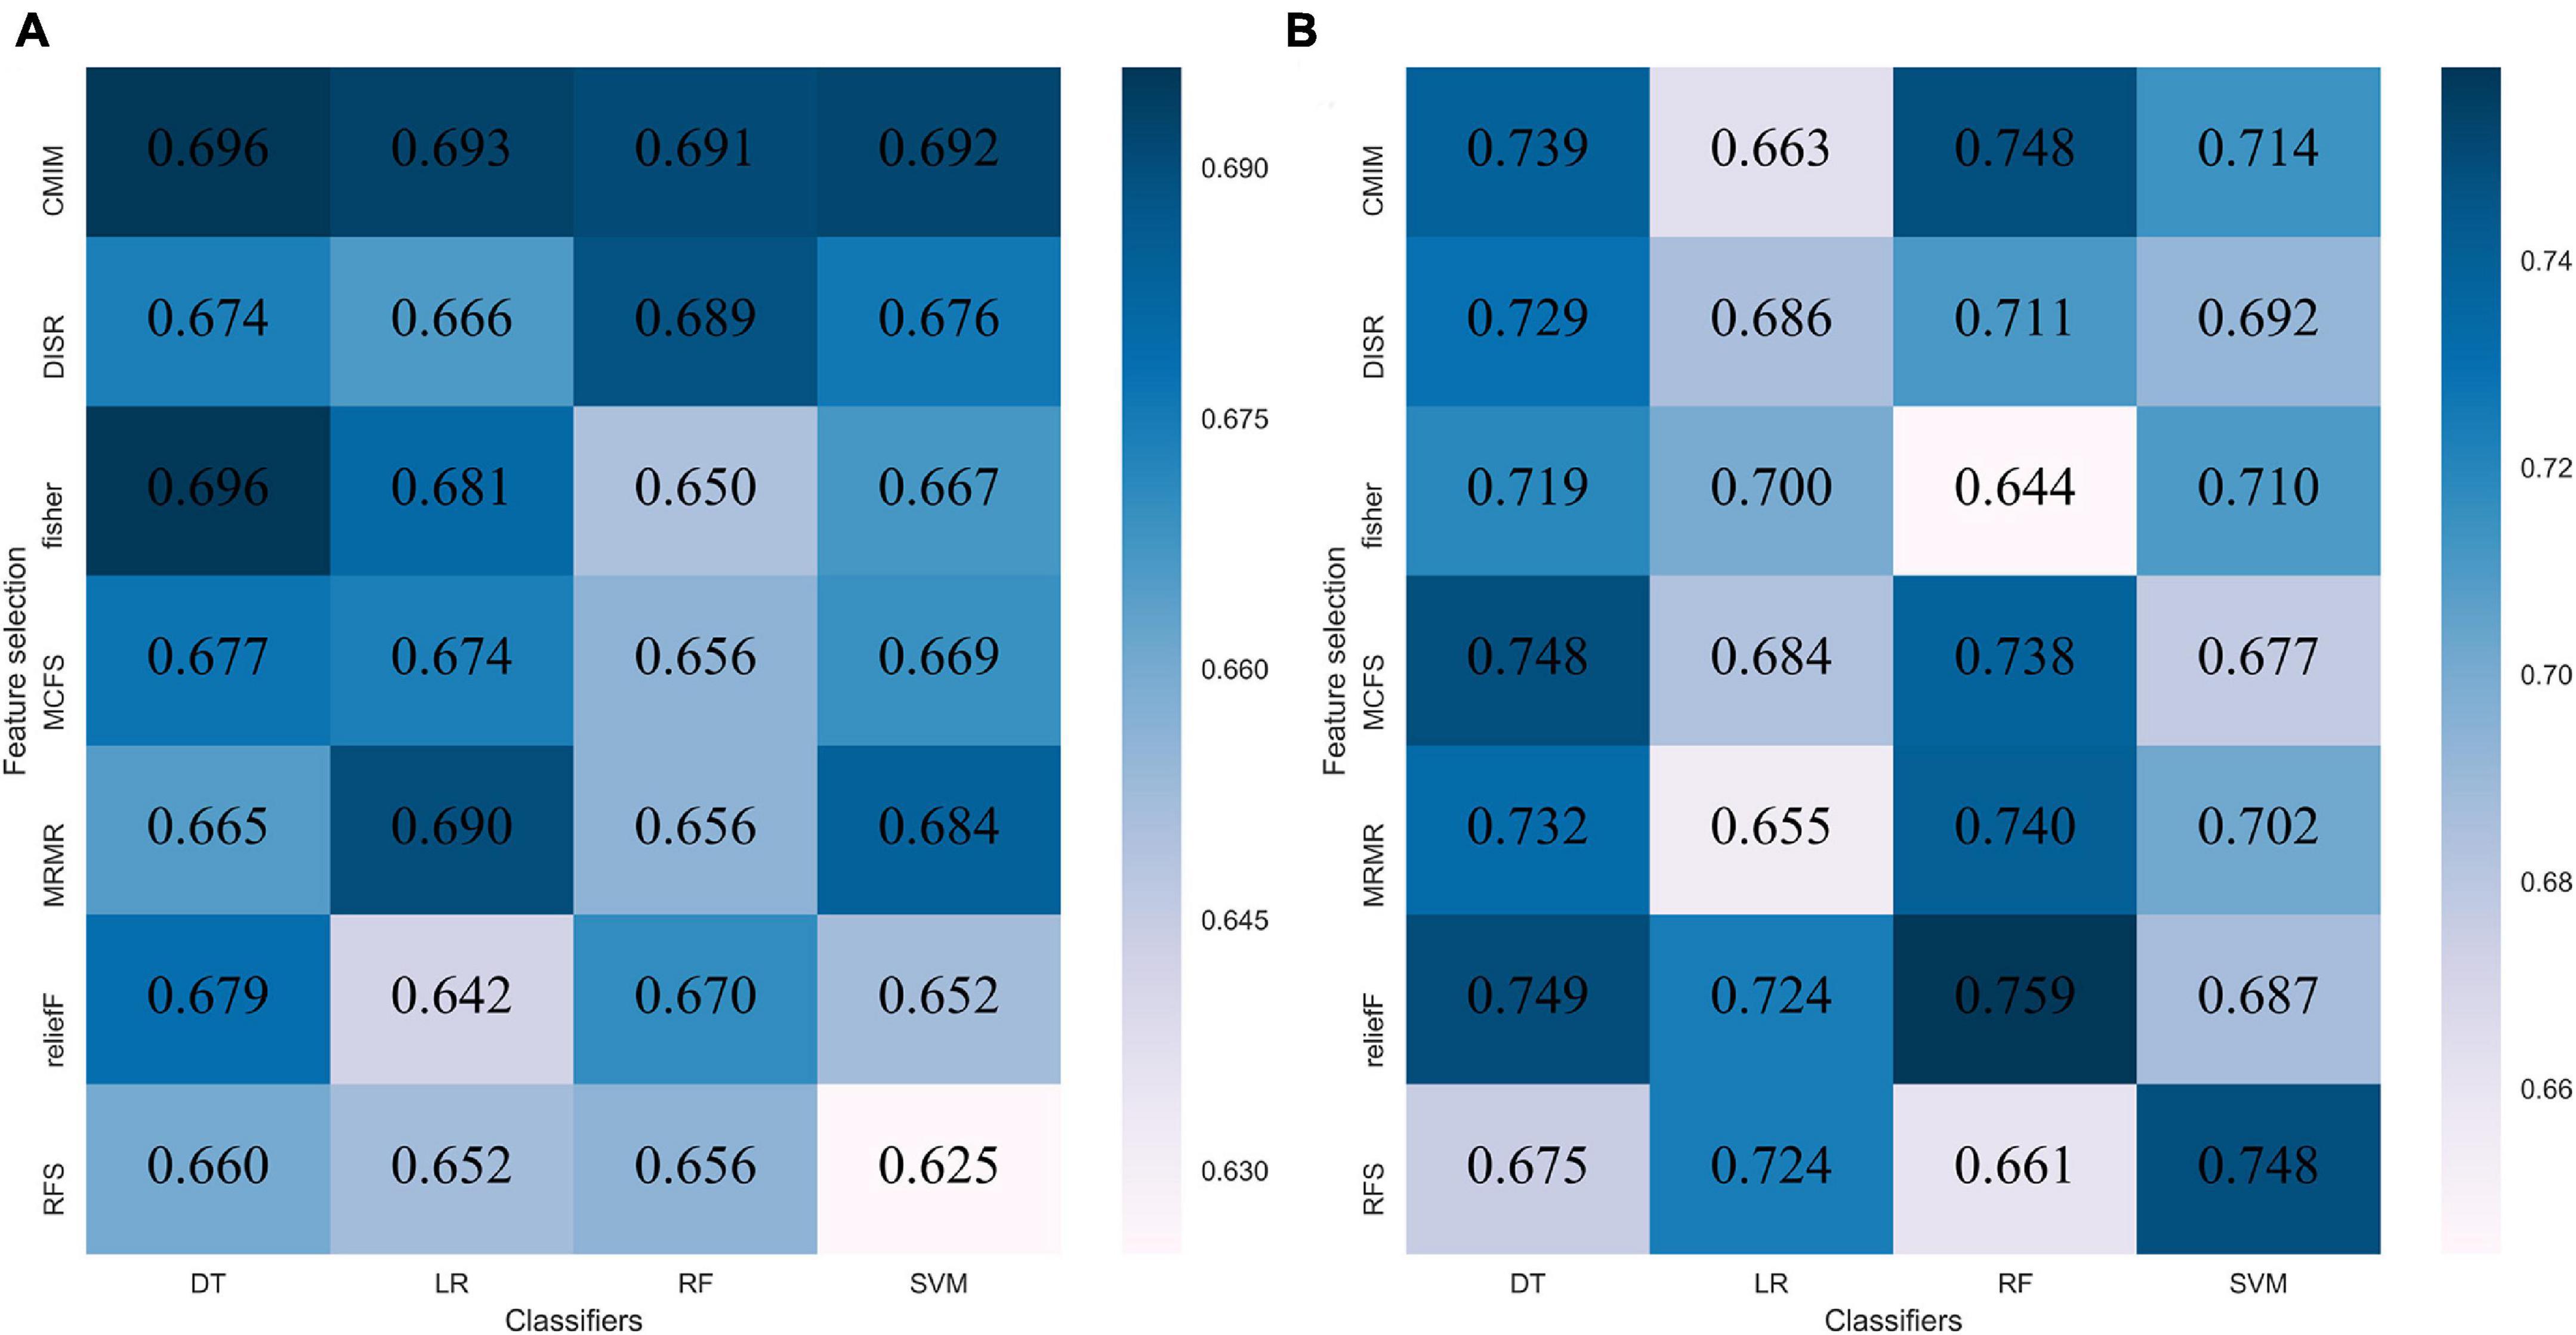
Figure 2. Performance of 28 classifiers in two classification strategies. (A) AUC of distinguishing GBM and MET in the internal validation cohort; (B) AUC of distinguishing MET-lung and MET-other in the external validation cohort. AUC, area under the curve; GBM, glioblastoma multiforme; MET, metastasis.
We summarized the performances of the clinical-radiological characteristics in the two classification strategies in Table 2. For distinguishing between GBM and MET, the clinicalGBM model exhibited satisfactory performance in all cohorts (training: AUC: 0.803, 95% CI: 0.740-0.867; internal validation: AUC: 0.744 95% CI: 0.643-0.846; external validation: AUC:0.674, 95% CI: 0.528-0.821, Figures 3A–C and Table 2). For distinguishing between MET-lung and MET-other, the AUC of the clinicalMET model was 0.598 (95% CI: 0.430-0.767) and 0.759 (95% CI: 0.548-0.971) in the internal and external validation cohort, respectively (Figures 3D–F and Table 2). For distinguishing between GBM and MET, the patient age, tumor diameter, edema ratio, and radiomicsGBM signature were considered as the input variables of the combinationGBM model after a stepwise search. For distinguishing between MET-lung and MET-other, the tumor diameter, edema ratio, and radiomicsMET signature were considered as the input variables of the combinationMET model. After the incorporation of the radiomics signatures, the performance of the combination models in the two classification strategies improved compared with that of the clinical models (Table 2). In particular, the performance of the combinationMET model was significantly better than that of the clinicalMET model (DeLong test: P = 0.019 in the internal validation cohort). The violin figures of all models in the training and validation cohorts are shown in Supplementary Material 9.
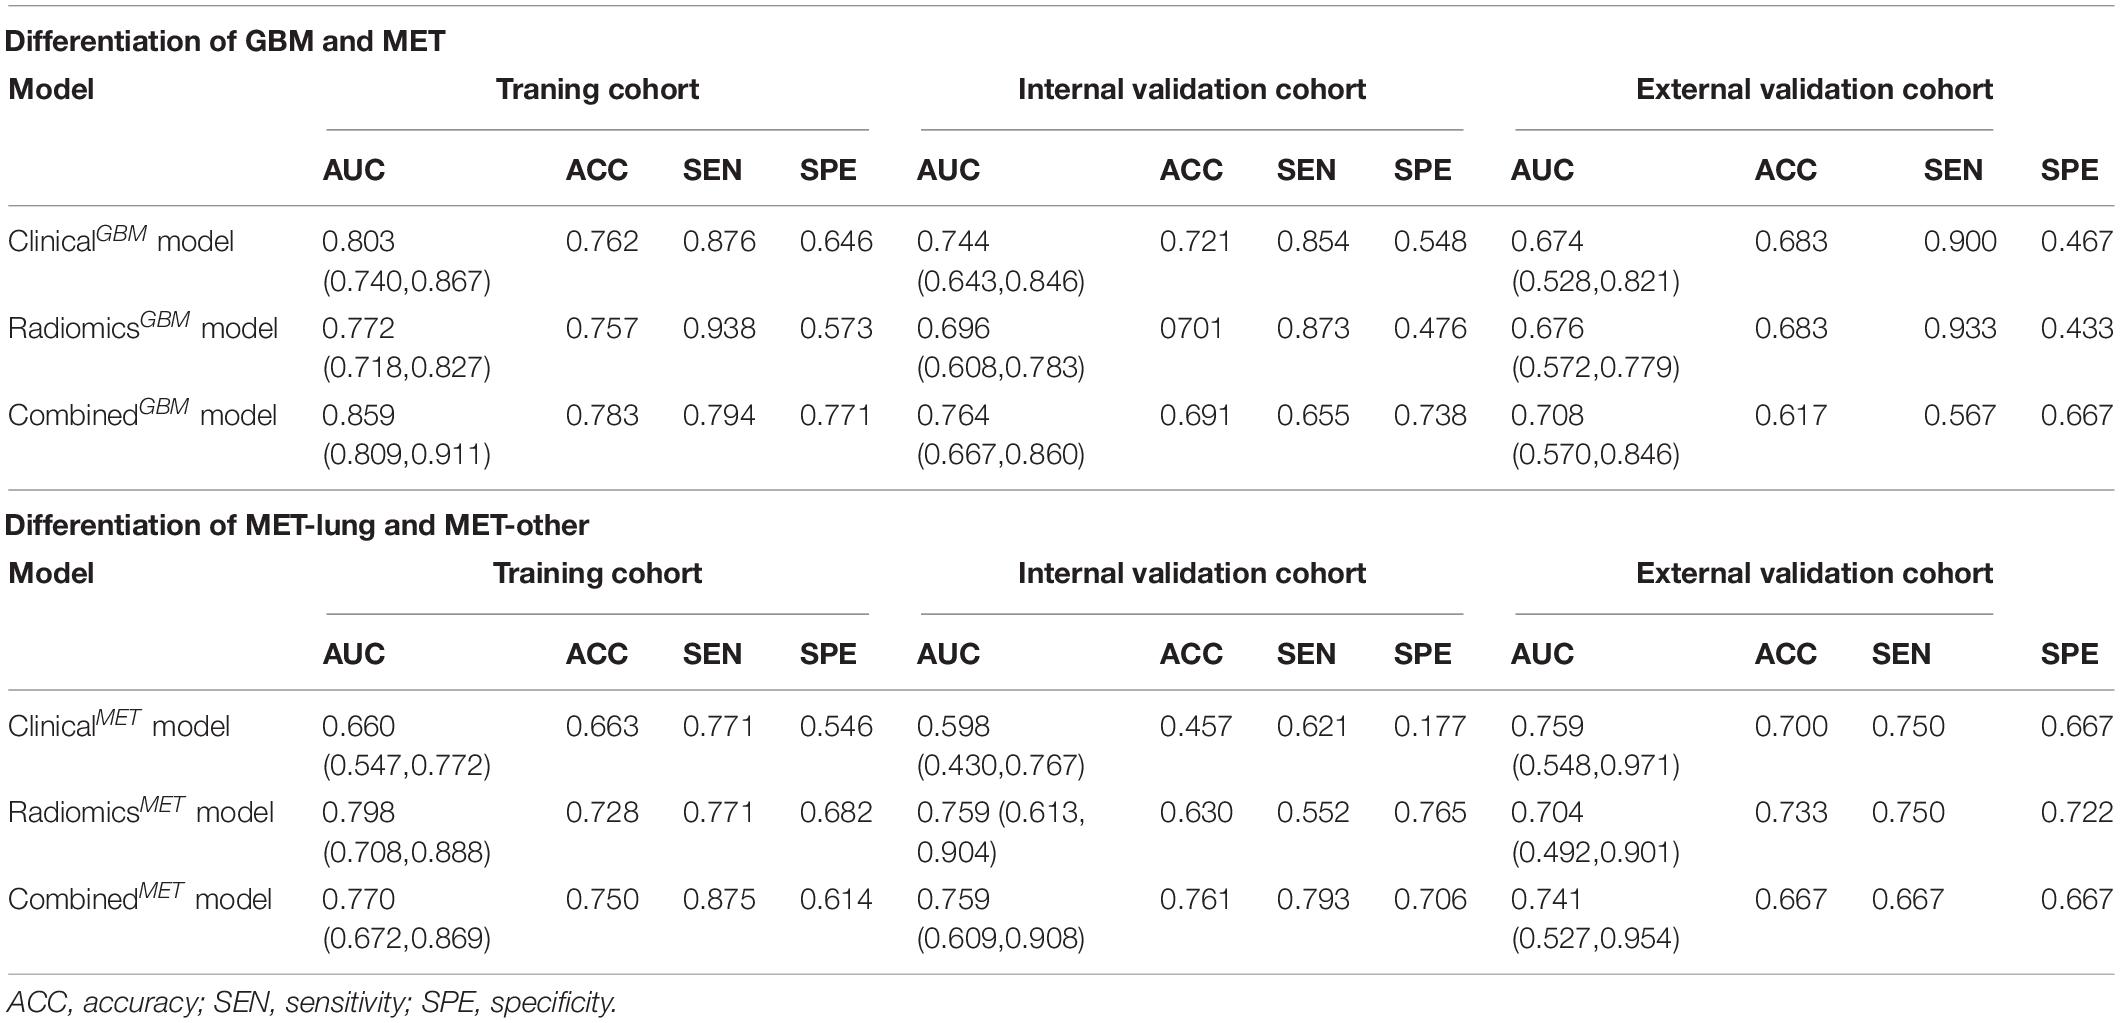
Table 2. Predictive performance of each model.
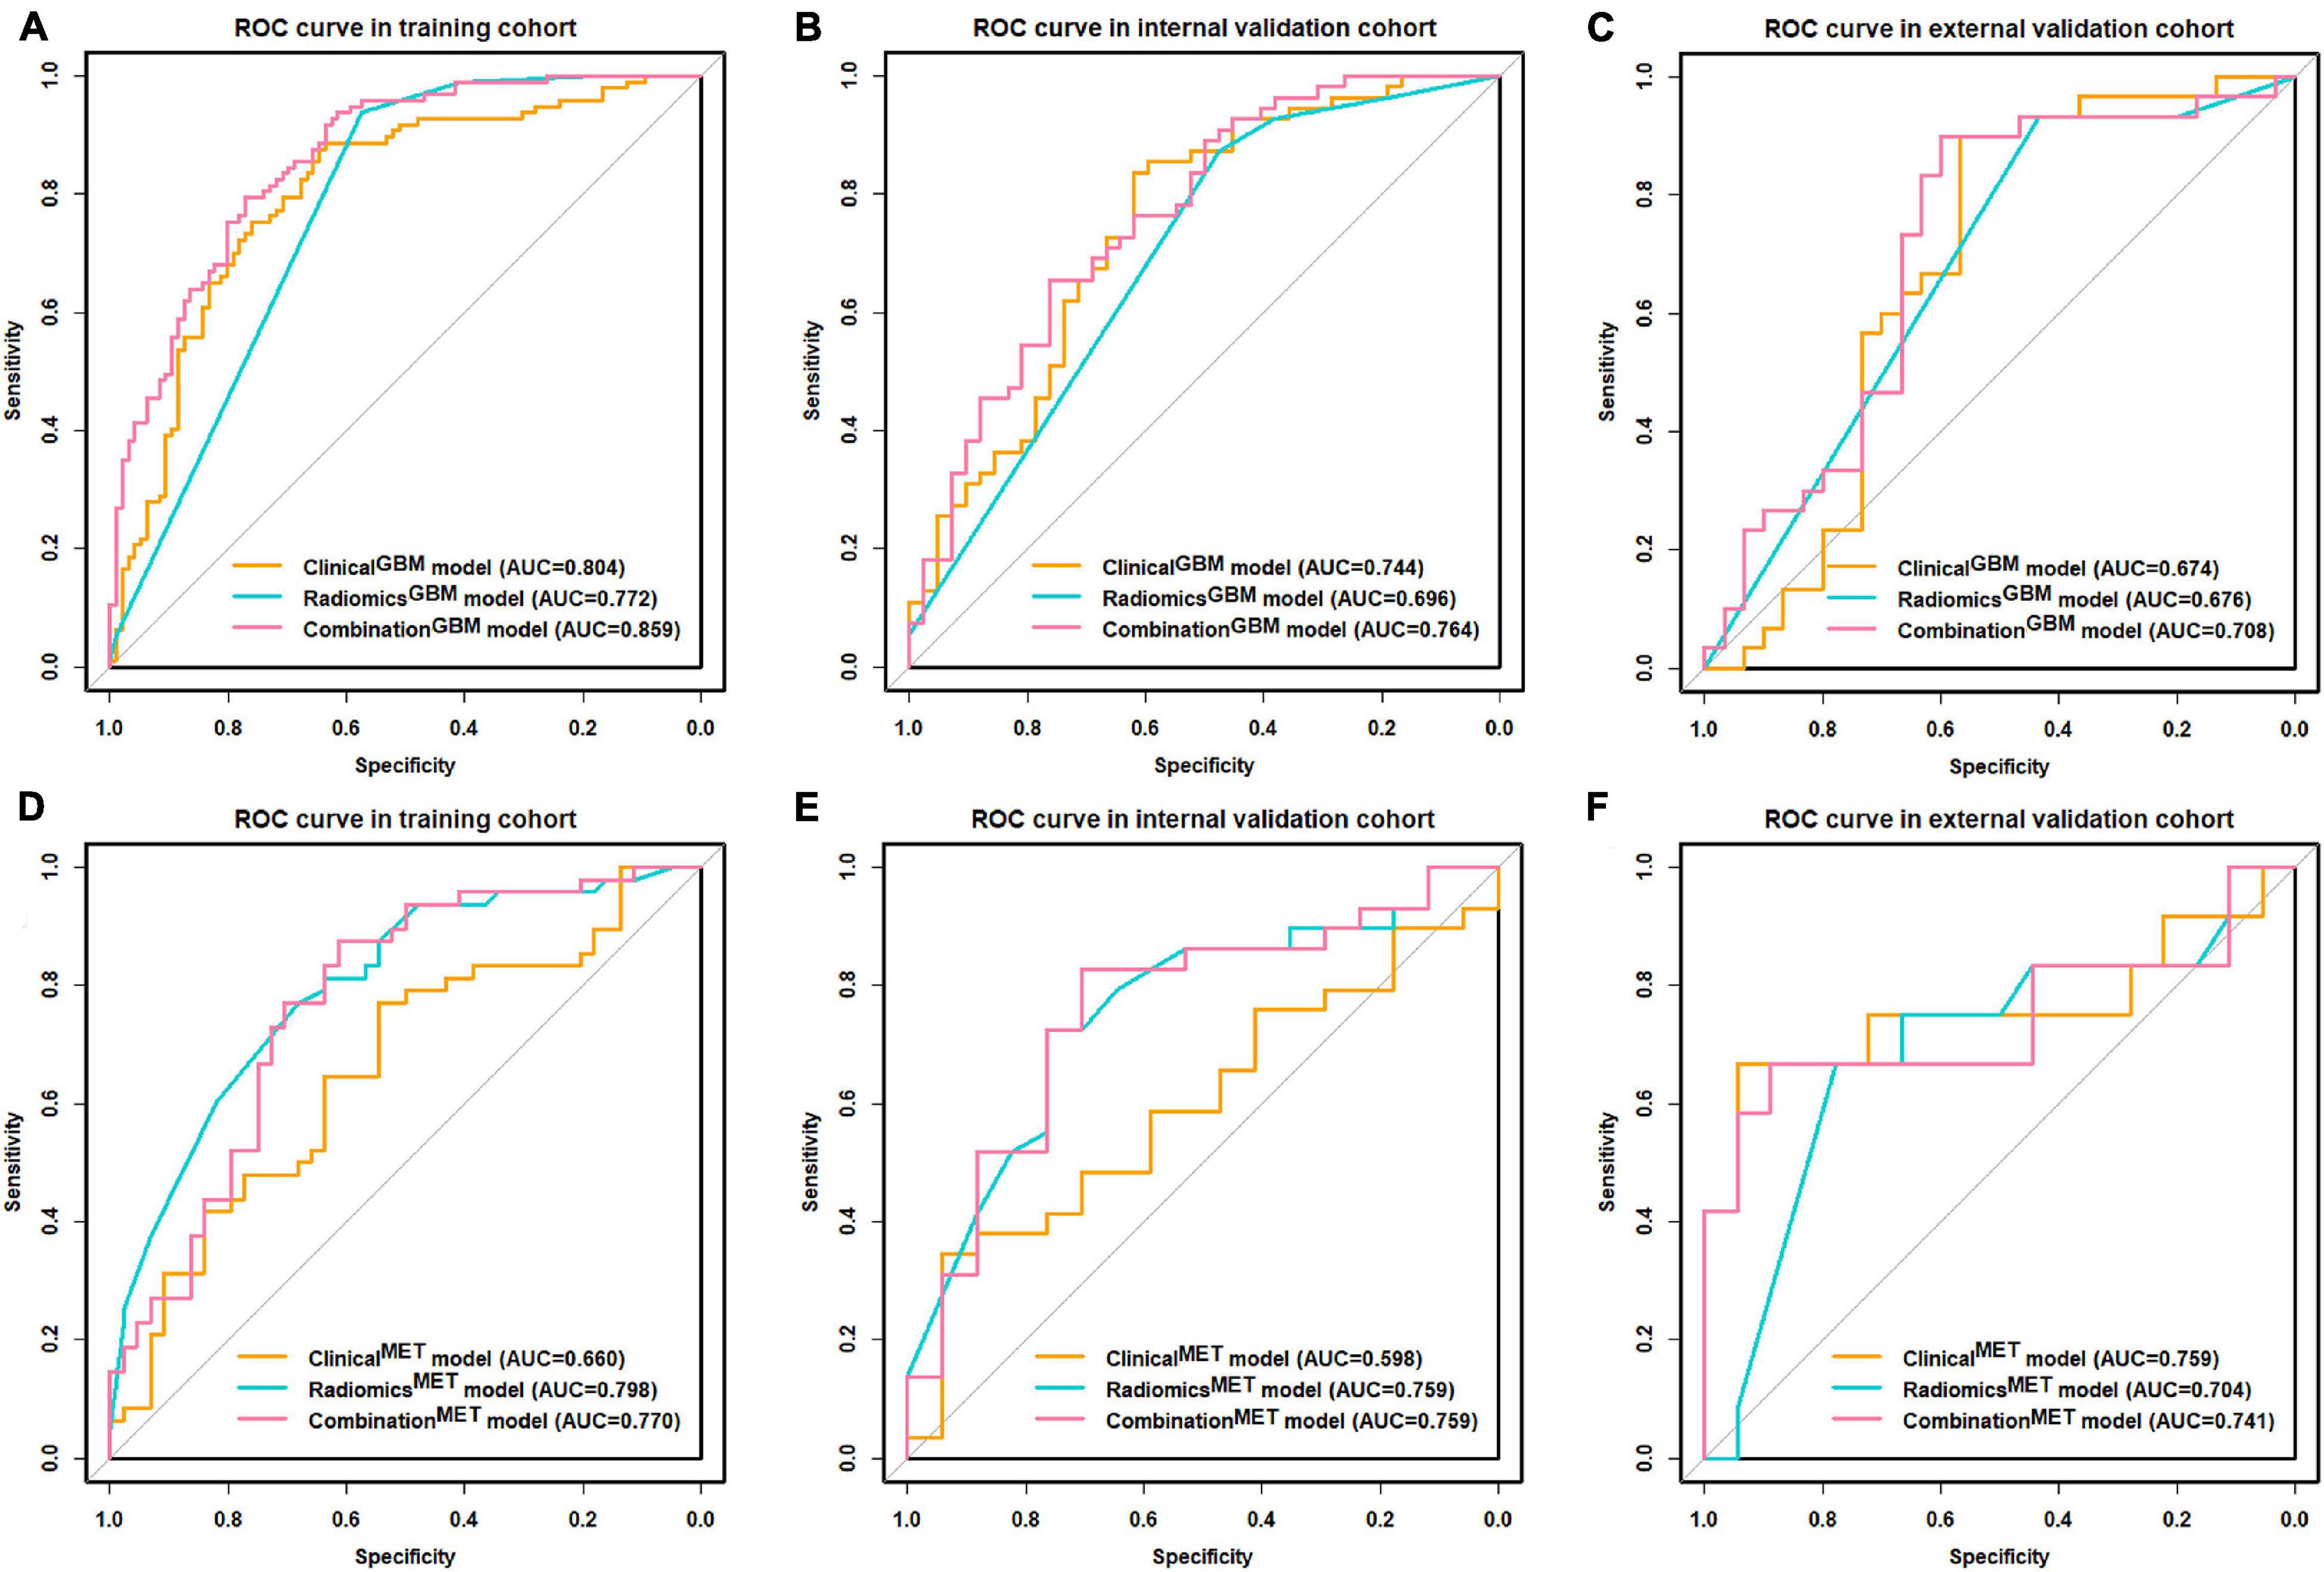
Figure 3. ROC curve for clinical, radiomics, and combination models. (A–C) ROC curves of distinguishing GBM and MET; (D–F) ROC curves of distinguishing MET-lung and MET-other. ROC, receiver operating characteristic; GBM, glioblastoma multiforme; MET, metastasis.
We used the nomograms to show the graphical representation of the combination models. The nomograms for the two classification strategies are illustrated in Figure 4. The calibration curves demonstrated good agreement between the predictive and observational probabilities for the two classification strategies (P > 0.05 for all cohorts, Hosmer–Lemeshow test, Figure 5). The AUCs for the nomogram were 0.859 (95% CI: 0.809-0.911) in the training cohort, 0.764 (95% CI:0.667-0.860) in the internal validation cohort and 0.708 (95% CI: 0.570-0.846) in the external validation cohort for the differentiation between GBM and MET. The AUCs for the nomogram were 0.770 (95% CI: 0.672-0.869) in the training cohort, 0.759 (95% CI:0.609-0.908 in the internal validation cohort and 0.741 (95%CI:0.527-0.954) in the external validation cohort for the differentiation between MET-lung and MET-other. The decision curves showed that the combination GBM nomogram added more benefit than did the clinicalGBM nomogram when the threshold probability was >6% (Figure 6A); for the differentiation between MET-lung and MET-other, the combinationMET nomogram added more benefit than did the clinicalMET nomogram when the threshold probability was > 16% (Figure 6B). The correlation between the clinical-radiological characteristics and radiomic features was demonstrated in the heat map with the absolute value of the Spearman correlation coefficients (Supplementary Material 10).

Figure 4. Model assessment. (A) Nomogram for distinguishing GBM and MET; (B) Nomogram for distinguishing MET-lung and MET-other. GBM, glioblastoma multiforme; MET, metastasis.
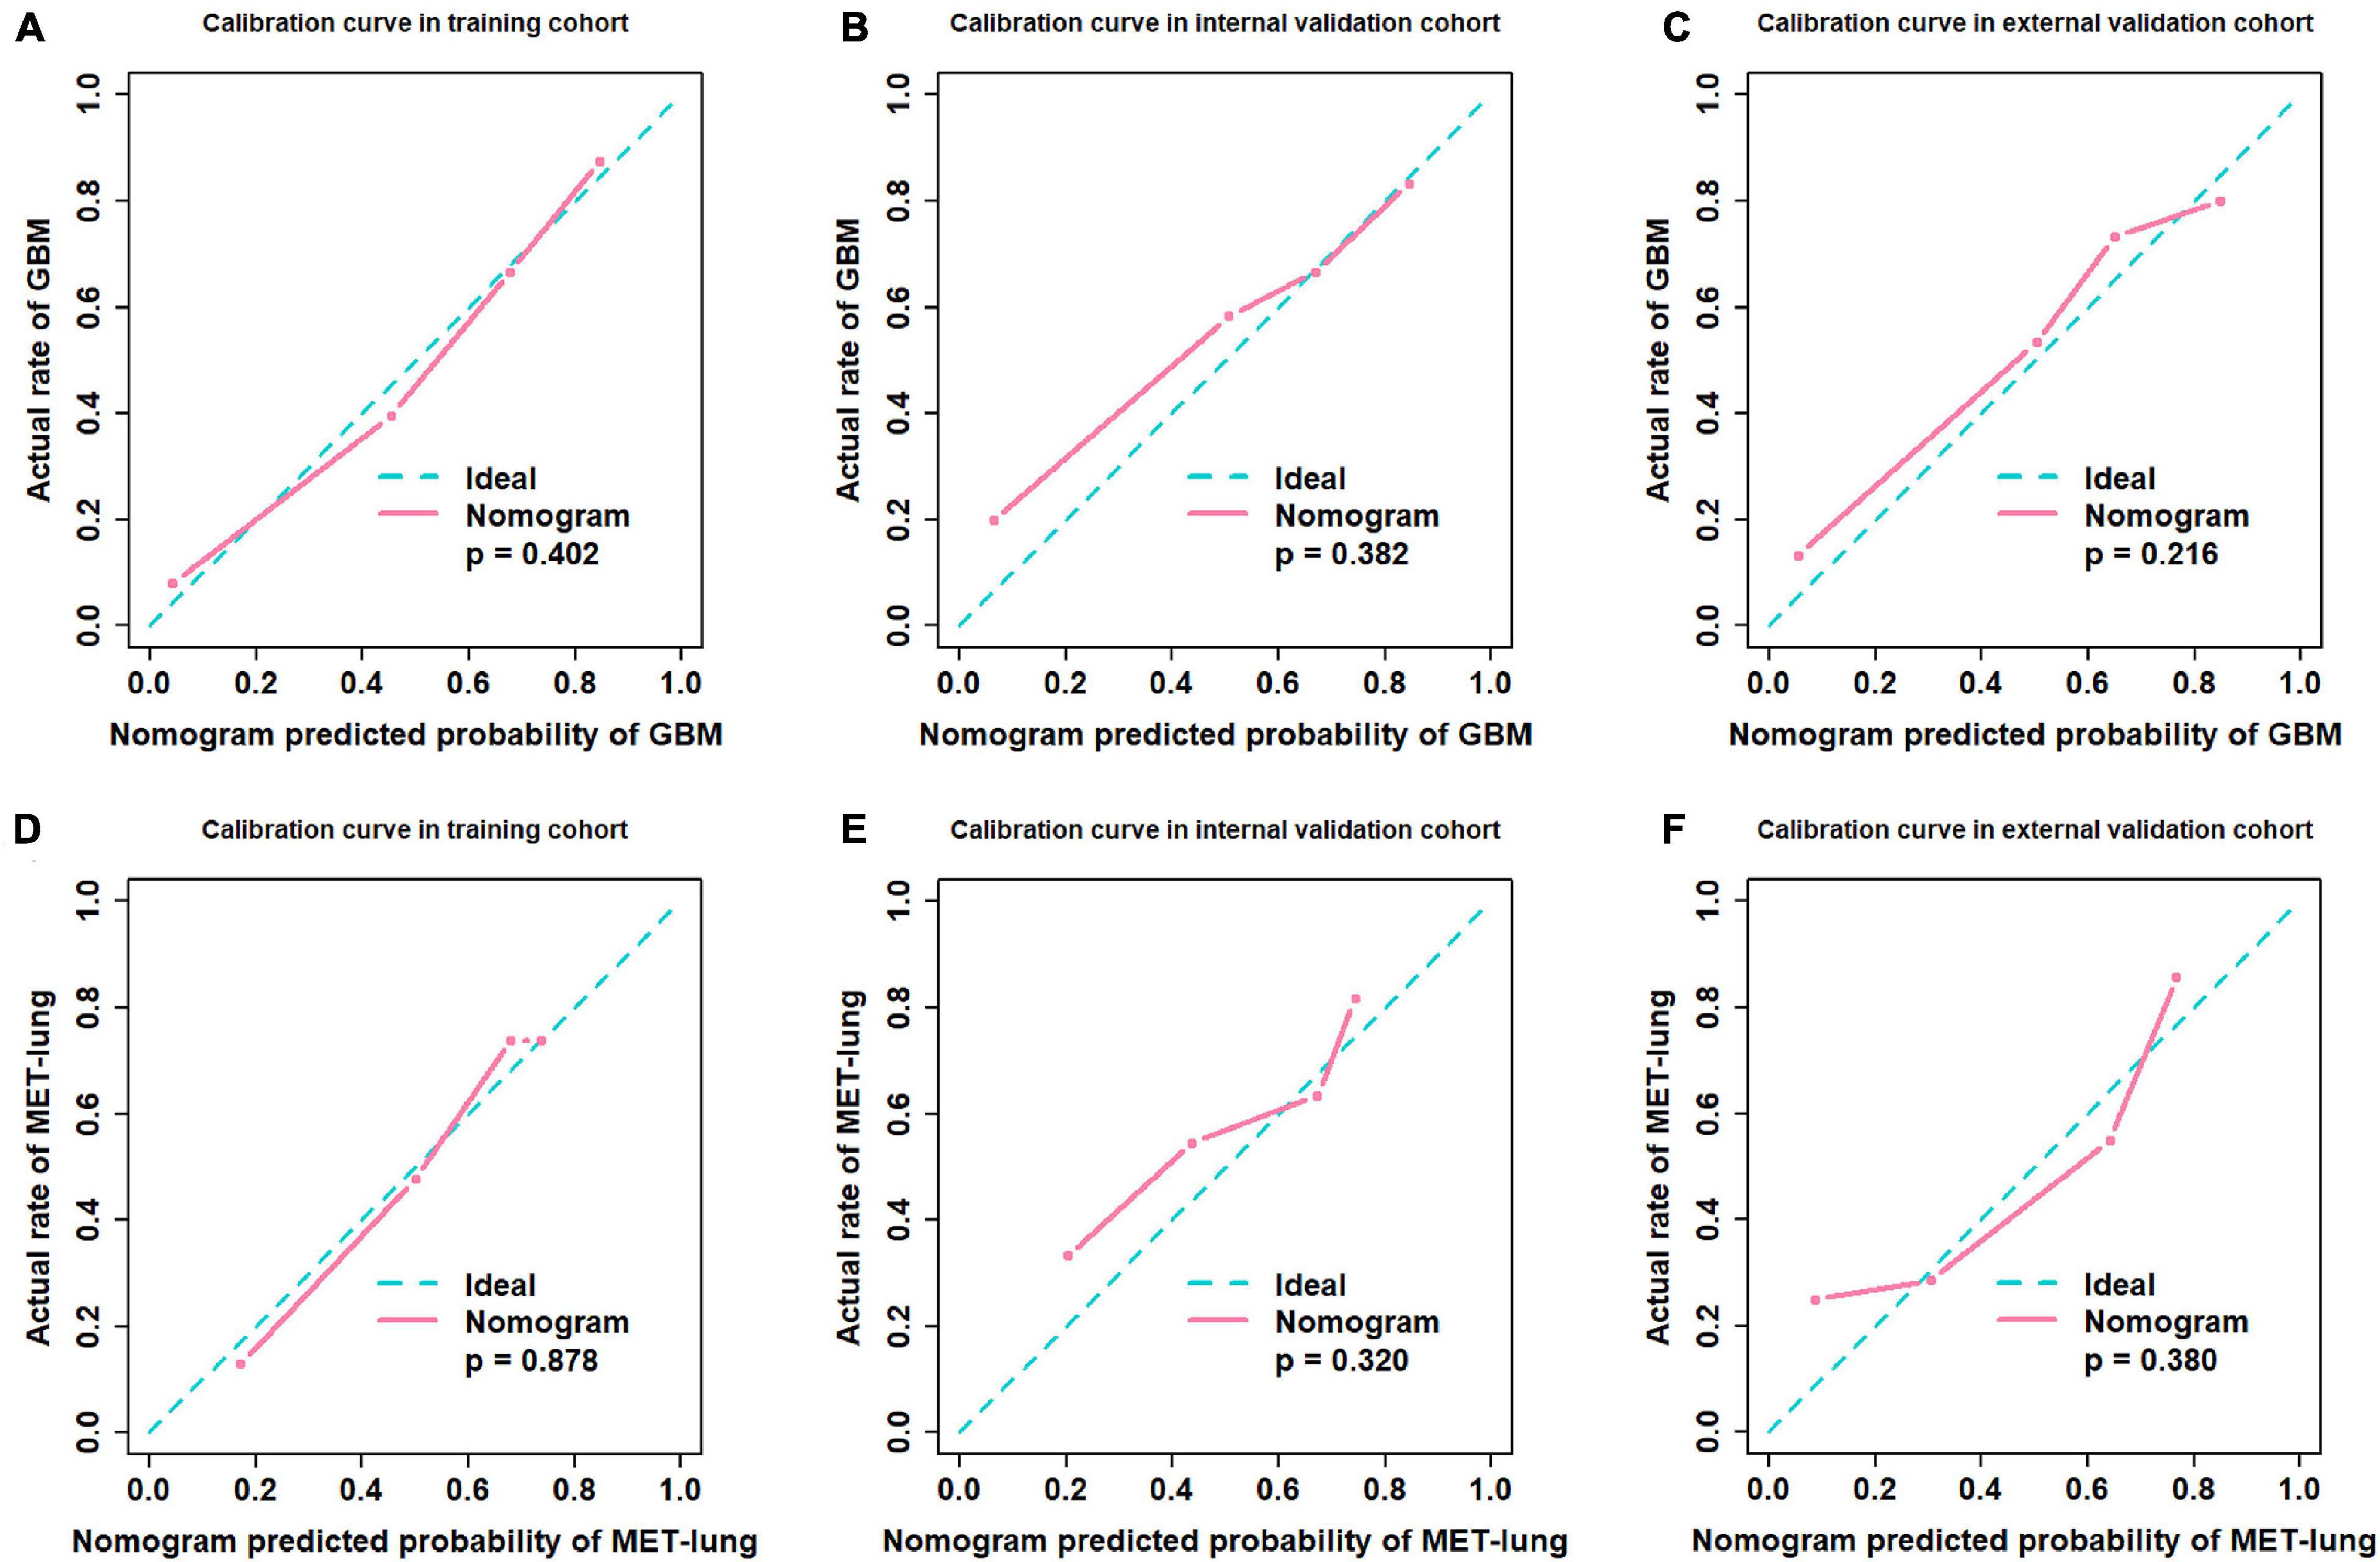
Figure 5. Calibration curves. (A–C) Calibration curves of distinguishing GBM and MET; (D–F) Calibration curves of distinguishing MET-lung and MET-other. GBM, glioblastoma multiforme; MET, metastasis.
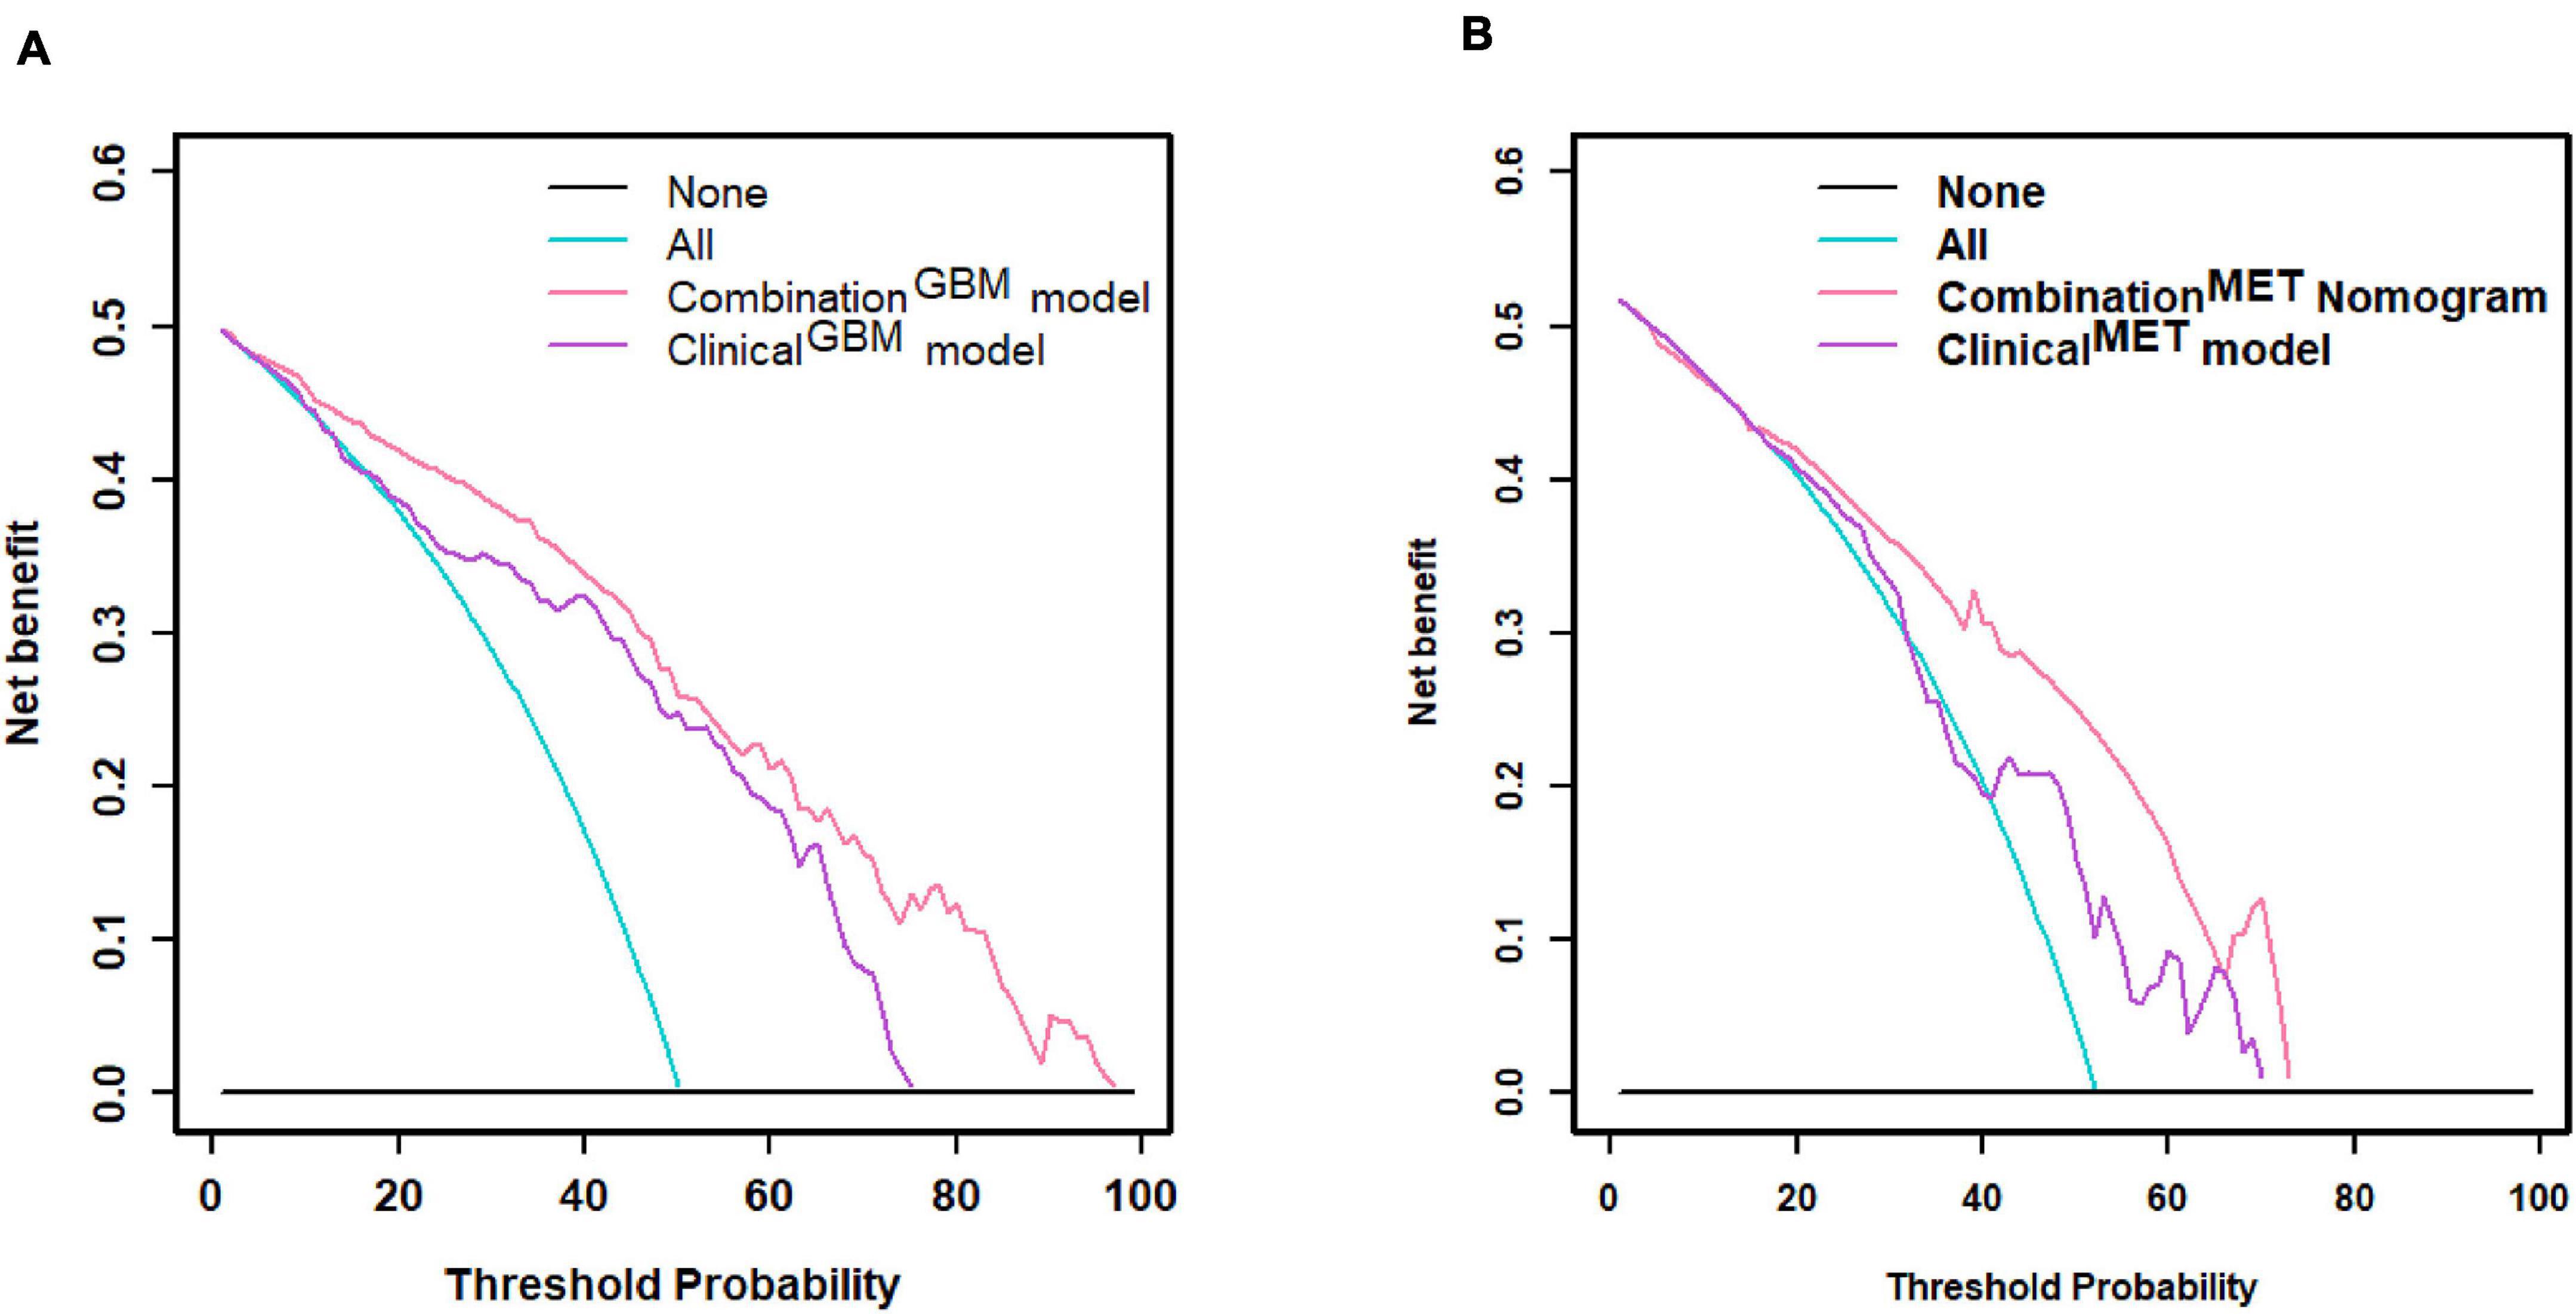
Figure 6. Decision curve. (A) Decision curve of distinguishing GBM and MET; (B) decision curve of distinguishing MET-lung and MET-other. GBM, glioblastoma multiforme; MET, metastasis.
We utilized radiomics analysis to distinguish between GBM and MET and between MET-lung and MET-other. For both classification strategies, we applied seven methods to select features and four algorithms to construct the radiomics model. Of all 28 classifiers for distinguishing between GBM and MET, the classifier fisher_DT exhibited the best classification performance, with an AUC of 0.696 in the internal validation cohort. For distinguishing between MET-lung and MET-other, the classifier reliefF_RF exhibited the best classification performance, with an AUC of 0.759 in the validation cohort. The combination models exhibited an improved predictive performance compared with the clinical models when the radiomics signatures were added to the models, especially for identifying the primary tumor of MET.
Radiomics analysis has been used for the differentiation between GBM and MET. To determine the best classification model for differentiation, 12 feature selection methods and 7 classification methods were used; the highest AUC obtained was 0.90 in the study by Qian et al. (2019). Artzi et al. (2019) used four machine-learning algorithms to differentiate between the GBM and MET subtypes, and the accuracies were 0.85, 0.89, 0.82, and 0.89 for identifying GBM and METs from breast, lung, and other cancers, respectively. All these studies have high clinical applicability but have only focused on the comparison of imaging features and radiomics models and did not consider the clinical factors. The complementarity of radiomic features and clinical-radiological factors should also be explored.
Considering the importance of patient age and sex in medical diagnosis, these variables were included in this study. Moreover, the tumor size, perilesional edema, and location are important radiological signs for diagnosis, which are readily obtained by routine radiological scans. The radiomicsGBM model and clinicalGBM model yielded a comparable predictive performance (P = 0.361 in the internal validation cohort, DeLong test). In addition, the predictive performance of the combinationGBM model improved compared with that of the clinicalGBM model when the radiomicsGBM signature and clinical-radiological factors were combined. However, the DeLong test showed no significant improvement (P = 0.064 in the internal validation cohort). This indicates that the radiomics signature can be used as a signal predictor to obtain satisfactory results. For differentiation between MET-lung and MET-other, and the performance of radiomicsMET model significantly better than that of the clinicalMET model (P = 0.019 in the internal validation cohort, DeLong test). The combinationMET model also showed a better predictive performance than the clinicalMET model, and the DeLong test showed significant improvements in the internal validation cohorts (P = 0.019), which suggested that the radiomics signature can increase the predictive power of clinical factors. Based on the results of the two classification strategies, we observed that radiomics analysis has a superior classification ability in differentiating tumor types, which is consistent with previous study findings (Artzi et al., 2019; Qian et al., 2019).
Our study also showed that the tumor size was related to the type of tumor, which was consistent with a previous study finding (Baris et al., 2016). Compared with the other characteristics, the tumor size had a higher correlation with the radiomic features used in the radiomicsGBM model (Supplementary Material 10), as observed in the Spearman correlation analysis. This may explain why the clinicalGBM model and radiomicsGBM model yielded a comparable predictive performance; however, the performance of the combination GBM model did not improve significantly, which emphasizes the importance of the tumor size in distinguishing between GBM and MET. With regard to the features used in the radiomicsMET model, most radiomic features showed low correlations with the clinical-radiological characteristics (Supplementary Material 10); thus, the performance of the combinationMET model improved significantly. This indicated that the radiomic features could complement the clinical factors, and the difference between MET-lung and MET-other could not be accurately recognized using simple tumor phenotypes.
We segmented tumors on post-contrast axial T1-weighted image (T1WI) not on other images, such as T2WI, et al. This is due to the different findings on different MRI images. For low-grade gliomas, they usually show no or partial enhancement, without or with minimal peritumoral edema. They are low signal intensity on post-contrast T1WI. Therefore, it is difficult to outline the border of the tumor on post-contrast T1WI images. On T2WI, however, low-grade gliomas are high signal intensity and prone to the identification of the tumor border. That is why many research studies segmented low-grade gliomas on T2WI (Li et al., 2018a,b; Liu et al., 2018, 2019; Qian et al., 2018). GBM, however, often shows a mass with vivid peritumoral edema. On post-contrast images, the mass usually demonstrates strong enhancement with non-enhanced peritumoral edema. Hence, the tumor mass is high signal while the peritumoral edema is low signal intensity on post-contrast T1WI, which is prone to outline the border of the mass. On T2WI, both the tumor itself and peritumoral edema are hyperintensity. It is difficult to distinguish the tumor from the perilesional edema. If the area of high signal intensity on T2WI is considered as the ROI for segmentation, the ROI would be larger than the tumor itself because the peritumoral edema is also recruited in the ROI. Cerebral metastasis often demonstrates as a mass with obvious edema. On T2WI and post-contrast T1WI, both the metastatic mass and the peritumoral edema show the same findings as that of GBM. Therefore, the radiomic analysis of cerebral metastasis is also based on post-contrast T1WI in some researches (Artzi et al., 2019; Karami et al., 2019a,b).
There are several limitations of this study. First, the radiomic imaging data used were only T1 enhanced sequences. Other sequences, including T2WI, DWI, and PWI, may contain additional functional and biological information; therefore, more imaging modalities should be taken into account for future research. Second, although the number of cases in our study was relatively large, the MET-other cases involved many origins, with each origin having a small case number. More detailed subgroups based on the primary origin of METs should be considered in future studies. Finally, this was a retrospective study. Although we used external validation to reduce the impact, the prospective multi-center study was still required.
Our study suggests that radiomics analysis has a superior classification ability in the differentiation among GBM, MET-lung, and MET-other. The combination of radiomic and non-radiomic features is helpful for the differentiation of these three types of tumors.
The raw data supporting the conclusions of this article will be made available by the authors, without undue reservation.
The studies involving human participants were reviewed and approved by Beijing Tiantan Hospital. Written informed consent for participation was not provided by the participants’ legal guardians/next of kin because: As a retrospective study, it was approved by our institute committee without the informed consent of the patients.
YH and LZ performed the study design, information collection, statistical analysis, and manuscript editing. HZ, YX, and XC guided and study design, reviewed images, and revised the manuscript. SN, SC, and BY provided the technical support. HC, FZ, and YZ collected the images and clinical information. All authors contributed to the article and approved the submitted version.
This work was supported by the National Natural Science Foundation of China under grant number 81772005, the National Key Research and Development Program of China Grant under grant number 2018YFC0115604, and Collaborative innovative major special project supported by Beijing Municipal Science & Technology Commission under grant number Z191100006619088.
The authors declare that the research was conducted in the absence of any commercial or financial relationships that could be construed as a potential conflict of interest.
All claims expressed in this article are solely those of the authors and do not necessarily represent those of their affiliated organizations, or those of the publisher, the editors and the reviewers. Any product that may be evaluated in this article, or claim that may be made by its manufacturer, is not guaranteed or endorsed by the publisher.
The Supplementary Material for this article can be found online at: https://www.frontiersin.org/articles/10.3389/fcell.2021.710461/full#supplementary-material
Aerts, H. J., Velazquez, E. R., Leijenaar, R. T., Parmar, C., Grossmann, P., Carvalho, S., et al. (2014). Decoding tumour phenotype by noninvasive imaging using a quantitative radiomics approach. Nat. Commun. 5:4006. doi: 10.1038/ncomms5006
Artzi, M., Bressler, I., and Ben Bashat, D. (2019). Differentiation between glioblastoma, brain metastasis and subtypes using radiomics analysis. J. Magn. Reson. Imaging 50, 519–528. doi: 10.1002/jmri.26643
Ascha, M. S., Ostrom, Q. T., Wright, J., Kumthekar, P., Bordeaux, J. S., Sloan, A. E., et al. (2019). Lifetime occurrence of brain metastases arising from lung, breast, and skin cancers in the elderly: a SEER-medicare study. Cancer Epidemiol. Biomarkers Prev. 28, 917–925. doi: 10.1158/1055-9965.Epi-18-1116
Askaner, K., Rydelius, A., Engelholm, S., Knutsson, L., Lätt, J., Abul-Kasim, K., et al. (2019). Differentiation between glioblastomas and brain metastases and regarding their primary site of malignancy using dynamic susceptibility contrast MRI at 3T. J. Neuroradiol. 46, 367–372. doi: 10.1016/j.neurad.2018.09.006
Baris, M. M., Celik, A. O., Gezer, N. S., and Ada, E. (2016). Role of mass effect, tumor volume and peritumoral edema volume in the differential diagnosis of primary brain tumor and metastasis. Clin. Neurol. Neurosurg 148, 67–71. doi: 10.1016/j.clineuro.2016.07.008
Chaddad, A., Daniel, P., Desrosiers, C., Toews, M., and Abdulkarim, B. (2019). Novel radiomic features based on joint intensity matrices for predicting glioblastoma patient survival time. IEEE J. Biomed. Health Inform. 23, 795–804. doi: 10.1109/jbhi.2018.2825027
Chakhoyan, A., Raymond, C., Chen, J., Goldman, J., Yao, J., Kaprealian, T. B., et al. (2019). Probabilistic independent component analysis of dynamic susceptibility contrast perfusion MRI in metastatic brain tumors. Cancer Imaging 19:14. doi: 10.1186/s40644-019-0201-0
Chen, X. Z., Yin, X. M., Ai, L., Chen, Q., Li, S. W., and Dai, J. P. (2012). Differentiation between brain glioblastoma multiforme and solitary metastasis: qualitative and quantitative analysis based on routine MR imaging. AJNR Am. J. Neuroradiol. 33, 1907–1912. doi: 10.3174/ajnr.A3106
Durmo, F., Rydelius, A., Baena, S. C., Askaner, K., Lätt, J., Bengzon, J., et al. (2018). Multivoxel 1H-MR spectroscopy biometrics for preoprerative differentiation between brain tumors. Tomography 4, 172–181. doi: 10.18383/j.tom.2018.00051
Füreder, L. M., Dieckmann, B., Hainfellner, K., Bartsch, J. A., Zielinski, R., Preusser, C. C., and Berghoff, A. S. (2018). Brain metastases as first manifestation of advanced cancer: exploratory analysis of 459 patients at a tertiary care center. Clin. Exp. Metastas. 35, 727–738. doi: 10.1007/s10585-018-9947-1
Grabowski, M. M., Recinos, P. F., Nowacki, A. S., Schroeder, J. L., Angelov, L., Barnett, G. H., et al. (2014). Residual tumor volume versus extent of resection: predictors of survival after surgery for glioblastoma. J. Neurosurg. 121, 1115–1123. doi: 10.3171/2014.7.Jns132449
Holly, K. S., Fitz-Gerald, J. S., Barker, B. J., Murcia, D., Daggett, R., Ledbetter, C., et al. (2018). Differentiation of high-grade glioma and intracranial metastasis using volumetric diffusion tensor imaging tractography. World Neurosurg. 120, e131–e141. doi: 10.1016/j.wneu.2018.07.230
Kamimura, K., Nakajo, M., Yoneyama, T., Fukukura, Y., Hirano, H., Goto, Y., et al. (2019). Histogram analysis of amide proton transfer-weighted imaging: comparison of glioblastoma and solitary brain metastasis in enhancing tumors and peritumoral regions. Eur. Radiol. 29, 4133–4140. doi: 10.1007/s00330-018-5832-1
Karami, E., Ruschin, M., Soliman, H., Sahgal, A., Stanisz, G. J., and Sadeghi-Naini, A. (2019a). An MR radiomics framework for predicting the outcome of stereotactic radiation therapy in brain metastasis. Annu. Int. Conf. IEEE Eng. Med. Biol. Soc. 2019, 1022–1025. doi: 10.1109/embc.2019.8856558
Karami, E., Soliman, H., Ruschin, M., Sahgal, A., Myrehaug, S., Tseng, C. L., et al. (2019b). Quantitative MRI biomarkers of stereotactic radiotherapy outcome in brain metastasis. Sci. Rep. 9:19830. doi: 10.1038/s41598-019-56185-5
Kniep, H. C., Madesta, F., Schneider, T., Hanning, U., Schg, S., Tseng, C. L., et al. (2019). Quantitative MRI biomarkers of ste. Radiology 290, 479–487. doi: 10.1148/radiol.2018180946
Lambin, P., Leijenaar, R. T. H., Deist, T. M., Peerlings, J., De Jong, E. E. C., Van Timmeren, J., et al. (2017). Radiomics: the bridge between medical imaging and personalized medicine. Nat. Rev. Clin. Oncol. 14, 749–762. doi: 10.1038/nrclinonc.2017.141
Li, Y., Liu, X., Xu, K., Qian, Z., Wang, K., Fan, X., et al. (2018a). MRI features can predict EGFR expression in lower grade gliomas: a voxel-based radiomic analysis. Eur. Radiol. 28, 356–362. doi: 10.1007/s00330-017-4964-z
Li, Y., Qian, Z., Xu, K., Wang, K., Fan, X., Li, S., et al. (2018b). MRI features predict p53 status in lower-grade gliomas via a machine-learning approach. Neuroimage Clin. 17, 306–311. doi: 10.1016/j.nicl.2017.10.030
Li, Z. C., Bai, H., Sun, Q., Li, Q., Liu, L., Zou, Y., et al. (2018c). Multiregional radiomics features from multiparametric MRI for prediction of MGMT methylation status in glioblastoma multiforme: a multicentre study. Eur. Radiol. 28, 3640–3650. doi: 10.1007/s00330-017-5302-1
Liu, X., Li, Y., Li, S., Fan, X., Sun, Z., Yang, Z., et al. (2019). IDH mutation-specific radiomic signature in lower-grade gliomas. Aging (Albany N. Y.) 11, 673–696. doi: 10.18632/aging.101769
Liu, X., Li, Y., Qian, Z., Sun, Z., Xu, K., Wang, K., et al. (2018). A radiomic signature as a non-invasive predictor of progression-free survival in patients with lower-grade gliomas. Neuroimage Clin. 20, 1070–1077. doi: 10.1016/j.nicl.2018.10.014
Mampre, D., Ehresman, J., Alvarado-Estrada, K., Wijesekera, O., Sarabia-Estrada, R., Quinones-Hinojosa, A., et al. (2019). Propensity for different vascular distributions and cerebral edema of intraparenchymal brain metastases from different primary cancers. J. Neurooncol. 143, 115–122. doi: 10.1007/s11060-019-03142-x
Ohgaki, H., and Kleihues, P. (2005). Epidemiology and etiology of gliomas. Acta Neuropathol. 109, 93–108. doi: 10.1007/s00401-005-0991-y
Ortiz-Ramon, R., Larroza, A., Arana, E., and Moratal, D. (2017). A radiomics evaluation of 2D and 3D MRI texture features to classify brain metastases from lung cancer and melanoma. Annu. Int. Conf. IEEE Eng. Med. Biol. Soc. 2017, 493–496. doi: 10.1109/embc.2017.8036869
Ortiz-Ramón, R., Larroza, A., España, S., Arana, E., and Moratal, D. (2018). Classifying brain metastases by their primary site of origin using a radiomics approach based on texture analysis: a feasibility study. Eur. Radiol. 28, 4514–4523. doi: 10.1007/s00330-018-5463-6
Platta, C. S., Khuntia, D., Mehta, M. P., and Suh, J. H. (2010). Current treatment strategies for brain metastasis and complications from therapeutic techniques: a review of current literature. Am. J. Clin. Oncol. 33, 398–407. doi: 10.1097/COC.0b013e318194f744
Qian, Z., Li, Y., Sun, Z., Fan, X., Xu, K., Wang, K., et al. (2018). Radiogenomics of lower-grade gliomas: a radiomic signature as a biological surrogate for survival prediction. Aging (Albany N. Y.) 10, 2884–2899. doi: 10.18632/aging.101594
Qian, Z., Li, Y., Wang, Y., Li, L., Li, R., Wang, K., et al. (2019). Differentiation of glioblastoma from solitary brain metastases using radiomic machine-learning classifiers. Cancer Lett. 451, 128–135. doi: 10.1016/j.canlet.2019.02.054
Rios Velazquez, E., Parmar, C., Liu, Y., Coroller, T. P., Cruz, G., Stringfield, O., et al. (2017). Somatic mutations drive distinct imaging phenotypes in lung cancer. Cancer Res. 77, 3922–3930. doi: 10.1158/0008-5472.Can-17-0122
Rotta, J. M., Rodrigues, D. B., Diniz, J. M., Abreu, B. M., Kamimura, F., Sousa, U. O., et al. (2018). Analysis of survival in patients with brain metastases treated surgically: impact of age, gender, oncologic status, chemotherapy, radiotherapy, number and localization of lesions, and primary cancer site. Rev. Assoc. Med. Bras. (1992) 64, 717–722. doi: 10.1590/1806-9282.64.08.717
Salice, S., Esposito, R., Ciavardelli, D., Delli Pizzi, S., Di Bastiano, R., and Tartaro, A. (2016). Combined 3 tesla MRI biomarkers improve the differentiation between benign vs. malignant single ring enhancing brain masses. PLoS One 11:e0159047. doi: 10.1371/journal.pone.0159047
Tan, Y., Wang, X. C., Zhang, H., Wang, J., Qin, J. B., Wu, X. F., et al. (2015). Differentiation of high-grade-astrocytomas from solitary-brain-metastases: comparing diffusion kurtosis imaging and diffusion tensor imaging. Eur. J. Radiol. 84, 2618–2624. doi: 10.1016/j.ejrad.2015.10.007
Van Griethuysen, J. J. M., Fedorov, A., Parmar, C., Hosny, A., Aucoin, N., Narayan, V., et al. (2017). Computational radiomics system to decode the radiographic phenotype. Cancer Res. 77, e104–e107. doi: 10.1158/0008-5472.Can-17-0339
Weller, M., Van Den Bent, M., Hopkins, K., Tonn, J. C., Stupp, R., Falini, A., et al. (2014). EANO guideline for the diagnosis and treatment of anaplastic gliomas and glioblastoma. Lancet Oncol. 15, e395–e403. doi: 10.1016/s1470-2045(14)70011-7
Xi, Y. B., Kang, X. W., Wang, N., Liu, T. T., Zhu, Y. Q., Cheng, G., et al. (2019). Differentiation of primary central nervous system lymphoma from high-grade glioma and brain metastasis using arterial spin labeling and dynamic contrast-enhanced magnetic resonance imaging. Eur. J. Radiol. 112, 59–64. doi: 10.1016/j.ejrad.2019.01.008
Keywords: glioblastoma multiforme, metastasis, magnetic resonance imaging, machine learning, radiomics
Citation: Han Y, Zhang L, Niu S, Chen S, Yang B, Chen H, Zheng F, Zang Y, Zhang H, Xin Y and Chen X (2021) Differentiation Between Glioblastoma Multiforme and Metastasis From the Lungs and Other Sites Using Combined Clinical/Routine MRI Radiomics. Front. Cell Dev. Biol. 9:710461. doi: 10.3389/fcell.2021.710461
Received: 16 May 2021; Accepted: 09 August 2021;
Published: 26 August 2021.
Edited by:
José Alexandre Ferreira, Portuguese Oncology Institute, PortugalReviewed by:
Jinrong Qu, Henan Provincial Cancer Hospital, ChinaCopyright © 2021 Han, Zhang, Niu, Chen, Yang, Chen, Zheng, Zang, Zhang, Xin and Chen. This is an open-access article distributed under the terms of the Creative Commons Attribution License (CC BY). The use, distribution or reproduction in other forums is permitted, provided the original author(s) and the copyright owner(s) are credited and that the original publication in this journal is cited, in accordance with accepted academic practice. No use, distribution or reproduction is permitted which does not comply with these terms.
*Correspondence: Hongbo Zhang, aG9uZ2Jvemhhbmc5OUAxNjMuY29t; Yu Xin, eGlueXVAbWFpbC5jY211LmVkdS5jbg==; Xuzhu Chen, cmFkaW9sb2d5ODg4QGFsaXl1bi5jb20=
†These authors share first authorship
Disclaimer: All claims expressed in this article are solely those of the authors and do not necessarily represent those of their affiliated organizations, or those of the publisher, the editors and the reviewers. Any product that may be evaluated in this article or claim that may be made by its manufacturer is not guaranteed or endorsed by the publisher.
Research integrity at Frontiers
Learn more about the work of our research integrity team to safeguard the quality of each article we publish.