 Pei Li
 Benlong Yang1,2†
 Yayun Chi
 Jingyan Xue
 Jiong Wu
- 1Department of Breast Surgery, Fudan University Shanghai Cancer Center, Shanghai, China
- 2Department of Breast Surgery, Key Laboratory of Breast Cancer in Shanghai, Fudan University Shanghai Cancer Center, Shanghai, China
- 3Collaborative Innovation Center for Cancer Medicine, Shanghai, China
Background: New biomarker combinations have been increasingly developed to improve the precision of current diagnostic and therapeutic modalities. Recently, researchers have found that tumor cells are more vulnerable to ferroptosis. Furthermore, ferroptosis-related genes (FRG) are promising therapeutic targets in breast cancer patients. Therefore, this study aimed to identify FRG that could predict disease-specific survival (DSS) in breast cancer patients.
Methods: Gene expression matrix and clinical data were downloaded from public databases. We included 960, 1,900, and 234 patients from the TCGA, METABRIC, and GSE3494 cohorts, respectively. Data for FRG were downloaded from the FerrDb website. Differential expression of FRG was analyzed by comparing the tumors with adjacent normal tissues. Univariate Cox analysis of DSS was performed to identify prognostic FRG. The TCGA-BRCA cohort was used to generate a nine-gene panel with the LASSO cox regression. The METABRIC and GSE3494 cohorts were used to validate the panel. The panel’s median cut-off value was used to divide the patients into high- or low-risk subgroups. Analyses of immune microenvironment, functional pathways, and clinical correlation were conducted via GO and KEGG analyses to determine the differences between the two subgroups.
Results: The DSS of the low-risk subgroup was longer than that of the high-risk subgroup. The panel’s predictive ability was confirmed by ROC curves (TCGA cohort AUC values were 0.806, 0.695, and 0.669 for 2, 3, and 5 years respectively, and the METABRIC cohort AUC values were 0.706, 0.734, and 0.7, respectively for the same periods). The panel was an independent DSS prognostic indicator in the Cox regression analyses. (TCGA cohort: HR = 3.51, 95% CI = 1.792–6.875, p < 0.001; METABRIC cohort: HR = 1.76, 95% CI = 1.283–2.413, p < 0.001). Immune-related pathways were enriched in the high-risk subgroup. The two subgroups that were stratified by the nine-gene panel were also associated with histology type, tumor grade, TNM stage, and Her2-positive and TNBC subtypes. The patients in the high-risk subgroup, whose CTLA4 and PD-1 statuses were both positive or negative, demonstrated a substantial clinical benefit from combination therapy with anti-CTLA4 and anti-PD-1.
Conclusion: The new gene panel consisting of nine FRG may be used to assess the prognosis and immune status of patients with breast cancer. A precise therapeutic approach can also be possible with risk stratification.
Introduction
Breast cancer (BRCA) has entered the era of precision treatment at the molecular level. The molecular hallmarks of BRCA, including ER, PR, HER2, Ki-67, and PD-1, and PD-L1, have been employed for personalized and individualized treatment (Harbeck et al., 2019; Waks and Winer, 2019). For instance, the endocrine therapy, HER2 targeted therapy, and immune checkpoint therapy are employed for ER/PR-positive, Her2-positive, and PD-1/PD-L1-positive BRCA tumors, respectively2.
Since the advancement of microarray and high-throughput sequencing, multi-gene prediction, such as the PAM50 signature (Cheang et al., 2015), 70-gene assay, and 21-gene recurrence score2, has been widely used to guide decision making in the therapeutic approach for various BRCA subtypes. Multi-gene prediction has been commonly used to predict the benefits of chemotherapy or to estimate patient’s prognosis. Thus, new biomarker combinations have been developed to improve the precision of current diagnostic and therapeutic modalities. Currently, researchers are looking for new therapeutic targets and biomarkers for BRCA treatment. Moreover, there is still an insurmountable therapeutic challenge for triple negative breast cancer (TNBC) because therapeutic targets and biomarkers have not yet been identified. A few previous studies found that several ferroptosis-related genes (FRG) could be promising therapeutic targets in BRCA (Hangauer et al., 2017; Zhang et al., 2019), especially for the TNBC subtype (Chen et al., 2017; Zhu et al., 2020; Ding et al., 2021; Zhang et al., 2021). Therefore, it is necessary to develop a panel involving FRG biomarkers for risk stratification and identification of new targets.
Ferroptosis refers to cell death resulting from iron-mediated lipid peroxidation and is characterized by intracellular accumulation of reactive oxygen species (ROS) (Supplementary Figure S3) (Dixon et al., 2012). According to preliminary data, ferroptosis inhibits tumor development and proliferation; hence, ferroptosis can be targeted for cancer therapy (Stockwell et al., 2017). Correspondingly, researchers have increasingly focused on the role of ferroptosis in BRCA, especially in TNBC and Her2-positive BRCA. Due to the high recurrence and metastatic rate, TNBC and Her2-positive BRCA have been regarded as refractory and aggressive BRCA subtypes (Foulkes et al., 2010; Cesca et al., 2020). Ma et al. (Dixon et al., 2012) found that siramesine and lapatinib induced ferroptosis more than other canonical ferroptotic reagents did, implying that lapatinib participated in modulating ferroptosis without targeting EGFR and HER2 (Ma et al., 2016). Moreover, a recent study discovered that neoadjuvant neratinib induced ferroptosis and prevented brain metastasis in Her2-positive BRCA (Nagpal et al., 2019). Furthermore, several studies reported that ferroptosis could be a useful therapeutic target in the treatment of TNBC (Chen et al., 2017; Zhu et al., 2020; Ding et al., 2021; Zhang et al., 2021). It has been found that through the stimulated GCN2-eIF2-ATF4 pathway, CHAC1 degradation of GSH increases cystine-starvation-induced ferroptosis in TNBC cells (Chen et al., 2017). The anti-TNBC impact of DMOCPTL was demonstrated in a cell death method test by triggering ferroptosis via GPX4 ubiquitination (Ding et al., 2021). Chen et al. found that treatment of TNBC cells with holo-Lf increased total iron concentration, boosted ROS production, increased the lipid peroxidation end product malondialdehyde, and improved ferroptosis (Zhang et al., 2021). In addition, chemotherapy, radiotherapy, and immunotherapy were all influenced by ferroptosis; thus, targeting both ferroptosis and the identified biomarkers could be an effective treatment strategy for BRCA (Chen et al., 2021).
The aim of this research was to develop a panel consisting of FRG that could be used to predict the disease-specific survival (DSS) of patients with BRCA and to develop a risk stratification system that could aid diagnosis and provide novel therapeutic strategies.
Materials and Methods
An overview of our methodology is summarized in Figure 1.
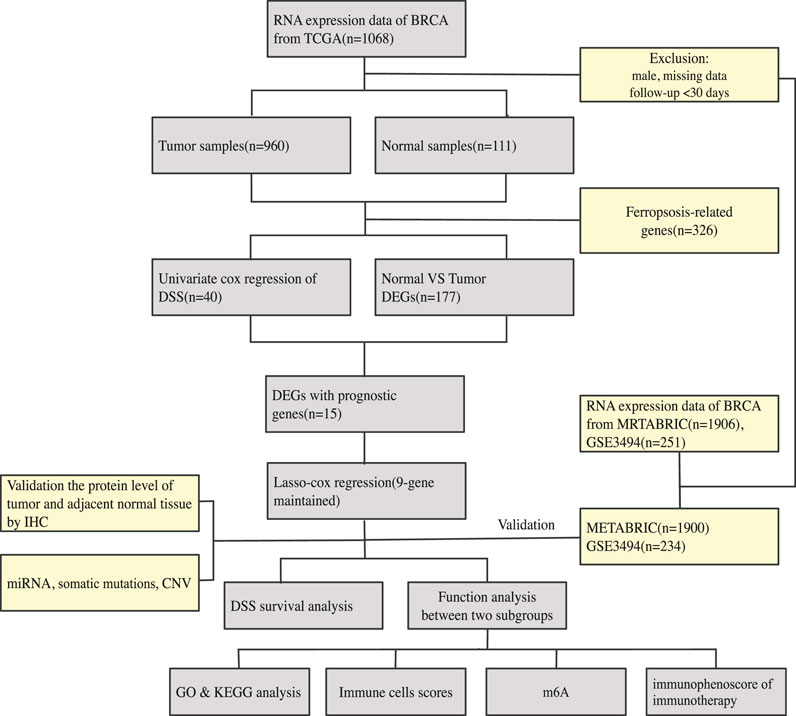
FIGURE 1. An overview of our methodology is summarized.
Acquisition of the Gene, miRNA, and Genome Mutation Data; FRG; and Clinical Data
On January 30, 2021, 1,068 patients with BRCA were identified. Their gene, miRNA, genome mutation data (containing somatic mutations and copy number variations (CNV)), and clinical information were downloaded from the TCGA website. On the same day, the gene expression matrix and clinical data of 1,906 patients with BRCA were downloaded from the cBioPortal website. The patients whose data were obtained from both websites were the same patients involved in the Molecular Taxonomy of BRCA International Consortium (METABRIC) project. Since the data from both websites were open to the public, this study was exempted from obtaining the approval of the local ethics committee. The GSE3494 dataset were downloaded from the Gene Expression Omnibus (GEO) database. The current study adhered to the TCGA, METABRIC, and GEO data access and publishing policies. The exclusion criteria were as follows: male sex, incomplete clinical and gene expression data, and less than 30 days of DSS follow-up. Finally, we included 960, 1,900, and 234 patients from the TCGA, METABRIC, and GSE3494 cohorts, respectively. The baseline features of the three cohorts are presented in Table 1.
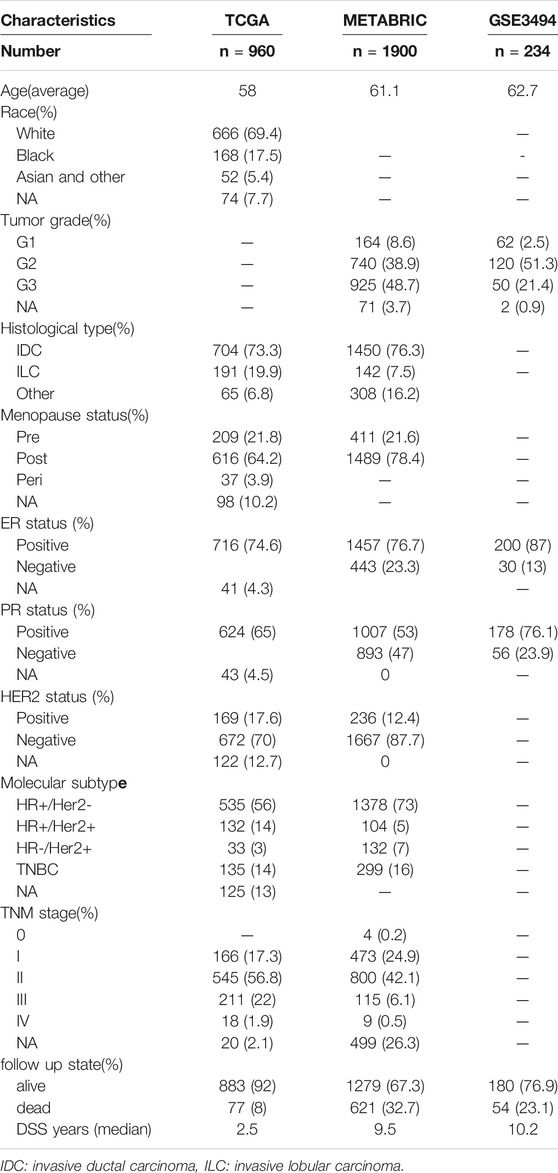
TABLE 1. The baseline features of the TCGA, METABRIC and GSE3494 cohorts.
The list of FRG was downloaded from the FerrDb website. The website divided FRG into three categories: drivers, which stimulate ferroptosis, suppressors, which prevent ferroptosis, and biomarkers, which reveal the presence of ferroptosis (Zhou and FerrDb, 2020). We reviewed the existing literature to identify these genes, and we subsequently ruled out unrelated genes and added newly discovered genes that were related to this study. The immunohistochemistry (IHC) image data of prognostic ferroptotic proteins were downloaded from the Human Protein Atlas (HPA) database.
Identification of Differentially Expressed and Prognostic Genes
Running the “Limma” R package, the TCGA cohort was used to identify differently expressed FRG by comparing the expression levels in tumor and adjacent normal tissues (log FC > 0.5, FDR <0.05). We subsequently used univariate Cox analysis of DSS to identify prognostic FRG. For survival outcomes, DSS event was defined as death due to BRCA, while no event was defined as death due to causes other than BRCA or a living status. The intersect gene set was identified as the FRG that were both differentially expressed and prognostic. The LASSO process was used to pick and shrink the important variables in the regression panel by running the “glmnet” R package (Tibshirani, 1997; Wang and Liu, 2020). The DSS statuses of the TCGA cohort patients were the response variables in the regression, with the matrix of the intersect gene set as the independent variable. The panel’s penalty parameter was calculated using the cross validation, which was multiplied by ten, and the optimal parameter was the λ value that corresponded to the lowest deviation. The patients’ risk scores were calculated using each of the selected gene expressing values, which were multiplied by their coefficients. The formula was as follows:
The patients were classified into the high- or low-risk subgroups according to the median cut-off value of the developed panel. PCA and t-SNE were used to investigate the distribution of the two subgroups by running the “Rtsne” R package. The optimal cut-off expressing values for each gene were determined by running the “survminer” R package. The “ggalluvial” R package was used to portray the Sankey map. The predictive ability of the developed panel was determined by time-dependent receiver operating characteristic (ROC) curves by running the R “timeROC” package. The area under curve (AUC) of the ROC curve was determined to show the sensitivity and specificity of the panel in providing a prognostic efficiency, which varied from 0.5–1. Values that were closer to 1 indicated a good prognostic ability.
To establish the miRNA-FRG regulatory network in BRCA. We put the FRG into the starBase database to identify potential miRNAs (Li et al., 2013). We then conducted an analysis in TCGA-BRCA and adjacent normal tissue to identify the different miRNAs. In addition, we sought candidate miRNAs that were only shared by the two databases to enhance the veracity of the prediction. Finally, the network was visualized using Cytoscape. (Supplementary Figure S2).
The “maftools” and “Rcircos” R packages were used for somatic mutations identification and CNV, respectively.
We looked for publications on m6A methylation regulators in the literature and found 23 of them, with 8 writers (METTL3, METTL14, METTL16, RBM15, RBM15B, WTAP, ZC3H13, VIRMA), 2 erasers (FTO and ALKBH5), and 13 readers (YTHDC1, YTHDC2, YTHDF1, YTHDF3, HNRNPC, FMR1, IGFBP3, RBMX, IGFBP1, YTHDF2, HNRNPA2B1, LRPPRC, and KIAA1429).
Function Enrichment Analysis, single-sample Gene Set Enrichment Analysis (ssGSEA), and immunophenoscore (IPS)
Based on the differentially expressed genes between the two stratified subgroups, Gene Ontology (GO) and Kyoto Encyclopedia of Genes and Genomes (KEGG) analyses were performed by running.
the “clusterProfiler” R package. Differentially expressed genes between the high- and low-risk subgroups were identified (|log2FC| > 1, FDR <0.05). The Benjamini-Hochberg (BH) method was used to adjust the p values.
The “GSVA” R package was used to measure the infiltrating score of 16 immune cells and the activity of 13 immune-related pathways with ssGSEA (Rooney et al., 2015). The Wilcoxon test was also used to look at intergroup variations in putative immunological checkpoints, such as PD-L1, PD-1, and CTLA4. Furthermore, to predict the efficacy of immunotherapy, we downloaded an IPS file of immune checkpoint inhibitors (ICIs) from the Cancer Immunome database; the IPS is a good predictor for responsiveness to CTLA4 and PD-1, and predicts the intergroup differences in response to immunotherapy using CTLA4 and PD-1 blockers (Charoentong et al., 2017).
Statistical Analyses
The gene matrix of tumor and adjacent normal tissues was compared using the Student’s t-test. The Χ2 test was used to compare the proportional differences. The ssGSEA scores of immune cells or pathways were compared between the high- and low-risk subgroups using the Mann-Whitney test with p values that were adjusted by the BH method. The log-rank test was used to compare the DSS of different subgroups using the Kaplan-Meier analysis. The univariate and multivariate Cox regression tests were used to identify independent predictors of DSS. The R program (version 3.6.3) or Statistical Package for the Social Sciences (SPSS), version 20 was used for all statistical analyses. A p value of less than 0.05 was deemed statistically significant, unless otherwise stated, and all p values were two-tailed.
Results
Identification of 177 Differentially Expressed FRG and 40 DSS Prognostic FRG
There were 177 FRG, which were differentially expressed between the tumor and adjacent normal tissues (all FDR <0.05, log FC > 0.5, Figure 2A). In addition, there were 40 FRG, which were associated with DSS (Figure 2A) in the univariate Cox regression study. Moreover, 15 genes were maintained in the intersection of the 177 differentially expressed and 40 prognostic FRG genes. Most of them were upregulated, except for the following genes: ACACB and ALDH3A2 (Figure 2B). CHAC1, SIAH2, MAPT, SFXN2, and ASNS were identified to be the hub genes in the interaction network among these genes. Figure 2D shows the relationship among these genes.
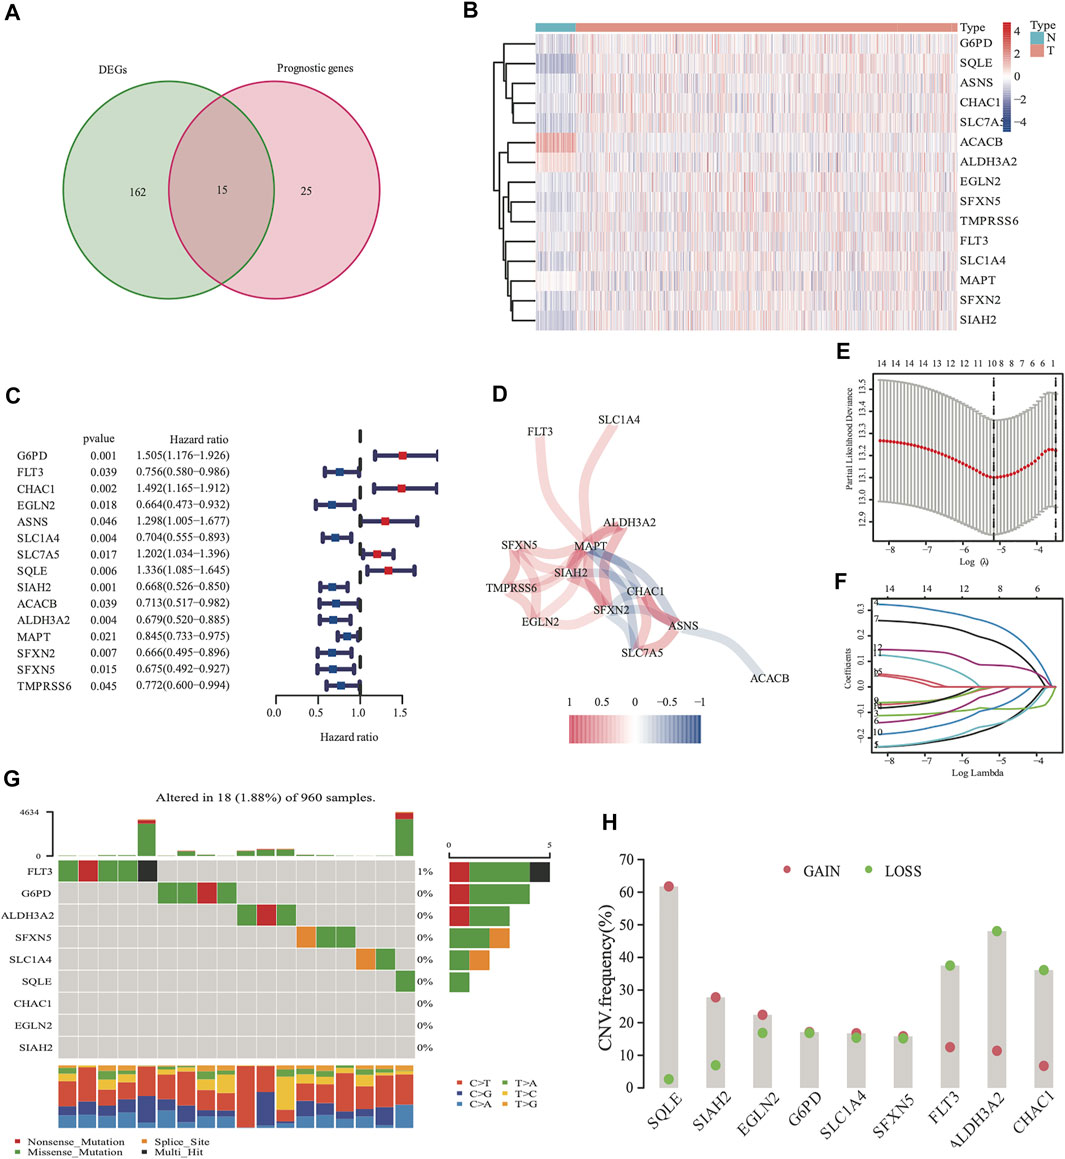
FIGURE 2. Identification of 177 differentially expressed genes (DEGs) and 40 DSS prognostic FRG. A venn diagram was used to identify overlapping genes (A). Heatmap showed that 15 FRG were differentially expressed in breast cancer tissues and non-cancer tissues (B) Forest plots demonstrated the hazard ratio of the univariate cox analyses in DSS (C). The correlation link of the selected genes in TCGA cohort (D). Lasso regression analysis reduced variable (E, F). Somatic mutations on a query of FRG from TCGA cohort (G) The CNV frequency of FRG from the TCGA cohort (H), red dots represent CNV amplification, while green dots represent CNV deletion.
Development of a Prognostic Panel With the TCGA Cohort, and Analysis of Nine FRG Genome Mutations
The expression values of the 15 overlapped genes were used to create a prognostic panel with the LASSO regression analysis. The following formula was used to measure the risk score. The optimum value of λ was used to identify a nine-gene signature (Figures 2E,F).
According to the median cut-off value of the nine-gene panel, patients were classified into the high- (n = 480) and low-risk (n = 480) subgroups. In the TCGA cohort, the risk score was associated with the histological type; HER2, ER, and PR statuses; TNM stage, and molecular subtype (Table 2). Moreover, the high-risk subgroup was positively associated with an advanced TNM stage and Her2-positive and TNBC subtypes (Table 2; Figure 4C). All of these indicators were related to an unfavorable prognosis in BRCA patients (Waks and Winer, 2019). The PCA and t-SNE showed that the patients of these two subgroups were distributed in two directions (Figure 3G and Supplementary Figure S1G). The risk score of patients were positively associated with a higher death toll (Supplementary Figures S1A, 1D). The Kaplan-Meier curve consistently showed that the DSS of the high-risk subgroup was substantially shorter than that of the low-risk subgroup (Figure 3A, p = 0.001). The DSS predictive performance of the nine-gene panel was assessed by ROC curves, and the values of the AUC were 0.806, 0.695, and 0.669 in 2, 3, and 5 years, respectively, in the TCGA cohort (Figure 3D). The IHC staining results also provided the levels of seven (including G6PD, SQLE, CHAC1, ALDH3A2, SIAH2, SLC1A4, and SFXN5) of nine prognostic ferroptotic proteins between BRCA and adjacent normal tissues, consistent with the mRNA expression data (Figure 7).
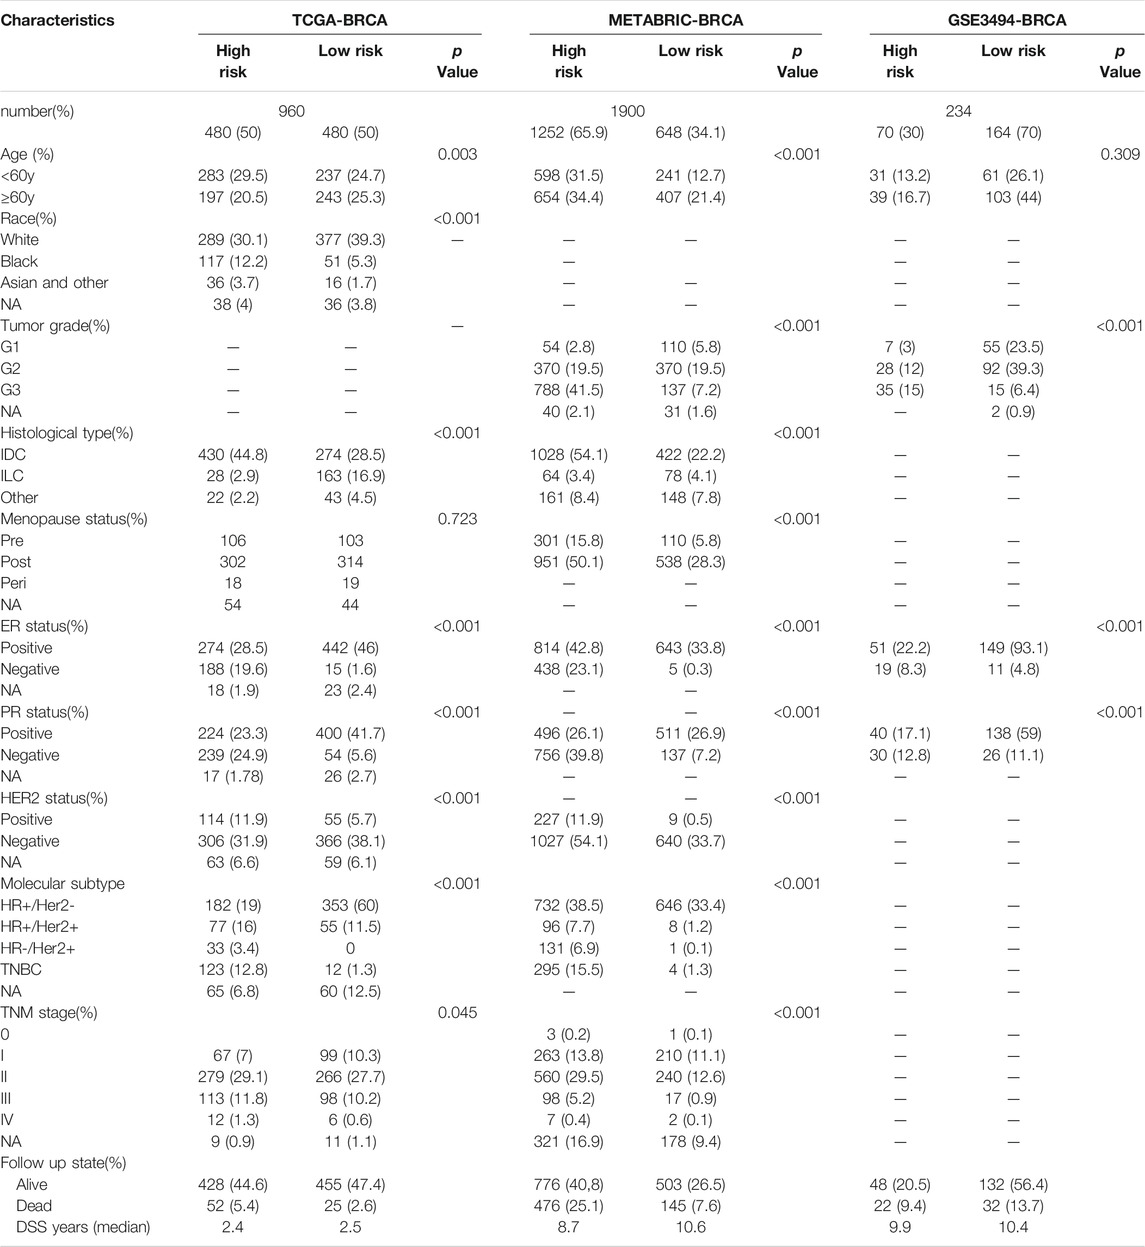
TABLE 2. Clinical features in different risk subgroups.
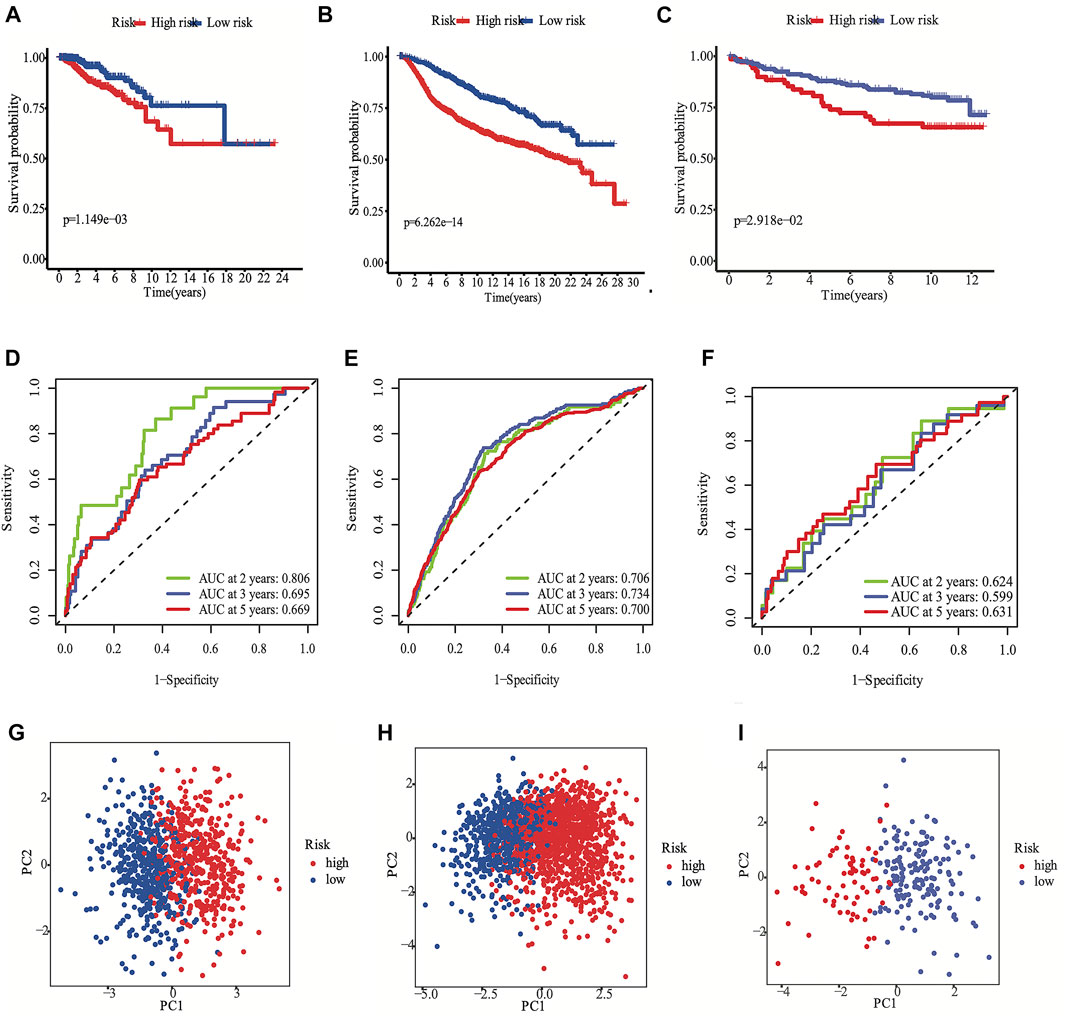
FIGURE 3. Development the prognostic FRG panel in TCGA cohort (A, D, G). Validation the prognostic FRG panel in METABRIC cohort (B, E, H) and GSE3494 cohort (C, F, I). The Kaplan-Meier curve showed that the DSS of the high-risk subgroup was substantially shorter than that of the low-risk subgroup (A, B, C). AUC time-dependent ROC curves for DSS (D, E, F).
Analysis of Nine FRG Genome Mutations and Establishing the miRNA-Nine-FRG Regulatory Network
The somatic mutations and CNV of nine FRG in breast cancer were initially summarized. Only 18 of the 960 patients (1.88%) had mutations in the nine FRG, and the mutation frequencies were zero in eight of nine except FLT3 (1%; Figure 2G). We found that higher frequencies of CNV deletions were in ALDH3A2, FLT3 and CHAC1; conversely, higher probabilities of CNV amplification were in SQLE, SIAH2 and EGLN2 (Figure 2H). Cytoscape showed that the network contains four hub miRNAs (hsa-miR-23a-3p, hsa-miR-378a-3p, hsa-miR-146a-5p, and hsa-miR-146b-5p). (Supplementary Figure S2).
Validation of the Nine-Gene Panel With the METABRIC and GSE3494 Cohorts
The METABRIC and GES3494 cohorts were used to robustly validate the nine-gene panel using the same formula as that used for the construction of the panel using the TCGA cohort. Correspondingly, the nine-gene panel was also associated with the histological type, tumor grade; HER2, ER, and PR statuses; and TNM stage (Table 2). Similarly, the high-risk subgroup was positively associated with a high tumor grade; an advanced TNM stage; and Her2-positive and TNBC subtypes (Table 2). All of the above indicators were related to an unfavorable prognosis in patients with BRCA (Table 2). The death toll of the high-risk subgroup was also more than that of the low-risk subgroup (Figures 3B,C). The PCA and t-SNE analyses also indicated that the two subgroups were spread in discrete directions, which was consistent with the findings obtained from the TCGA cohort (Figures 3H,I and Supplementary Figures S1H, I). Patients in the high-risk subgroup consistently died from the tumor much sooner than those in the low-risk subgroup (Figures 3B,C), as determined by the Kaplan-Meier curve. Furthermore, the AUC of the ROC curve for the nine-gene panel was 0.706 after 2 years, 0.734 after 3 years, and 0.7 after 5 years in the METABRIC and were respectively 0.624, 0.599, and 0.631 in the GSE3494 cohort (Figures 3E,F).
The Nine-Gene Panel has an Independent Prognostic Significance
We conducted univariate and multivariate Cox analyses to test if the nine-gene panel was an independent predictor of DSS. The univariate Cox regression analysis was conducted to reveal obvious linkages between the nine-gene panel and DSS in both the TCGA and METABRIC cohorts (TCGA cohort: HR = 3.555, 95% confidence interval [CI] = 2.253–5.611, p < 0.001; METABRIC cohort: HR = 2.511, 95% CI = 2.075–3.04, p < 0.001; Figure 4A). After controlling other confounding variables in the multivariate cox regression study, the nine-gene panel remained an independent indicator of DSS (TCGA cohort: HR = 3.51, 95% CI = 1.792–6.875, p < 0.001; METABRIC cohort: HR = 1.76, 95% CI = 1.283–2.413, p < 0.001) (Figure 4B). The panel had a high predictive accuracy for DSS and was even better than the statuses of ER, PR, HER2, tumor size, and lymph nodes. It offered a more reliable predictor of 2 years DSS in the TCGA (AUC = 0.806) and the METABRIC cohorts (AUC = 0.706) (Figures 3D,E). As a result, the panel had an outstanding prognostic benefit for patients with BRCA.
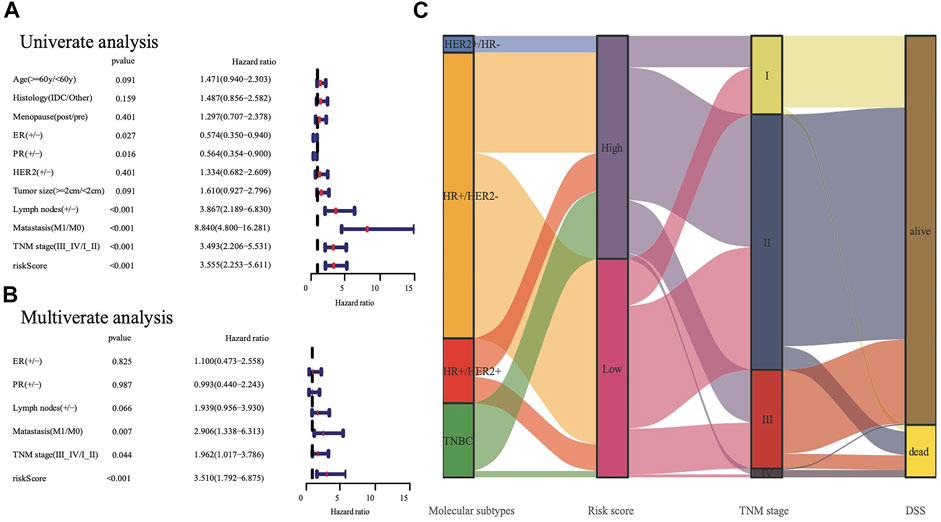
FIGURE 4. The analysis nine gene panel of FRG based on TCGA. The hazard ratio of univariate and multivariate Cox regression analysis (A,B), (+/ -) means (positive/negative). A Sankey map demonstrated the relationship between FRG risk score and molecular subtypes (C).
Functional Studies Between the Stratified Subgroups
To explore the preliminary function of the nine-gene panel, KEGG pathway enrichment and GO function analyses were performed to compare the two stratified subgroups by running the ClusterProfiler R package (adjust p < 0.05, |logFC| > 1). The GO analysis showed that the genes were significantly enriched in immune-related functions (Figures 5A,B), such as humoral immune response, circulating immunoglobulin-mediated human immune response, complement activation, and classical pathways. These pathways functioned in antigen binding, immunoglobulin receptor binding, and chemokine activity. Furthermore, the KEGG analyses showed that the genes were enriched in the IL−17 signaling pathway, viral protein interaction with cytokine and cytokine receptor, and PPAR signaling pathway. IL−17 signaling transduction could regulate PD-1/PD-L1 and the infiltration of CD8+ T cells in patients with BRCA (Shuai et al., 2020), while the PPAR signaling pathway is activated in patients with TNBC (Lin et al., 2021). The PPAR pathway genes from KEGG analysis differentially expressed between two subgroups. Compared with the low risk subgroup, the expression of MMP1, FABP5, FADS2, FABP7, and ME1 were upregulated, UCP1, PLIN5, ADIPOQ, PLIN4, FABP4, and SLC27A2 were downregulated in high risk subgroup (Supplementary Figure S4). Study found that activating MMP1 expression could increases multi-drug resistance in breast cancer (Shen et al., 2017). The FADS2 activity associated with the aromatase drug letrozole in breast cancer cells (Park et al., 2021). The GO and KEGG analyses both showed that all pathways were immune-related.
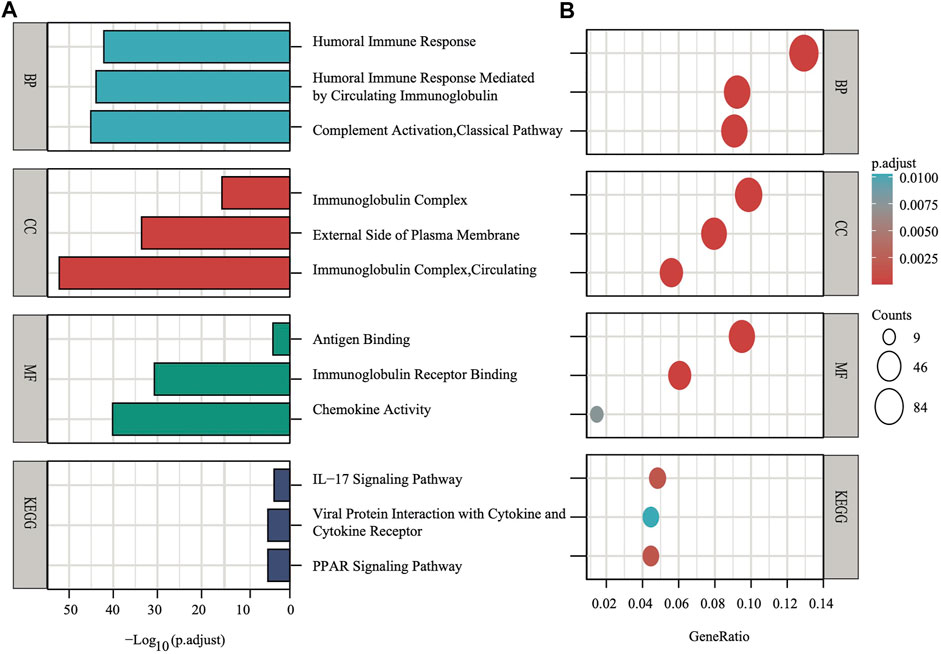
FIGURE 5. The X-axis depicts adjust p values, whereas the Y-axis depicts the enriched mechanism or pathway (A). The X-axis depicts the gene ratio in the overall number of differential expression genes between two subgroups, whereas the Y-axis depicts the enriched mechanism or pathway (B).
Analysis of Immune Cell Enrichment
ssGSEA was used to quantify the scores of various immune cell subpopulations that corresponded to functions and pathways to further investigate the relationship between the nine-gene panel and immune status. Our findings revealed that the types of immune cells were significantly different between the two subgroups (Figures 6A,B). The high-risk subgroup had a significantly higher score than did the low-risk subgroup for most immune cells, including aDCs, CD8+ T, B, dendritic cells, natural killer cells, macrophages, plasmacytoid dendritic cells, T helper, Tfh, Th1 cells, Th2, TIL, and Treg cells, except for the score of mast cells, which was lower (Figures 6A,B). Furthermore, the high-risk subgroup had significantly higher scores for immune functions than did the low-risk subgroup. The immune functions were the check point, type I interferon response, T cell co-stimulation/inhibition, major histocompatibility class I, inflammation promotion, HLA, cytolytic activity, cytokine-cytokine receptor, parainflammation, and antigen presenting cell co-inhibition/stimulation (p < 0.05, Figures 6A,B). Analyses of both the TCGA and the METABRIC cohorts demonstrated that the results of the ssGSEA, GO, and KEGG analyses were consistent with the different immune functions and pathways of the two subgroups.
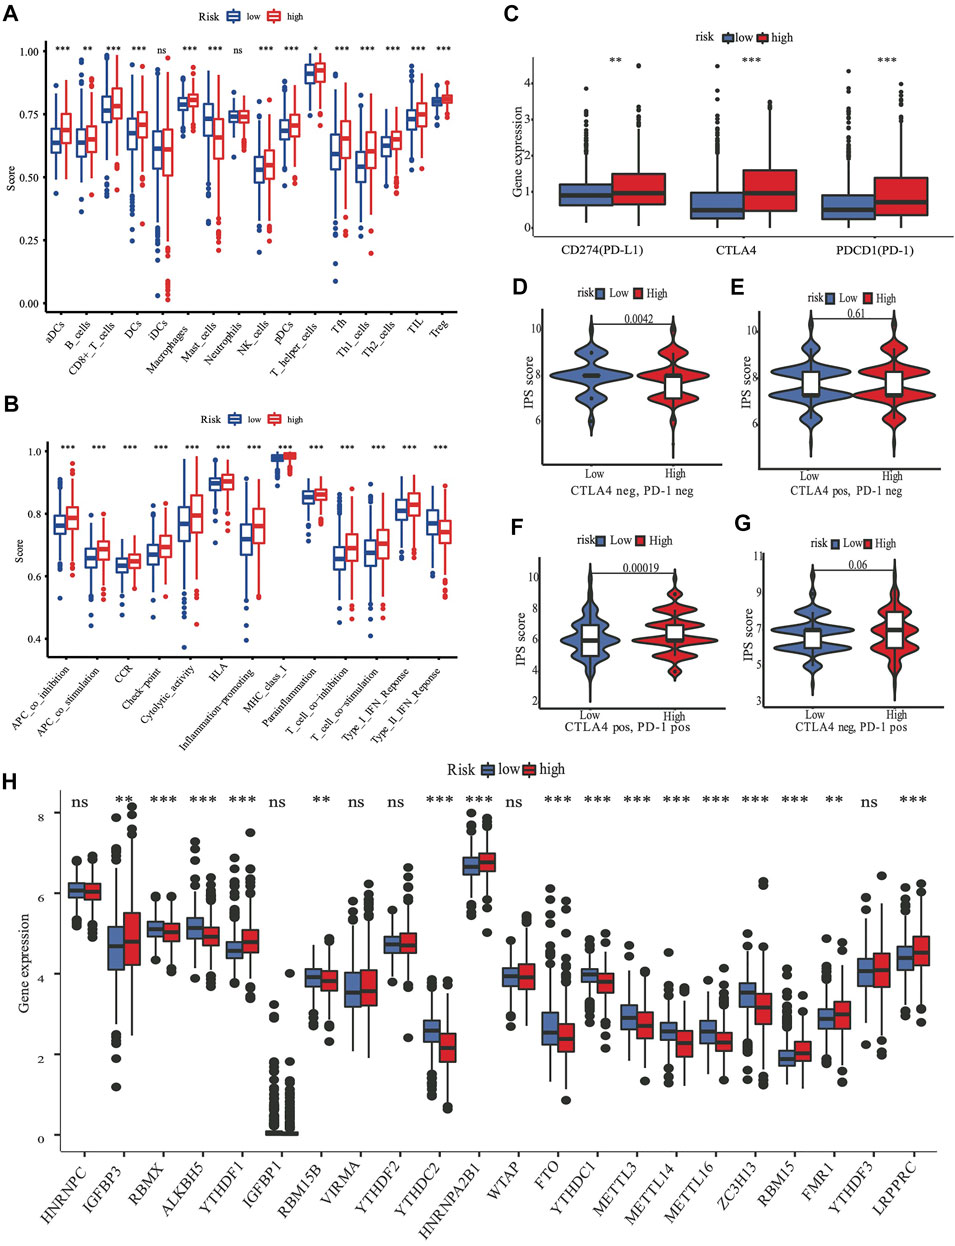
FIGURE 6. The role of nine-gene panel in immunotherapy based on TCGA cohort. Boxplots depict the scores of 16 immune cells (A) and 13 immune-related roles (B) in high and low risk subgroup by“ssGSEA”. Expression of immune checkpoints among high and low subgroups, such as CTLA4, PD-L1, PD-1 (C); The immunophenoscore (IPS) distribution was also compared between high and low risk subgroups (D–G). The gene expression levels of 22 m6A from TCGA cohort between two subgroups (H). (ns, not significant; *p < 0.05; **p < 0.01; ***p < 0.001; pos means positive; neg means negative).
Analysis of m6A Methylation Regulators
A review summarized m6A methylation (Zaccara et al., 2019) regulators that we used for analysis, with 8 writers (VIRMA, ZC3H13, WTAP, METTL14, METTL16, METTL3, RBM15B, and RBM15), two erasers (ALKBH5 and FTO), and 13 readers (YTHDC1, YTHDC2, YTHDF1, YTHDF3, HNRNPC, FMR1, IGFBP3, RBMX, IGFBP1, YTHDF2, HNRNPA2B1, LRPPRC, and KIAA1429). We found substantial variations in the expression of m6A regulators between high and low risk subgroups (Figure 6H). Compared with the low risk subgroup, the expression of IGFBP3,YTHDF1, HNRNPA2B1, RBM15, FMR1, and LRPPRC were upregulated, RBMX, ALKBH5, RBM15B, YTHDC2, FTO, YTHDC1, METTL3, METTL14, METTL16, and ZC3H13 were downregulated in the high risk subgroup.
The Risk Score Was Characterized by Distinct Immunotherapy Landscapes Circumstance
Targeting the immunological checkpoints CTLA4, PD-L1, and PD-1, has made significant progress in recent years in Her2-positive and TNBC patients. Our results showed that the high-risk subgroup was closely associated with Her2-positive and TNBC subtypes (Figure 4C; Table 2). As a result, we looked at the differences in immunological checkpoint expression between the two subgroups. The results showed that patients in the high-risk subgroup displayed a high abundance of PD-1, CTLA4, and PD-L1 (Figure 6C). Given the significant connection between the risk subgroups and immunological response, the response to ICIs treatment represented by CTLA4/PD-1 inhibitors was further examined in terms of immunotherapy across the two subgroups. Patients in the high-risk subgroup showed higher ICIs scores than those in the low-risk subgroup, when the CTLA4 and PD-1 statuses were both positive or negative (Figures 6D–F). This indicated that patients in the high-risk subgroup, whose CTLA4 and PD-1statuses were both positive or negative, demonstrated a substantial clinical benefit from combination therapy with anti-CTLA4 and anti-PD-1. Our results, taken together, clearly indicate that the nine-FRG panel is linked to immunotherapy response.
Discussion
Cell death plays an essential role in the homeostasis of the body. An advantage of cell death is the prevention of the uncontrolled growth and proliferation of cancer cells, which have excessive energy demands to maintain their infinite self-renewal potential. Cancer is associated with alterations in energy metabolism, antioxidants, and intake of iron (Stockwell et al., 2017). Therefore, tumor cells are more vulnerable to iron-induced necrosis, which is also known as ferroptosis, due to their iron-dependent growth mechanism (Dixon et al., 2012).
A few study developed a similar model to predict BRCA prognosis and validated the FRG expression level using cell lines (Zhu et al., 2021a; Wu et al., 2021). However, it did not consider the molecular subtype and was not based on DSS. Further, only three genes in that model (G6PD, FLT3, and SLC1A4) overlapped with those in our DSS model. After the multivariate Cox regression analysis, the ferroptosis-related nine-gene panel that we discovered demonstrated an excellent prognostic prediction capability in the TCGA, METABRIC, and GSE3494 cohorts. The high-risk subgroup was significantly associated with a high tumor grade, an advanced TNM stage, and TNBC and Her2-positive subtypes, which were all related to poor survival and refractory treatment response. Conversely, the low-risk subgroup was positively associated with positive statuses of ER and PR and a negative HER2 status (Table2), which all corresponded to favorable survival outcomes in the traditional classification. Due to the high recurrence and metastatic rate, Her2-positive BRCA and TNBC have been regarded as refractory and aggressive subtypes (Foulkes et al., 2010; Cesca et al., 2020). Hence, researchers are focusing on exploring more therapeutic methods to fill this gap. Several studies suggested that targeting ferroptosis may be a useful therapeutic approach in the treatment of TNBC and Her2-positive BRCA (Chen et al., 2017; Nagpal et al., 2019; Zhu et al., 2020; Ding et al., 2021; Zhang et al., 2021).
The predictive capability of the nine-gene panel was more significant than those of traditional indicators (Figure 4A) in terms of tumor size, lymph node metastasis, and ER/PR and HER2 statuses, especially for TNBC and Her2-positive BRCA subtypes. This finding suggested that treatment could be escalated or de-escalated depending on patients’ risk stratification combined with canonical methods. However, the relationship between the nine genes and ferroptosis needs further exploration. The median follow-up of the TCGA was 2.5 years when the events was only 8% (Table 1), while METABRIC and GSE3494 cohorts were about 10 years, resulting in the AUC value for 3 years and 5 years DSS prediction is lower than the 2 years in TCGA. The nine-gene panel was a more reliable predictor of 2 years DSS in the TCGA (AUC = 0.806), METABRIC (AUC = 0.706), and GSE3494 cohorts (AUC = 0.624) (Figures 3D–F) because it had a high predictive accuracy for DSS, which was even better than those of the statuses of ER, PR, HER2, and lymph nodes as well as tumor size (Figures 4A,B).
A total of nine FRG constituted our panel. These FRG were ALDH3A2, SIAH2, G6PD, SLC1A4, FLT3, SQLE, EGLN2, SFXN5, and CHAC1. G6PD, SQLE, and CHAC1 were unfavorable genes for BRCA prognosis in this gene panel, and they were significantly overexpressed in the tumor compared with levels in the adjacent tissues (Figures 2B, 7). Contrastingly, the other genes were protective. A few studies have discovered that these nine genes are all associated with ferroptosis. The SQLE gene encodes squalene epoxidase to catalyze the oxidation of squalene that could change the lipid profile of tumor cells and protect them from ferroptosis (Garcia-Bermudez et al., 2019). In addition, it is one of the most significantly upregulated genes in many tumors, especially in BRCA (Xu et al., 2020). Moreover, Qin et al. (Shen et al., 2017) found that SQLE mRNA is stabilized by lnc030 in collaboration with poly (rC) binding protein 2(PCBP2), resulting in an increase in cholesterol synthesis. They suggested that targeting SQLE might be a potential mechanism of terbinafine in the treatment of BRCA (Qin et al., 2021). The G6PD gene encodes glucose-6-phosphate dehydrogenase, which produces NADPH to keep the glutathione (GSH) in balance to inhibit ferroptosis. In addition, G6PD eliminates ROS (Hao et al., 2018). Hence, the upregulation of G6PD facilitates cancer development and is thus associated with a poor prognosis in many forms of carcinomas (Ju et al., 2017; Chen et al., 2018; Zhu et al., 2021b). Likewise, the upregulated expression of CHAC1 could prognosticate unfavorable outcomes in BRCA (Goebel et al., 2012; Li et al., 2021). Additionally, CHAC1 has been discovered to decease intracellular GSH levels, enhancing tumor cell ferroptosis (Chen et al., 2017). Moreover, FLT3, ALDH3A2, and SIAH2 gene depletion or deficiency can result in ferroptosis (Kang et al., 2014; Hassannia et al., 2019; Chillappagari et al., 2020). A loss in ALDH3A2 triggers ferroptosis and cooperates with GPX4 inhibition (Yusuf et al., 2020). SIAH2-deficient cells exhibit increased vulnerability to ferroptosis, and re-expression of GPX4 can rescue these cells from ferroptosis (Chillappagari et al., 2020). Equally, EGLN2 knockdown inhibited ferroptosis in mice, researchers validated the mRNA level of prostaglandin-endoperoxide synthase two b y qPCR, it is as a marker for assessing ferroptosis in vivo; and EGLN2 gene could mediate HIF1A downregulation to promote ferroptosis (Yang et al., 2019). Only few researches have focused on SLC1A4 and SFXN5. However, they did not find an association between these genes and ferroptosis. Nonetheless, SLC1A4 may promote ferroptosis and may function as a marker of ferroptosis, according to the FerrDb website data. Moreover, SFXN5 may be involved in cellular iron ion homeostasis (Tifoun et al., 2021). These two genes need further study to confirm their relationship with ferroptosis. Further, these genes are all linked to the promotion or prevention of ferroptosis in various cancers via multiple mechanisms (Supplementary Figure S3); however, it is unclear whether these genes influence the prognosis of BRCA patients through ferroptosis.
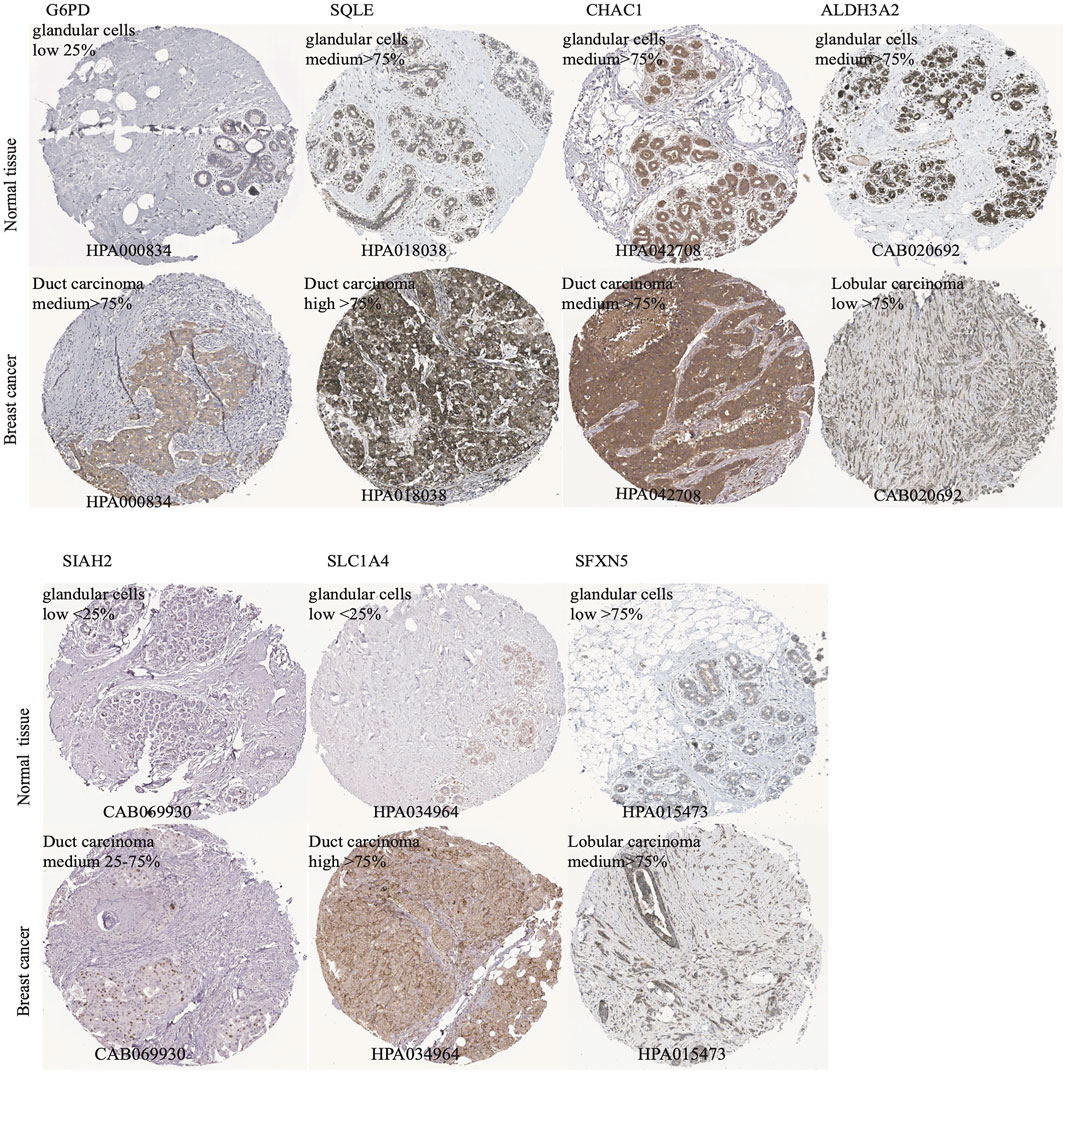
FIGURE 7. The immunohistochemistry (IHC) of ferroptotic prognostic protein images from the HPA database. The G6PD, SQLE, CHAC1, ALDH3A2, SIAH2, SLC1A4, and SFXN5 proteins level in breast cancer and adjcent normal tissues were shown by the IHC staining.
Recently, researchers have been exploring the role of ferroptosis in tumor therapy. However, the possible regulation of tumor immunity and ferroptosis remains a mystery. The idea that immunity stimulates or inhibits cancer cells is widely known, and targeting the immune checkpoint has become a promising and potential therapeutic approach in recent years. Studies that involved the TCGA and METABRIC cohorts revealed that the majority of the types of immune cells in the high-risk subgroup had higher immune scores than did those in the low-risk subgroup, except for mast cells (Figure 6A). Furthermore, the high-risk subgroup also had excessively higher scores for most immune functions (Figure 6B). There may be a crosstalk between the ferroptosis of cancer cells and those of infiltrating immune cells. One theory is that ferroptotic cancer cells emit distinct signals, which cause phagocytosis and induce antigen presentation by dendritic cells (Friedmann Angeli et al., 2019). Meanwhile, the suppression of ferroptotic activity impairs the capacity of CD8+ T and natural killer cells to destroy cells in vivo (Wang et al., 2019).
The results of the GO analysis suggested that many immune-related pathways and biological processes, such as humoral immune response, circulating immunoglobulin-mediated human immune response, complement activation, and classical pathways were enriched. The enriched KEGG pathways were the IL−17 signaling pathway and the PPAR signaling pathway (Figures 5A,B). The IL−17 signaling transduction regulated the infiltration of CD8+ T cells and PD-1/PD-L1 in BRCA patients (Shuai et al., 2020), while the PPAR signaling pathway was activated in TNBC patients (Lin et al., 2021). Our results demonstrated that the TNBC subtypes (91% in TCGA, 98.7% in METABRIC, Figure 4C) were mostly found in the high-risk subgroup (Table2). The clinical trial of combination anti-PD-1/PD-L1 showed that the progression-free survival was significantly improved in TNBC patients with metastasis (Cortes et al., 2020). The mechanism of anti-PD-L1 antibodies was to trigger ferroptosis, which subsequently enhanced the efficacy of immunotherapy (Wang et al., 2019). The resistance to anti-PD-1/PD-L1 in TNBC cells inhibited ferroptosis and changed the proportion of macrophage cells (Jiang et al., 2021). Therefore, ferroptosis may be induced through changes in the immune system. According to our panel, BRCA patients are stratified into the high- and low-risk subgroups. The patients in the high risk subgroup, whose CTLA4 and PD-1statuses were both positive or negative, demonstrated a substantial clinical benefit from combination therapy with anti-CTLA4 and anti-PD-1 (Figures 6D,F). Therefore, the high-risk subgroup should be administered intensive treatment or immunotherapies, whereas the low-risk subgroup should be administered de-escalated treatment. The relationship between immunity and ferroptosis has not been thoroughly clarified. However, there might be a strong relationship between the immune microenvironment of the tumor and ferroptosis in BRCA patients. Thus, further research is needed to validate the above findings.
Our study has several limitations. First, since ferroptosis research is a new and rapidly expanding field, more FRG are likely to be discovered in the future. Second, because of the observed heterogeneity between different populations, the findings of this retrospective and cross-cohort research need validation by further prospective reviews involving multicenter cohorts. Third, since the data were downloaded from public databases, several important clinical details were not accessible. These inaccessible data included chemotherapy regimens, drug information, and tumor burden, and the lack of these data limited a more in-depth comparison among the TCGA, METABRIC, and GSE3494 data. Finally, since the results are based on RNA sequence, verification of protein expression in terms of immunohistochemistry is needed to conveniently apply our findings in clinical practice.
Conclusion
We constructed a DSS prognostic prediction panel involving nine FRG genes in BRCA. This panel was based on FRG and DSS events. In the TCGA, METABRIC, and GSE3494 cohorts, our panel was independently correlated with DSS prognosis. We also found that the tumor immune microenvironment and ferroptosis may have a strong inherent connection with BRCA. This panel could be used to evaluate prognosis and to select patients for escalation/de-escalation treatment. Our research provides a preliminary theory for clinically individualized therapy by targeting ferroptosis genes.
Data Availability Statement
Publicly available datasets were analyzed in this study. This data can be found here: https://portal.gdc.cancer.gov/repository http://www.cbioportal.org/study/summary?id=brca_metabric https://www.ncbi.nlm.nih.gov/gds/?term=GSE3494.
Ethics Statement
Ethical review and approval was not required for the study on human participants in accordance with the local legislation and institutional requirements. Written informed consent for participation was not required for this study in accordance with the national legislation and the institutional requirements. Written informed consent was not obtained from the individual(s) for the publication of any potentially identifiable images or data included in this article.
Author Contributions
PL and BY planned and analyzed the study, and wrote the paper; YC, BX assisted in the study. JX and JW revise the manuscript. The final manuscript was read and accepted by all contributors.
Funding
The National Natural Science Foundation of China (82072920) and China’s National Key R&D Program funded this research (2017YFC1311004).
Conflict of Interest
The authors declare that the research was conducted in the absence of any commercial or financial relationships that could be construed as a potential conflict of interest.
Publisher’s Note
All claims expressed in this article are solely those of the authors and do not necessarily represent those of their affiliated organizations, or those of the publisher, the editors and the reviewers. Any product that may be evaluated in this article, or claim that may be made by its manufacturer, is not guaranteed or endorsed by the publisher.
Acknowledgments
We would like to thank Hongda Pan for his guidance on computer software operation and code usage. We would like to thank Editage for English language editing.
Supplementary Material
The Supplementary Material for this article can be found online at: https://www.frontiersin.org/articles/10.3389/fcell.2021.709180/full#supplementary-material
References
Cesca, M. G., Vian, L., Cristóvão-Ferreira, S., Pondé, N., and de Azambuja, E. (2020). HER2-positive Advanced Breast Cancer Treatment in 2020. Cancer Treat. Rev. 88, 102033. doi:10.1016/j.ctrv.2020.102033
Charoentong, P., Finotello, F., Angelova, M., Mayer, C., Efremova, M., Rieder, D., et al. (2017). Pan-cancer Immunogenomic Analyses Reveal Genotype-Immunophenotype Relationships and Predictors of Response to Checkpoint Blockade. Cel Rep. 18, 248–262. doi:10.1016/j.celrep.2016.12.019
Cheang, M. C. U., Martin, M., Nielsen, T. O., Prat, A., Voduc, D., Rodriguez‐Lescure, A., et al. (2015). Defining Breast Cancer Intrinsic Subtypes by Quantitative Receptor Expression. The Oncologist 20, 474–482. doi:10.1634/theoncologist.2014-0372
Chen, M.-S., Wang, S.-F., Hsu, C.-Y., Yin, P.-H., Yeh, T.-S., Lee, H.-C., et al. (2017). CHAC1 Degradation of Glutathione Enhances Cystine-Starvation-Induced Necroptosis and Ferroptosis in Human Triple Negative Breast Cancer Cells via the GCN2-eIF2α-ATF4 Pathway. Oncotarget 8, 114588–114602. doi:10.18632/oncotarget.23055
Chen, X., Kang, R., Kroemer, G., and Tang, D. (2021). Broadening Horizons: the Role of Ferroptosis in Cancer. Nat. Rev. Clin. Oncol. 18, 280-296. doi:10.1038/s41571-020-00462-0
Chen, X., Xu, Z., Zhu, Z., Chen, A., Fu, G., Wang, Y., et al. (2018). Modulation of G6PD Affects Bladder Cancer via ROS Accumulation and the AKT Pathway In Vitro. Int. J. Oncol. 53, 1703–1712. doi:10.3892/ijo.2018.4501
Chillappagari, S., Belapurkar, R., Möller, A., Molenda, N., Kracht, M., Rohrbach, S., et al. (2020). SIAH2-mediated and Organ-specific Restriction of HO-1 Expression by a Dual Mechanism. Sci. Rep. 10, 2268. doi:10.1038/s41598-020-59005-3
Cortes, J., Cescon, D. W., Rugo, H. S., Nowecki, Z., Im, S. A., Yusof, M. M., et al. (2020). Pembrolizumab Plus Chemotherapy versus Placebo Plus Chemotherapy for Previously Untreated Locally Recurrent Inoperable or Metastatic Triple-Negative Breast Cancer (KEYNOTE-355): a Randomised, Placebo-Controlled, Double-Blind, Phase 3 Clinical Trial. Lancet 396, 1817–1828. doi:10.1016/S0140-6736(20)32531-9
Ding, Y., Chen, X., Liu, C., Ge, W., Wang, Q., Hao, X., et al. (2021). Identification of a Small Molecule as Inducer of Ferroptosis and Apoptosis through Ubiquitination of GPX4 in Triple Negative Breast Cancer Cells. J. Hematol. Oncol. 14, 19. doi:10.1186/s13045-020-01016-8
Dixon, S. J., Lemberg, K. M., Lamprecht, M. R., Skouta, R., Zaitsev, E. M., Gleason, C. E., et al. (2012). Ferroptosis: an Iron-dependent Form of Nonapoptotic Cell Death. Cell 149, 1060–1072. doi:10.1016/j.cell.2012.03.042
Foulkes, W. D., Smith, I. E., and Reis-Filho, J. S. (2010). Triple-negative Breast Cancer. N. Engl. J. Med. 363, 1938–1948. doi:10.1056/nejmra1001389
Friedmann Angeli, J. P., Krysko, D. V., and Conrad, M. (2019). Ferroptosis at the Crossroads of Cancer-Acquired Drug Resistance and Immune Evasion. Nat. Rev. Cancer 19, 405–414. doi:10.1038/s41568-019-0149-1
Garcia-Bermudez, J., Baudrier, L., Bayraktar, E. C., Shen, Y., La, K., Guarecuco, R., et al. (2019). Squalene Accumulation in Cholesterol Auxotrophic Lymphomas Prevents Oxidative Cell Death. Nature 567, 118–122. doi:10.1038/s41586-019-0945-5
Goebel, G., Berger, R., Strasak, A. M., Egle, D., Müller-Holzner, E., Schmidt, S., et al. (2012). Elevated mRNA Expression of CHAC1 Splicing Variants Is Associated with Poor Outcome for Breast and Ovarian Cancer Patients. Br. J. Cancer 106, 189–198. doi:10.1038/bjc.2011.510
Hangauer, M. J., Viswanathan, V. S., Ryan, M. J., Bole, D., Eaton, J. K., Matov, A., et al. (2017). Drug-tolerant Persister Cancer Cells Are Vulnerable to GPX4 Inhibition. Nature 551, 247–250. doi:10.1038/nature24297
Hao, S., Liang, B., Huang, Q., Dong, S., Wu, Z., He, W., et al. (2018). Metabolic Networks in Ferroptosis. Oncol. Lett. 15, 5405–5411. doi:10.3892/ol.2018.8066
Harbeck, N., Penault-Llorca, F., Cortes, J., Gnant, M., Houssami, N., Poortmans, P., et al. (2019). Breast Cancer. Nat. Rev. Dis. Primers 5, 66. doi:10.1038/s41572-019-0111-2
Hassannia, B., Vandenabeele, P., and Vanden Berghe, T. (2019). Targeting Ferroptosis to Iron Out Cancer. Cancer Cell 35, 830–849. doi:10.1016/j.ccell.2019.04.002
Jiang, Z., Lim, S-O., Yan, M., Hsu, J. L., Yao, J., Wei, Y., et al. (2021). TYRO3 Induces Anti-PD-1/pd-L1 Therapy Resistance by Limiting Innate Immunity and Tumoral Ferroptosis. J. Clin. Invest. 131, e139434. doi:10.1172/jci139434
Ju, H.-Q., Lu, Y.-X., Wu, Q.-N., Liu, J., Zeng, Z.-L., Mo, H.-Y., et al. (2017). Disrupting G6PD-Mediated Redox Homeostasis Enhances Chemosensitivity in Colorectal Cancer. Oncogene 36, 6282–6292. doi:10.1038/onc.2017.227
Kang, Y., Tiziani, S., Park, G., Kaul, M., and Paternostro, G. (2014). Cellular protection Using Flt3 and PI3Kα Inhibitors Demonstrates Multiple Mechanisms of Oxidative Glutamate Toxicity. Nat. Commun. 5, 3672. doi:10.1038/ncomms4672
Li, D., Liu, S., Xu, J., Chen, L., Xu, C., Chen, F., et al. (2021). Ferroptosis-related Gene CHAC1 Is a Valid Indicator for the Poor Prognosis of Kidney Renal clear Cell Carcinoma. J. Cel Mol Med 27, 3610-3621. doi:10.1111/jcmm.16458
Li, J.-H., Liu, S., Zhou, H., Qu, L.-H., and Yang, J.-H. (2013). starBase v2.0: Decoding miRNA-ceRNA, miRNA-ncRNA and Protein-RNA Interaction Networks from Large-Scale CLIP-Seq Data. Nucl. Acids Res. 42, D92–D97. doi:10.1093/nar/gkt1248
Lin, Y., Lin, L., Fu, F., Wang, C., Hu, A., Xie, J., et al. (2021). Quantitative Proteomics Reveals Stage-specific Protein Regulation of Triple Negative Breast Cancer. Breast Cancer Res. Treat. 185, 39–52. doi:10.1007/s10549-020-05916-8
Ma, S., Henson, E. S., Chen, Y., and Gibson, S. B. (2016). Ferroptosis Is Induced Following Siramesine and Lapatinib Treatment of Breast Cancer Cells. Cell Death Dis 7–e2307. doi:10.1038/cddis.2016.208
Nagpal, A., Redvers, R. P., Ling, X., Ayton, S., Fuentes, M., Tavancheh, E., et al. (2019). Neoadjuvant Neratinib Promotes Ferroptosis and Inhibits Brain Metastasis in a Novel Syngeneic Model of Spontaneous HER2+ve Breast Cancer Metastasis. Breast Cancer Res. 21, 94. doi:10.1186/s13058-019-1177-1
Park, H. G., Kim, J. H., Dancer, A. N., Kothapalli, K. S., and Brenna, J. T. (2021). The Aromatase Inhibitor Letrozole Restores FADS2 Function in ER+ MCF7 Human Breast Cancer Cells. Prostaglandins, Leukot. Essent. Fatty Acids 171, 102312. doi:10.1016/j.plefa.2021.102312
Qin, Y., Hou, Y., Liu, S., Zhu, P., Wan, X., Zhao, M., et al. (2021). A Novel Long Non‐Coding RNA Lnc030 Maintains Breast Cancer Stem Cell Stemness by Stabilizing SQLE mRNA and Increasing Cholesterol Synthesis. Adv. Sci. 8, 2002232. doi:10.1002/advs.202002232
Rooney, M. S., Shukla, S. A., Wu, C. J., Getz, G., and Hacohen, N. (2015). Molecular and Genetic Properties of Tumors Associated with Local Immune Cytolytic Activity. Cell 160, 48–61. doi:10.1016/j.cell.2014.12.033
Shen, C.-J., Kuo, Y.-L., Chen, C.-C., Chen, M.-J., and Cheng, Y.-M. (2017). MMP1 Expression Is Activated by Slug and Enhances Multi-Drug Resistance (MDR) in Breast Cancer. PLoS One 12, e0174487. doi:10.1371/journal.pone.0174487
Shuai, C., Yang, X., Pan, H., and Han, W. (2020). Estrogen Receptor Downregulates Expression of PD-1/pd-L1 and Infiltration of CD8+ T Cells by Inhibiting IL-17 Signaling Transduction in Breast Cancer. Front. Oncol. 10, 582863. doi:10.3389/fonc.2020.582863
Stockwell, B. R., Friedmann Angeli, J. P., Bayir, H., Bush, A. I., Conrad, M., Dixon, S. J., et al. (2017). Ferroptosis: A Regulated Cell Death Nexus Linking Metabolism, Redox Biology, and Disease. Cell 171, 273–285. doi:10.1016/j.cell.2017.09.021
Tibshirani, R. (1997). The Lasso Method for Variable Selection in the Cox Model. Statist. Med. 16, 385–395. doi:10.1002/(sici)1097-0258(19970228)16:4<385:aid-sim380>3.0.co;2-3
Tifoun, N., De Las Heras, J. M., Guillaume, A., Bouleau, S., Mignotte, B., and Le Floch, N. (2021). Insights into the Roles of the Sideroflexins/SLC56 Family in Iron Homeostasis and Iron-Sulfur Biogenesis. Biomedicines 9, 103. doi:10.3390/biomedicines9020103
Waks, A. G., and Winer, E. P. (2019). Breast Cancer Treatment: A Review. JAMA 321, 288–300. doi:10.1001/jama.2018.19323
Wang, W., and Liu, W. (2020). Integration of Gene Interaction Information into a Reweighted Lasso-Cox Model for Accurate Survival Prediction. Bioinformatics 26. 5405-5414. doi:10.1093/bioinformatics/btaa1046
Wang, W., Green, M., Choi, J. E., Gijón, M., Kennedy, P. D., Johnson, J. K., et al. (2019). CD8+ T Cells Regulate Tumour Ferroptosis during Cancer Immunotherapy. Nature 569, 270–274. doi:10.1038/s41586-019-1170-y
Wu, Z.-H., Tang, Y., Yu, H., and Li, H.-D. (2021). The Role of Ferroptosis in Breast Cancer Patients: a Comprehensive Analysis. Cell Death Discov. 7, 93. doi:10.1038/s41420-021-00473-5
Xu, H., Zhou, S., Tang, Q., Xia, H., and Bi, F. (2020). Cholesterol Metabolism: New Functions and Therapeutic Approaches in Cancer. Biochim. Biophys. Acta (Bba) - Rev. Cancer 1874, 188394. doi:10.1016/j.bbcan.2020.188394
Yang, M., Chen, P., Liu, J., Zhu, S., Kroemer, G., Klionsky, D. J., et al. (2019). Clockophagy Is a Novel Selective Autophagy Process Favoring Ferroptosis. Sci. Adv. 5, eaaw2238. doi:10.1126/sciadv.aaw2238
Yusuf, R. Z., Saez, B., Sharda, A., van Gastel, N., Yu, V. W. C., Baryawno, N., et al. (2020). Aldehyde Dehydrogenase 3a2 Protects AML Cells from Oxidative Death and the Synthetic Lethality of Ferroptosis Inducers. Blood 136, 1303–1316. doi:10.1182/blood.2019001808
Zaccara, S., Ries, R. J., and Jaffrey, S. R. (2019). Reading, Writing and Erasing mRNA Methylation. Nat. Rev. Mol. Cel Biol 20, 608–624. doi:10.1038/s41580-019-0168-5
Zhang, H. S., Zhang, Z. G., Du, G. Y., Sun, H. L., Liu, H. Y., Zhou, Z., et al. (2019). Nrf2 Promotes Breast Cancer Cell Migration via Up‐regulation of G6PD/HIF‐1α/Notch1 axis. J. Cel Mol Med 23, 3451–3463. doi:10.1111/jcmm.14241
Zhang, Z., Lu, M., Chen, C., Tong, X., Li, Y., Yang, K., et al. (2021). Holo-lactoferrin: the Link between Ferroptosis and Radiotherapy in Triple-Negative Breast Cancer. Theranostics 11, 3167–3182. doi:10.7150/thno.52028
Zhou, N., and FerrDb, Bao. J. (2020). A Manually Curated Resource for Regulators and Markers of Ferroptosis and Ferroptosis-Disease Associations. Database 2020, baaa021. doi:10.1093/database/baaa021
Zhu, J., Dai, P., Liu, F., Li, Y., Qin, Y., Yang, Q., et al. (2020). Upconverting Nanocarriers Enable Triggered Microtubule Inhibition and Concurrent Ferroptosis Induction for Selective Treatment of Triple-Negative Breast Cancer. Nano Lett. 20, 6235–6245. doi:10.1021/acs.nanolett.0c00502
Zhu, L., Tian, Q., Jiang, S., Gao, H., Yu, S., Zhou, Y., et al. (2021). A Novel Ferroptosis-Related Gene Signature for Overall Survival Prediction in Patients with Breast Cancer. Front. Cel Dev. Biol. 9, 670184. doi:10.3389/fcell.2021.670184
Keywords: breast cancer, ferroptosis, prognosis model, immune status, disease-specific survival
Citation: Li P, Yang B, Xiu B, Chi Y, Xue J and Wu J (2021) Development and Validation of a Robust Ferroptosis-Related Gene Panel for Breast Cancer Disease-Specific Survival. Front. Cell Dev. Biol. 9:709180. doi: 10.3389/fcell.2021.709180
Received: 13 May 2021; Accepted: 02 November 2021;
Published: 25 November 2021.
Edited by:
Maryam Mehrpour, Université Paris Descartes, FranceReviewed by:
Binghao Zhao, Peking Union Medical College Hospital (CAMS), ChinaYi Jin, Central South University, China
Copyright © 2021 Li, Yang, Xiu, Chi, Xue and Wu. This is an open-access article distributed under the terms of the Creative Commons Attribution License (CC BY). The use, distribution or reproduction in other forums is permitted, provided the original author(s) and the copyright owner(s) are credited and that the original publication in this journal is cited, in accordance with accepted academic practice. No use, distribution or reproduction is permitted which does not comply with these terms.
*Correspondence: Jingyan Xue, eHVlanlAMTYzLmNvbQ==; Jiong Wu, d3VqaW9uZzExMjJAdmlwLnNpbmEuY29t
†These authors have contributed equally to this work and share first authorship