 Mahboobeh Amoushahi
 Karin Lykke-Hartmann
- 1Department of Biomedicine, Aarhus University, Aarhus, Denmark
- 2Department of Clinical Medicine, Aarhus University, Aarhus, Denmark
- 3Department of Clinical Genetics, Aarhus University Hospital, Aarhus, Denmark
Women with cancer and low ovarian reserves face serious challenges in infertility treatment. Ovarian tissue cryopreservation is currently used for such patients to preserve fertility. One major challenge is the activation of dormant ovarian follicles, which is hampered by our limited biological understanding of molecular determinants that activate dormant follicles and help maintain healthy follicles during growth. Here, we investigated the transcriptomes of oocytes isolated from dormant (primordial) and activated (primary) follicles under in vivo and in vitro conditions. We compared the biological relevance of the initial molecular markers of mature metaphase II (MII) oocytes developed in vivo or in vitro. The expression levels of genes involved in the cell cycle, signal transduction, and Wnt signaling were highly enriched in oocytes from primary follicles and MII oocytes. Interestingly, we detected strong downregulation of the expression of genes involved in mitochondrial and reactive oxygen species (ROS) production in oocytes from primordial follicles, in contrast to oocytes from primary follicles and MII oocytes. Our results showed a dynamic pattern in mitochondrial and ROS production-related genes, emphasizing their important role(s) in primordial follicle activation and oocyte maturation. The transcriptome of MII oocytes showed a major divergence from that of oocytes of primordial and primary follicles.
Introduction
Laparoscopic ovariectomy and subsequent cryopreservation of ovarian tissue is a standard procedure for female cancer patients undergoing potentially sterilizing chemotherapy and/or radiotherapy. Ovarian tissue cryopreservation is the only available technique for preserving the fertility of women; however, it remains an experimental method. Moreover, laparoscopic ovariectomy has been used to stimulate ovarian follicles for infertility treatment (Kawamura et al., 2013). As a means to optimize the options for these patients, a cell culture system that supports the growth and development of oocytes from the human ovarian cortex has been reported (Telfer, 2019b). However, our knowledge of the in vitro activation of dormant follicles is lacking; thus, the in vitro growth of follicles is difficult and inefficient. Culturing human follicles is very challenging (Telfer, 2019a). In mice, oocytes grown in vitro from primordial follicles have resulted in the production of live offspring (Xu et al., 2006; Wang et al., 2011; Mochida et al., 2013; Higuchi et al., 2015) and, thus, represent a promising translational approach for these patients (Telfer, 2019a). Primordial follicle activation involves major growth of oocytes, associated with the proliferation of the surrounding flattened pregranulosa cells and transformation to cuboidal cells (Rodgers and Irving-Rodgers, 2010). Several studies have identified the PI3K–PTEN–AKT–FOXO3 signaling pathway as the main non-gonadotrophic growth factor signaling pathway that regulates the activation of primordial follicles (Castrillon et al., 2003; Salmena et al., 2008; Ernst et al., 2017, 2018; Maidarti et al., 2019, 2020). Mechanistically, the activation of primordial follicles is triggered by elevated PIP3 levels in the oocyte (Liu et al., 2006), a balance strongly counteracted by PTEN. PTEN inhibits PI3K signaling activation (Jagarlamudi et al., 2009). Similarly, FOXO3a, as a downstream effector, inhibits primordial follicle activation by suppressing this pathway (Castrillon et al., 2003). Despite this molecular knowledge, attempts to use AKT stimulators and PTEN inhibitors were deleterious for follicle quality (Maidarti et al., 2020), and inhibition of PTEN increased DNA damage and reduced the DNA repair response in bovine oocytes (Maidarti et al., 2019). This pharmacological inhibition of PTEN during the in vitro development of human follicles revealed that although primordial follicles were activated, their growth was compromised (McLaughlin et al., 2014). The oocyte genome must retain its integrity, which is fundamental for in vitro follicle development as a clinical approach for young cancer patients. If primordial follicles are inappropriately activated, DNA and gene expression may be compromised, which could decrease oocyte quality. To obtain high-quality oocytes from in vitro development, we must elucidate the molecular mechanisms that underlie this complex activation step of primordial follicles in vivo and compare them to those in vitro.
Although previous studies have reported that in vitro culture systems can closely mimic the in vivo environment (Sung and Shuler, 2012; Higuchi et al., 2015; Xiao et al., 2017; Wang et al., 2020) and can generate competent metaphase II (MII) oocytes, the effects on gene expression are unclear. Currently, no study has analyzed and compared the transcriptomic profiles of oocytes derived from in vitro and in vivo conditions.
In this work, we explored the in vitro and in vivo growth of ovarian follicles and investigated the morphology and gene expression profiles. We report that the morphology of follicles grown in vivo versus in vitro was comparable for primordial, primary, and secondary follicles, with equal follicle diameters in the respective stages. Interestingly, despite different growth conditions, we observed no apparent differences in PTEN, FOXO3A, and mTOR levels, nor did we detect differences in reactive oxidative stress levels. Oocytes underwent stage-specific laser-capture microdissection (LCM), and subsequent RNA sequencing revealed distinct transcriptomes for oocytes isolated from primordial and primary follicles. We further established transcriptomic profiles for in vivo- and in vitro-grown MII oocytes. We observed no differences in the genes encoding PTEN, AKT, PI3K, or mTOR. Interestingly, we observed differential gene expression for other factors, particularly those related to cell cycle regulation, transforming growth factor beta (TGF-β) signaling, signal transduction, Wingless-type mouse mammary tumor virus integration site (Wnt) signaling, and mitochondrial function. These observations showed that while the overall morphology is conserved, molecular differences are detected between oocytes grown in vivo compared with in vitro, which does not appear to affect oocyte quality. The transcriptomic data can be used to predict molecular targets for primordial follicle activation for infertility treatment for cancer patients and could be useful for middle-aged infertile women and women with premature menopause. These results help elucidate the in vitro growth of ovarian follicle cells using the mouse ovary as an experimental model by determining gene expression in oocytes from dormant and activated follicles as well as mature oocytes. We thus describe the initial rate-limiting follicle activation step as well as the end product, the fertile oocyte. During this time, many critically important cellular processes, including activation, differentiation, and the initial events of meiosis, occur. We report expression differences between oocytes from primordial and primary follicles and mature oocytes. These studies illuminate the activation and requirements of ovarian folliculogenesis and provide a resource for analysis of the clinical development and physiology of mammalian ovarian follicle formation.
Results
Transcriptome Study Design in Primordial and Primary Follicles
To assess the morphology of ovarian follicles and ovaries from the in vivo and in vitro groups, we compared the distinct morphology of primordial, primary, and secondary follicles (Figure 1A). We observed flat pregranulosa cells in the primordial follicles, but they grew and became cuboidal in the primary and secondary stages (Figure 1A). At the end of follicle development, the oocyte progresses to the diplotene stage of prophase I and then undergoes arrest until ovulation. The oocyte resumes meiotic maturation in response to the midcycle luteinizing hormone (LH) surge, generating MII oocytes. We extended our in vivo and in vitro analysis to include morphological, transcriptomic, and biochemical analyses of metaphase II oocytes. Under our in vitro conditions, for final oocyte maturation, human chorionic gonadotropin (hCG) was used to induce ovulation (Figure 1B) and reflect the endogenous LH surge.
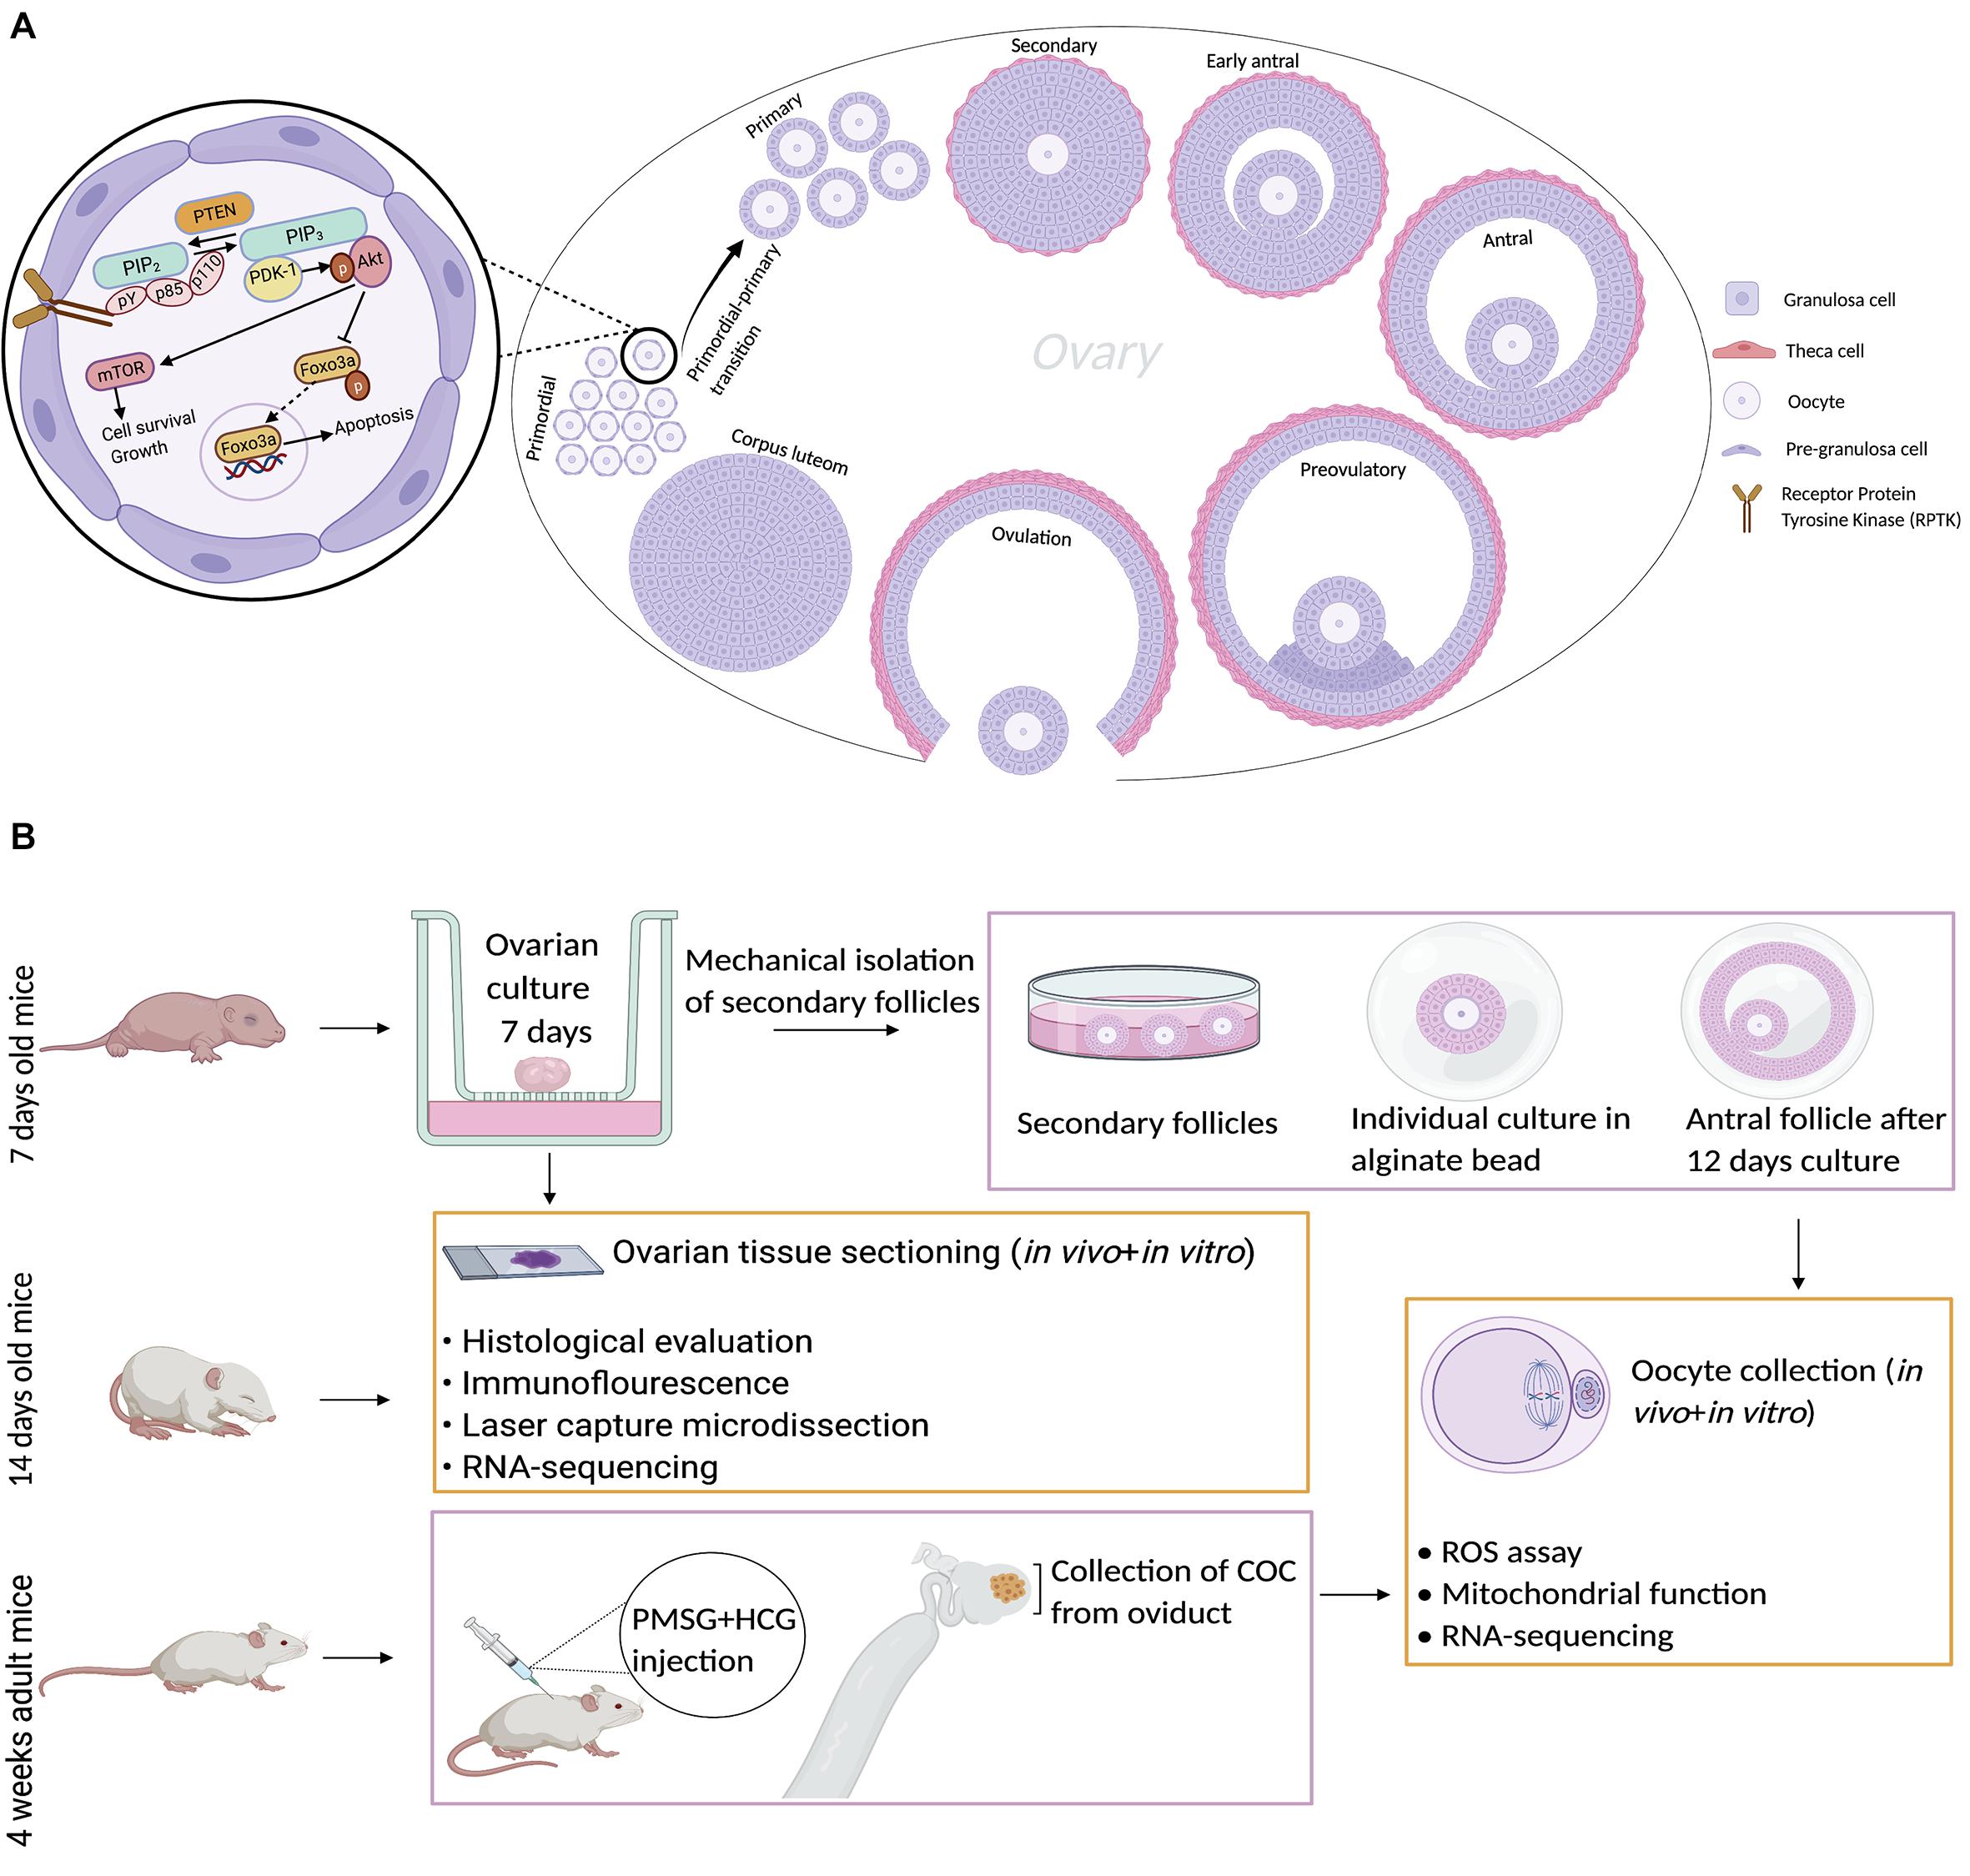
Figure 1. Schematic images representing mammalian ovaries and the experimental design. (A) Different developmental stages of follicles are shown from primordial follicles to ovulation and formation of the corpus luteum. The PTEN–AKT–FOXO3 signaling pathway is represented in higher magnification of one primordial follicle, showing its role in the primordial–primary follicle transition. Dimerization and autophosphorylation of RPTK molecules result in the generation of PIP3 from PIP2. PTEN is a negative regulator of PI3K, which converts PIP3 to PIP2. Akt is activated by binding to PIP3 and phosphorylated by PDK1. Activated AKT leads to phosphorylation of Foxo3a and its localization in the cytoplasm, preventing relocation of unphosphorylated Foxo3a to the nucleus to induce apoptosis. Activated AKT can also activate mTOR and induce cell survival and growth. (B) The experimental design of the study is shown for both the in vivo and in vitro groups. Created with BioRender.com.
The Development Is Comparable Between the in vivo and in vitro Groups
The growing follicles were well organized with regard to oocyte size and membrane “clearness,” and the morphology of the granulosa cells was consistent in both groups (Figure 2A). The percentage of follicles in each developmental stage was based on the number of follicles observed in equal numbers of ovaries (n = 5 in each group) from the in vivo group, which included primordial (n = 1,314), primary (n = 170), and secondary (n = 440) follicles, and the in vitro group, which included primordial (n = 1,152), primary (n = 134), and secondary (n = 438) follicles. The proportions of normal follicles from the in vivo group at the primordial, primary, and secondary stages were 66.28 ± 2.08, 7.93 ± 0.68, and 25.78 ± 1.55, respectively, while the percentages of normal follicles from the in vitro group at these stages were 67.85 ± 2.24, 9.00 ± 0.97, and 23.13 ± 1.35%, respectively (Figure 2B). The percentage of normal follicles at different developmental stages was not significantly different between the groups. The integrity and structural organization of ovaries from the in vivo group were similar to those from the in vitro group after a culture period (data not shown).
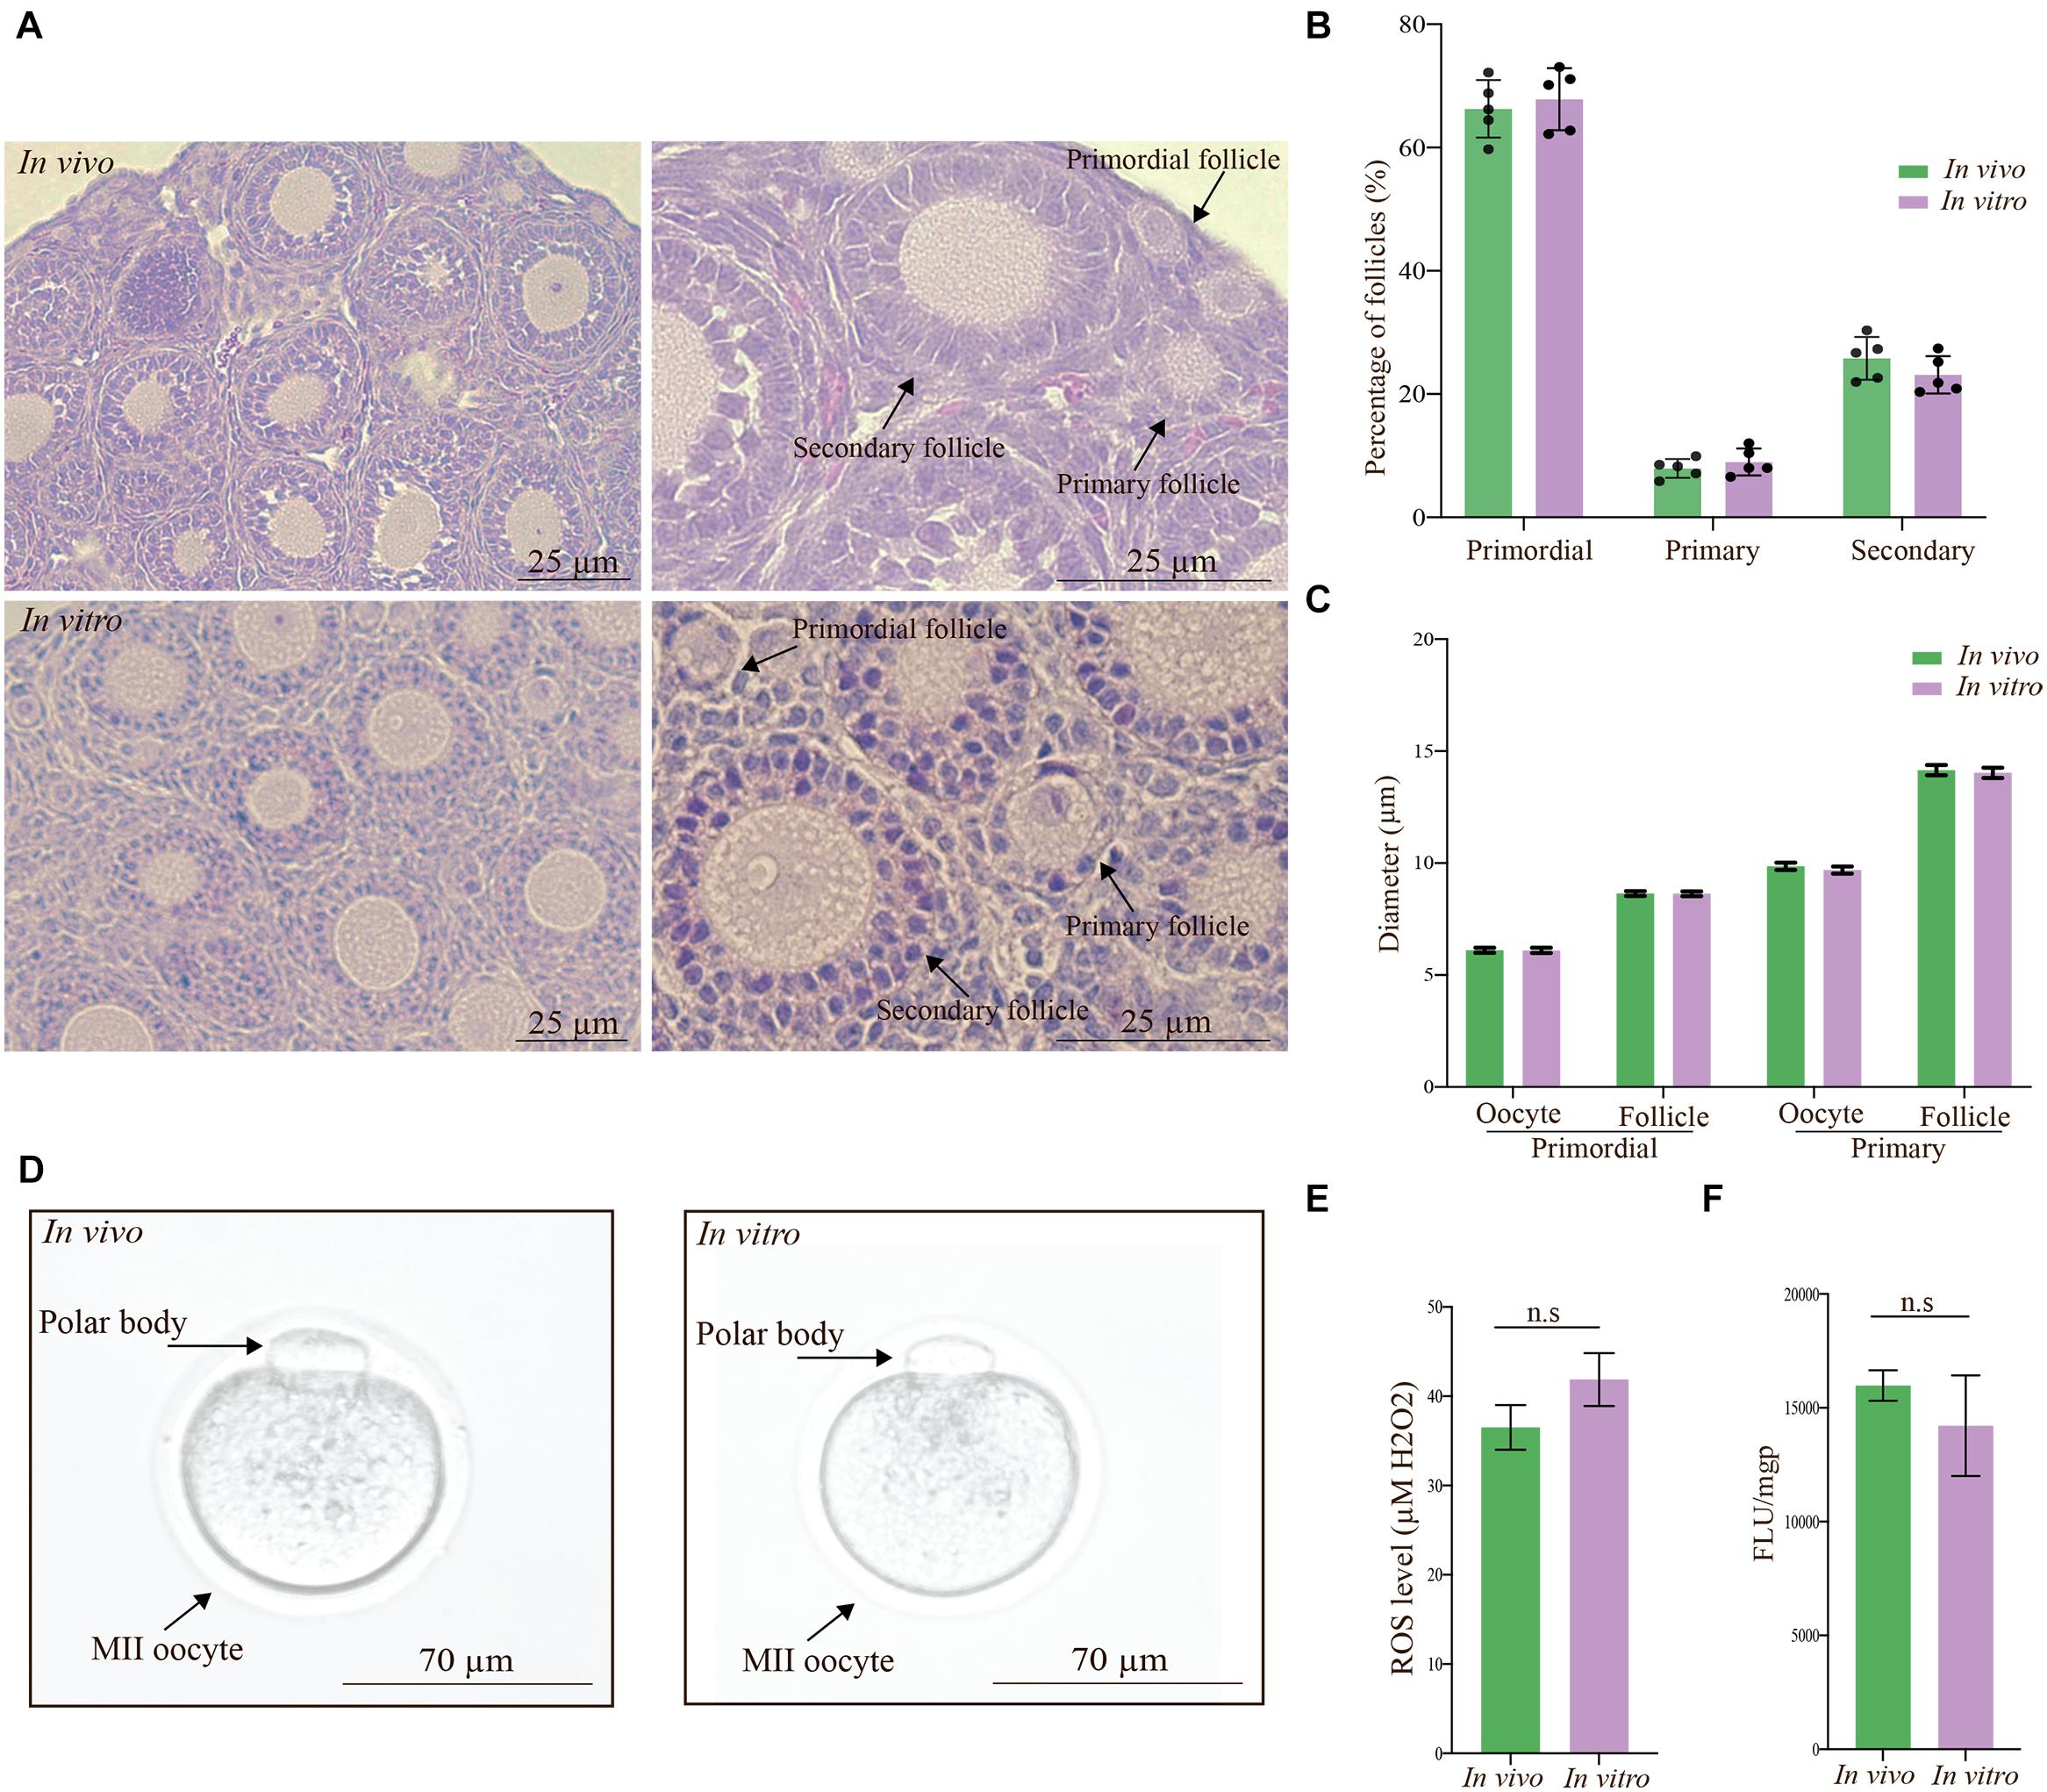
Figure 2. Evaluation of ovaries and metaphase II (MII) oocytes based on morphology, development, and mitochondrial function. (A) Photomicrographs show the ovaries in the in vivo and in vitro groups stained with hematoxylin and eosin at low and high magnifications. The integrity and structural organization of ovaries from the in vivo group were similar to those of ovaries from the in vitro group. Scale bar: 25 μm. (B) The percentage of follicles in each developmental stage was calculated based on the number of normal follicles from the in vivo (n = 5 ovaries, n = 1,314 primordial, n = 170 primary, and n = 440 secondary follicles) and in vitro (n = 5 ovaries, n = 1,152 primordial, n = 134 primary, and n = 438 secondary follicles) groups. There was no significant difference between the in vivo and in vitro groups in each follicle developmental stage. Values are given as the mean ± standard error (SE). (C) The diameter of oocytes and follicles in primordial and primary follicle stages. There was no significant difference between the in vivo and in vitro groups. Values are given as the mean ± SE. (D) Representative photomicrographs of MII oocytes from the in vivo and in vitro groups. Alignment based on the morphology of MII oocytes derived under in vitro conditions with in vivo-derived MII oocytes was clear. Scale bar: 70 μm. (E) Reactive oxygen species (ROS) levels in collected MII oocytes from the in vivo- and in vitro-matured groups. There was no significant difference between the groups. Values are given as the mean ± SE. (F) Uptake of the cationic carbocyanine dye JC-1 into the matrix and mitochondrial membrane potential of collected MII oocytes from the in vivo- and in vitro-matured groups. There was no significant difference between the groups. Values are given as the mean ± SE.
To evaluate and compare the growth of the follicles, we measured the follicle and oocyte diameters in the ovaries from the in vivo and in vitro groups. The mean diameters of oocytes from primordial follicles and primordial follicles in ovaries from the in vivo group were 8.64 ± 0.10 μm and 6.11 ± 0.11 μm, respectively, and the corresponding diameters in ovaries from the in vitro group were 8.63 ± 0.10 μm and 6.10 ± 0.12 μm, respectively (Figure 2C). In comparison, the mean diameters of oocytes from primary follicles (9.86 ± 0.17 μm) and primary follicles (14.15 ± 0.23 μm) in ovaries from the in vivo group were comparable to the corresponding diameters in ovaries from the in vitro group (9.69 ± 0.16 μm and 14.03 ± 0.23 μm, respectively) (Figure 2C).
In summary, the morphology of oocytes and follicles from the primordial and primary follicle stages was comparable with regard to growth and size in the in vivo and in vitro groups.
The Quality of in vivo- and in vitro-Grown Mature Oocytes Is Comparable
The morphology of in vivo-matured MII oocytes was comparable to that of in vitro-matured MII oocytes (Figure 2D), as shown by the shape of the oocytes, which was classical (round with a defined membrane), and the presence of a polar body, indicating healthy in vitro growth.
In vitro maturation is a popular technology for fertility treatment and preservation. However, in vitro culture conditions can increase the reactive oxygen species (ROS) level, which is one of the major causes of compromised embryonic development (Cagnone and Sirard, 2016; Lan et al., 2019; Jamil et al., 2020). Elevated levels of ROS trigger granulosa cell apoptosis, which reduces the transfer of nutrients and survival factors to oocytes, leading to apoptosis. We compared the ROS levels in the in vivo-grown MII oocytes with those in the in vitro-grown MII oocytes using the 2′,7′-dichlorodihydrofluorescein diacetate (DCFH-DA) fluorescence assay. MII oocytes were collected from both groups and the concentrations of ROS were determined in the MII oocytes from the in vivo (36.51 ± 2.51 μM H2O2) and in vitro (41.87 ± 2.97 μM H2O2) groups (Figure 2E), and no significant difference in ROS levels was observed.
Mitochondrial dysfunction, which has been associated with oocyte quality and an increase in the mitochondrial membrane potential during oocyte maturation, limits current fertility treatments. To determine whether in vitro maturation of MII oocytes results in mitochondrial changes, we measured the uptake of the cationic carbocyanine dye JC-1 into the matrix and the mitochondrial membrane potential of collected MII oocytes from the in vivo- and in vitro-matured groups (Figure 2F). The uptake of JC-1 into the matrix of MII oocytes from the in vivo and in vitro groups was 15,984 ± 669 and 14,216.33 ± 2,208.58 fluorescence units (FLU)/milligram protein (mgP), respectively, revealing no significant difference between the groups.
FOXO1, FOXO3a, PTEN, and mTOR Are Similarly Expressed in the in vivo and in vitro Groups
Next, we examined the level and distribution of known follicle regulators in primordial and primary follicles (Figure 1A) of the in vivo group compared with the in vitro group. We examined the distribution of FOXO1, FOXO3a, PTEN, and mTOR by immunofluorescence antibody staining of ovarian sections from in vivo-grown (Figures 3A,C,E,G) and in vitro-grown (Figures 3B,D,F,H) follicles. Immunofluorescence detection of FOXO1 showed that it was specifically distributed in granulosa cells, with no difference between ovaries from the in vivo (Figure 3A) and in vitro groups (Figure 3B). FOXO3a was distributed according to the follicular stage; in primordial follicles, FOXO3a was enriched in the nucleus, both in vivo (Figure 3C) and in vitro (Figure 3D). Upon activation, FOXO3a translocates from the nucleus, and thus, in primary follicles, FOXO3a was localized in the cytoplasm, both in vivo (Figure 3C) and in vitro (Figure 3D). To eliminate the possibility of altered PTEN levels and the associated DNA damage, we investigated the expression of PTEN and found that this important ovarian regulator was expressed at the same level with a similar distribution in oocytes from primordial follicles in vivo (Figure 3E) and in vitro (Figure 3F). The expression of PTEN in primary follicles was undetectable (Figures 3E,F). We also examined the expression of mTOR and likewise found this protein to be equally expressed and distributed in primordial and primary follicles under in vivo (Figure 3G) and in vitro (Figure 3H) conditions.
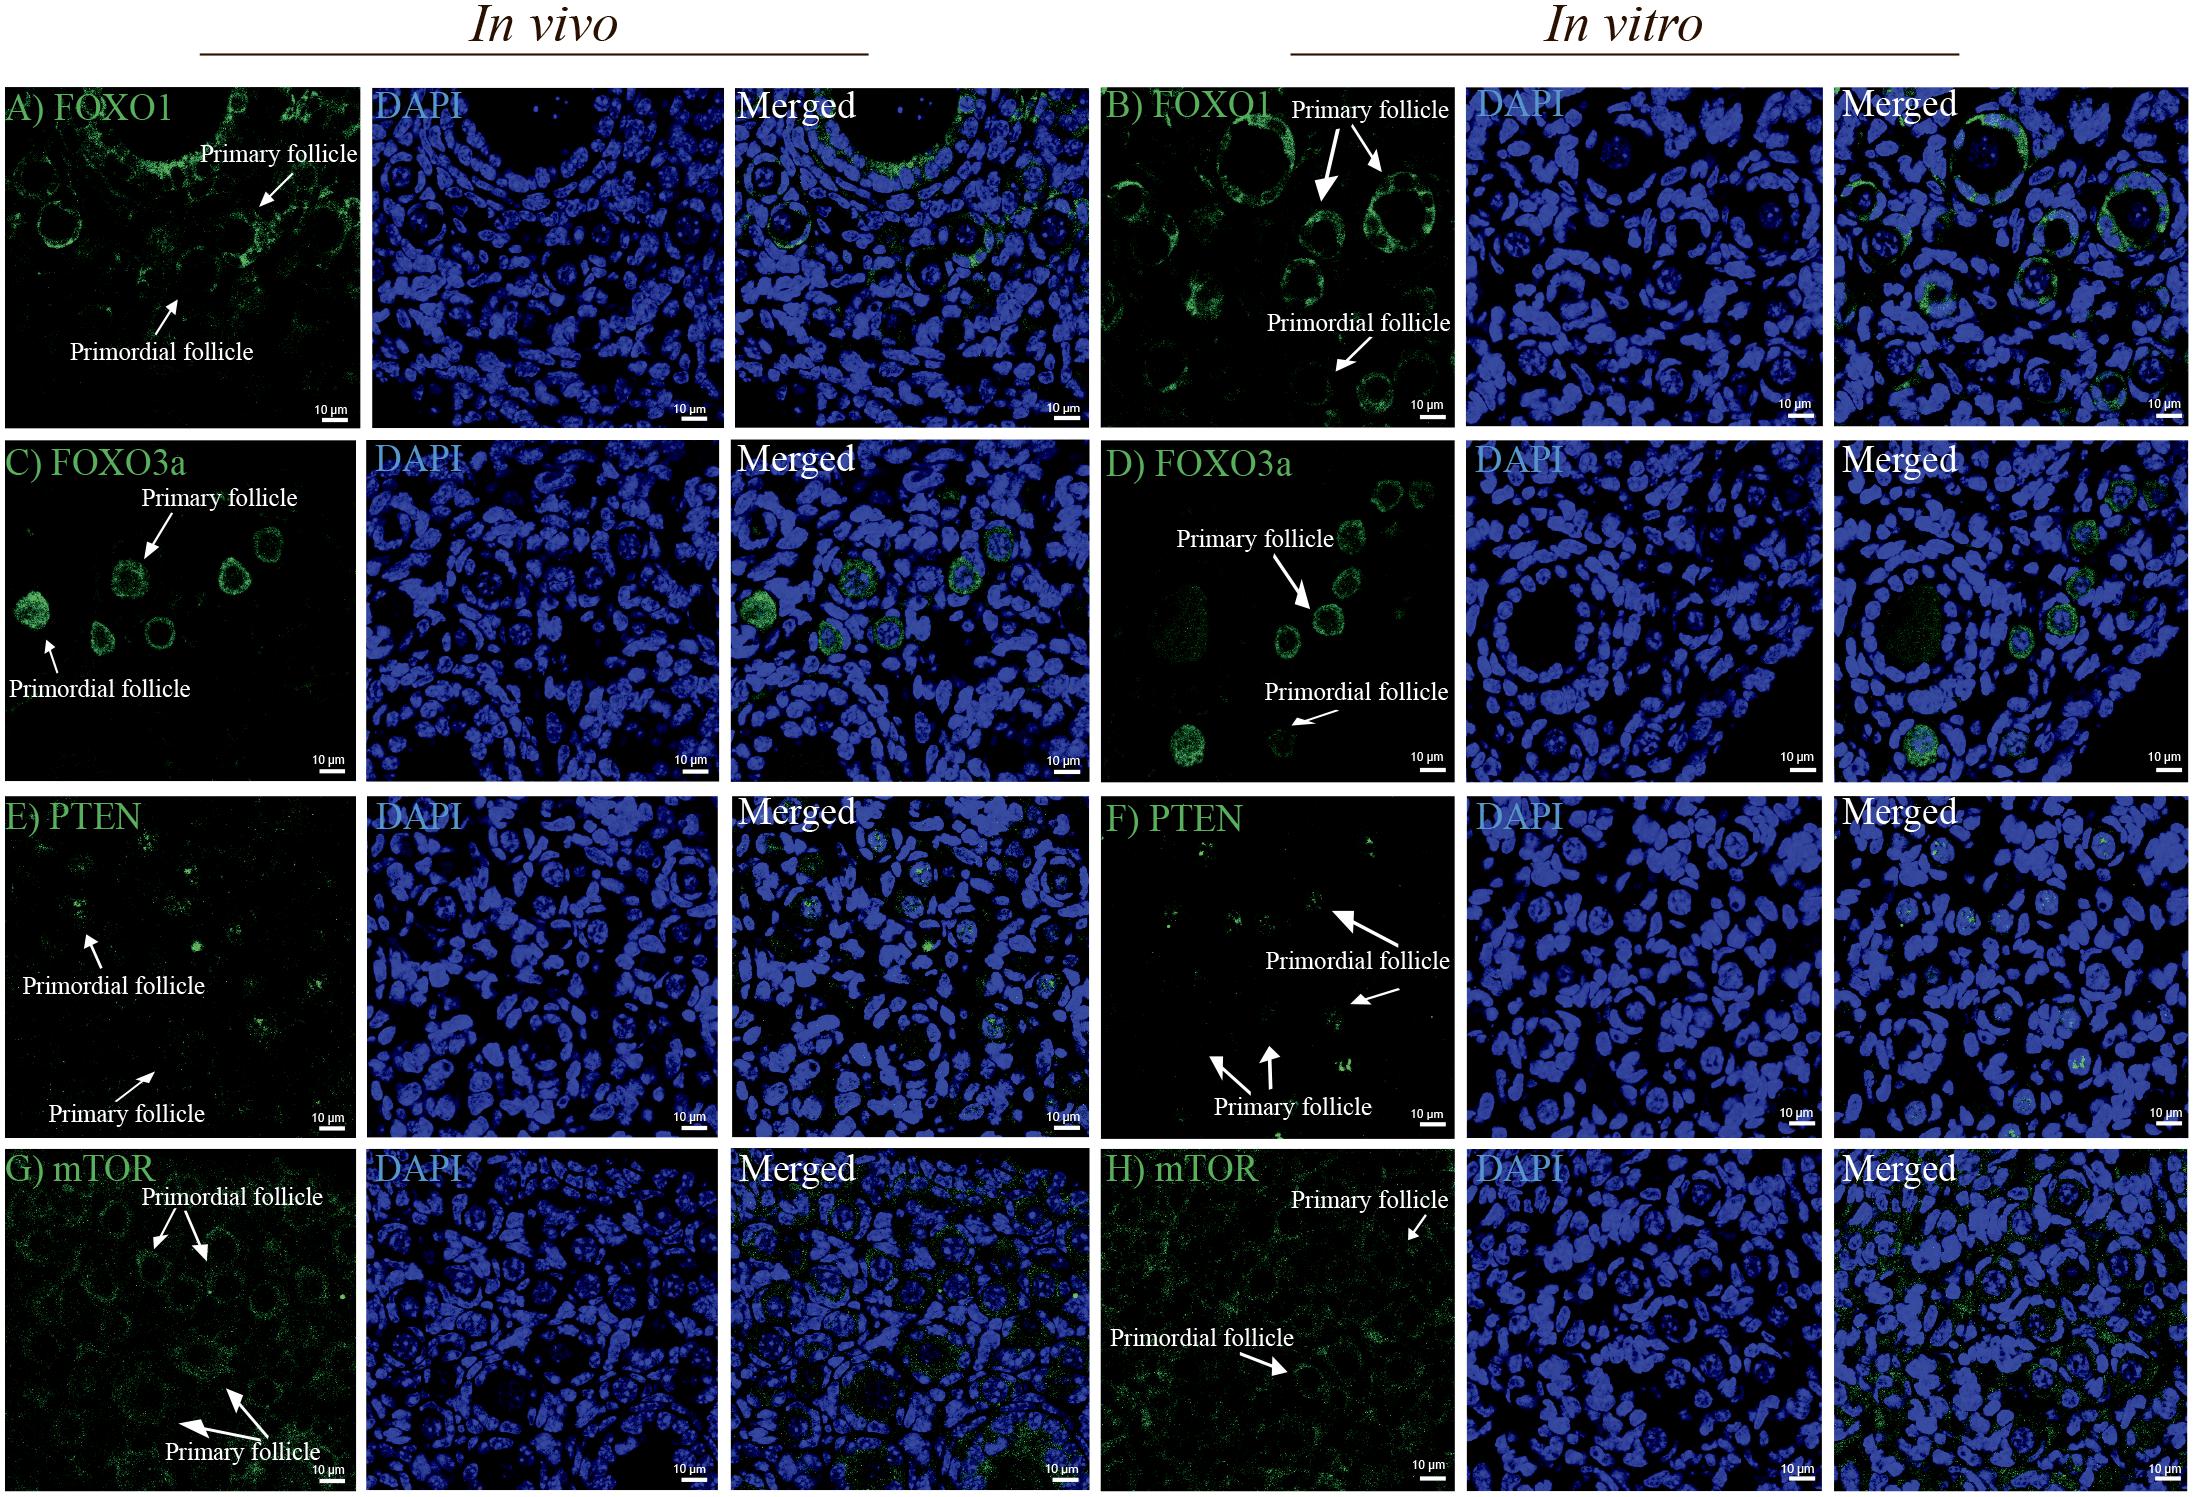
Figure 3. Confocal microscopy images showing the distribution of FOXO1, FOXO3a, PTEN, and mTOR in mouse ovaries from the in vivo and in vitro groups. (A,B) FOXO1 protein was similarly localized in granulosa cells in ovaries from the in vivo and in vitro groups. (C,D) FOXO3a was distributed in the nucleus of primordial follicles and cytoplasm of primary follicles in the in vivo and in vitro groups. (E,F) PTEN was distributed more intensely in oocytes of primordial follicles than in oocytes of primary follicles in the in vivo and in vitro groups. Notably, PTEN in oocytes of primary follicles was undetectable. (G,H) mTOR was equally distributed in oocytes of primordial and primary follicles from both the in vivo and in vitro groups. DAPI staining shows the cell nuclei. Scale bar: 10 μm.
In summary, no significant differences were detected in the tested protein levels or distribution between in vivo and in vitro in primordial and primary follicles (Supplementary Figure 1).
In vivo and in vitro Oocyte Transcriptome Profiling Suggest Extensive Gene Expression in Cell Proliferation and Growth-Related Gene Pathways
Oocytes were isolated by stage-specific LCM from follicles and categorized into three replicates for each stage from the in vivo (n = 277 primordial stage, n = 170 primary stage) and in vitro (n = 299 primordial stage, n = 250 primary stage) groups (12 samples in total) (Figure 4A). RNA sequencing was performed per sample, and mapping to the mouse genome (mm10) was performed with RefSeq genes as the template. The normalization of expression values to achieve transcripts per million (TPM), lfcSE, p-values, and adjusted p-values was performed using the DESeq2 R package (Love et al., 2014). Visualization of principal component analysis (PCA) was performed, and significantly differentially expressed genes (SDEGs) (gene abbreviations are listed in Table 1) and volcano plots were generated.
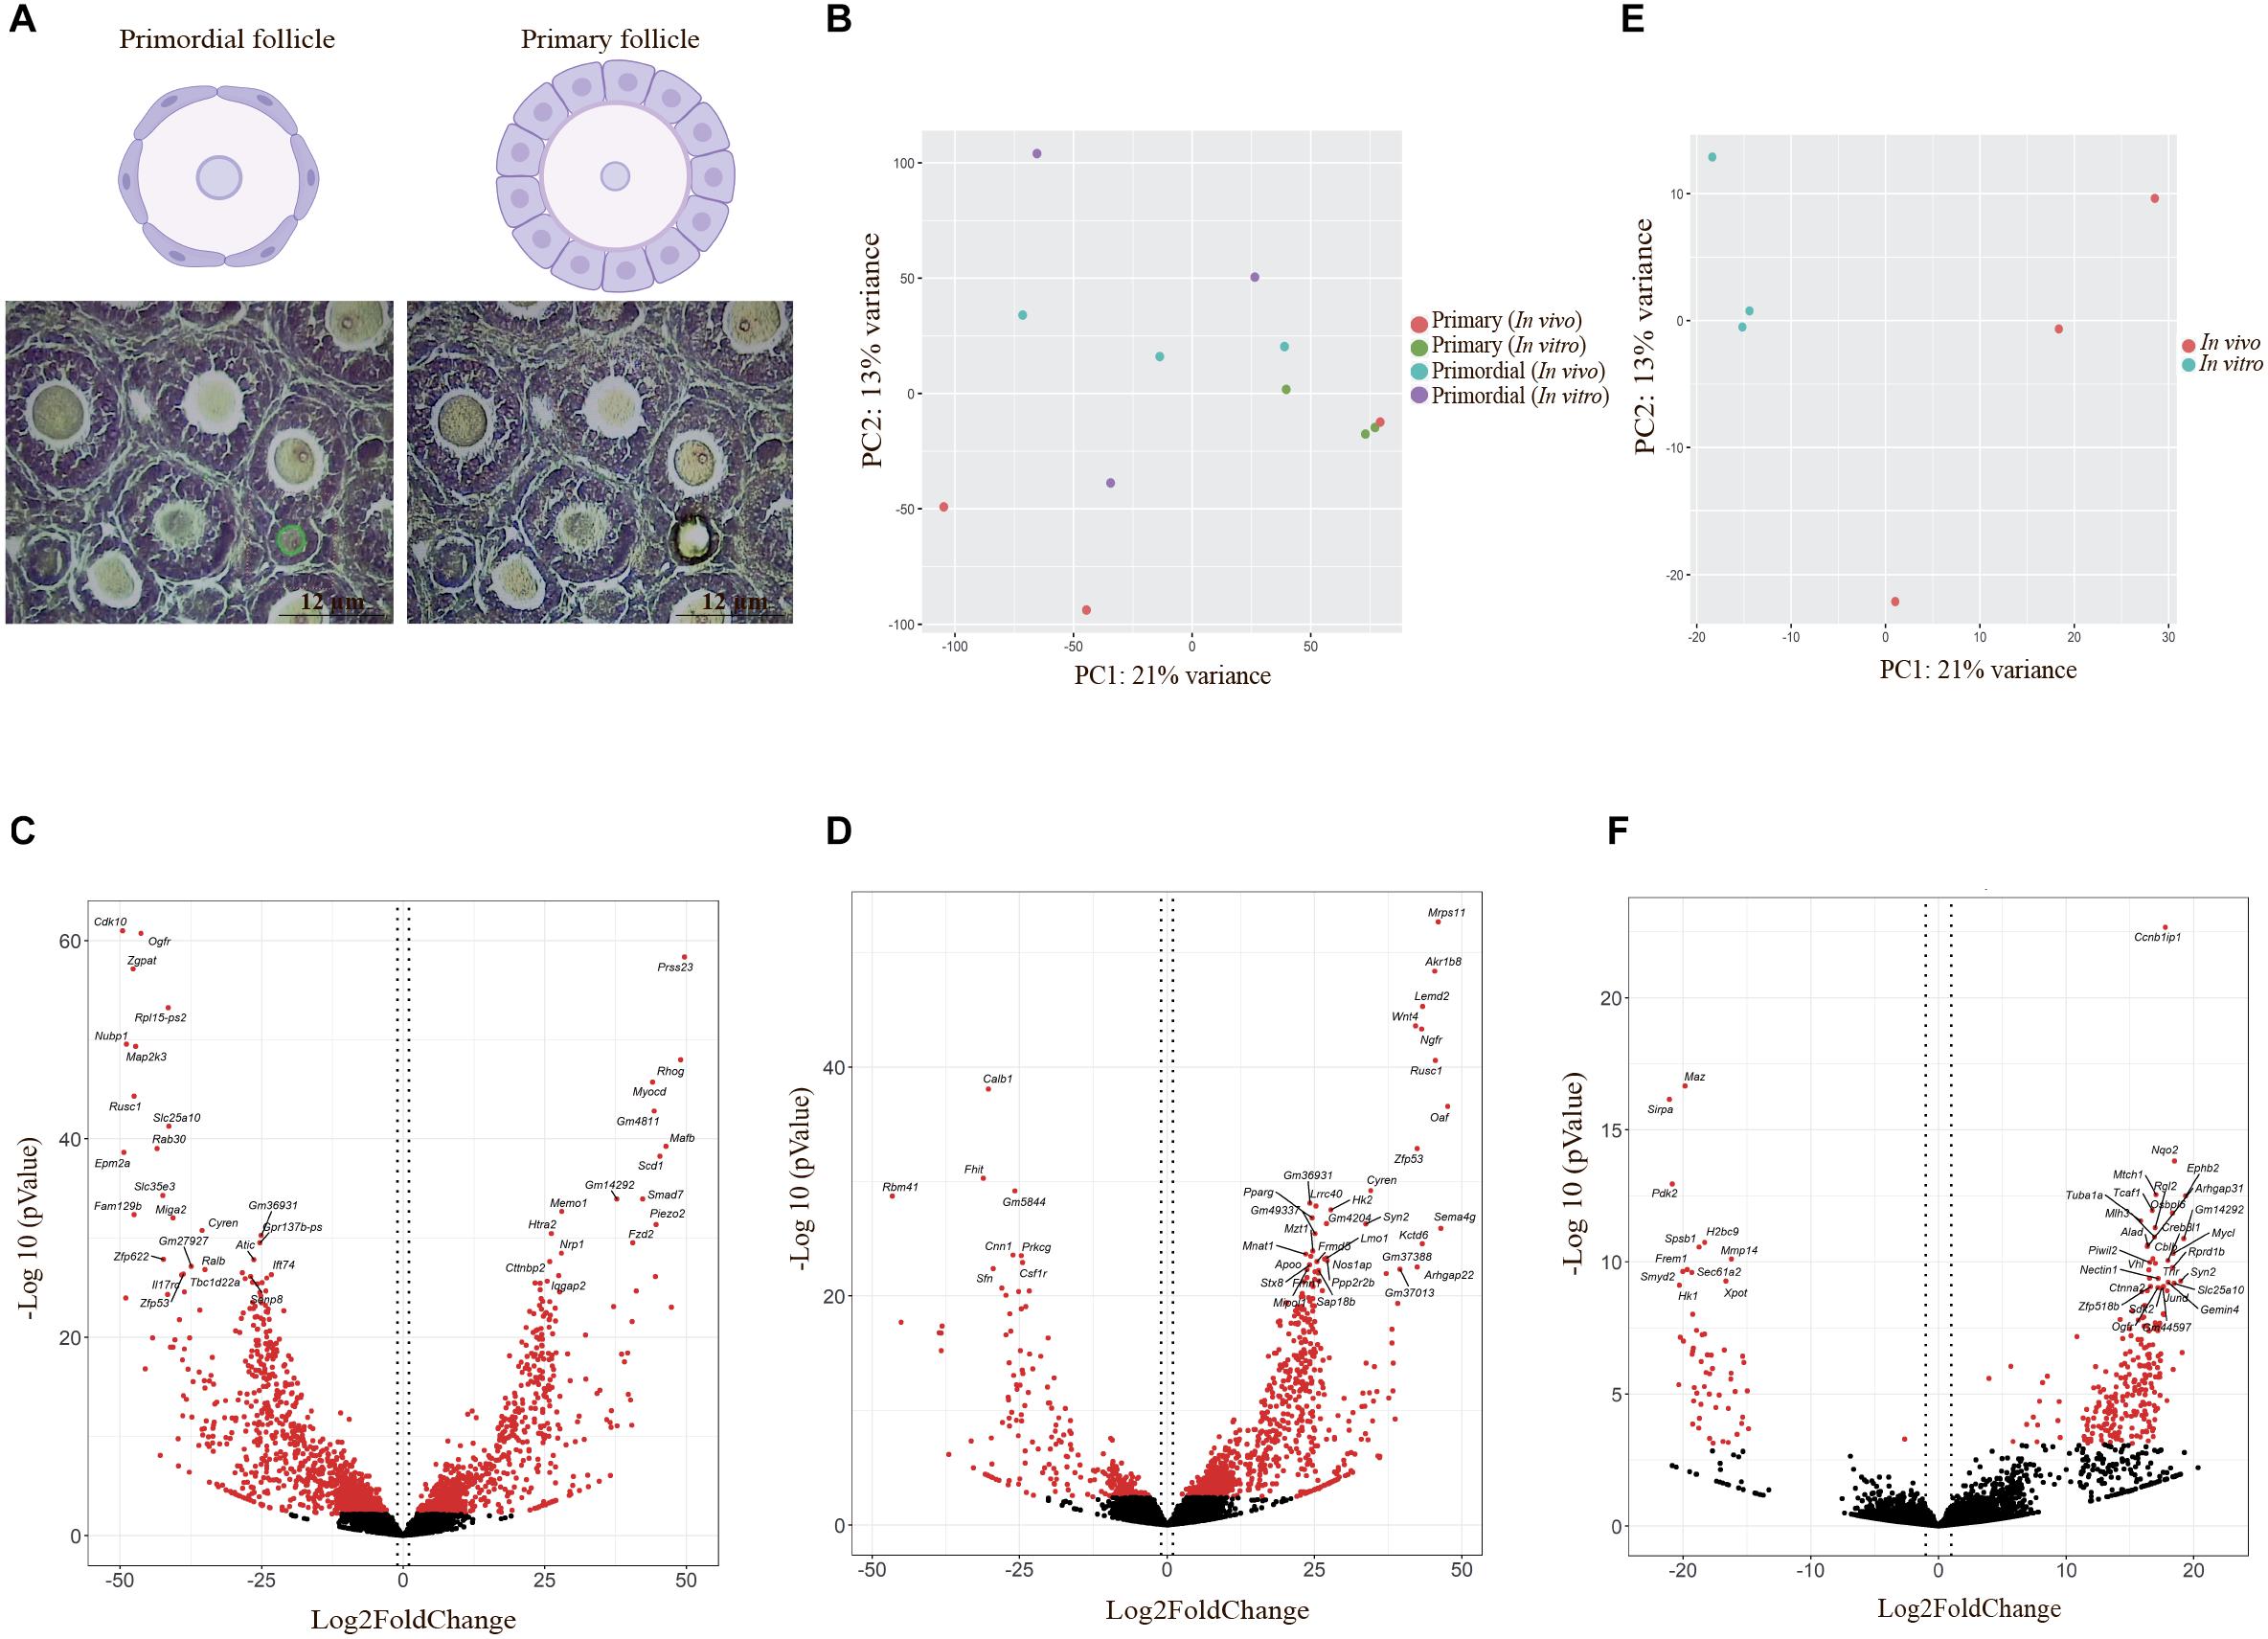
Figure 4. Laser capture microdissection and differentially expressed gene (DEG) visualization. (A) Schematic images represent follicles in primordial and primary follicles. Primordial follicles are shown with flattened pregranulosa cells surrounding the oocyte, and primary follicles are shown with a single layer of cuboidal granulosa cells. Photomicrographs showing precise determination and cutting by laser capture microdissection based on defined classification of different developmental stages of follicles in the study. Scale bar: 12 μm. (B) Principal component analysis (PCA) of DEGs in oocytes from primordial and primary follicles in the in vivo and in vitro groups, generated by R. Red and green dots show oocytes from primary follicles in the in vivo and in vitro groups, respectively. Blue and purple dots define oocytes from primordial follicles in the in vivo and in vitro groups, respectively. (C,D) Volcano plot of DEGs in oocytes from primordial (C) and primary follicles (D) in the in vitro group compared with the in vivo group. Vertical dotted lines indicate ± 1 log2 fold change. The 20 most significant genes are shown in volcano plots. Red dots indicate significantly expressed genes with adjusted p-values < 0.05, and black dots indicate non-significantly expressed genes. (E) PCA of DEGs in the in vivo- and in vitro-grown mature oocytes plotted using R. Red and blue dots represent in vivo- and in vitro-grown mature oocytes, respectively. (F) Volcano plot of DEGs in MII oocytes in the in vitro and in vivo groups. Vertical dotted lines indicate ± 1 log2 fold change. The 20 most significant genes are shown in volcano plots. Red dots indicate significantly expressed genes with adjusted p-values < 0.05, and black dots indicate non-significantly expressed genes.
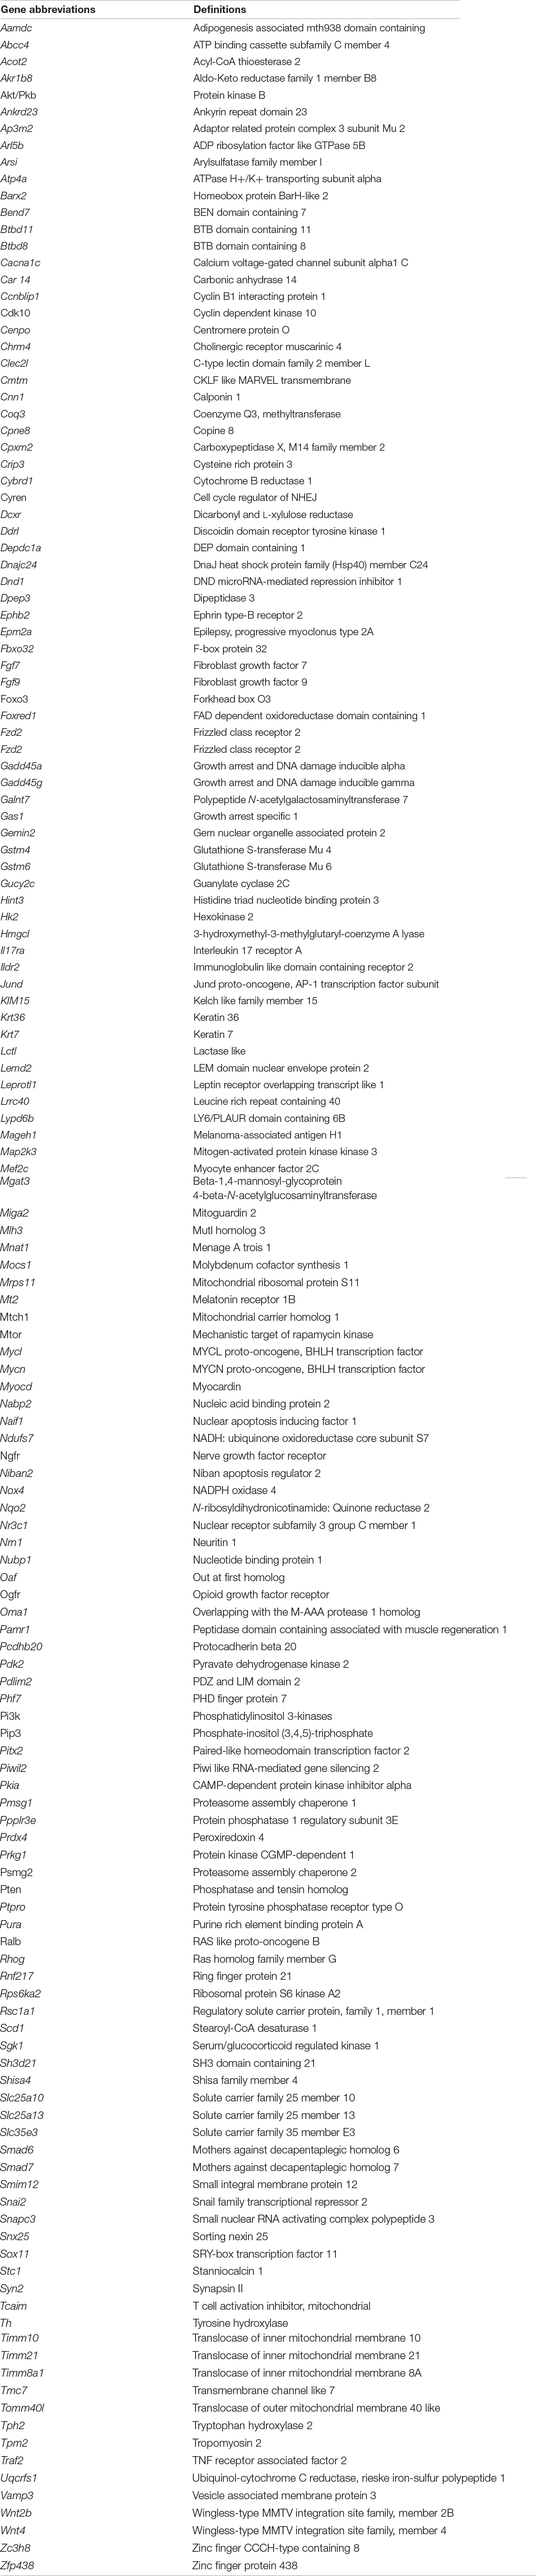
Table 1. List of gene names and gene abbreviations.
Principal component analysis indicated variation in expression values and different expression patterns in oocytes of primordial and primary follicles from the in vivo and in vitro groups (Figure 4B). However, clustering of the genes between oocytes of primordial and primary follicles from the in vivo and in vitro groups was not clear (Figure 4B), revealing variability between samples in each developmental stage and group. For the identification of SDEGs with large fold changes, volcano plots were generated. We selected the top 20 significant genes in oocytes of primordial (Figure 4C) and primary follicles (Figure 4D) from the in vitro group compared with the in vivo group. Interestingly, in oocytes from primordial follicles (Figure 4C), the levels of cell proliferation- and growth-related genes such as Cdk10, Ogfr, Cyren, and Ralb and Psmg2, Pkia, Gadd45g, Nubp1, and Niban2 were highly downregulated. Moreover, mitogen-activated protein kinase (MAPK) pathway-involved genes, such as Map2k3, and mitochondrial genes, such as Slc25a10 and Miga2, were among the top 20 significantly downregulated genes. Furthermore, the levels of the ROS-related genes Dcxr and Foxred1 were notably downregulated in the in vivo to in vitro comparison. Additionally, the levels of the Wingless-type mouse mammary tumor virus integration site (Wnt) signaling pathway genes Wnt2b and Mgat3 were highly downregulated. Among the top 20 upregulated genes in oocytes from primordial follicles, Smad7, which is involved in transforming growth factor beta (TGF-β) signaling, was identified. Fzd2, which is also involved in Wnt signaling, was among the top 20 upregulated genes in oocytes from primordial follicles (Table 2).
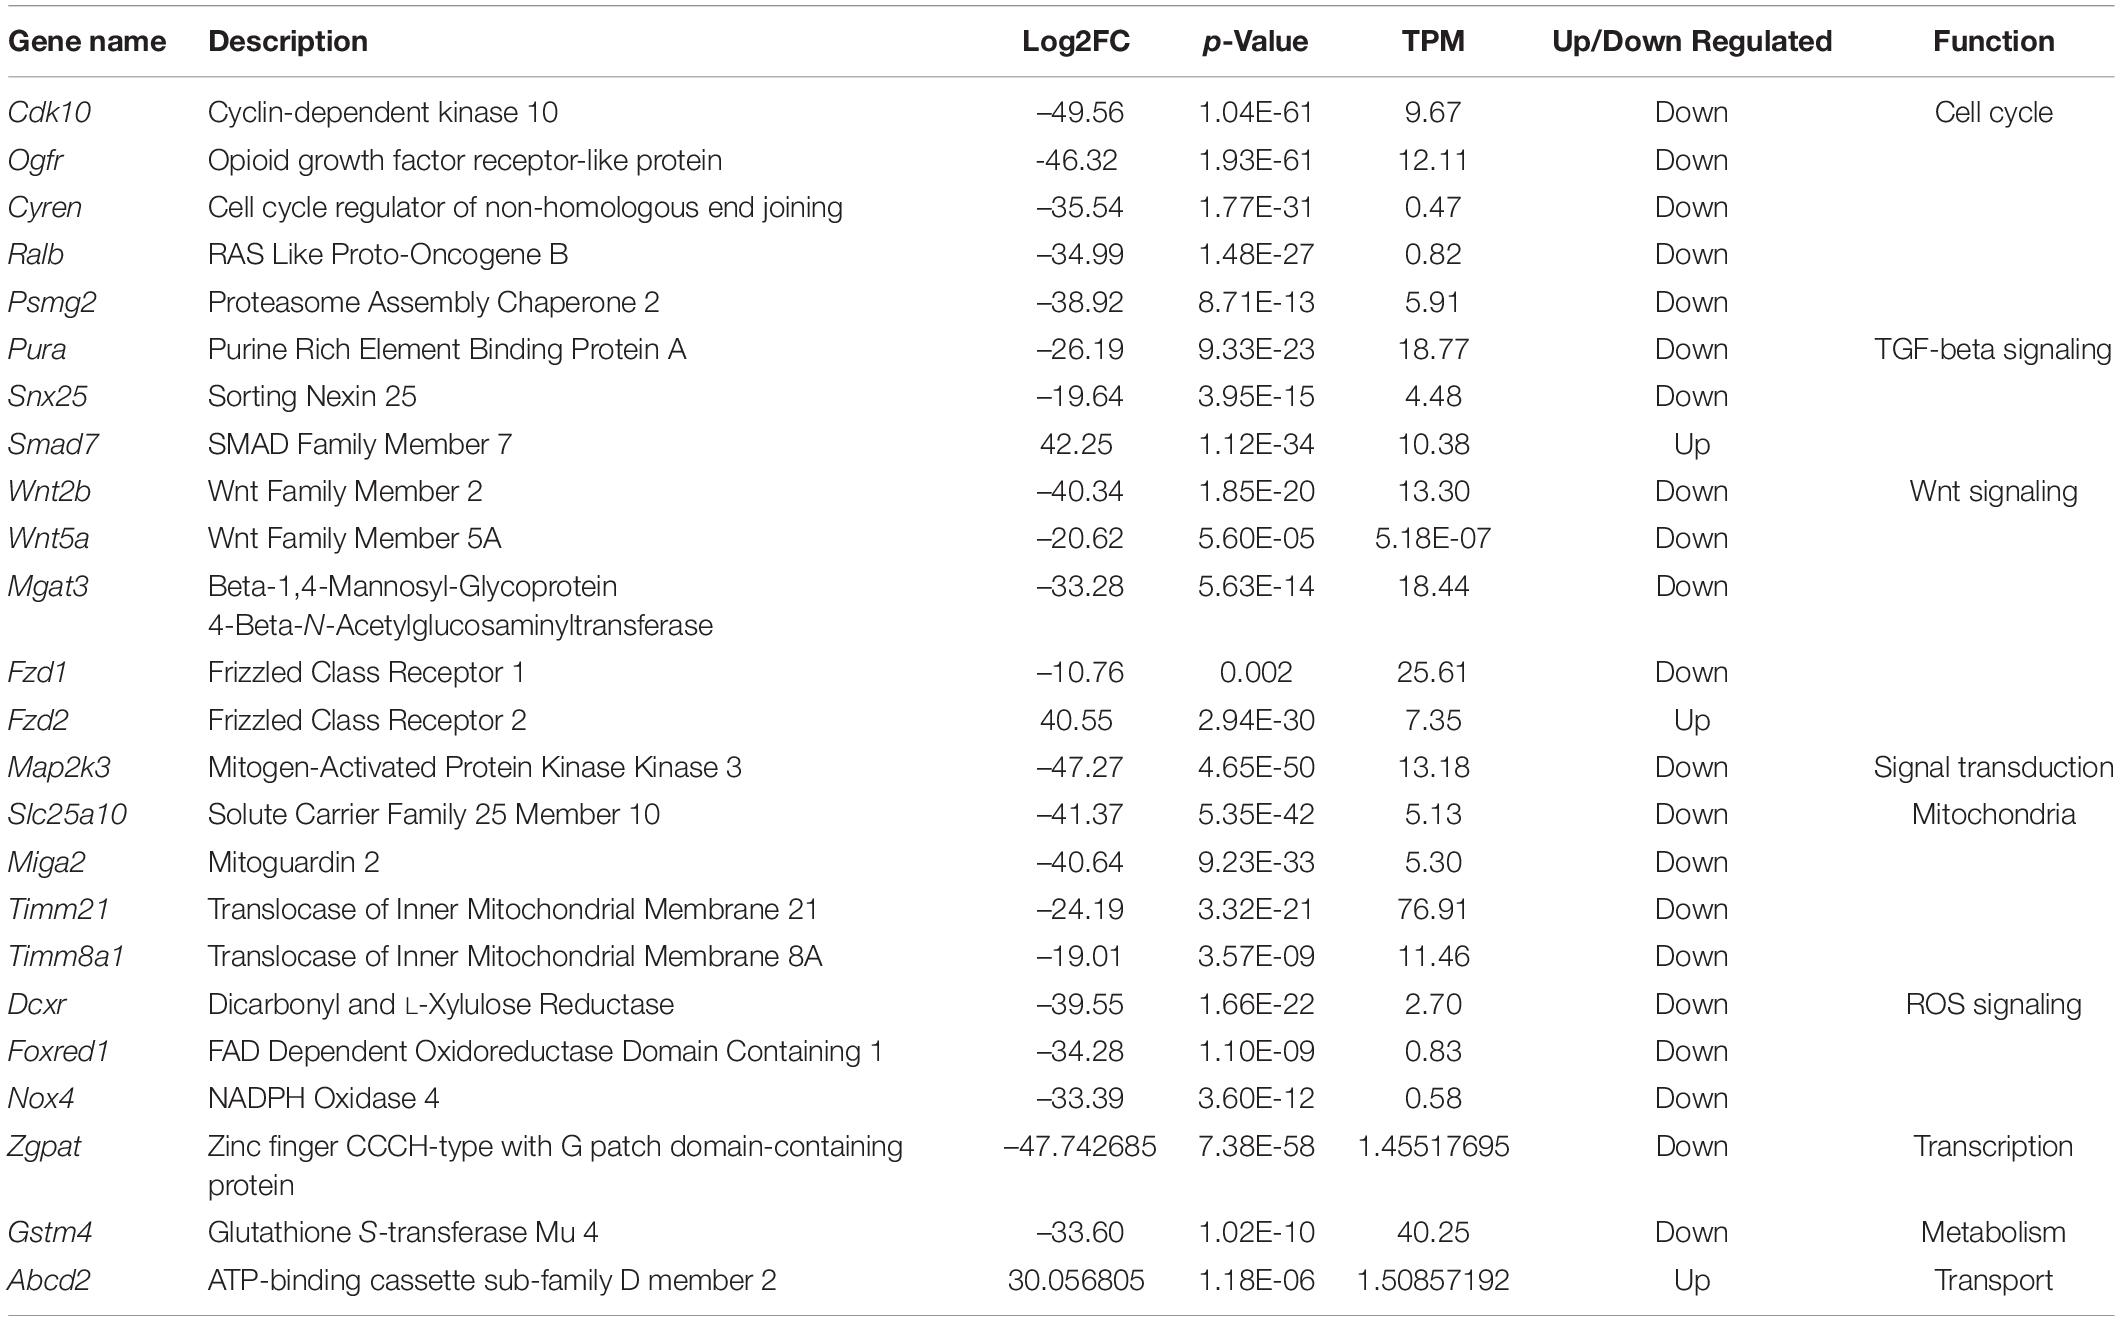
Table 2. Top most significant DEGs in oocytes from primordial follicles between in vivo and in vitro groups.
In oocytes from primary follicles (Figure 4D), the levels of Mnat1, Cyren, and Psmg2, which are associated with cell cycle processes, were highly upregulated. Notably, genes involved in the TGF-β signaling pathway, such as Smad6, Pitx2, and Ngfr, were also in the top 20 significantly upregulated genes. In addition, the mitochondria-related gene Mrps11 and the ROS-related gene Akr1b8 were in the top 20 significantly upregulated genes in oocytes from primary follicles. Interestingly, Wnt4, which is involved in the Wnt signaling pathway, and Lemd2, which is involved in the MAPK signal transduction pathway, were also among the top 20 significantly upregulated genes in oocytes from primary follicles (Table 3).
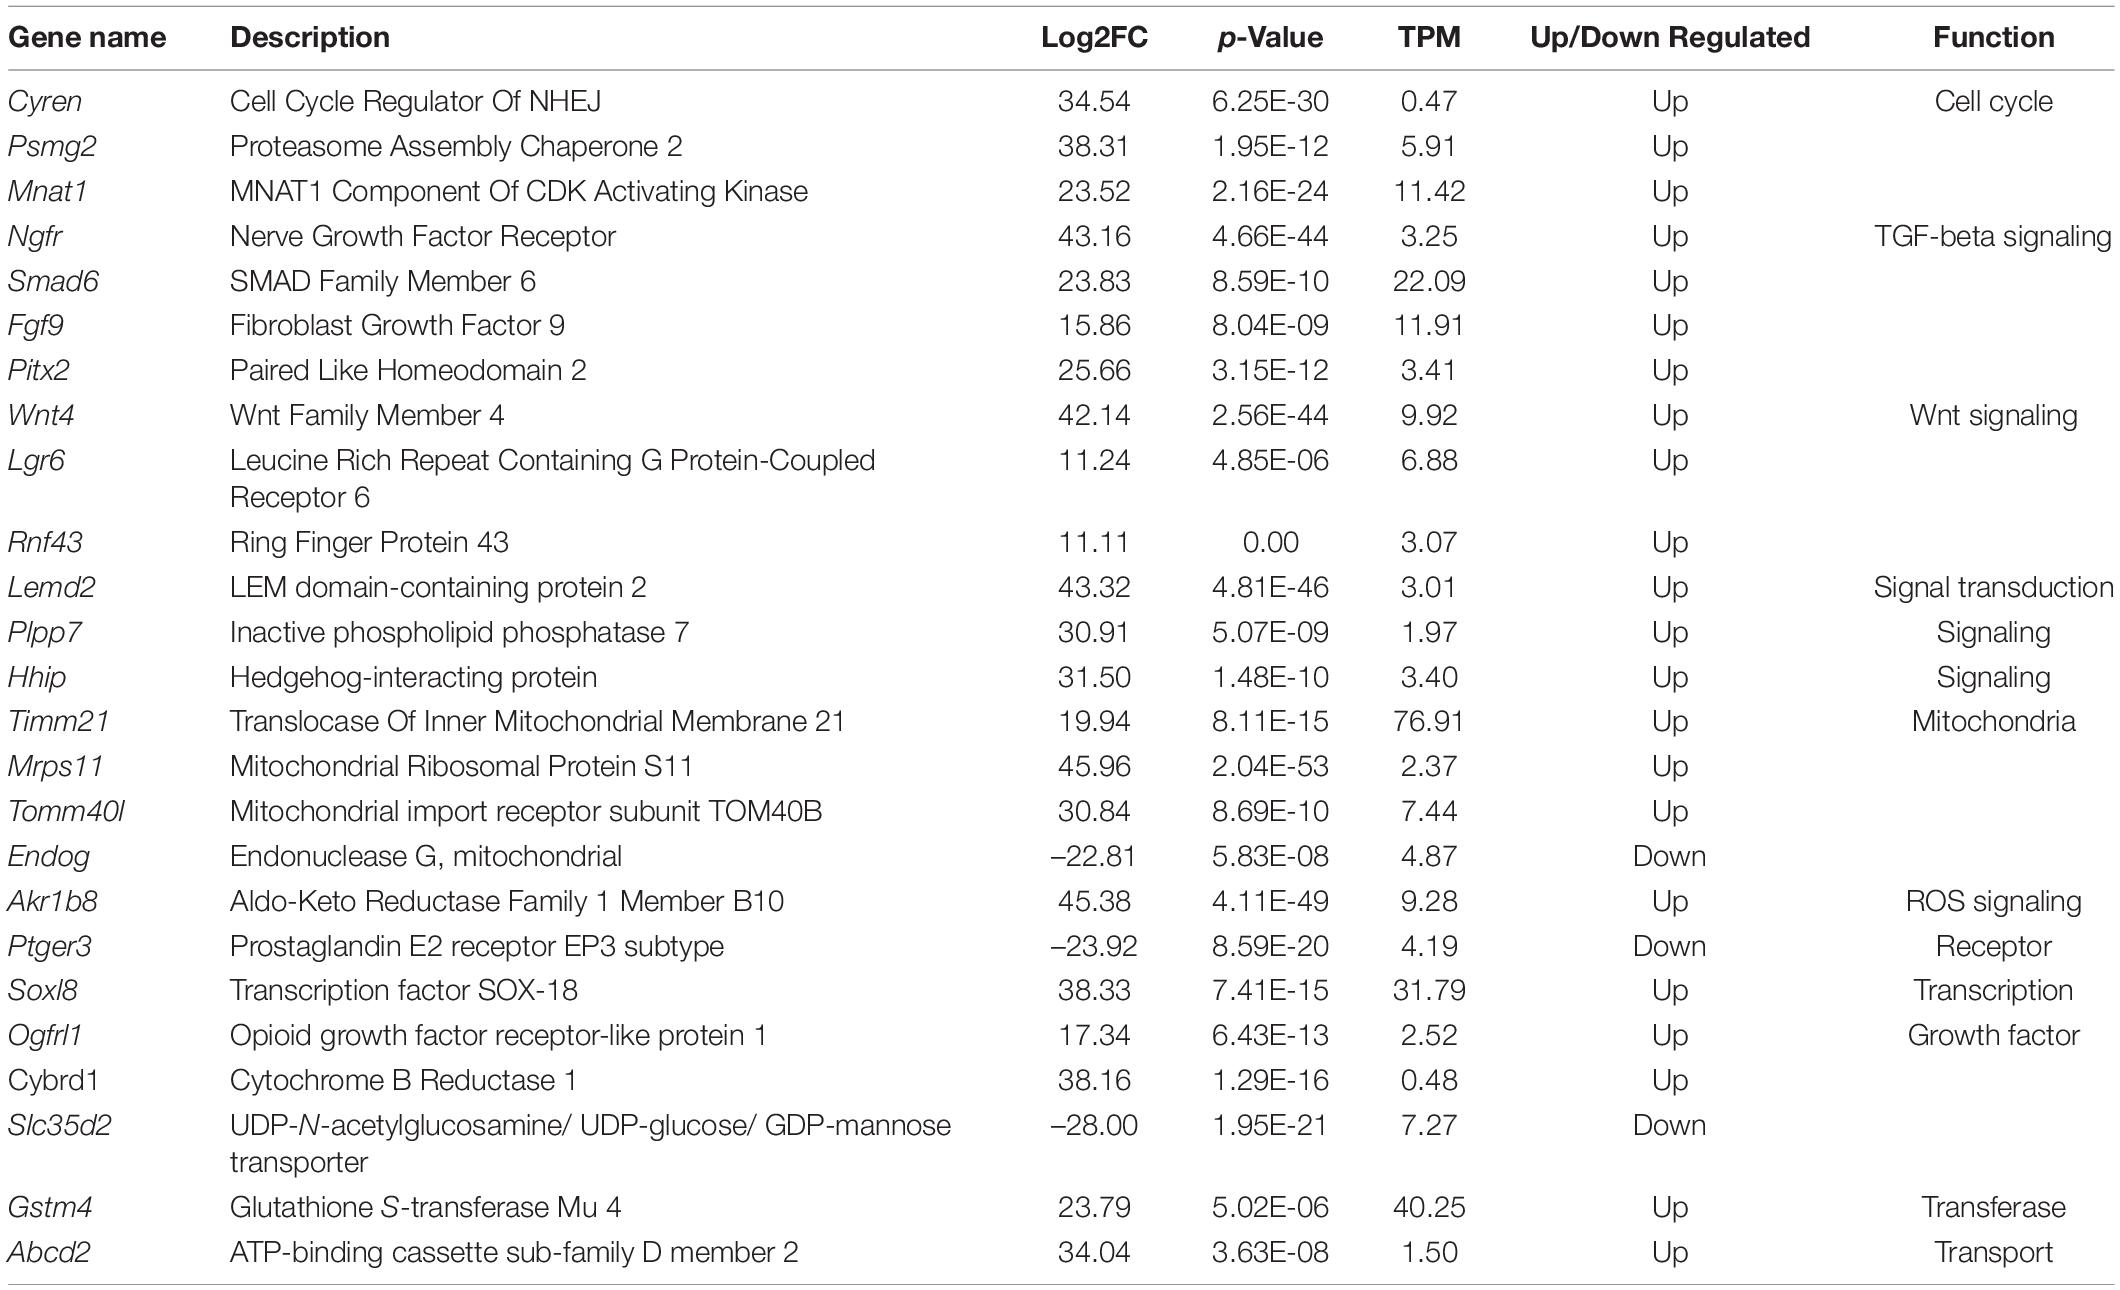
Table 3. Top most significant DEGs in oocytes from primary follicles between in vivo and in vitro groups.
The Level of ROS-Related and Mitochondrial Targeted Genes Is Upregulated in MII Oocytes During in vitro Growth
To assess the endogenous quality of in vitro-grown mature oocytes compared with in vivo-matured oocytes, we further identified molecular characteristics by bioinformatic analysis. Thus, in vivo-grown oocytes were collected from hormone-stimulated adult mice, and in vitro-grown oocytes were collected from two-step-cultured ovaries of neonatal mice and pooled into three replicates for the in vivo (n = 10 per tube) and in vitro (n = 10 per tube) groups (six samples in total) (Figure 1B). RNA sequencing was performed per sample, and mapping to the mouse genome (mm10) was performed with RefSeq genes as the template. The normalization of expression values to achieve TPM, lfcSE, p-values, and adjusted p-values was performed using the DESeq2 R package. For identification of variation in expression values in MII oocytes from the in vivo and in vitro groups, a PCA plot was generated, which showed different clustering between the in vivo and in vitro groups (Figure 4E), suggesting a different gene expression pattern between in vivo- and in vitro-grown MII oocytes. Visualization of genes with large fold changes in volcano plots showed the top 20 significantly differentially expressed genes in MII oocytes from the in vivo and in vitro groups (Figure 4F). The cell cycle-related genes Ccnb1ip1 and Piwil2 were among the top 20 downregulated genes. Moreover, the MAPK signaling-related genes Jund and Ephb2 were among the top 20 upregulated genes. Surprisingly, Nqo2, which is involved in the regulation of ROS, and mitochondrial targeted genes such as Mtch1 and Slc25a10 were also among the top 20 upregulated genes in MII oocytes (Table 4).
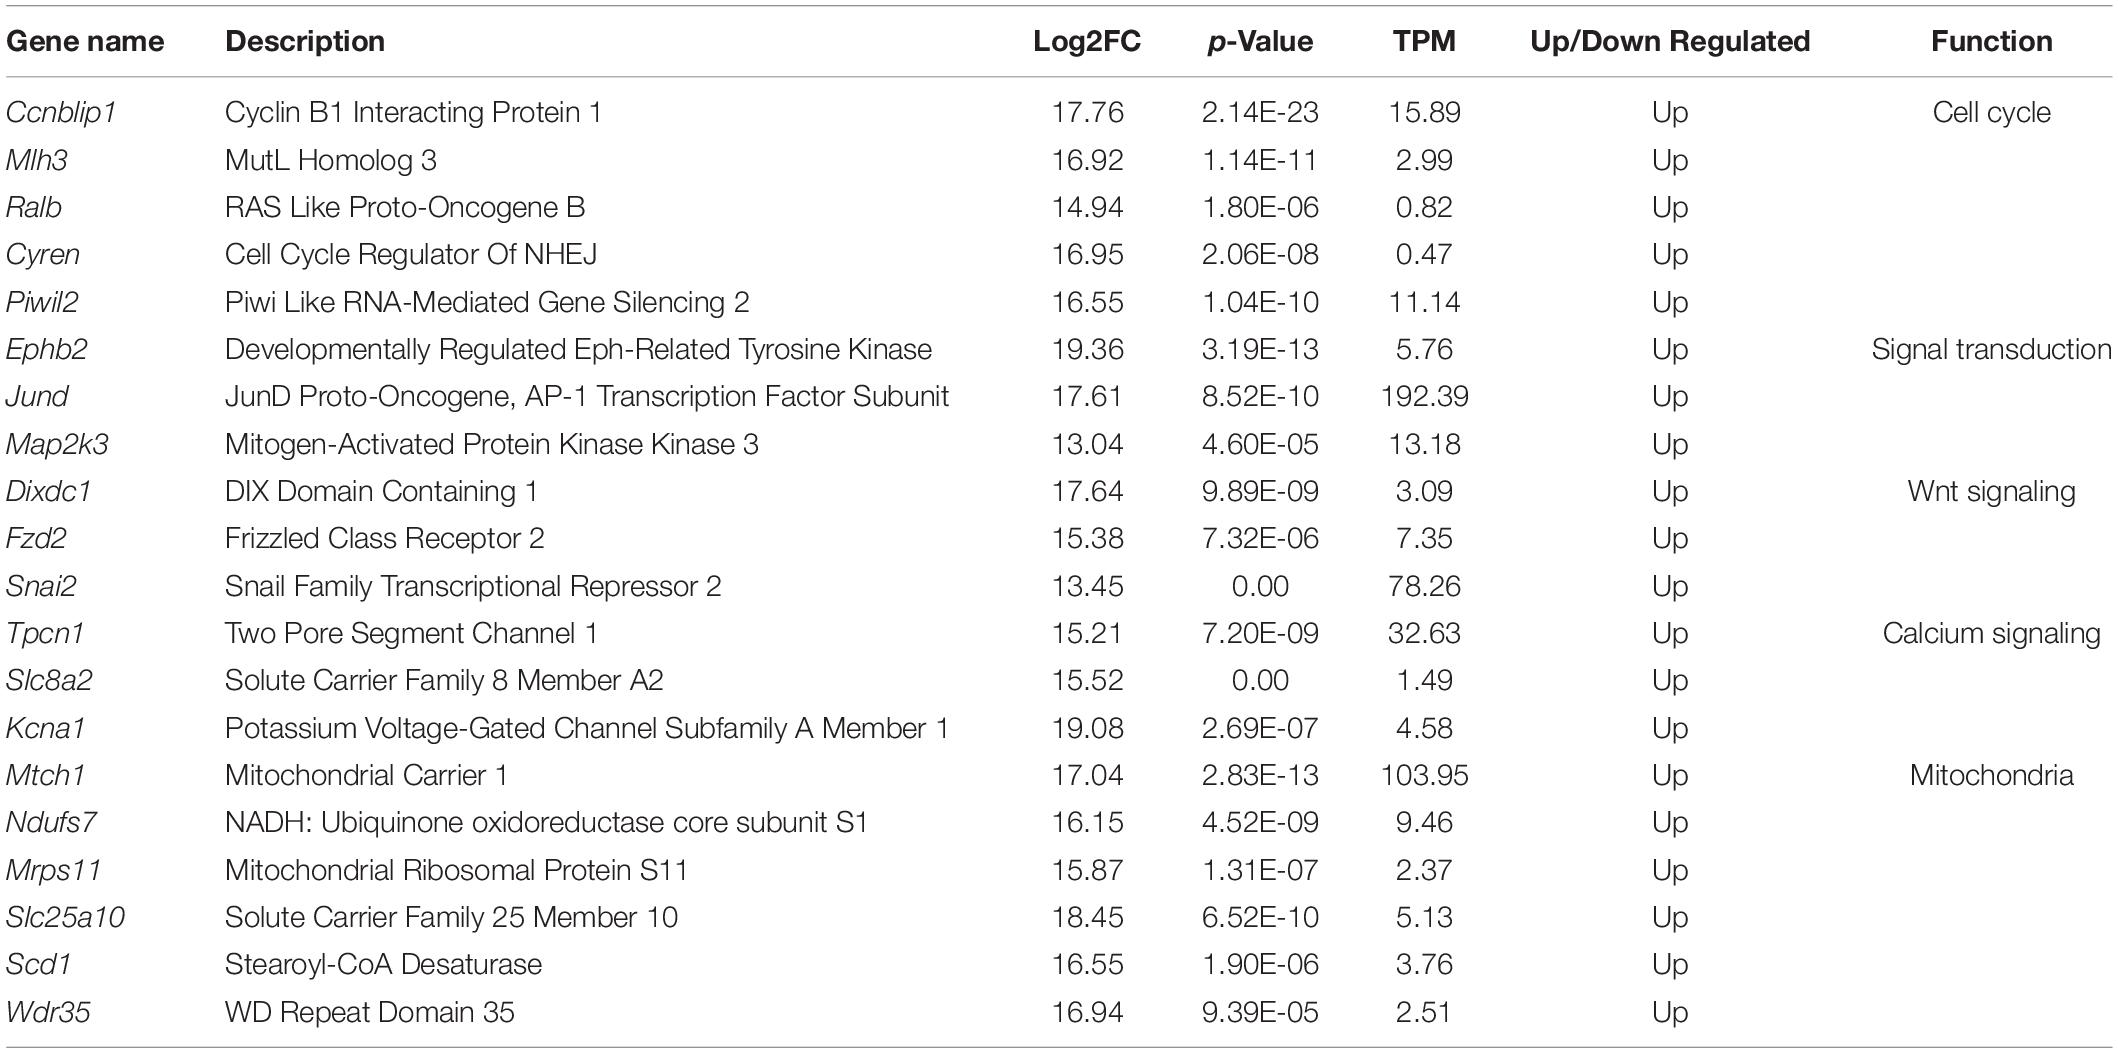
Table 4. Top most significant DEGs in MII oocytes between in vivo and in vitro groups.
Comparison Reveals Distinct Stage-Specific Molecular Characteristics
Interestingly, despite the different gene expression patterns, overlapping genes between oocytes from primordial and primary follicles were identified. The determination of the interaction between the proteins encoded by SDEGs that overlap between oocytes from primordial and primary follicles could help elucidate the molecular mechanism underlying the in vivo and in vitro growth of oocytes from primordial and primary follicles. Interestingly, 437 overlapping SDEGs were identified when comparing oocytes from primordial and primary follicles in the in vivo and in vitro groups. However, when we included SDEGs from MII oocytes, the comparison revealed only 11 overlapping SDEGs for oocytes in the three developmental stages (Figure 5A).
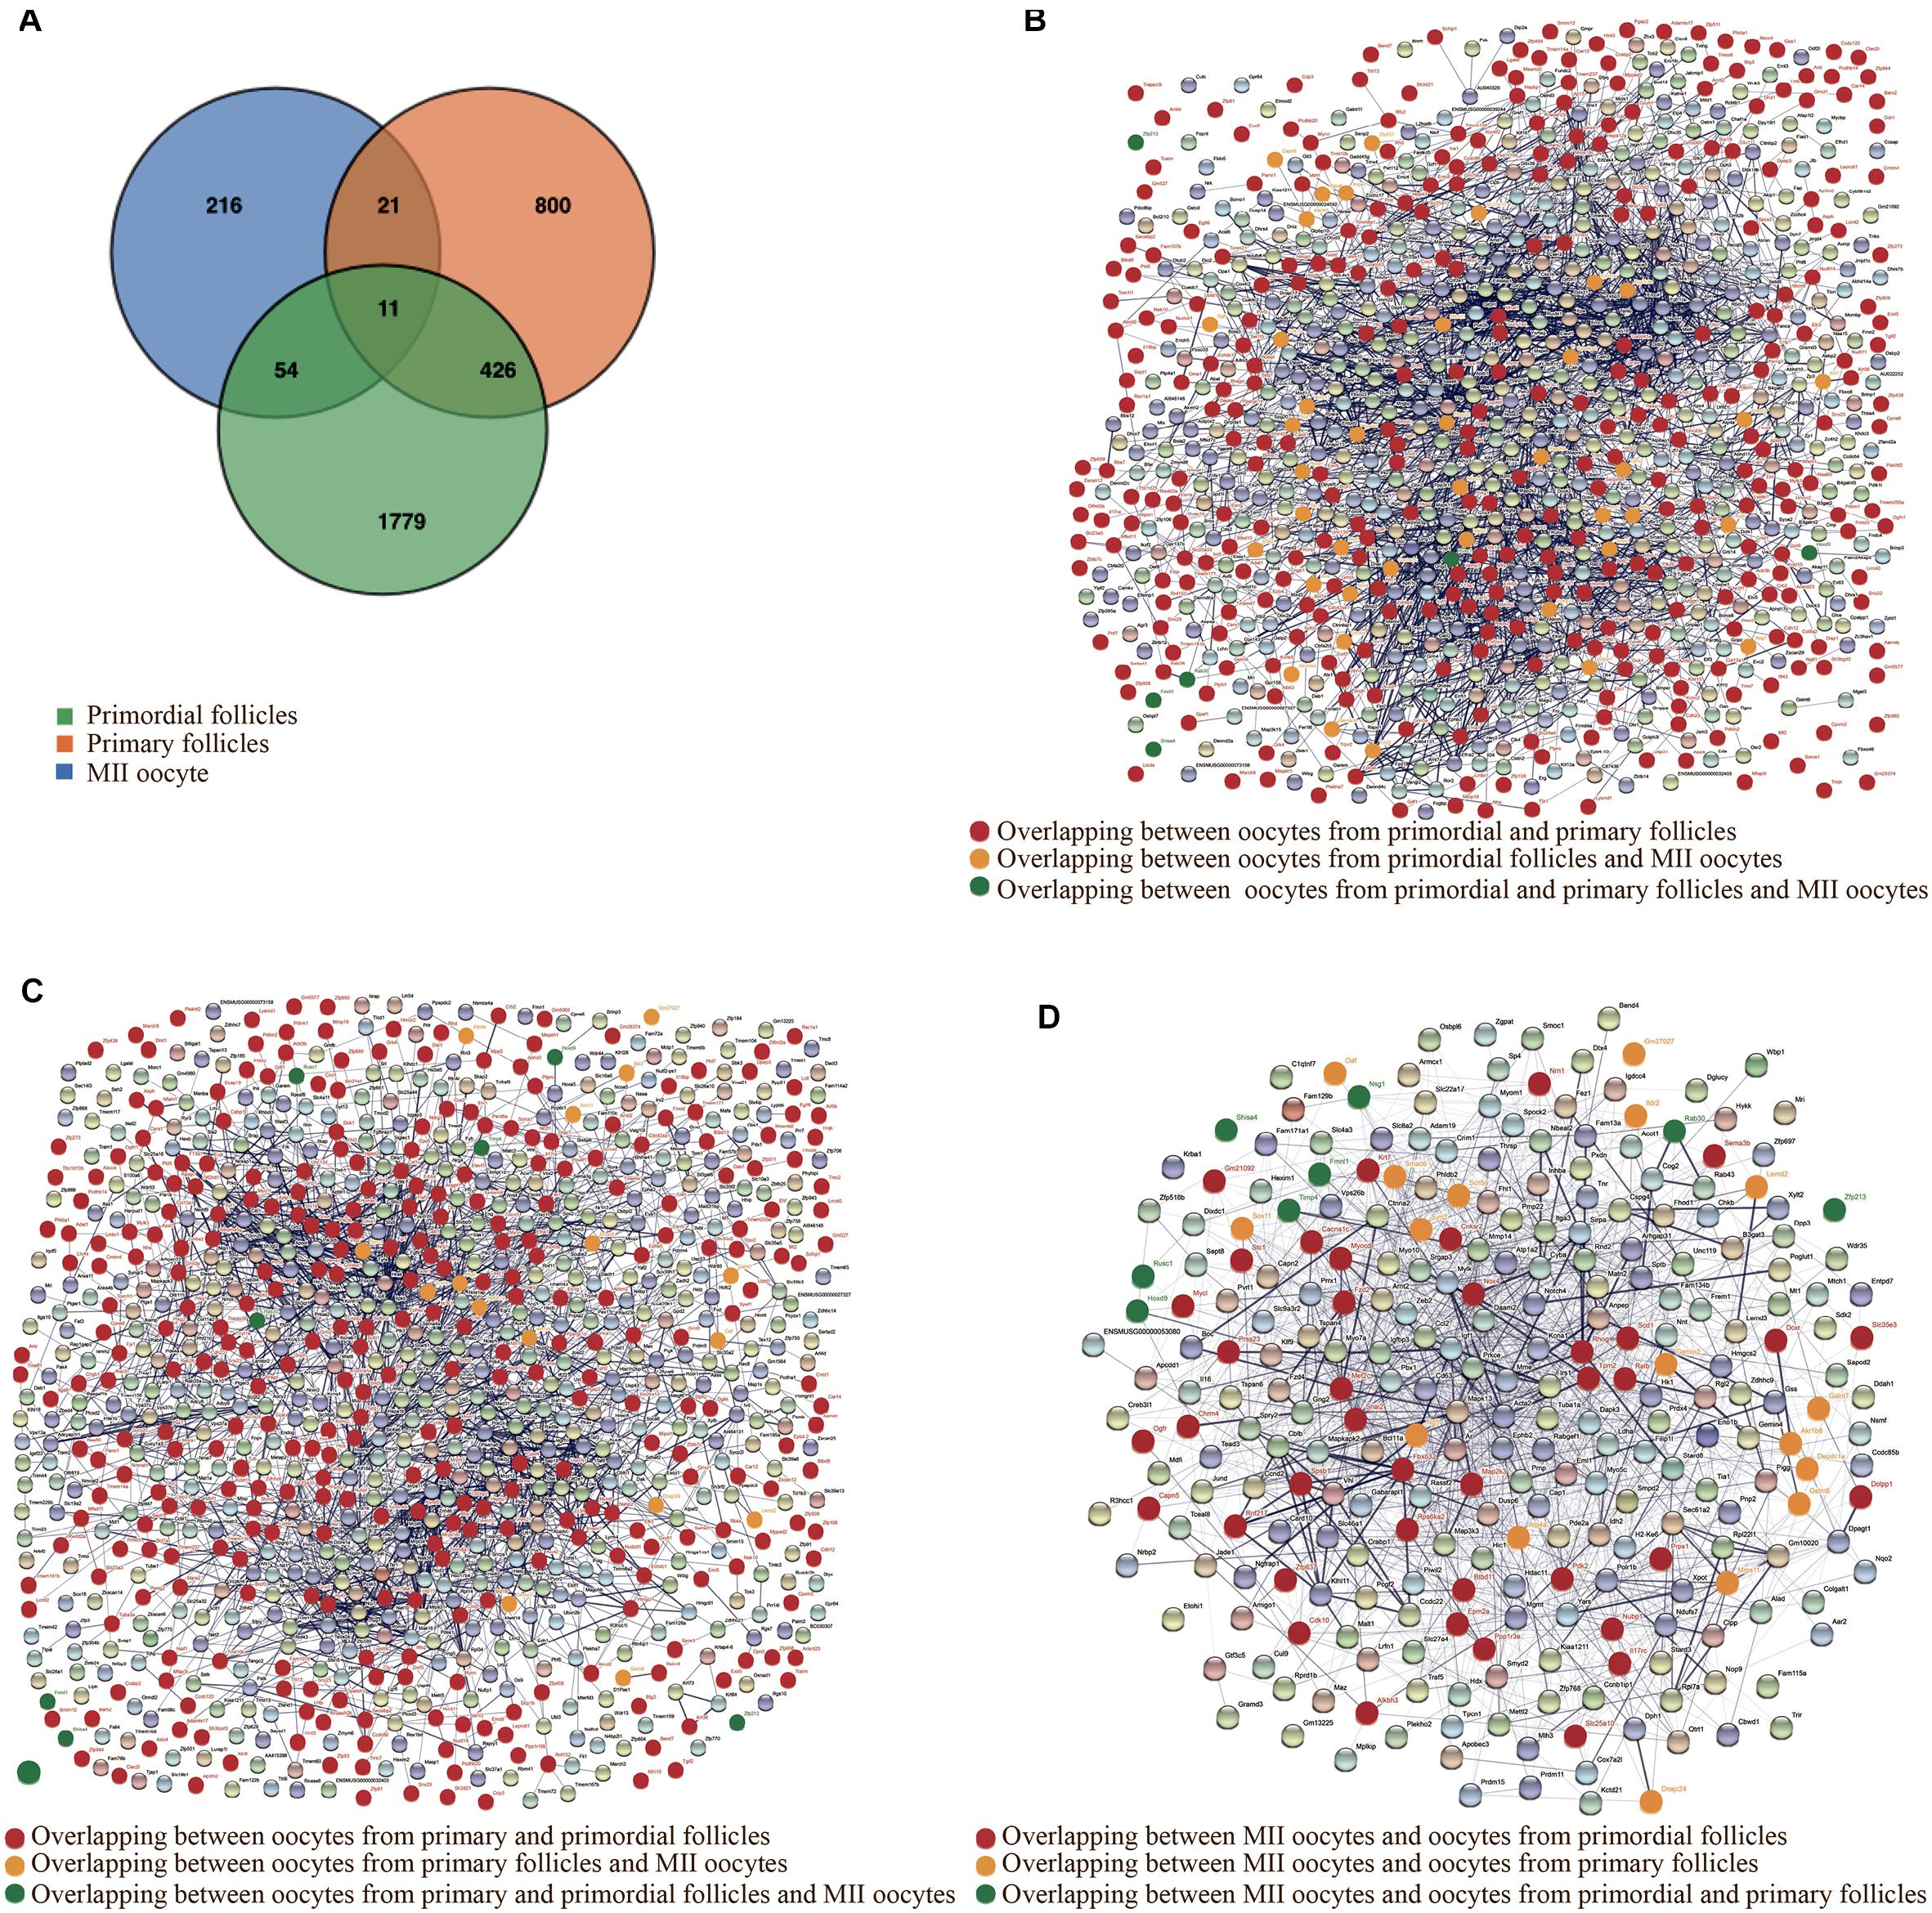
Figure 5. Identification of overlapping significantly differentially expressed genes (SDEGs). (A) Venn diagram representing the overlapping SDEGs between oocytes from primordial and primary follicles and metaphase II (MII) oocytes in the in vitro and in vivo groups. Green, orange, and blue colors show SDEGs of oocytes from primordial follicles, primary follicles, and MII oocytes, respectively. (B) Constructed protein–protein interaction network (PPI) from SDEGs of oocytes from primordial follicles in the in vitro and in vivo groups. Red nodes represent the encoded proteins from overlapping SDEGs between oocytes from primordial and primary follicles in the in vitro and in vivo groups. Yellow nodes show encoded proteins from overlapping SDEGs between oocytes from primordial follicles and MII oocytes. Green nodes refer to encoded proteins from overlapping SDEGs between oocytes from all developmental stages. (C) PPI from SDEGs of oocytes from primary follicles in the in vitro and in vivo groups. Red nodes represent the encoded proteins from overlapping SDEGs between oocytes from primordial and primary follicles in the in vitro and in vivo groups. Yellow nodes show encoded proteins from overlapping SDEGs between oocytes from primary follicles and MII oocytes. Green nodes refer to encoded proteins from overlapping SDEGs between oocytes from all developmental stages. (D) PPI from SDEGs of MII oocytes in the in vitro compared with the in vivo groups. Red nodes represent the encoded proteins from overlapping SDEGs between MII oocytes and oocytes from primordial follicles in the in vitro and in vivo groups. Yellow nodes show encoded proteins from overlapping SDEGs between MII oocytes and oocytes from primary follicles in the in vitro and in vivo groups. Green nodes refer to encoded proteins from overlapping SDEGs between oocytes from all developmental stages.
For a better understanding of the potential molecular mechanism during different developmental stages of oocytes, in relation to growth conditions, we mapped the interactions by protein–protein interaction networks (PPIs) of the anticipated protein products encoded by overlapping SDEGs (Figure 5A), between MII oocytes and oocytes from primordial and primary follicles in the in vivo and in vitro groups (Figures 5B–D and see also Supplementary Figures 2–4).
Tph2, Sgk1, Traf2, Mycn, Hk2, Snapc3, Gucy2c, Mnat1, Cenpo, Gadd45a, Nr3c1, Hlcs, Nabp2, Zc3h8, Timm10, Tomm40l, Slc25a13, Uqcrfs1, Coq3, Acot2, Th, Prkg1, Pmsg1, Vamp3, and Fgf7 were shown to be highly interconnected in both oocytes from primordial and primary follicles, suggesting a similar pattern for high-grade functional interplay. Moreover, Pamr1, Pcdhb20, Hint3, Krt36, Car14, Gstm4, Naif1, Tmc7, and Pdlim2 were slightly interconnected, and Snx25, Ptpro, Shisa4, Smim12, Zfp438, Cpxm2, Tcaim, Sh3d21, Crip3, Bend7, Btbd8, Clec2l, Phf7, Lrrc40, Abcc4, and Barx2 were visualized with no connections in oocytes from both primordial and primary follicles, indicating the same order of low-grade functional interrelations. In contrast, Mocs1, Lypd6b, Hmgcl, Klhl15, Rsc1a1, Ap3m2, Dpep3, Dnd1, Lctl, Cnn1, Arl5b, Ankrd23, and Psmg2 had higher interconnections in oocytes from primordial follicles than oocytes from primary follicles, while Timm21, Timm8a1, Arsi, Mt2, Mageh1, Gas1, Cpne8, Leprotl1, Cmtm4, Ddr1, Il17ra, Oma1, and Aamdc had higher interrelations in oocytes from primary follicles than oocytes from primordial follicles (Figures 5B,C).
Btbd11, Epm2a, Ppp1r3e, Rps6ka2, Dcxr, Pdk2, Chrm4, Fzd2, and Cacna1c were highly interconnected in oocytes from primordial follicles, while these SDEGs had slight interconnections in MII oocytes. Moreover, Ogfr, Krt7, Cdk10, and Slc35e3 were determined to be slightly interconnected in both oocytes from primordial follicles and MII oocytes. In contrast, Nrn1, Stc1, and Mycl were highly interconnected in oocytes from primordial follicles, while these SDEGs had slight connections in MII oocytes. Interestingly, Ralb, Fbxo32, Map2k3, Tpm2, Myocd, Rhog, Snai2, Mef2c, Nox4, Scd1, and Rnf217 were determined to be highly interrelated in both MII oocytes and oocytes from primordial follicles (Figures 5B,D).
Depdc1a was highly interrelated in oocytes from primary follicles, while it showed a slight connection in MII oocytes. Surprisingly, Ngfr, Syn2, and Smad6 were highly interrelated in both MII oocytes and oocytes from primary follicles. Moreover, Sox11, Atp4a, Galnt7, Lemd2, Dnajc24, Gemin2, Gstm6, Ildr2, and Oaf were determined to be slightly interrelated, and Gm27027 showed no connections in either MII oocytes or oocytes from primary follicles (Figures 5C,D). These results suggested that although SDEGs in MII oocytes showed higher overlap with those in oocytes from primordial follicles, the interconnection of the proteins encoded by overlapping SDEGs between MII oocytes and oocytes from primary follicles was more similar than that of overlapping SDEGs between MII oocytes and oocytes from primordial follicles in the in vivo and in vitro groups.
In summary, screening of SDEGs by PPI networks showed that most of them had mutual interrelations. Moreover, identification of overlapped SDEGs between oocytes of different developmental stages in PPI showed that despite this overlapping, the interconnections between different developmental stages are different. Therefore, screening of different interconnections in overlapped SDEGs between different developmental follicle stages is fundamental to understand the underlying molecular mechanism from early to late stages of follicular development. Future work is needed to confirm the specific roles of the gene products.
To further investigate the SDEGs, we visualized all SDEGs based on both the number of genes and an absolute fold change of 2 in oocytes from different developmental stages between the in vivo and in vitro groups (Figures 6A,B). The list of all SDEGs had 2,270 significant genes with 959 upregulated genes and 1,311 downregulated genes in oocytes of primordial follicles. Moreover, the expression levels of 975 and 282 genes were upregulated and downregulated, respectively, in oocytes of primary follicles (Figure 6A). Interestingly, the expression of most of the genes was downregulated in oocytes from primordial follicles but upregulated in oocytes from primary follicles (Figure 6B). Surprisingly, the list of all SDEGs showed that the levels of most of the genes in MII oocytes were upregulated (245 genes), which was also similar to oocytes from primary follicles (Figures 6A,B).
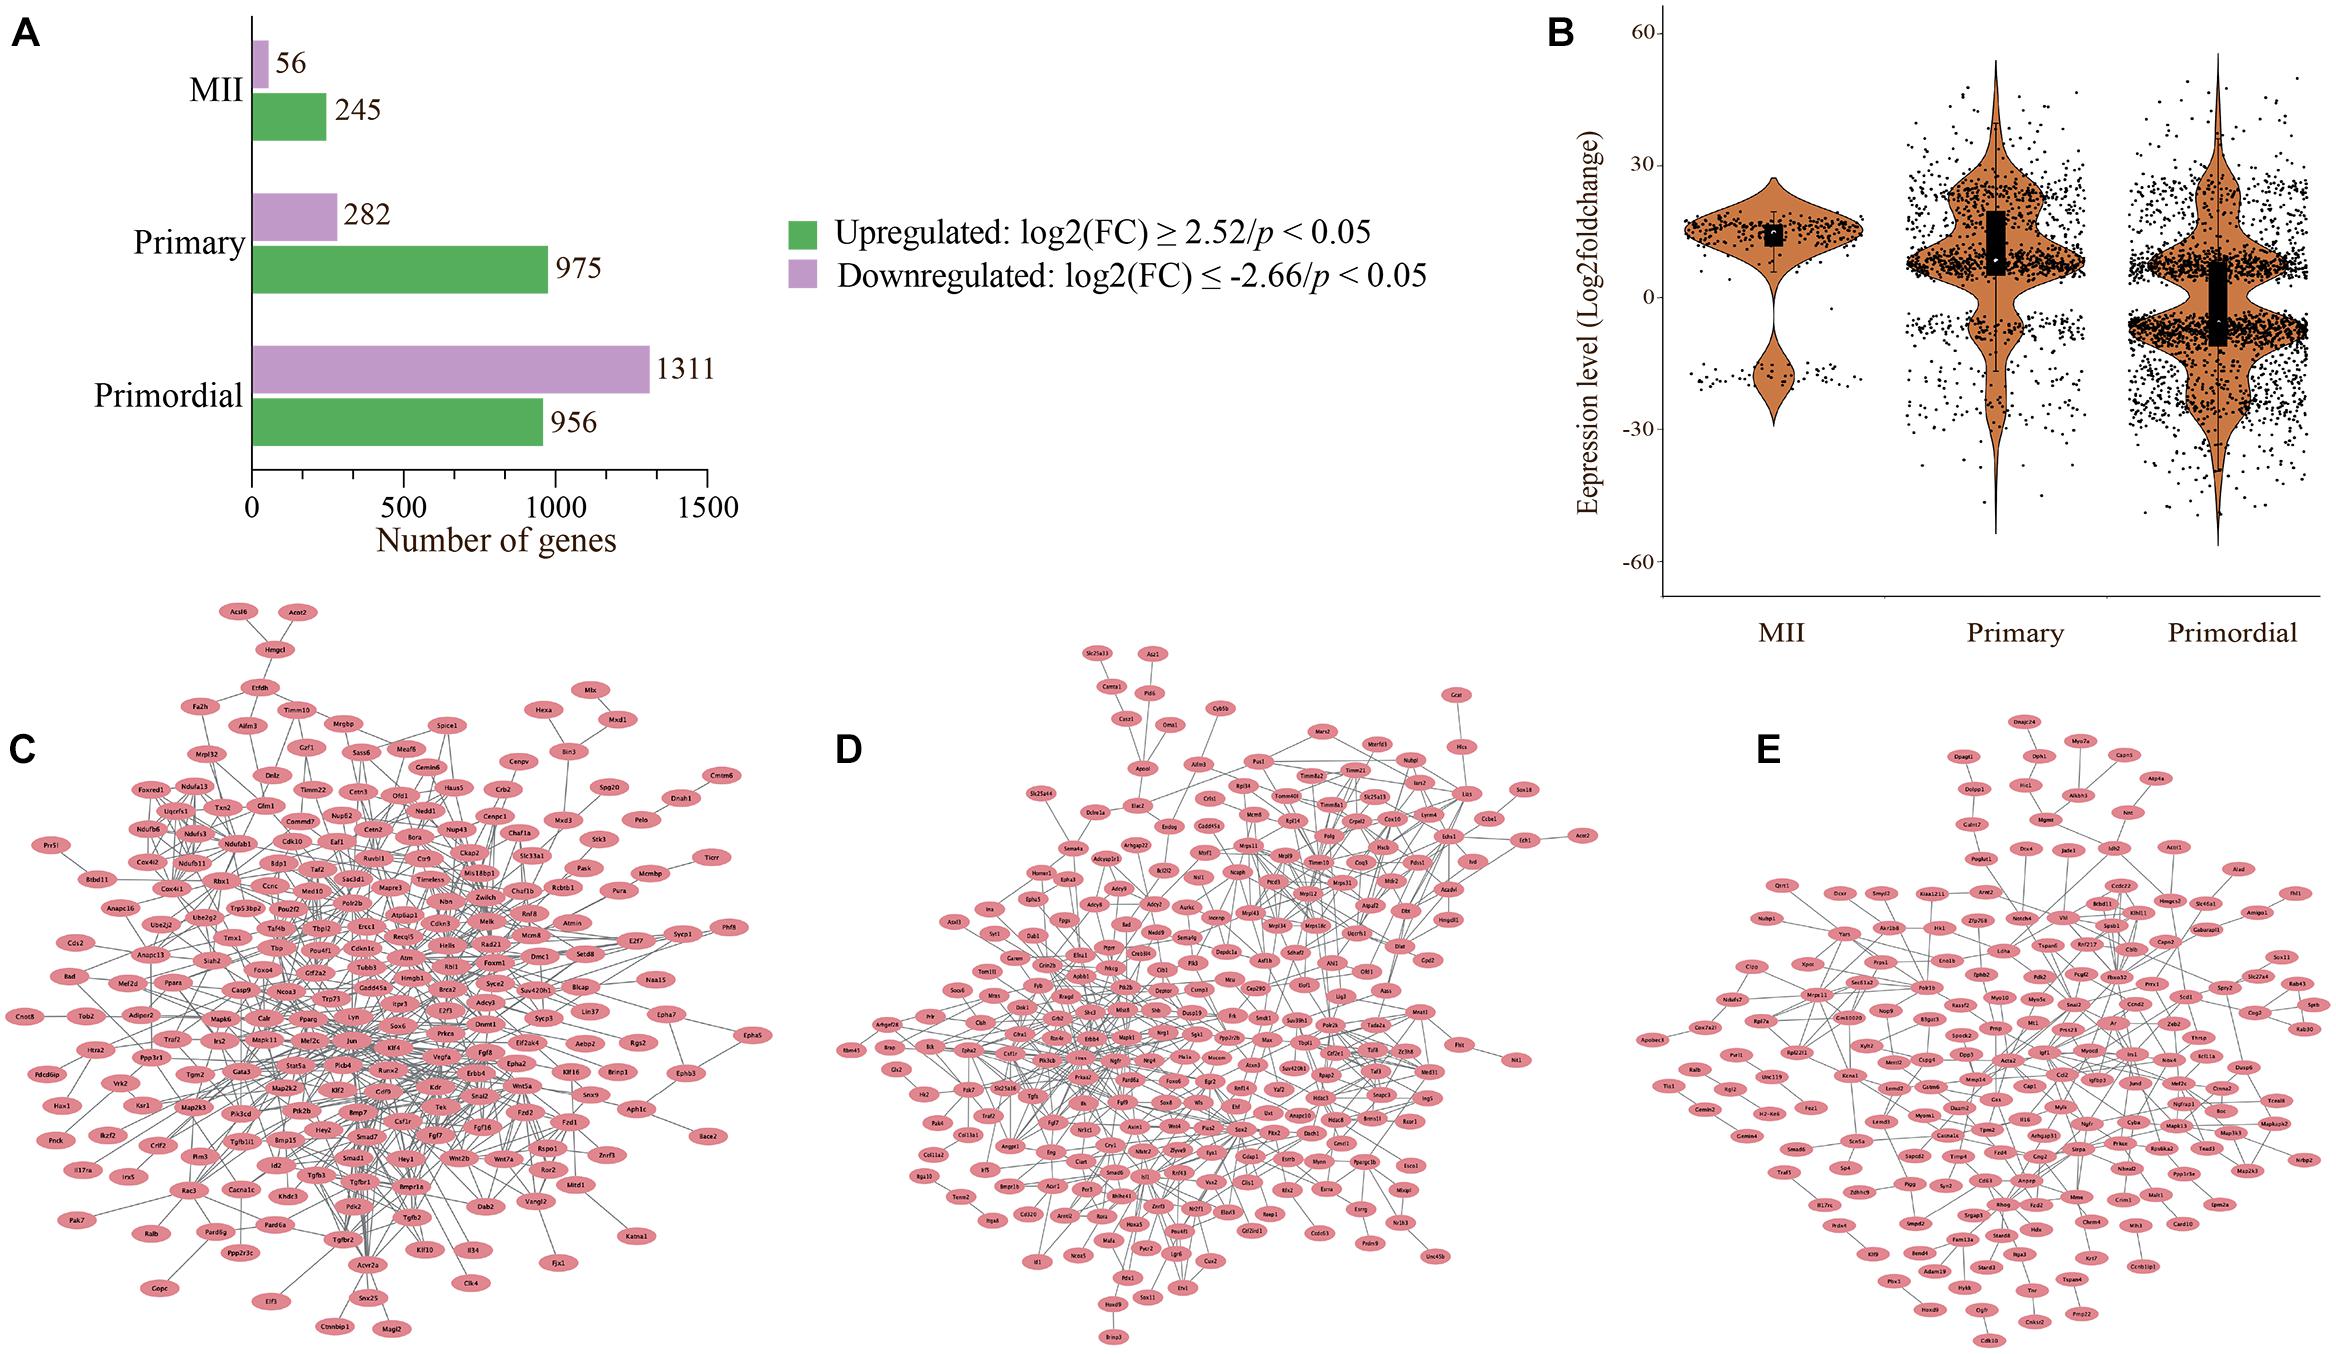
Figure 6. Visualization of SDEGs by bar chart, violin plot, and cloud networks. (A) The number of SDEGs (adjusted p-value < 0.05) represented by the bar chart. Differential expression analysis and normalization were performed using DESeq2 in R. (B) Violin plot representing the distribution of SDEGs in oocytes from primordial and primary follicles and MII oocytes in the in vivo and in vitro groups. Each dot shows the log2 fold change values in oocytes. (C–E) Network of 302 selected SDEGs in oocytes from primordial (C) and primary (D) follicles and MII oocytes (E) in the in vivo and in vitro groups. Different expression patterns are shown for the in vivo- and in vitro-grown MII oocytes and oocytes from primordial and primary follicles.
For visualization, 302 selected SDEGs were applied to construct PPI networks (Figures 6C–E). The PPI networks of oocytes from primordial and primary follicles showed different expression patterns of SDEGs in these oocytes between the in vivo and in vitro groups (Figures 6C,D). Surprisingly, 54 SDEGs showed overlap between MII oocytes and oocytes from primordial follicles, and 21 overlapping SDEGs were detected between MII oocytes and oocytes from primary follicles (Figures 5A,D).
A PPI network was built from all SDEGs in MII oocytes (Figure 6E). Different expression patterns were observed between in vivo- and in vitro-grown MII oocytes and oocytes from primordial and primary follicles. Interestingly, a hierarchically clustered heatmap showed a major difference between MII oocytes and oocytes from both primordial and primary follicles based on the involved pathways in a comparison of the in vivo and in vitro groups (Figure 7A). In MII oocytes from the in vivo and in vitro groups, the expression genes in cluster 1 and cluster 2, as well as a subcluster of genes, were highly upregulated. Consistent with stage-specific observations of SDEGs, cell cycle- and mitochondria-related genes were found to have different expression patterns between in vivo- and in vitro-matured MII oocytes and oocytes from primordial and primary follicles (Figures 7B–D). Moreover, pathway enrichment analysis of SDEGs showed that most of the involved pathways, including the cell cycle, MAPK signal transduction, Wnt signaling, and calcium signaling pathways, were highly enriched in the in vitro-matured oocytes compared with the in vivo-matured MII oocytes (Figure 7A). The enrichment pathway analysis further showed that different signaling pathways such as bone morphogenetic protein (BMP) signaling, fibroblast growth factor (FGF) signaling, target of rapamycin complex 1 (TORC1) signaling, TGF-β signaling pathway, mitochondrial function, and ROS signaling, in oocytes from primordial follicles, were changed during in vitro culture condition in oocytes from primordial follicles during in vitro culture. Specifically, in oocytes from primary follicles, several signaling pathways such as vascular endothelial growth factor (VEGF) signaling, epidermal growth factor (EGF) signaling, TGF-β signaling pathway, MAPK signaling transduction, cell cycle, mitochondrial function, and ROS signaling were altered during in vitro culture. In addition, extracellular signal-regulated kinase (ERK) signaling, gonadotropin releasing hormone (GnRH) signaling, ubiquitylation (UbI) conjugation pathway, nuclear factor kappa-light-chain enhancer of activated B cell (NF-KappaB) pathway, cell cycle, mitochondrial function, and ROS signaling in MII oocytes were changed during in vitro culture. In conclusion, the results showed that there was a large difference between early and late stages of follicular development and oocyte maturation, in relation to signaling pathways.
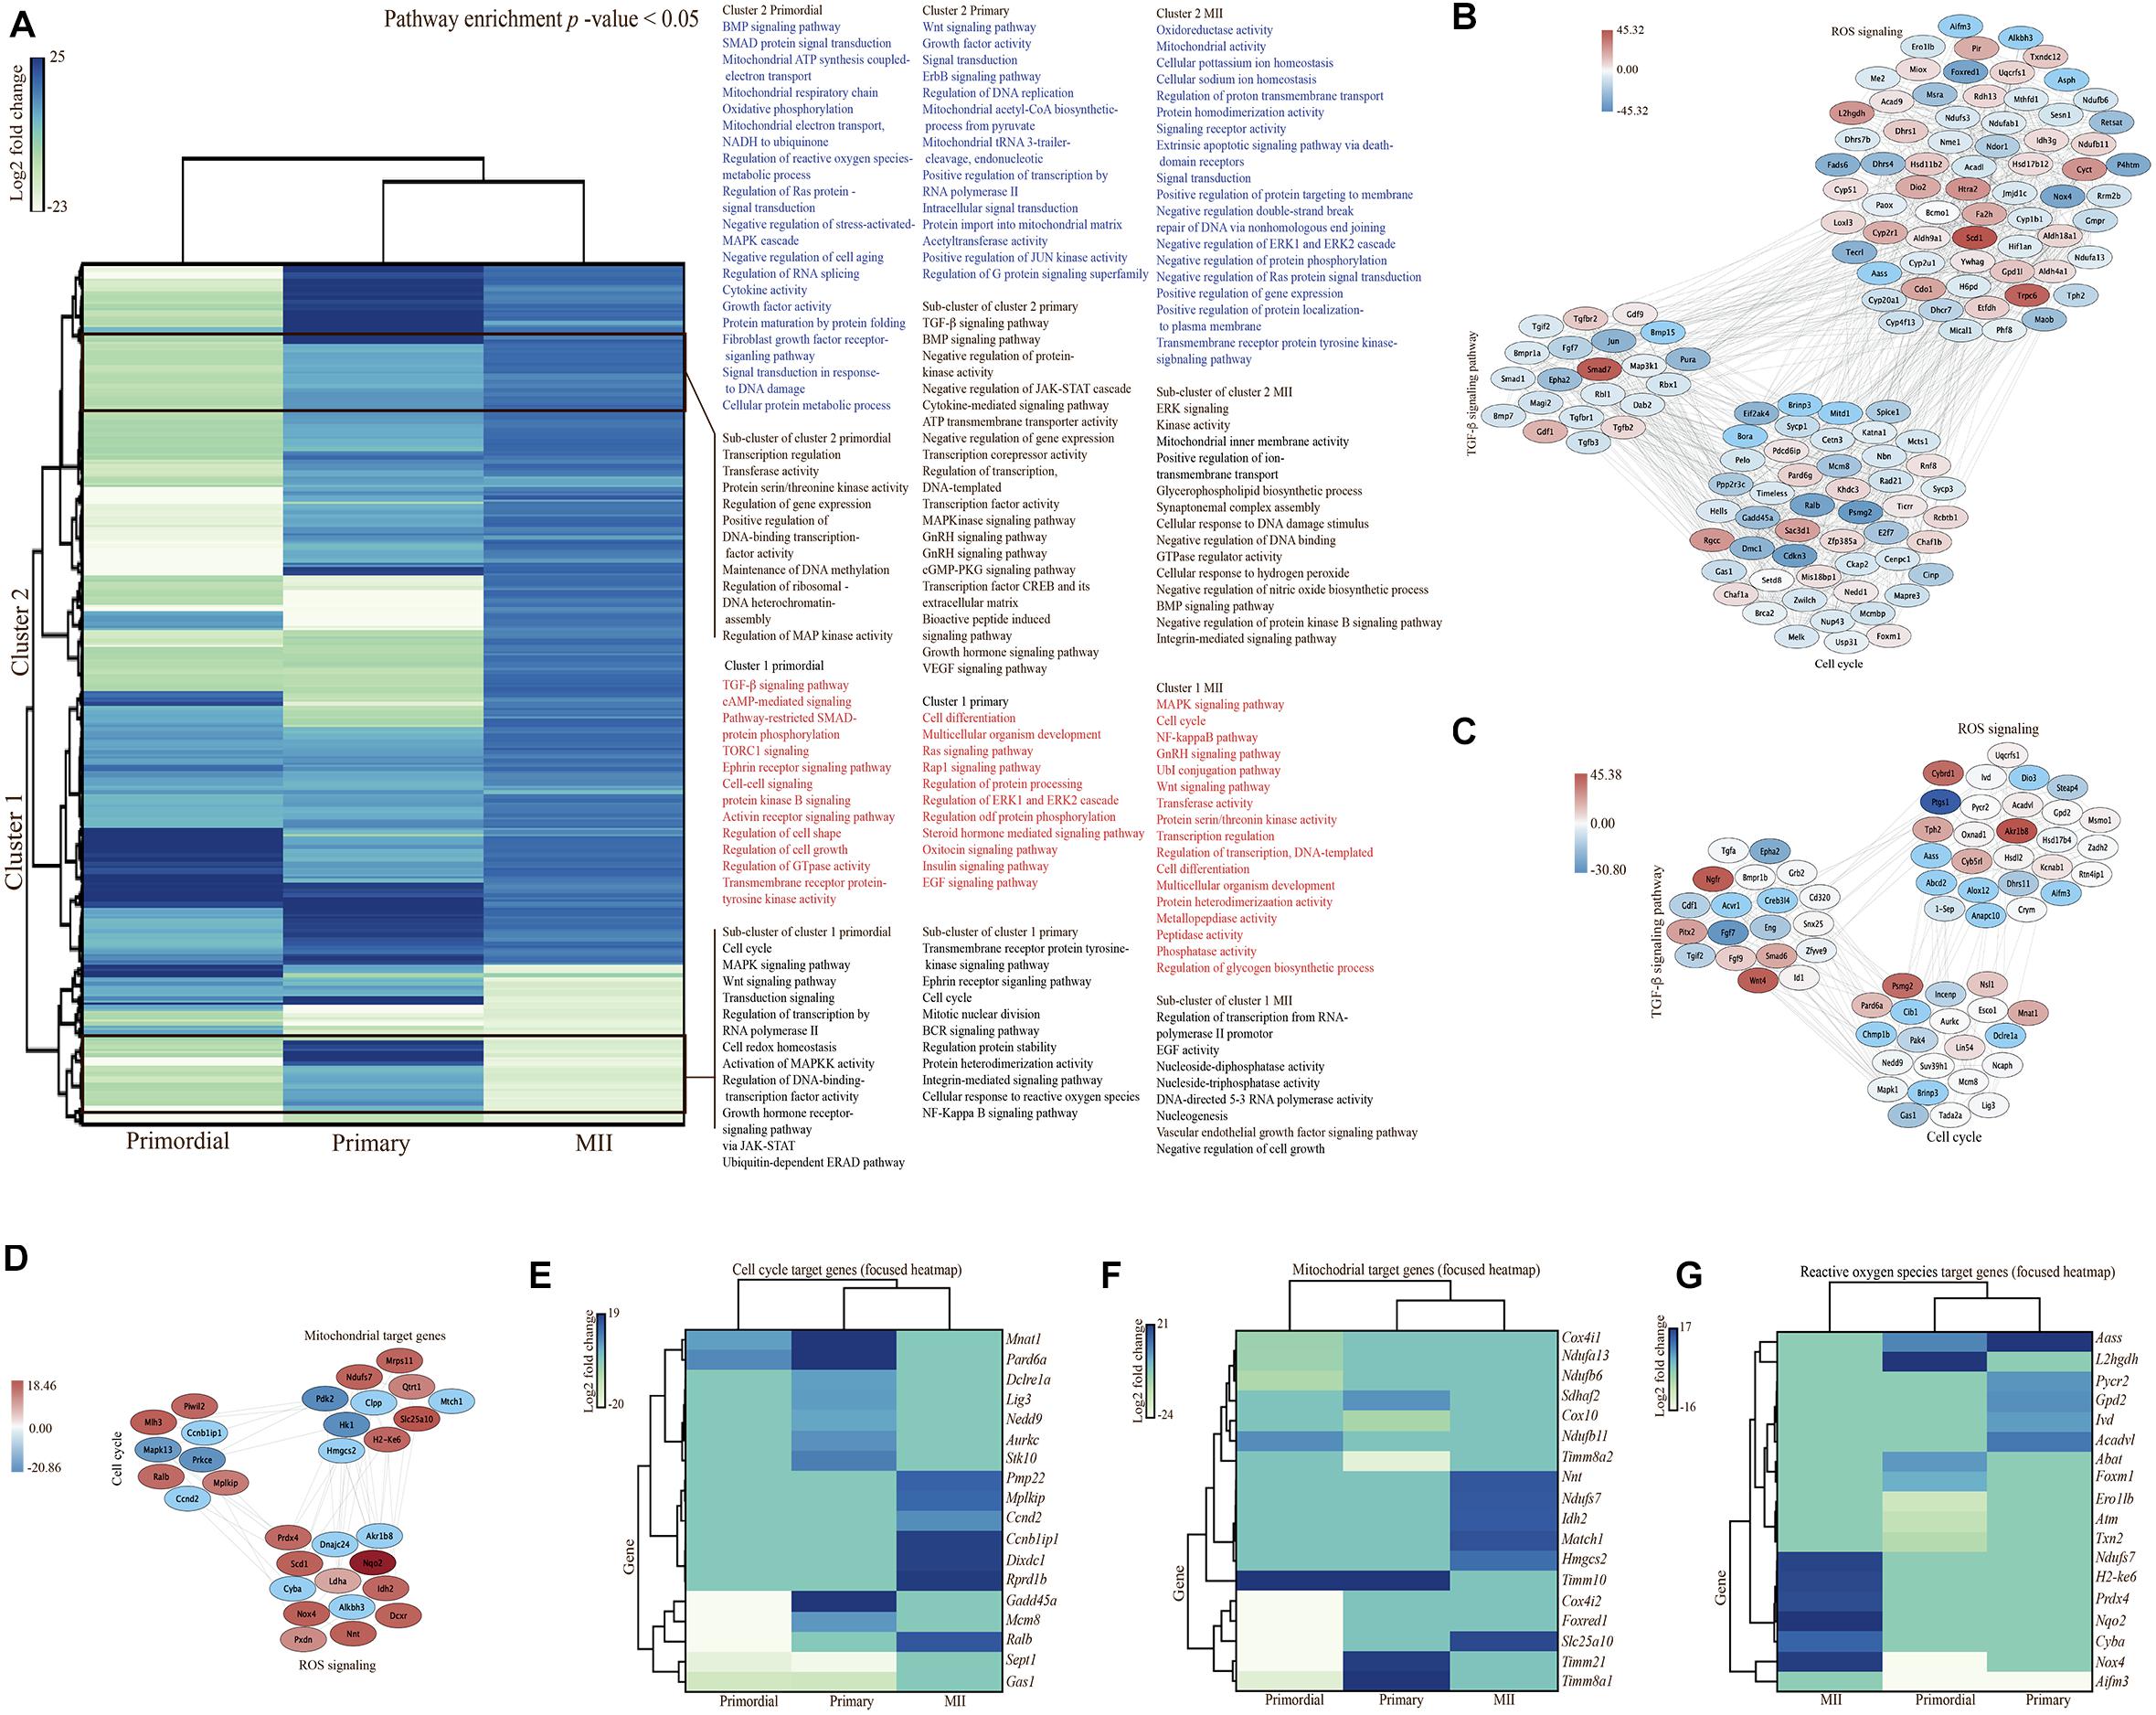
Figure 7. Pathway enrichment analysis in oocytes. (A) Hierarchically clustered heatmap of the 302 selected significantly differentially expressed genes (SDEGs) in oocytes from primordial and primary follicles and MII oocytes in the in vitro group compared with the in vivo group. Pathway enrichment analysis was performed in each cluster of genes. Each subcluster of clusters is outlined, and the list of significantly enriched pathways is shown for each cluster and subcluster. Columns show different developmental stages of oocytes at the bottom. The color code based on log2 fold changes is shown as a scale (ranging from –23 to 25). (B–D) Interaction networks are shown for differentially expressed genes associated with the TGF-β signaling pathway, cell cycle, and ROS in oocytes from primordial (B) and primary follicles (C) and cell cycle-, ROS-, and mitochondria-related genes in MII oocytes (D). (E–G) Focused heatmaps of the cell cycle (E), mitochondrial function (F), and ROS (G) of oocytes from primordial and primary follicles and MII oocytes in the in vitro group compared with the in vivo group. All involved genes are shown on the right-hand side, according to their colors on the left-hand side in each row of each heatmap. The color codes based on log2 fold changes are shown as a scale for each heatmap.
Curiously, expression of the majority of genes in subcluster 1 and cluster 2, as well as its subcluster of genes, was downregulated in oocytes from primordial follicles from the in vitro group compared with the in vivo group (Figure 7A). In contrast, expression of the majority of genes of both clusters 1 and 2, as well as their subclusters of genes, was upregulated in oocytes from primary follicles in the in vitro group compared with the in vivo group. Pathway enrichment analysis of gene sets from the clusters showed that genes involved in the cell cycle, TGF-β signaling pathway, MAPK signaling transduction, mitochondrial function, and ROS signaling were mostly enriched in oocytes from primary follicles. These results were consistent with our SDEG data showing a large fold change in volcano plots. To examine the TGF-β signaling pathway, cell cycle, ROS signaling, and mitochondria, we generated networks of SDEGs involved in these functions in oocytes from both primordial and primary follicles and MII oocytes (Figures 7B–D). Intriguingly, a different gene expression pattern in the TGF-β signaling pathway was noted between the in vivo- and in vitro-grown oocytes from primordial (Figure 7B) and primary follicles (Figure 7C), suggesting follicle stage-specific TGF-β-related functions. Notably, cell cycle- and ROS-related genes displayed different follicle-stage expression patterns in oocytes grown in vivo and in vitro (Figures 7B,C). For more details, focused heatmaps were generated for cell cycle (Figure 7E), mitochondria-related (Figure 7F), and ROS-related (Figure 7G) target genes, which revealed down- or upregulation of the expression of the genes in the in vitro oocytes compared with in vivo oocytes from primordial follicles and MII oocytes.
Discussion
A Resource for Elucidating the in vitro Activation and Maturation of Ovarian Follicles
In the present study, we provided detailed insights into stage-specific gene expression profiles and the corresponding signaling pathways of activated and mature mouse ovarian follicles grown either in vivo or in vitro by analyzing transcriptomes from oocytes from primordial and primary follicles and comparing them with those of MII oocytes. Determination of the detailed transcriptomes of follicle stage-specific oocytes in vivo and in vitro will contribute to in vitro growth and be a valuable source for future optimization of fertility treatments. Excitingly, we identified genes encoding signaling factors related to the cell cycle, mitochondria, and ROS production. We identified approximately 1,000–3,000 DEGs in oocytes from primordial and primary follicles in relation to their in vivo and in vitro conditions and approximately 300 DEGs in in vivo- and in vitro-matured MII oocytes. Despite the fact that oocytes grown in vivo and in vitro in different developmental follicle stages showed similar morphology and quality, our transcriptomic analysis identified different molecular characteristics due to the in vitro culture system.
In vivo and in vitro Growth of Oocytes From Primordial and Primary Follicles
Surprisingly, we detected major changes in the mechanisms other than classic oocyte-activating PI3K–PTEN–AKT–FOXO3 signaling, which may elucidate the mechanisms underlying follicular development. Our functional analysis indicated that one of the dominant processes affected by in vitro conditions was cell cycle progression. Interestingly, most cell cycle-related genes, such as Cdk10, Ogfr, and Ralb and Psmg2 and Cyren, were among the top 20 downregulated DEGs in oocytes from primordial follicles. Cdk10 is a Cdc2-related kinase during the G2 or M phase and promotes cell division (Zehra et al., 2019). Moreover, Cdk10 regulates transcriptional activity and development through the Raf–MEK–ERK1/2 pathway, showing its role in development as well as the cell cycle (Guen et al., 2017). Interestingly, several cell cycle activator (Cdk10, Ralb) and inhibitor (Ogfr, Psmg2, Cyren) genes were differentially expressed in in vitro-grown oocytes compared with in vivo-grown oocytes from primordial follicles.
Interestingly, downregulation of the expression of Cdk10, Cyren, and Psmag2, which are regulators, and Ogfr, a suppressor, and Ralb, as an activator of the cell cycle, suggests a possible fine-tuning balance between these activators and suppressors of cell cycle progression during in vitro culture.
Surprisingly, despite downregulation of the expression of most DEGs associated with the cell cycle in oocytes from primordial follicles, oocytes from primary follicles showed upregulation of the expression of most cell cycle-associated genes, such as Cyren, Psmg2, and Mnat1. Surprisingly, the expression of Cyren and Psmg2, which showed strong downregulation in oocytes from primordial follicles, was highly upregulated in oocytes from primary follicles in the present study. These results suggested that there may be a dynamic pattern in cell cycle function from primordial to primary follicle development, which was changed during in vitro culture, showing the key role of cell cycle-involved genes in the primordial to primary follicle transition. This finding suggested the important role of regulating the cell cycle in the activation of dormant follicles. Accordingly, differential expression of genes associated with the cell cycle and growth was detected in previous studies in mice (Dharma et al., 2009), rats (Kezele et al., 2005), humans (Markholt et al., 2012), and primates (Arraztoa et al., 2005), along with global analysis of murine follicles (Chang et al., 2016) and microarray analysis of human and bovine oocytes (Adona et al., 2016; Ye et al., 2020).
In recent studies, members of the TGF-β superfamily have been investigated due to their regulatory role in ovarian function and fertility (Galloway et al., 2000; McNatty et al., 2005; Li, 2015; Gao Y. et al., 2017). Notably, our pathway analysis suggests that the TGF-β signaling pathway, e.g., TGF-β-associated genes (such as Pura, Snx25, and Smad7), regulates ovarian in vitro culture. We found that the expression of several genes associated with the TGF-β signaling pathway (such as Pura and Snx25) was downregulated in oocytes from primordial follicles but enriched in oocytes from primary follicles, indicating that the TGF-β signaling pathway plays a role in primordial follicle activation during in vitro culture. Interestingly, Pura and Snx25 expression was highly downregulated in oocytes from primordial follicles. Snx25 is a regulator of the TGF-β signaling pathway that can increase the degradation of TGF-β receptors by the lysosomal pathway, and overexpression of Snx25 suppressed TGF-β activity, while knockdown of endogenous SNX25 expression increased the level of TGF-β receptors and enhanced TGF-β signaling (Hao et al., 2011). Therefore, strong downregulation of Snx25 expression in oocytes from primordial follicles showed that in vitro culture affects primordial follicle activation by suppressing the expression of this gene, leading to increased TGF-β signaling. Despite downregulation of the expression of Snx25, an inhibitor of TGF-β signaling, Pura expression was also highly downregulated in the in vitro oocytes compared with in vivo oocytes from primordial follicles and may activate TGF-β signaling. Pura encodes a multifunctional DNA- and RNA-binding protein. A previous study showed that PURA binding to TGF-β led to increasing TGF-β1 promoter activity in astrocytic cells (Thatikunta et al., 1997). However, the roles of SNX25 and PURA and their regulation of the TGF-β signaling pathway in oocyte development are unknown.
In addition, we showed that one of the top 20 significantly upregulated genes in in vitro- compared with in vivo-grown oocytes from primordial follicles was Smad7, which plays a regulatory role in a negative feedback loop for TGF-β signaling. SMAD proteins are downstream signaling transducers of the TG-Fβ superfamily (Gao et al., 2013). Smad7 plays a regulatory role in a negative feedback loop for TGF-β signaling. SMAD7 competes with SMAD2/3 to bind to a type I TGF-β receptor and regulate TGF-β signaling (Quezada et al., 2012).
We also showed strong upregulation of the expression of several other TGF-β superfamily associated genes, such as Ngfr, Smad6, Fgf9, Pitx2, and Snx25, in oocytes from primary follicles. Ngfr encodes nerve growth factor receptor (NGFR), which is a multifunctional cell surface receptor and is expressed in several cell types (Bao et al., 2020). Although Ngfr is known for its function in nervous system development, a previous study described Ngfr expression and its critical role in regulating the growth, development, and function of reproductive organs (Bu et al., 2016). Moreover, a recent study identified Ngfr expression in follicles of different sizes in porcine ovaries during estrus, suggesting its essential role in the function of the ovary in sows (Jana et al., 2011). Ngfr expression was also detected in granulosa cells, thecal cells, stromal cells, and luteal cells of goat ovaries (Ren et al., 2005). Moreover, Smad6, one of the top 20 upregulated DEGs between in vivo and in vitro oocytes from primary follicles, regulates TGF-β signaling and can suppress BMP signaling. SMAD6, which protects oocytes, can govern TGF-β signaling and prevent overactivation, affecting reproductive function. Deletion of Smad6 in the ovary affected cell cycle gene expression and resulted in abnormal granulosa cell proliferation, differentiation, and apoptosis through overactivation of TGF-β signaling (Li, 2015). Upregulation of the expression of Smad7 in oocytes from primordial follicles and Smad6, as regulators of TGF-β signaling, in oocytes from primary follicles indicates their distinct regulatory roles in each developmental stage of follicles.
In addition, the expression of Fgf9, which showed upregulation between in vivo- and in vitro-grown oocytes from primary follicles, is a member of the FGF family and is involved in ovarian follicular development. The role of FGF9 in steroidogenesis in the ovary has been shown to be dependent on species (Schutz, 2016). Previous studies suggested a link between TGF-β and FGF signaling through regulation of FGF signaling by TGF-β signaling (Mukherjee et al., 2005; Strand et al., 2014; Bordignon et al., 2019). Moreover, previous studies reported that Fgf9 can enhance the expression of Pitx2 (Bellusci, 2008; Geske et al., 2008), which unexpectedly was one of the top upregulated genes in oocytes from primary follicles in the present study. Different roles of Pitx2 in cell proliferation, differentiation, and organogenesis have been reported in several studies (Lin et al., 1999; Liu et al., 2001; Ai et al., 2006; Hayashi et al., 2008). Pitx2 can interact with β-catenin to regulate cell proliferation by inducing the transcription of cyclin Ds and c-Myc (Yoshioka et al., 1998; Iwao et al., 2009). A recent study on neural crest cells showed that Pitx2 acts downstream of TGF-β and FGF signaling and regulates cell proliferation through induction of cyclin D1 and D3 gene expression (Iwata et al., 2012). Therefore, taken together with the other studies, our data showed the strong upregulation of Fgf9 and Pitx2 expression along with upregulation of the expression of genes involved in the cell cycle in oocytes from primary follicles in a comparison between in vivo and in vitro conditions in this study, which may indicate the role of the TGFβ–Fgf9–Pitx2 signaling cascade in ovarian follicular activation. Interestingly, our transcriptomic analysis showed overlapping significant differential expression of Snx25 between oocytes from primordial and primary follicles with slight functional interconnections in oocytes from both primordial and primary follicles in constructed networks from SDEGs. Surprisingly, Snx25 expression was highly upregulated in oocytes from primary follicles but highly downregulated in oocytes from primary follicles, suggesting a role in primordial follicle activation and development, which was changed through in vitro culture. These results showed a possible dynamic pattern in TGF-β signaling from primordial to primary follicle development, suggesting the importance of these genes in the TGF-β signaling pathway in the primordial to primary follicle transition.
The main source of ROS production is the mitochondria, and as expected, we noted major changes in mitochondria-related genes between the in vivo and in vitro groups. However, the expression of most ROS-related genes, such as Dcxr, Foxred1, Nox4, and Tph2, was downregulated in oocytes from primordial follicles. In contrast, the expression of ROS-related proteins, such as Akr1b8, Cybrd1, and Tph2, was upregulated in oocytes from primary follicles. Therefore, mitochondria-related genes may lead to an increase in mitochondrial function, resulting in the enrichment of genes involved in ROS signaling in oocytes from primary follicles. Interestingly, Nox4, as a member of the NOX family in NADPH oxidases, is widely expressed in different types of cells and is the main source of ROS. A recent study reported that NOX4-derived ROS production increased granulosa cell proliferation and promoted follicle growth (Buck et al., 2019). Nox4 was also shown to induce the expression of MAPK family members and affect the signal transduction system (Buck, 2018). In addition, previous studies indicated that Nox4 is related to cell death and increases apoptosis (Seo et al., 2017; Yang et al., 2018). Therefore, our results showed that in vitro culture may decrease intracellular ROS production through downregulation of Nox4 expression in oocytes from primordial follicles. In contrast, the expression of Dcxr, which has a protective role against oxidative stress, was most significantly downregulated in oocytes from primordial follicles in the present study, suggesting a possible balance between the expression of ROS generators and detoxifying genes in oocytes from primordial follicles during in vitro culture. Dcxr is critical for carbonyl detoxification and carbohydrate metabolism (Yang et al., 2017). However, the function of Dcxr is controversial. Despite the protective role of Dcxr in decreasing oxidative stress through detoxification of reactive carbonyls, its ability to generate ROS by the redox cycling of 9,10-phenanthrenequinone was reported in previous studies (Ebert et al., 2015).
Overall, we found several genes related to mitochondrial function and ROS production in oocytes from both primordial and primary follicles, suggesting the effect of in vitro culture on mitochondrial function and ROS levels. However, downregulation of the expression of mitochondrial and ROS-related genes in oocytes from primordial follicles and enhancement of these functions in oocytes from primary follicles showed that oocytes require more energy, which granulosa cells cannot supply during primordial follicle activation in culture, leading to the induction of mitochondrial function and subsequent ROS production.
In vivo and in vitro Maturation of MII Oocytes
We used a 3D culture system to determine whether different molecular characteristics affect oocyte quality and maturation to the MII stage. We observed that oocytes from two-step-cultured ovaries successfully matured to the MII stage, and their morphology, as well as their mitochondrial function and ROS levels, was similar to that of in vivo-matured oocytes, while their molecular characteristics were significantly different. Interestingly, our comparative transcriptomic analysis showed that the levels of most DEGs in the in vivo- and in vitro-matured MII oocytes were highly upregulated, which was different from oocytes from primordial follicles, which showed mostly downregulation of DEG expression. Accordingly, previous studies reported that the levels of most DEGs were upregulated in mouse and human oocytes after in vitro maturation, from the germinal vesicle (GV) to MII stage, compared with in vivo-matured oocytes (Jones et al., 2008; Gao L. et al., 2017; Liu et al., 2017). Interestingly, we found a major upregulation of the expression of most genes associated with the cell cycle, such as Ccnb1ip1, Mlh3, Ralb, Piwil2, and Cyren, between the in vivo- and in vitro-matured MII oocytes. Accordingly, previous studies reported that cell cycle-related genes were highly expressed in in vitro-matured oocytes compared with in vivo-matured oocytes, suggesting abnormalities in the cell cycle process in in vitro-matured oocytes (Wells and Patrizio, 2008; Ye et al., 2020). Surprisingly, in our transcriptomic analysis, Ccnb1ip1 was the top upregulated DEG in MII oocytes. In mice, Ccnb1ip1 encodes cyclin B1 interacting protein 1, a putative ubiquitin E3 ligase. Defects in Ccnb1ip1 expression led to meiotic impairments in mice (Yoshida et al., 2015). In humans, the CCNB1IP1 protein is a RING finger family ubiquitin ligase that governs the G2/M phase in the cell cycle through degradation of cyclin B (Toby et al., 2003). Strong upregulation of Ccnb1ip1 expression in MII oocytes cultured in vitro compared with in vivo suggested that in vitro culture affects resumption of meiosis in MII oocytes, which is critical for nuclear maturation.
Mitochondrial function has long been investigated and identified as a marker for oocyte quality due to its role in oocyte maturation (Gao L. et al., 2017; Ye et al., 2020). Interestingly, the levels of several mitochondria-related genes, such as Mtch1, Ndusf7, Mrps11, and Slc25a10, were highly upregulated in the in vitro-matured MII oocytes compared with the in vivo-matured MII oocytes. Thus, in vitro culture may affect oocyte quality through enrichment of mitochondrial genes. Combined with other studies, these results showed that in vitro culture may change mitochondrial function and increase ATP production, which is needed under culture conditions. However, these studies are controversial. It was reported that the expression of genes involved in the mitochondrial respiratory chain in bovine in vitro-matured oocytes was downregulated compared with that in in vivo-matured oocytes, suggesting negative effects of in vitro culture on mitochondrial function and oocyte maturation (Katz-Jaffe et al., 2009). These discrepancies may be due to differences in culture methods and species. Therefore, upregulation of the expression of mitochondria-related genes in MII oocytes in the present study suggested a higher demand for energy in mature oocytes, which is required to prepare oocytes for fertilization and subsequent embryonic development during in vitro culture.
Reactive oxygen species, which are produced during in vitro maturation of oocytes, are known to decrease oocyte quality (Soto-Heras and Paramio, 2020). Therefore, we compared the ROS levels in the in vitro-matured MII oocytes with those from the oocytes matured in vivo and found no difference between the groups. Thus, the in vitro culture appears not to affect the ROS levels of MII oocytes. However, it is important to note that the ROS measurements using DCFH-DA are associated with restrictions regarding evaluation of cellular oxidative stress. This is due to its hydrophilic nature, preventing all DCFH-DA to cross the membrane, and its dependence on Fenton-type reactions and/or on unspecific enzymatic oxidation by cytochrome c (Karlsson et al., 2010). A study showed that after 12 h of incubation for in vitro maturation of bovine oocytes, ROS levels were enhanced (Morado et al., 2009). Moreover, several studies in mice, pigs, and cows demonstrated that low oxygen tension with low levels of ROS production led to successful blastocyst formation (Hashimoto et al., 2000; Iwamoto et al., 2005). In contrast, high oxygen tension improved in vitro maturation of porcine oocytes and enhanced the blastocyst rate (Park et al., 2005). Furthermore, oxygen tension, which can increase ROS production, did not change the nuclear and cytoplasmic maturation of bovine oocytes during in vitro maturation (Giotto et al., 2015). Examination of different oxygen concentrations during mouse follicle in vitro maturation showed that increasing oxygen concentrations led to high levels of ROS production, which did not affect maturation, fertilization, and early developmental rates; however, the numbers of blastocysts were significantly reduced (Banwell et al., 2007). Therefore, further in-depth research is needed to determine the effect of in vitro conditions and ROS production on oocyte quality. Surprisingly, despite similar ROS levels in the in vivo- and in vitro-matured MII oocytes, our functional pathway analysis showed that genes involved in ROS signaling, such as Nqo2, Prdx4, Dnajc24, Nox4, Dcxr, and Akr1b8, were enriched in MII oocytes. These results suggested that in vitro culture may lead to major changes in ROS production-related genes in MII oocytes from in vitro maturation compared with in vivo maturation, while the ROS level of the in vitro-matured MII oocytes was not significantly different from that of the in vivo-matured oocytes. However, as the main source of intracellular ROS is the mitochondria and mitochondrial dysfunction can lead to an increase in ROS levels, enrichment of mitochondria-related genes in MII oocytes may cause changes in ROS-related genes between the in vivo- and in vitro-matured MII oocytes.
These results indicated that significant differences in the expression of mitochondria-related genes can result in alteration of mitochondrial function, leading to major changes in ROS signaling in MII oocytes, as well as oocytes from primordial and primary follicles. However, although there were major changes in ROS signaling in oocytes from different developmental stages in the present study, our results suggest a transcriptional regulation of genes involved in ROS generation and related to antioxidant function in MII oocytes as well as oocytes from primordial and primary follicles.
Conclusion
In summary, we showed that in vitro culture conditions changed cellular functions that were not related to the classic follicle-regulating AKT/PI3K/PTEN pathway in oocytes at different developmental stages. Alterations in these functions during the culture period suggested their important role in follicular development and oocyte maturation. We found various candidate genes in these signaling pathways, which have not been well studied in oocytes, and their role in oocyte development is unknown. Our comparative transcriptomic analysis showed a fluctuation in the expression of genes between oocytes from different developmental stages, suggesting a possible dynamic pattern of different functions in oocytes from early to late developmental stages. Therefore, we concluded that the important transcriptomic drivers that activate in vivo primordial oocytes are involved in the cell cycle, TGF-β signaling, MAPK signal transduction, Wnt signaling, and mitochondrial function. Although we identified overlapping differentially expressed genes in oocytes from primordial and primary follicles, the transcriptomes of MII oocytes showed significant divergence. These data will increase our understanding of ovarian follicle development and activation to help restore and preserve female fertility (Niu and Spradling, 2020; Hamazaki et al., 2021).
Materials and Methods
Animals
Female C57BL/6JRj mice and male CBA/JRj mice were housed under a 12-h light/dark cycle and bred to produce C57BL × CBA F1 mice in the biomedical animal facilities at Aarhus University. All procedures were approved by the Ethics Committee for the Use of Laboratory Animals at Aarhus University (2015-15-0201-00800 to KL-H).
Experimental Design
The ovaries from 7- to 14-day-old F1 (C57Bl/6j × CBA/J) female mice were removed after cervical dislocation. Then, ovaries were dissected from their surrounding tissues and washed with alpha-minimal essential medium (α-MEM, Gibco, Scotland, United Kingdom) supplemented with 10% fetal bovine serum (FBS, Gibco). The ovaries from 7-day-old female mice were cultured for 7 days. Then, some of the cultured ovaries (in vitro group) and non-cultured ovaries from 14-day-old mice (in vivo group) were fixed, dehydrated, embedded, and stored at –80°C for morphological assessment and RNA sequencing. Another group of cultured ovaries was used for isolation and culture of preantral follicles for an additional 12 days. Then, the collected MII oocytes were used for ROS assays, mitochondrial membrane potential assays, and RNA sequencing and compared with derived MII oocytes (Figure 1B).
Encapsulation and 3D Culture of Isolated Preantral Follicles
The secondary follicles (n > 150) from cultured ovaries were isolated and encapsulated using sodium alginate as previously defined. Briefly, sodium alginate was dissolved in deionized water at a concentration of 1% (w/v) and filtered. After each follicle was transferred in a droplet of sodium alginate (7 μl), the droplets were placed in a cross-linking solution (50 mM CaCl2 and 140 mM NaCl). Next, the alginate beads were transferred to α-MEM medium for rinsing. Encapsulated follicles were cultured in α-MEM supplemented with 5% FBS; 100 mIU/ml recombinant follicle stimulating hormone (rFSH) or GONAL-f (Serono, Geneva, Switzerland); 1% insulin, transferrin, and selenium (ITS; Gibco); 100 mg/ml penicillin; and 50 ng/ml streptomycin under mineral oil at 37°C with 5% CO2 for 12 days. During the culture period, half of the culture media was replaced with fresh media every other day.
Diameter of Follicles
The mean diameters of follicles and oocytes were measured for each follicle in both groups to determine follicle growth dynamics. Images of follicles from the in vivo and in vitro groups at the primordial and primary stages (n = 50 per ovary in each group at each stage) were taken using an inverted microscope with an attached digital camera (Leica, BMI4000B, Wetzlar, Germany). ImageJ software (National Institutes of Health, Bethesda, MD, United States) was used to calculate the diameter of follicles and oocytes in micrometers. Two perpendicular diameters from the basement membrane to the basement membrane in follicles and from the plasma membrane to the plasma membrane in oocytes were used to calculate the mean diameters.
Immunofluorescence Analysis
The embedded ovaries in each group were sectioned (5 μm thickness) and rehydrated. After antigen retrieval at 95°C for 15 min, permeability was enhanced in 0.5% Triton X-100 in phosphate-buffered saline (PBS) for 10 min. Then, the slides were blocked using 10% normal donkey serum (Chemicon®, S30, Temecula, CA, United States) in PBS for 30 min. Next, the slides were incubated overnight at 4°C with FOXO1, FOXO3a, PTEN, and mTOR antibodies at 1:100, 1:200, 1:50, and 1:100 dilutions in PBS containing 10% donkey serum. The slides were incubated in a 1:300 dilution of secondary antibody (donkey-anti-rabbit) conjugated with Alexa Fluor 488 dye (Thermo Fisher Scientific, Waltham, MA, United States), followed by incubation in 1/1,000 DAPI (Sigma, Saint Louis, MO, United States). The slides were then mounted using Dako Fluorescent Mounting Medium (Agilent Technologies, Santa Clara, CA, United States) and assessed using an LSM510 laser-scanning confocal microscope using a × 63 C-Apochromat water immersion objective NA 1.2 (Carl Zeiss, Göttingen, Germany). The images were captured and analyzed using Zen 2011 software (Carl Zeiss).
ROS Assay
The collected MII oocytes from the in vivo and in vitro groups (n = 60 for each group in three repeats) were pooled and transferred to PBS for washing. Next, they were incubated in 40 mmol/L Tris–HCl buffer (pH = 7.0) containing 5 mmol/L DCFH-DA (Sigma) at 37°C for 30 min. After the samples were washed in PBS, they were sonicated at 50 W for 2 min. They were then centrifuged at 40°C and 10,000 × g for 20 min and analyzed using a spectrofluorometer at 488 nm excitation and at 525 nm emissions.
Mitochondrial Membrane Potential Assay
The integrity of the inner mitochondrial membrane was assayed by measuring the uptake of the cationic carbocyanine dye JC-1 (5,5′,6,6′-tetrachloro-1,1′,3,3′-tetraethylbenz-imidazolcarbocyanine iodide) into the matrix with the formation of J-aggregates according to the protocol described in the MITO-ISO1 kit (Sigma-Aldrich). Sample fluorescence was monitored in a spectrofluorometer at 590 nm emission and 490 nm excitation. The fluorescence produced was calculated per mg mitochondrial protein (FLU/mgP).
Culture of Ovaries
The dissected ovaries from 7-day-old female mice were cultured on inserts (pore size of 0.4 μm, 6.5 mm diameter, Corning, MA, United States) in 24-well plates at 37°C and in a humidified atmosphere of 5% CO2–95% air. The culture medium was α-MEM supplemented with 10% FBS; 5 μg/ml insulin, 5 μg/ml transferrin, and 5 ng/ml sodium selenite (1 × ITS; Gibco Cat. No. 41400045); 1 × penicillin–streptomycin solution (Thermo Fisher Cat. No. 15140122); and 100 mIU/ml rFSH or GONAL-f (Serono).
Histological Evaluation
The ovaries in each group (n = 5/group) were fixed in 4% paraformaldehyde, dehydrated, and embedded in paraffin. Then, they were serially sectioned into 5-μm-thick slices and stained using hematoxylin and eosin (H&E). The follicles were counted in every fifth section of each ovary, and the follicles with nuclei were used for counting to avoid duplicate counting in each ovary. The classification of follicles was defined previously. Briefly, follicles with flattened pregranulosa cells surrounding the oocyte were defined as primordial follicles. Moreover, follicles with a single layer of cuboidal granulosa cells were considered primary follicles, and follicles with two or more granulosa cell layers were classified as secondary follicles. Normal follicles were defined as follicles with an intact oocyte and organized granulosa cells. In contrast, degenerated follicles were defined as follicles with shrunken ooplasm, pyknotic oocyte nuclei, and disorganized granulosa cells. The percentage of follicles in each developmental stage was calculated based on the number of normal follicles from the in vivo (n = 5 ovaries, n = 1,314 primordial, n = 170 primary, and n = 440 secondary follicles) and in vitro (n = 5 ovaries, n = 1,152 primordial, n = 134 primary, and n = 438 secondary follicles) groups.
In vitro and in vivo Ovulation Induction
Ovulation was induced by adding 1.5 IU/ml hCG (Serono) to the culture media after 12 days of follicular culture. The released MII oocytes were then collected as an in vitro group. Adult female mice (n = 9) were induced to superovulate by intraperitoneal (IP) injection of 10 IU human menopausal gonadotrophin (HMG, Folligon; Intervet, Noord-Brabant, Netherlands) followed by injection of 10 IU hCG 48 h later. Fresh MII oocytes, as an in vivo group, were then collected.
Laser-Capture Microdissection
Non-cultured and cultured ovaries were fixed using 4% paraformaldehyde at 4°C followed by dehydration, embedding in paraffin, and sectioning. Then, the sections were placed on membrane glass slides (Arcturus® PEN Membrane Glass Slides, Applied Biosystems, Life Technologies, Foster City, CA, United States) and stained using H&E on the same day. Oocytes of primordial and primary follicles in both groups were isolated by LCM. Isolation of pure oocytes by LCM was based on morphological appearance. Oocytes surrounded by flattened pregranulosa cells were defined as oocytes from primordial follicles, and oocytes surrounded by one layer of cuboidal granulosa cells were defined as oocytes from primary follicles. An ultraviolet laser was used for cutting after marking a line around oocytes. Then, the samples were placed onto a sterile cap (Arcturus® CapSure® HS LCM Caps, Applied Biosystems, Life Technologies) using infrared pulses. The isolated cells were carefully monitored on the cap to avoid any contamination from surrounding granulosa cells.
RNA Extraction
Arcturus® Paradise® Plus RNA Extraction and Isolation Kit (#KIT0312I Arcturus Bioscience Inc., Mountain View, CA, United States) was used for isolation of total cellular RNA from the microdissected cells on the LCM caps, according to the manufacturer’s protocol. RNA from each cap was pooled for the same oocyte stage during extraction. Total cellular RNA from oocytes collected in vivo and in vitro was isolated using Picopure (#KIT0204 Arcturus Bioscience, Inc.).
Library Preparation and Sequencing
The Ovation® PICO SL WTA System V2 RNA amplification system (#3312 NuGen, Inc., San Carlos, CA, United States) was used for conversion of isolated RNA from the LCM-derived samples to cDNA and linear amplification. Library preparation for microdissected oocytes was performed using an Illumina TruSeq RNA Access kit at BGI, according to the manufacturer’s protocol. RNA sequencing was performed on an Illumina HiSeq platform with two lanes (5 Gb per sample). Library preparation for collected oocytes in both groups was performed using the Smart-seq II method, and RNA sequencing was performed using the Illumina HiSeq platform with one lane (5 Gb per sample).
Transcriptomic Analysis
The raw data were quality filtered and trimmed, and adaptor sequences were removed using trim_galore (v0.4.1). Quality control was performed using FastQC. Differential expression analysis was performed by mapping the filtered reads to the mouse genome (mm10) using TopHat2. Then, featureCounts software was used to quantify the number of reads mapped to each gene using gene annotation from Ensembl release 19. Differential expression analysis was performed using DESeq2 in R. Normalization was performed by DESeq2 to allow direct comparison between the samples. Then, for quick visualization and to reduce high-dimensional data to their most salient features, PCA was performed based on DEGs using R software (Figures 4B,E). Moreover, a quick visualization of adjusted p-values < 0.05 versus absolute fold change of 2 was performed using volcano plots, which were generated in R software (Figures 4C–F). For visualizing the SDEGs that overlapped between different developmental stages of oocytes, a Venn diagram was generated using BioVinci version 3.0.9 (Figure 5A). For visualizing overlapping expressed genes and their different linkages, the STRING database was used to create PPI networks in different developmental stages of oocytes, and the overlap between these oocytes was manually distinguished and marked in the networks (Figures 5B–D). For further and deep visualization, first, all SDEGs were shown, according to thresholds of an adjusted p-value of 0.05 and an absolute fold change of 2 (Figure 6A), followed by visualization of the full distribution in all SDEGs using a violin plot by BioVinci (Figure 6B). Second, 302 SDEGs were selected in all developmental stages of oocytes to focus on genes related to the hypothesis in the present study and unify in all stages. For further visualization of these selected genes, first, PPI networks were generated using the STRING database. Then, edges and nodes extracted from STRING were imported to Cytoscape version 3.8.2 (Figures 6C–E). For further visualization, a heatmap was generated by clustering the expression values with BioVinci. Then, pathway enrichment analysis for gene sets from each of the framed clusters in Figure 7A was performed using David Bioinformatic Resources version 6.8. Next, the focused networks were created using the STRING database and Cytoscape from manually annotated gene lists to visualize the TGF-β signaling pathway, cell cycle, and ROS signaling in oocytes from both primordial and primary follicles and cell cycle-, ROS-, and mitochondria-related genes in MII oocytes, which were visualized in a heatmap (Figures 7B–D). Finally, three focused heatmaps were extracted from the original heatmap to visualize specific genes related to the cell cycle, mitochondrial function, and ROS production (Figures 7E–G).
Statistical Analysis
The follicular percentages, follicle diameters, ROS levels, and mitochondrial membrane potentials were analyzed by t-tests in SPSS version 27 software. Values are given as the mean ± SE. A p-value less than 0.05 was considered significant.
Data Availability Statement
The data presented in the study are deposited in the Gene Expression Omnibus (GEO) repository under the accession code GSE179538 with the link: https://www.ncbi.nlm.nih.gov/geo/query/acc.cgi?acc=GSE179538.
Ethics Statement
The animal study was reviewed and approved by all procedures were approved by the Ethics Committee for the use of laboratory animals at Aarhus University (2015-15-0201-00800 to KL-H).
Author Contributions
Both authors contributed to this manuscript. MA and KL-H designed the study, interpreted and analyzed the data, and drafted the manuscript. MA performed the experiments.
Funding
MA was supported by the Carlsberg Fondet (CF18-0474) and by grants from the Novo Nordisk Foundation (NNF170C0026820 and NNF16OC0022480, to KL-H) and a grant from Aase and Ejnar Danielsens fond (31027 to KL-H).
Conflict of Interest
The authors declare that the research was conducted in the absence of any commercial or financial relationships that could be construed as a potential conflict of interest.
Publisher’s Note
All claims expressed in this article are solely those of the authors and do not necessarily represent those of their affiliated organizations, or those of the publisher, the editors and the reviewers. Any product that may be evaluated in this article, or claim that may be made by its manufacturer, is not guaranteed or endorsed by the publisher.
Acknowledgments
The authors wish to thank the excellent laboratory team at the Department of Biomedicine, Aarhus University.
Supplementary Material
The Supplementary Material for this article can be found online at: https://www.frontiersin.org/articles/10.3389/fcell.2021.708076/full#supplementary-material
Supplementary Figure 1 | The fluorescence intensity of FOXO1, FOXO3a, PTEN, and mTOR in mouse ovaries from the in vivo and in vitro groups. There was no significant difference between the in vivo and in vitro groups. Values are given as the mean ± SE.
Supplementary Figure 2 | Constructed protein–protein interaction network (PPI) from significantly differentially expressed genes (SDEGs) of oocytes from primordial follicles in the in vitro and in vivo groups. Red nodes represent the encoded proteins from overlapping SDEGs between oocytes from primordial and primary follicles in the in vitro and in vivo groups. Yellow nodes show encoded proteins from overlapping SDEGs between oocytes from primordial follicles and MII oocytes. Green nodes refer to encoded proteins from overlapping SDEGs between oocytes from all developmental stages.
Supplementary Figure 3 | Constructed protein–protein interaction network (PPI) from significantly differentially expressed genes (SDEGs) of oocytes from primary follicles in the in vitro and in vivo groups. Red nodes represent the encoded proteins from overlapping SDEGs between oocytes from primordial and primary follicles in the in vitro and in vivo groups. Yellow nodes show encoded proteins from overlapping SDEGs between oocytes from primary follicles and MII oocytes. Green nodes refer to encoded proteins from overlapping SDEGs between oocytes from all developmental stages.
Supplementary Figure 4 | Constructed protein–protein interaction network (PPI) from significantly differentially expressed genes (SDEGs) of MII oocytes in the in vitro compared to in vivo groups. Red nodes represent the encoded proteins from overlapping SDEGs between MII oocytes and oocytes from primordial follicles in the in vitro and in vivo groups. Yellow nodes show encoded proteins from overlapping SDEGs between MII oocytes and oocytes from primary follicles in the in vitro and in vivo groups. Green nodes refer to encoded proteins from overlapping SDEGs between oocytes from all developmental stages.
References
Adona, P. R., Leal, C. L., Biase, F. H., De Bem, T. H., Mesquita, L. G., Meirelles, F. V., et al. (2016). In vitro maturation alters gene expression in bovine oocytes. Zygote 24, 624–633. doi: 10.1017/s0967199415000672
Ai, D., Liu, W., Ma, L., Dong, F., Lu, M. F., Wang, D., et al. (2006). Pitx2 regulates cardiac left-right asymmetry by patterning second cardiac lineage-derived myocardium. Dev. Biol. 296, 437–449. doi: 10.1016/j.ydbio.2006.06.009
Arraztoa, J. A., Zhou, J., Marcu, D., Cheng, C., Bonner, R., Chen, M., et al. (2005). Identification of genes expressed in primate primordial oocytes. Hum. Reprod. 20, 476–483. doi: 10.1093/humrep/deh498
Banwell, K. M., Lane, M., Russell, D. L., Kind, K. L., and Thompson, J. G. (2007). Oxygen concentration during mouse oocyte in vitro maturation affects embryo and fetal development. Hum. Reprod. 22, 2768–2775. doi: 10.1093/humrep/dem203
Bao, X., Song, Y., Li, T., Zhang, S., Huang, L., Zhang, S., et al. (2020). Comparative transcriptome profiling of ovary tissue between black muscovy duck and white muscovy duck with high- and low-egg production. Genes 12:57. doi: 10.3390/genes12010057
Bellusci, S. (2008). Lung stem cells in the balance. Nat. Genet. 40, 822–824. doi: 10.1038/ng0708-822
Bordignon, P., Bottoni, G., Xu, X., Popescu, A. S., Truan, Z., Guenova, E., et al. (2019). Dualism of FGF and TGF-beta signaling in heterogeneous cancer-associated fibroblast activation with ETV1 as a critical determinant. Cell. Rep. 28, 2358–2372.e6.
Bu, S., Yang, J., Shan, A., Tian, J., and Zhang, Q. (2016). Progress on NGF and its receptor expression in reproductive organs of femals animals. Prog. Vet. Med. 37, 113–115.
Buck, T. (2018). Role of ROS and ROS Generating Enzymes in the Human Ovary. Dissertation. München: LMU München, Fakultät für Biologie.
Buck, T., Hack, C. T., Berg, D., Berg, U., Kunz, L., and Mayerhofer, A. (2019). The NADPH oxidase 4 is a major source of hydrogen peroxide in human granulosa-lutein and granulosa tumor cells. Sci. Rep. 9:3585.
Cagnone, G., and Sirard, M. A. (2016). The embryonic stress response to in vitro culture: insight from genomic analysis. Reproduction 152, R247–R261.
Castrillon, D. H., Miao, L., Kollipara, R., Horner, J. W., and DePinho, R. A. (2003). Suppression of ovarian follicle activation in mice by the transcription factor Foxo3a. Science 301, 215–218. doi: 10.1126/science.1086336
Chang, E., Yoon, S., Kim, J., Hur, Y., Yu, E., Lee, W., et al. (2016). Transcriptomic analysis of isolated single primordial and primary follicle using RNA-Seq in human. Fertil. Steril. 106:e184. doi: 10.1016/j.fertnstert.2016.07.545
Dharma, S. J., Modi, D. N., and Nandedkar, T. D. (2009). Gene expression profiling during early folliculogenesis in the mouse ovary. Fertil. Steril. 91(5 Suppl.), 2025–2036. doi: 10.1016/j.fertnstert.2008.02.088
Ebert, B., Kisiela, M., and Maser, E. (2015). Human DCXR - another ‘moonlighting protein’ involved in sugar metabolism, carbonyl detoxification, cell adhesion and male fertility? Biol. Rev. Camb. Philos. Soc. 90, 254–278. doi: 10.1111/brv.12108
Ernst, E. H., Franks, S., Hardy, K., Villesen, P., and Lykke-Hartmann, K. (2018). Granulosa cells from human primordial and primary follicles show differential global gene expression profiles. Hum. Reprod. 33, 666–679. doi: 10.1093/humrep/dey011
Ernst, E. H., Grondahl, M. L., Grund, S., Hardy, K., Heuck, A., Sunde, L., et al. (2017). Dormancy and activation of human oocytes from primordial and primary follicles: molecular clues to oocyte regulation. Hum. Reprod. 32, 1684–1700. doi: 10.1093/humrep/dex238
Galloway, S. M., McNatty, K. P., Cambridge, L. M., Laitinen, M. P., Juengel, J. L., Jokiranta, T. S., et al. (2000). Mutations in an oocyte-derived growth factor gene (BMP15) cause increased ovulation rate and infertility in a dosage-sensitive manner. Nat. Genet. 25, 279–283. doi: 10.1038/77033
Gao, L., Jia, G., Li, A., Ma, H., Huang, Z., Zhu, S., et al. (2017). RNA-Seq transcriptome profiling of mouse oocytes after in vitro maturation and/or vitrification. Sci. Rep. 7:13245.
Gao, Y., Fang, X., Vincent, D. F., Threadgill, D. W., Bartholin, L., and Li, Q. (2017). Disruption of postnatal folliculogenesis and development of ovarian tumor in a mouse model with aberrant transforming growth factor beta signaling. Reprod. Biol. Endocrinol. 15:94.
Gao, Y., Wen, H., Wang, C., and Li, Q. (2013). SMAD7 antagonizes key TGFbeta superfamily signaling in mouse granulosa cells in vitro. Reproduction 146, 1–11. doi: 10.1530/rep-13-0093
Geske, M. J., Zhang, X., Patel, K. K., Ornitz, D. M., and Stappenbeck, T. S. (2008). Fgf9 signaling regulates small intestinal elongation and mesenchymal development. Development 135, 2959–2968. doi: 10.1242/dev.020453
Giotto, A. B., dos Santos Brum, D., Santos, F. W., Guimarães, A. C. G., Gonçalves, C. G. M., Pavin, C. U. M., et al. (2015). Oxygen tension and oocyte density during in vitro maturation affect the in vitro fertilization of bovine oocytes. Sem. Ciênc. Agrár. 36, 4277–4287. doi: 10.5433/1679-0359.2015v36n6supl2p4277
Guen, V. J., Gamble, C., Lees, J. A., and Colas, P. (2017). The awakening of the CDK10/Cyclin M protein kinase. Oncotarget 8, 50174–50186. doi: 10.18632/oncotarget.15024
Hamazaki, N., Kyogoku, H., Araki, H., Miura, F., Horikawa, C., Hamada, N., et al. (2021). Reconstitution of the oocyte transcriptional network with transcription factors. Nature 589, 264–269. doi: 10.1038/s41586-020-3027-9
Hao, X., Wang, Y., Ren, F., Zhu, S., Ren, Y., Jia, B., et al. (2011). SNX25 regulates TGF-beta signaling by enhancing the receptor degradation. Cell Signal. 23, 935–946. doi: 10.1016/j.cellsig.2011.01.022
Hashimoto, S., Minami, N., Takakura, R., Yamada, M., Imai, H., and Kashima, N. (2000). Low oxygen tension during in vitro maturation is beneficial for supporting the subsequent development of bovine cumulus-oocyte complexes. Mol. Reprod. Dev. 57, 353–360. doi: 10.1002/1098-2795(200012)57:4<353::aid-mrd7>3.0.co;2-r
Hayashi, M., Maeda, S., Aburatani, H., Kitamura, K., Miyoshi, H., Miyazono, K., et al. (2008). Pitx2 prevents osteoblastic transdifferentiation of myoblasts by bone morphogenetic proteins. J. Biol. Chem. 283, 565–571. doi: 10.1074/jbc.m708154200
Higuchi, C. M., Maeda, Y., Horiuchi, T., and Yamazaki, Y. A. (2015). Simplified method for Three-Dimensional (3-D) ovarian tissue culture yielding oocytes competent to produce full-term offspring in mice. PLoS One 10:e0143114. doi: 10.1371/journal.pone.0143114
Iwamoto, M., Onishi, A., Fuchimoto, D., Somfai, T., Takeda, K., Tagami, T., et al. (2005). Low oxygen tension during in vitro maturation of porcine follicular oocytes improves parthenogenetic activation and subsequent development to the blastocyst stage. Theriogenology 63, 1277–1289. doi: 10.1016/j.theriogenology.2004.05.024
Iwao, K., Inatani, M., Matsumoto, Y., Ogata-Iwao, M., Takihara, Y., Irie, F., et al. (2009). Heparan sulfate deficiency leads to Peters anomaly in mice by disturbing neural crest TGF-beta2 signaling. J. Clin. Invest. 119, 1997–2008.
Iwata, J., Tung, L., Urata, M., Hacia, J. G., Pelikan, R., Suzuki, A., et al. (2012). Fibroblast growth factor 9 (FGF9)-pituitary homeobox 2 (PITX2) pathway mediates transforming growth factor beta (TGFbeta) signaling to regulate cell proliferation in palatal mesenchyme during mouse palatogenesis. J. Biol. Chem. 287, 2353–2363. doi: 10.1074/jbc.m111.280974
Jagarlamudi, K., Liu, L., Adhikari, D., Reddy, P., Idahl, A., Ottander, U., et al. (2009). Oocyte-specific deletion of Pten in mice reveals a stage-specific function of PTEN/PI3K signaling in oocytes in controlling follicular activation. PLoS One 4:e6186. doi: 10.1371/journal.pone.0006186
Jamil, M., Debbarh, H., Aboulmaouahib, S., Aniq Filali, O., Mounaji, K., Zarqaoui, M., et al. (2020). Reactive oxygen species in reproduction: harmful, essential or both? Zygote 28, 255–269. doi: 10.1017/s0967199420000179
Jana, B., Koszykowska, M., and Czarzasta, J. (2011). Expression of nerve growth factor and its receptors, TrkA and p75, in porcine ovaries. J. Reprod. Dev. 57, 468–474. doi: 10.1262/jrd.10-180h
Jones, G. M., Cram, D. S., Song, B., Magli, M. C., Gianaroli, L., Lacham-Kaplan, O., et al. (2008). Gene expression profiling of human oocytes following in vivo or in vitro maturation. Hum. Reprod. 23, 1138–1144. doi: 10.1093/humrep/den085
Karlsson, M., Kurz, T., Brunk, U. T., Nilsson, S. E., and Frennesson, C. I. (2010). What does the commonly used DCF test for oxidative stress really show? Biochem. J. 428, 183–190. doi: 10.1042/bj20100208
Katz-Jaffe, M. G., McCallie, B. R., Preis, K. A., Filipovits, J., and Gardner, D. K. (2009). Transcriptome analysis of in vivo and in vitro matured bovine MII oocytes. Theriogenology 71, 939–946. doi: 10.1016/j.theriogenology.2008.10.024
Kawamura, K., Cheng, Y., Suzuki, N., Deguchi, M., Sato, Y., Takae, S., et al. (2013). Hippo signaling disruption and Akt stimulation of ovarian follicles for infertility treatment. Proc. Natl. Acad. Sci. U.S.A. 110, 17474–17479. doi: 10.1073/pnas.1312830110
Kezele, P. R., Ague, J. M., Nilsson, E., and Skinner, M. K. (2005). Alterations in the ovarian transcriptome during primordial follicle assembly and development. Biol. Reprod. 72, 241–255. doi: 10.1095/biolreprod.104.032060
Lan, K. C., Lin, Y. C., Chang, Y. C., Lin, H. J., Tsai, Y. R., and Kang, H. Y. (2019). Limited relationships between reactive oxygen species levels in culture media and zygote and embryo development. J. Assist. Reprod. Genet. 36, 325–334. doi: 10.1007/s10815-018-1363-6
Lin, C. R., Kioussi, C., O’Connell, S., Briata, P., Szeto, D., Liu, F., et al. (1999). Pitx2 regulates lung asymmetry, cardiac positioning and pituitary and tooth morphogenesis. Nature 401, 279–282. doi: 10.1038/45803
Liu, C., Liu, W., Lu, M. F., Brown, N. A., and Martin, J. F. (2001). Regulation of left-right asymmetry by thresholds of Pitx2c activity. Development 128, 2039–2048. doi: 10.1242/dev.128.11.2039
Liu, K., Rajareddy, S., Liu, L., Jagarlamudi, K., Boman, K., Selstam, G., et al. (2006). Control of mammalian oocyte growth and early follicular development by the oocyte PI3 kinase pathway: new roles for an old timer. Dev. Biol. 299, 1–11. doi: 10.1016/j.ydbio.2006.07.038
Liu, M. H., Zhou, W. H., Chu, D. P., Fu, L., Sha, W., and Li, Y. (2017). Ultrastructural changes and Methylation of human oocytes vitrified at the germinal vesicle stage and matured in vitro after thawing. Gynecol. Obstet. Invest. 82, 252–261. doi: 10.1159/000448143
Love, M. I., Huber, W., and Anders, S. (2014). Moderated estimation of fold change and dispersion for RNA-seq data with DESeq2. Genome Biol. 15:550.
Maidarti, M., Anderson, R. A., and Telfer, E. E. (2020). Crosstalk between PTEN/PI3K/Akt signalling and DNA damage in the oocyte: implications for primordial follicle activation, Oocyte quality and ageing. Cells 9:200. doi: 10.3390/cells9010200
Maidarti, M., Clarkson, Y. L., McLaughlin, M., Anderson, R. A., and Telfer, E. E. (2019). Inhibition of PTEN activates bovine non-growing follicles in vitro but increases DNA damage and reduces DNA repair response. Hum. Reprod. 34, 297–307. doi: 10.1093/humrep/dey354
Markholt, S., Grondahl, M. L., Ernst, E. H., Andersen, C. Y., Ernst, E., and Lykke-Hartmann, K. (2012). Global gene analysis of oocytes from early stages in human folliculogenesis shows high expression of novel genes in reproduction. Mol. Hum. Reprod. 18, 96–110. doi: 10.1093/molehr/gar083
McLaughlin, M., Kinnell, H. L., Anderson, R. A., and Telfer, E. E. (2014). Inhibition of phosphatase and tensin homologue (PTEN) in human ovary in vitro results in increased activation of primordial follicles but compromises development of growing follicles. Mol. Hum. Reprod. 20, 736–744. doi: 10.1093/molehr/gau037
McNatty, K. P., Smith, P., Moore, L. G., Reader, K., Lun, S., Hanrahan, J. P., et al. (2005). Oocyte-expressed genes affecting ovulation rate. Mol. Cell Endocrinol. 234, 57–66. doi: 10.1016/j.mce.2004.08.013
Mochida, N., Akatani-Hasegawa, A., Saka, K., Ogino, M., Hosoda, Y., Wada, R., et al. (2013). Live births from isolated primary/early secondary follicles following a multistep culture without organ culture in mice. Reproduction 146, 37–47. doi: 10.1530/rep-13-0020
Morado, S. A., Cetica, P. D., Beconi, M. T., and Dalvit, G. C. (2009). Reactive oxygen species in bovine oocyte maturation in vitro. Reprod. Fertil. Dev. 21, 608–614. doi: 10.1071/rd08198
Mukherjee, A., Dong, S. S., Clemens, T., Alvarez, J., and Serra, R. (2005). Co-ordination of TGF-beta and FGF signaling pathways in bone organ cultures. Mech. Dev. 122, 557–571. doi: 10.1016/j.mod.2004.11.006
Niu, W., and Spradling, A. C. (2020). Two distinct pathways of pregranulosa cell differentiation support follicle formation in the mouse ovary. Proc. Natl. Acad. Sci. U.S.A. 117, 20015–20026. doi: 10.1073/pnas.2005570117
Park, J. I., Hong, J. Y., Yong, H. Y., Hwang, W. S., Lim, J. M., and Lee, E. S. (2005). High oxygen tension during in vitro oocyte maturation improves in vitro development of porcine oocytes after fertilization. Anim. Reprod. Sci. 87, 133–141. doi: 10.1016/j.anireprosci.2004.11.002
Quezada, M., Wang, J., Hoang, V., and McGee, E. A. (2012). Smad7 is a transforming growth factor-beta-inducible mediator of apoptosis in granulosa cells. Fertil. Steril. 97, 1452–1459.e1–6.
Ren, L., Medan, M. S., Weng, Q., Jin, W., Li, C., Watanabe, G., et al. (2005). Immunolocalization of nerve growth factor (NGF) and its receptors (TrkA and p75LNGFR) in the reproductive organs of Shiba goats. J. Reprod. Dev. 51, 399–404. doi: 10.1262/jrd.16082
Rodgers, R. J., and Irving-Rodgers, H. F. (2010). Morphological classification of bovine ovarian follicles. Reproduction 139, 309–318. doi: 10.1530/rep-09-0177
Salmena, L., Carracedo, A., and Pandolfi, P. P. (2008). Tenets of PTEN tumor suppression. Cell 133, 403–414. doi: 10.1016/j.cell.2008.04.013
Schutz, L. F. (2016). Expression and Role of Fibroblast Growth Factor 9 (Fgf9) in Bovine Folliculogenesis. Stillwater: Oklahoma State University.
Seo, S. U., Kim, T. H., Kim, D. E., Min, K. J., and Kwon, T. K. (2017). NOX4-mediated ROS production induces apoptotic cell death via down-regulation of c-FLIP and Mcl-1 expression in combined treatment with thioridazine and curcumin. Redox Biol. 13, 608–622. doi: 10.1016/j.redox.2017.07.017
Soto-Heras, S., and Paramio, M. T. (2020). Impact of oxidative stress on oocyte competence for in vitro embryo production programs. Res. Vet. Sci. 132, 342–350. doi: 10.1016/j.rvsc.2020.07.013
Strand, D. W., Liang, Y. Y., Yang, F., Barron, D. A., Ressler, S. J., Schauer, I. G., et al. (2014). TGF-beta induction of FGF-2 expression in stromal cells requires integrated smad3 and MAPK pathways. Am. J. Clin. Exp. Urol. 2, 239–248.
Sung, J. H., and Shuler, M. L. (2012). Microtechnology for mimicking in vivo tissue environment. Ann. Biomed. Eng. 40, 1289–1300. doi: 10.1007/s10439-011-0491-2
Telfer, E. E. (2019a). FERTILITY PRESERVATION: progress and prospects for developing human immature Oocytes in vitro. Reproduction 158, F45–F54.
Telfer, E. E. (2019b). Future developments: in vitro growth (IVG) of human ovarian follicles. Acta Obstet. Gynecol. Scand. 98, 653–658. doi: 10.1111/aogs.13592
Thatikunta, P., Sawaya, B. E., Denisova, L., Cole, C., Yusibova, G., Johnson, E. M., et al. (1997). Identification of a cellular protein that binds to Tat-responsive element of TGF beta-1 promoter in glial cells. J. Cell Biochem. 67, 466–477. doi: 10.1002/(sici)1097-4644(19971215)67:4<466::aid-jcb5>3.0.co;2-q
Toby, G. G., Gherraby, W., Coleman, T. R., and Golemis, E. A. (2003). A novel RING finger protein, human enhancer of invasion 10, alters mitotic progression through regulation of cyclin B levels. Mol. Cell Biol. 23, 2109–2122. doi: 10.1128/mcb.23.6.2109-2122.2003
Wang, A., Madden, L. A., and Paunov, V. N. (2020). Advanced biomedical applications based on emerging 3D cell culturing platforms. J. Mater. Chem. B 8, 10487–10501. doi: 10.1039/d0tb01658f
Wang, X., Catt, S., Pangestu, M., and Temple-Smith, P. (2011). Successful in vitro culture of pre-antral follicles derived from vitrified murine ovarian tissue: oocyte maturation, fertilization, and live births. Reproduction 141, 183–191. doi: 10.1530/rep-10-0383
Wells, D., and Patrizio, P. (2008). Gene expression profiling of human oocytes at different maturational stages and after in vitro maturation. Am. J. Obstet. Gynecol. 198:455.e9–11.
Xiao, S., Coppeta, J. R., Rogers, H. B., Isenberg, B. C., Zhu, J., Olalekan, S. A., et al. (2017). A microfluidic culture model of the human reproductive tract and 28-day menstrual cycle. Nat. Commun. 8:14584.
Xu, M., Kreeger, P. K., Shea, L. D., and Woodruff, T. K. (2006). Tissue-engineered follicles produce live, fertile offspring. Tissue Eng. 12, 2739–2746. doi: 10.1089/ten.2006.12.2739
Yang, C. F., Zhong, Y. J., Ma, Z., Li, L., Shi, L., Chen, L., et al. (2018). NOX4/ROS mediate ethanolinduced apoptosis via MAPK signal pathway in L02 cells. Int. J. Mol. Med. 41, 2306–2316.
Yang, S., Jan, Y. H., Mishin, V., Heck, D. E., Laskin, D. L., and Laskin, J. D. (2017). Diacetyl/l-Xylulose reductase mediates chemical redox cycling in lung epithelial cells. Chem. Res. Toxicol. 30, 1406–1418. doi: 10.1021/acs.chemrestox.7b00052
Ye, M., Yang, Z. Y., Zhang, Y., Xing, Y. X., Xie, Q. G., Zhou, J. H., et al. (2020). Single-cell multiomic analysis of in vivo and in vitro matured human oocytes. Hum. Reprod. 35, 886–900. doi: 10.1093/humrep/deaa044
Yoshida, W., Tomikawa, J., Inaki, M., Kimura, H., Onodera, M., Hata, K., et al. (2015). An insulator element located at the cyclin B1 interacting protein 1 gene locus is highly conserved among mammalian species. PLoS One 10:e0131204. doi: 10.1371/journal.pone.0131204
Yoshioka, H., Meno, C., Koshiba, K., Sugihara, M., Itoh, H., Ishimaru, Y., et al. (1998). Pitx2, a bicoid-type homeobox gene, is involved in a lefty-signaling pathway in determination of left-right asymmetry. Cell 94, 299–305. doi: 10.1016/s0092-8674(00)81473-7
Keywords: transcriptome, primordial follicle, in vitro, in vivo, oocytes
Citation: Amoushahi M and Lykke-Hartmann K (2021) Distinct Signaling Pathways Distinguish in vivo From in vitro Growth in Murine Ovarian Follicle Activation and Maturation. Front. Cell Dev. Biol. 9:708076. doi: 10.3389/fcell.2021.708076
Received: 11 May 2021; Accepted: 18 June 2021;
Published: 23 July 2021.
Edited by:
Ken-ichi Sato, Kyoto Sangyo University, JapanReviewed by:
Karl Swann, Cardiff University, United KingdomKenji Miyado, National Center for Child Health and Development (NCCHD), Japan
Copyright © 2021 Amoushahi and Lykke-Hartmann. This is an open-access article distributed under the terms of the Creative Commons Attribution License (CC BY). The use, distribution or reproduction in other forums is permitted, provided the original author(s) and the copyright owner(s) are credited and that the original publication in this journal is cited, in accordance with accepted academic practice. No use, distribution or reproduction is permitted which does not comply with these terms.
*Correspondence: Karin Lykke-Hartmann, a2x5QGJpb21lZC5hdS5kaw==