
95% of researchers rate our articles as excellent or good
Learn more about the work of our research integrity team to safeguard the quality of each article we publish.
Find out more
BRIEF RESEARCH REPORT article
Front. Cell Dev. Biol. , 07 September 2021
Sec. Stem Cell Research
Volume 9 - 2021 | https://doi.org/10.3389/fcell.2021.698795
This article is part of the Research Topic Stem cells in Tissue Homeostasis and Disease View all 18 articles
 Fengfeng Lu1,2,3†Xin Pan1,2,3†
 Wencheng Zhang1,2,3†Xin Su1,2,3Yuying Gu4Hua Qiu1,5
 Shengwei Shen1,6Changcheng Liu1,2,3Wei Liu1,2,3Xicheng Wang1,2,3
 Zhenzhen Zhan7
 Zhongmin Liu1,2,3,7*
 Zhiying He1,2,3*
Cell transplantation has been proposed as a promising therapeutic strategy for curing the diseases requiring tissue repairing and functional restoration. A preclinical method to systematically evaluate the fates of donor cells in recipients, spatially and temporally, is demanded for judging therapeutic potentials for the particularly designed cell transplantation. Yet, the dynamic cell tracking methodology for tracing transplanted cells in vivo is still at its early phase. Here, we created a practical protocol for dynamically tracking cell via a three-dimensional (3D) technique which enabled us to localize, quantify, and overall evaluate the transplanted hepatocytes within a liver failure mouse model. First, the capacity of 3D bioluminescence imaging for quantifying transplanted hepatocytes was defined. Images obtained from the 3D bioluminescence imaging module were then combined with the CT scanner to reconstruct structure images of host mice. With those reconstructed images, precise locations of transplanted hepatocytes in the liver of the recipient were dynamically monitored. Immunohistochemistry staining of transplanted cells, and the serology assay of liver panel of the host mice were applied to verify the successful engraftment of donor cells in the host livers. Our protocol was practical for evaluating the engraftment efficiency of donor cells at their preclinical phases, which is also applicable as a referable standard for studying the fates of other transplanted cells, such as stem cell-derived cell types, during preclinical studies with cell transplantation therapy.
Today, cell transplantation therapy plays important roles in clinical therapies for many types of diseases. Since 1967, the well-known success of bone marrow transplantation had started a new era of cell transplantation for the therapies of blood diseases (Thomas, 1987, 2005; Cossu et al., 2018). Later, hepatocyte transplantation was also successfully used in the clinical trials for some liver diseases (Ott and Castell, 2019). The current studies in the fields of stem cells and regenerative medicine are hoped to provide the adequate sources of donor cells and bring the cell transplantation therapy into even newer era, which have widely opened the scope to forecast its potential applications into therapies of many injuries or diseases for tissue repairing or replacements. Especially, stem cell-derived functional cells for various tissues are increasingly considered sources of donor cells for cell transplantation therapy in the future.
To evaluate the therapeutic effects of cell transplantation, the dynamic migration and movements of donor cells in the hosts are required to be comprehensively analyzed during preclinical studies. Therefore, a practical method to track the state and fate of donor cells posttransplantation spatially and temporally is highly demanded in many current and future studies on the preclinical applications of cell transplantation-based therapies (Nguyen et al., 2014).
The dynamic study with comprehensive analyses on transplanted cells through using the new technology of in vivo tracking has become a powerful strategy to judge the fate of transplanted cells (Feigenbaum et al., 2009). Such new technology is under a non-invasive condition, which does not require the multiple rounds of sacrificing animals and harvesting samples. Especially, non-invasive tracking has many common advantages to perform the dynamic cell tracking in a real-time process, which were able to monitor the fate of transplanted cells in vivo during various dynamic processes, including the stages of cell homing and engraftments, as well as target tissue repairing or replacements for functional recoveries of many tissues (Kircher et al., 2011).
Bioluminescence imaging (BLI) technique system carries many potential advantages for dynamic tracking on cells in vivo. Most used bioluminescence is firefly luciferase, with Mg2+, ATP, and O2, which catalyze its substrate luciferin to generate bioluminescence signals. Luciferase has been used as a reporter gene product to recognize those luciferase-expressing cells during their biological processes (Dubey, 2012). With a set of optical inspection instruments, dynamic activities of the transplanted luciferase-expressing cells in the body of recipients can be directly monitored, based on the luciferase-induced bioluminescence signal (Herter-Sprie et al., 2014).
Normally, BLI could only be used at the mode of two dimensions (2D), which was successfully applied in the studies on observations of tumor growth in vivo (Yao et al., 2018). However, BLI of 2D mode (2D BLI) could not reach to the enough depths of tissues to track signals of detected cells that located deeply in the body of recipients (Kocher and Piwnica-Worms, 2013). Recently, BLI of 3D mode (3D BLI) has been developed with significant improvements, which enable scientists to capture both the information more accurately about localization and quantification of donor cells during the dynamic cell tracking after cell transplantation.
Based on the latest generation of instrument for IVIS® Spectrum computed tomography (CT) scanner that combines optical imaging and CT in one platform (Aalipour et al., 2019), we investigated how to establish a practical protocol to perform 3D cell tracking of transplanted hepatocytes in mice. This protocol was also expected to be a useful and referable standard for the 3D tracking of other cell types during their dynamic process of cell transplantation.
In our study, the fumarylacetoacetate hydrolase-deficient (Fah–/–) mouse model was used as the preferable system for hepatocyte transplantation and liver repopulation. Fah–/– mice can undergo induced liver failure and animal death once lacking enough 2-(2-nitro-4-trifluoromethylbenzoyl)-1,3-cyclohexanedione (NTBC) water. However, they can also be successfully rescued from death by restoring their liver function through the liver repopulation after transplantation of hepatocytes from wild-type animals. In our experiment, the dynamic process, including the stages of cell engraftment, migration, proliferation, and liver regeneration in final, was continuously tracked in a real-time manner after transplanting luciferase-expressing hepatocytes into the body of Fah–/– mouse.
All mice received humane care according to the guidelines of Tongji University Animal Care and Use Committees. Luciferase transgenic mice were purchased from Shanghai Model Organisms Center, Inc., maintained under specific pathogen-free conditions and used at 8–10 weeks of age.
As described in previous studies (He et al., 2010; Wang et al., 2018), Fah–/– mice undergo liver failure and death. To survive, the mice need to be maintained with continuous supplement of 2-(2-nitro-4-trifluoromethylbenzoyl)-1,3-cyclohexanedione (NTBC) in their drinking water (7.5 mg/L). To induce liver injury, NTBC was totally withdrawn from the drinking water of Fah–/– mice.
Donor luciferase-expressing hepatocytes were isolated from luciferase transgenic mice (Shanghai Model Organisms Center, Inc., Shanghai, China) with the perfusion protocol that is established in previous studies (He et al., 2012; Wang et al., 2014). Briefly, the liver was preperfused with 1 × Earle’s balanced salt solution (EBSS) (Gibco, Amarillo, TX, United States) with 5 mM 4-(2-hydroxyethyl)-1-piperazineethanesulfonic acid (HEPES) (Gibco) for 10 min at 37°C, and then perfused with 1 × EBSS with 5 mM HEPES with collagenase D (Sigma-Aldrich, St. Louis, MO, United States) for 10 min at 37°C. The dissociated cells were filtered through a 70-μm Nylon cell strainer (BD Biosciences, San Jose, CA, United States), and then centrifuged twice for 2 min at 50 g to remove clumps. Furthermore, viability of isolated hepatocytes was above 80% evaluated by Trypan blue stain (Sigma-Aldrich). Harvested hepatocytes were resuspended in DMEM and injected into Fah–/– recipient animals through the spleen (1 × 10⁶ cells/recipient) as described (Wang et al., 2014).
Computed tomography scanning was carried out with IVIS® Spectrum CT in vivo Imaging System (PerkinElmer, Waltham, MA, United States). CT images were captured with 50 kVp X-rays at a tube current of 1 mA, with exposure time of 50 ms, and with an aluminum filter. CT images were reconstructed with Living Image 4.5 software, which not only provided a field of view (FOV) of 20 cm × 20 cm × 20 cm but also allowed an isotropic resolution of 0.15 mm for the anatomical location of transplanted cells with bioluminescence.
The isolated luciferase-expressing hepatocytes were seeded in 96-well plates with different densities (1 × 10³, 1 × 10⁴, and 1 × 10⁵). After being attached in the CO2 incubator for 4 h under 37°C, the value of bioluminescence excited by cells was measured for depleting the background signals. D-Luciferin (250 μM) was then added to the attached hepatocytes in the 96-well plate. After reacting for 5 min, the plate with cells was placed in the IVIS® Lumina III In Vivo Imaging System (PerkinElmer) for detecting the intensity of bioluminescence. The imaging data were analyzed by Living Image software to determine correlations between signal intensity (p/s/cm2/sr) and cell numbers.
Bioluminescence imaging of Fah–/– mice were captured at different intervals after transplantation (3 days, 1, 3, 5, 8, and 10 weeks). To conduct the BLI, host Fah–/– mice were intraperitoneally injected with D-luciferin (100 mM) right after anesthesia. After reaction for 5 min (for 2D BLI) or 8 min (for 3D BLI), the mice were placed in the light-tight chamber in the IVIS® Spectrum CT in vivo Imaging System. Dorsal imaging was performed for all host mice at different time points. For 2D BLI, no emission filter was used during the imaging process. For 3D BLI, five bandpass open emission filters were centered at 560, 580, 600, 620, and 640 nm to collect the optical signal, respectively.
The imaging signals collected within 5 min were used to locate the transplanted luciferase-expressing hepatocytes under 3D BLI, and the density of proliferating cell groups or nodules could be distinguished by different colors intuitively. Those colors indicated diverse intensity level and corresponding color scale at the right side of every picture. Beforehand, the reconstructed 3D whole-body structure image of Fah–/– mouse recipient was captured by CT scanner. By combining the 3D BLI with CT-reconstructed whole-body structure images, the results of the real-time distributions of transplanted luciferase-expressing hepatocytes in the liver and other organs of each Fah–/– mouse recipient were collected for further analysis. FOV = 13.2 × 13.2 cm, f/stop = 1, binning = 8.
Bioluminescence signal intensity was calculated by Living Image 4.5 Software (PerkinElmer). The photon radiance was measured as photons per second per square centimeter per steradian (p/s/cm2/sr) within the regions of interest (ROIs) (Kuo et al., 2007; Thompson et al., 2013). Bioluminescence unit was showed as total flux radiance which is a calibrated measurement based on photon emission.
Real-time quantitative PCR (RT-qPCR) was performed with the TB Green Premix Ex Taq II (Takara, Kusatsu, Japan). The expression of glyceraldehyde 3-phosphate dehydrogenase (GAPDH) was used as control. PCRs were performed under the following conditions: 95°C for 15 s followed by 40 cycles at 95°C for 5 s, 60°C for 34 s, 95°C for 1 min, and 55°C for 1 min. The primers used for the assay include luciferase-Forward 5′-TTACCAGGGATTTCAGTCG-3′; luciferase-Reverse 5′-CCTT TAGGCAGACCAGTAGA-3′; GAPDH-Forward 5′-AGGTCGG TGTGAACGGATTTG-3′; GAPDH-Reverse 5′-GGGGTCGTT GATGGCAACA-3′.
The transplanted Fah–/– mice were sacrificed at experimental time points. The liver samples were harvested, and immunohistochemistry with FAH antibody was conducted to examine the percentage of liver repopulations. For immunohistochemistry staining, the fresh liver samples were fixed in 4% paraformaldehyde, embedded in paraffin, and cut into 2-μm-thick slices. Sections were baked, deparaffinized, rehydrated, permeabilized with 3% H2O2 solution for 15 min, and blocked by 1% BSA for 30 min. The sections were then incubated with rabbit antimouse FAH primary antibody (HepatoScience, 1:3,000) at 4°C overnight and with secondary antibodies conjugated with HRP (Sangon Biotech) at 37°C for 30 min. After staining with DAB (MXB) in proper intensity, the sections were counterstained with hematoxylin (Beyotime, Jiangsu, China), dehydrated rapidly, and mounted with neutral resin (SolarBio, Beijing, China). Finally, the samples were examined under optical microscope (Leica, Wetzlar, Germany).
Aperio ImageScope software of pathological section scanner (Leica SDPTOP HS6) was served for immunohistochemistry stain imaging and statistics of FAH+ area and liver area. We picked no less than three discontinuous sections in each liver to calculate FAH+ area and liver area. In the analysis, regions of interest (ROIs) were calculated by software automatically.
Data are presented as mean ± SD or mean ± SEM from at least three independent experiments unless otherwise indicated. One-way ANOVA with Tukey’s post hoc test was used for multiple groups and Student’s t-test for two groups. p < 0.05 was considered statistically significant (∗p < 0.05, ∗∗p < 0.01, ∗∗∗p < 0.001. N = 3).
Donor hepatocytes expressing luciferase were obtained from the luciferase transgenic mouse generated from our previous study (Wangensteen et al., 2008). Expression of luciferase enabled liver cells to be detected based on the bioluminescence released from biochemical induction of luciferase with luciferin (Supplementary Figure 1A). The viability of luciferase-expressing hepatocytes was evaluated based on vitality and healthy morphology compared with healthy wild-type hepatocytes. The correlation between the level intensity of induced bioluminescence releasing and the number of luciferase-expressing hepatocytes was determined (Supplementary Figure 1B). Results indicated that the total flux of bioluminescence intensity for 1 × 10³, 1 × 10⁴, and 1 × 10⁵ of hepatocytes were 6.222 × 10⁵, 1.255 × 10⁷, and 5.5265 × 10⁷ p/s/cm2/sr, respectively (Supplementary Figure 1A). The results revealed a positive linear correlation between bioluminescence intensity and number of luciferase-expressing hepatocytes existed (R2 = 0.9959) (Supplementary Figure 1B). In the calculated averages, total bioluminescent photons emitted by each luciferase-expressing hepatocyte were approximately 8.152 × 10² p/s/cm2/sr.
Then, luciferase-expressing hepatocytes were transplanted into Fah–/– mice with acute liver failure via spleen injection (1 × 10⁶ hepatocytes/mouse). For monitoring the process of surviving, engrafting, and proliferating of transplanted luciferase-expressing hepatocytes, 2D BLI on Fah–/– mice was performed at different time points (3 days, 1, 3, 5, 8, and 10 weeks) after transplantation. Evident bioluminescence signal was observed in Fah–/– mice on the third day after transplantation, suggesting that the luciferase-expressing hepatocytes were successfully transplanted into Fah–/– mice recipients (Supplementary Figure 1C).
After a slightly decreasing in Fah–/– mice recipients at the first week posttransplantation, bioluminescence signals started to increase significantly at the third week posttransplantation. From the fifth-week to eighth-week posttransplantation, the bioluminescence signals in Fah–/– mice recipients increased continually (Krohn et al., 2009). Based on this linear correlation between the bioluminescence intensity and number of luciferase-expressing hepatocytes obtained from the above experiments, the number of luciferase-expressing hepatocytes in Fah–/– mice recipients were calculated by the measured bioluminescence values (Supplementary Figures 1D,E).
Next, the combined methods of 3D BLI and CT were performed to make a dynamic tracking on the localization and quantification of transplanted luciferase-expressing hepatocytes. The same animal recipients used during above 2D BLI were further analyzed in the process of 3D BLI and the comparisons between 3D and 2D imaging were specially performed.
For 3D BLI, open emission filters were performed within a range of 560–640 nm (every 20 nm bandpass) to collect the optical signal for five times. Images that the signals collected within 5 min were used to locate and quantify the luciferase-expressing cells in the recipients in real time. Meanwhile, CT scanning was carried out to scan mouse stereo body to visually reconstruct their 3D internal structures. Thus, the distribution of transplanted hepatocyte in vivo could be presented vividly (Supplementary Movie 1).
During the process, the midpoint in every dimensional of recipient mouse was regarded as initial point. Every bioluminescent cell or cell-composed cluster in vivo, such as single luciferase-expressing repopulation nodules, could be positioned and analyzed on horizontal plane (Z), vertical plane (Y), and longitudinal plane (X), respectively (Supplementary Movie 2). Through these analyses, the transplanted luciferase-expressing hepatocytes could be precisely located (x, y, z) cm from the initial point at each detection time point. The total number could be quantified at the same detection time point according to the optical signal values of single hepatocyte/cluster with bioluminescence tomography (Figure 1A and Supplementary Movie 2). With the established protocol, luciferase-expressing hepatocytes were precisely localized in Fah–/– mice at six time points (3 days, 1, 3, 5, 8, and 10 weeks) after transplantation (Figure 1B and Supplementary Movie 1).
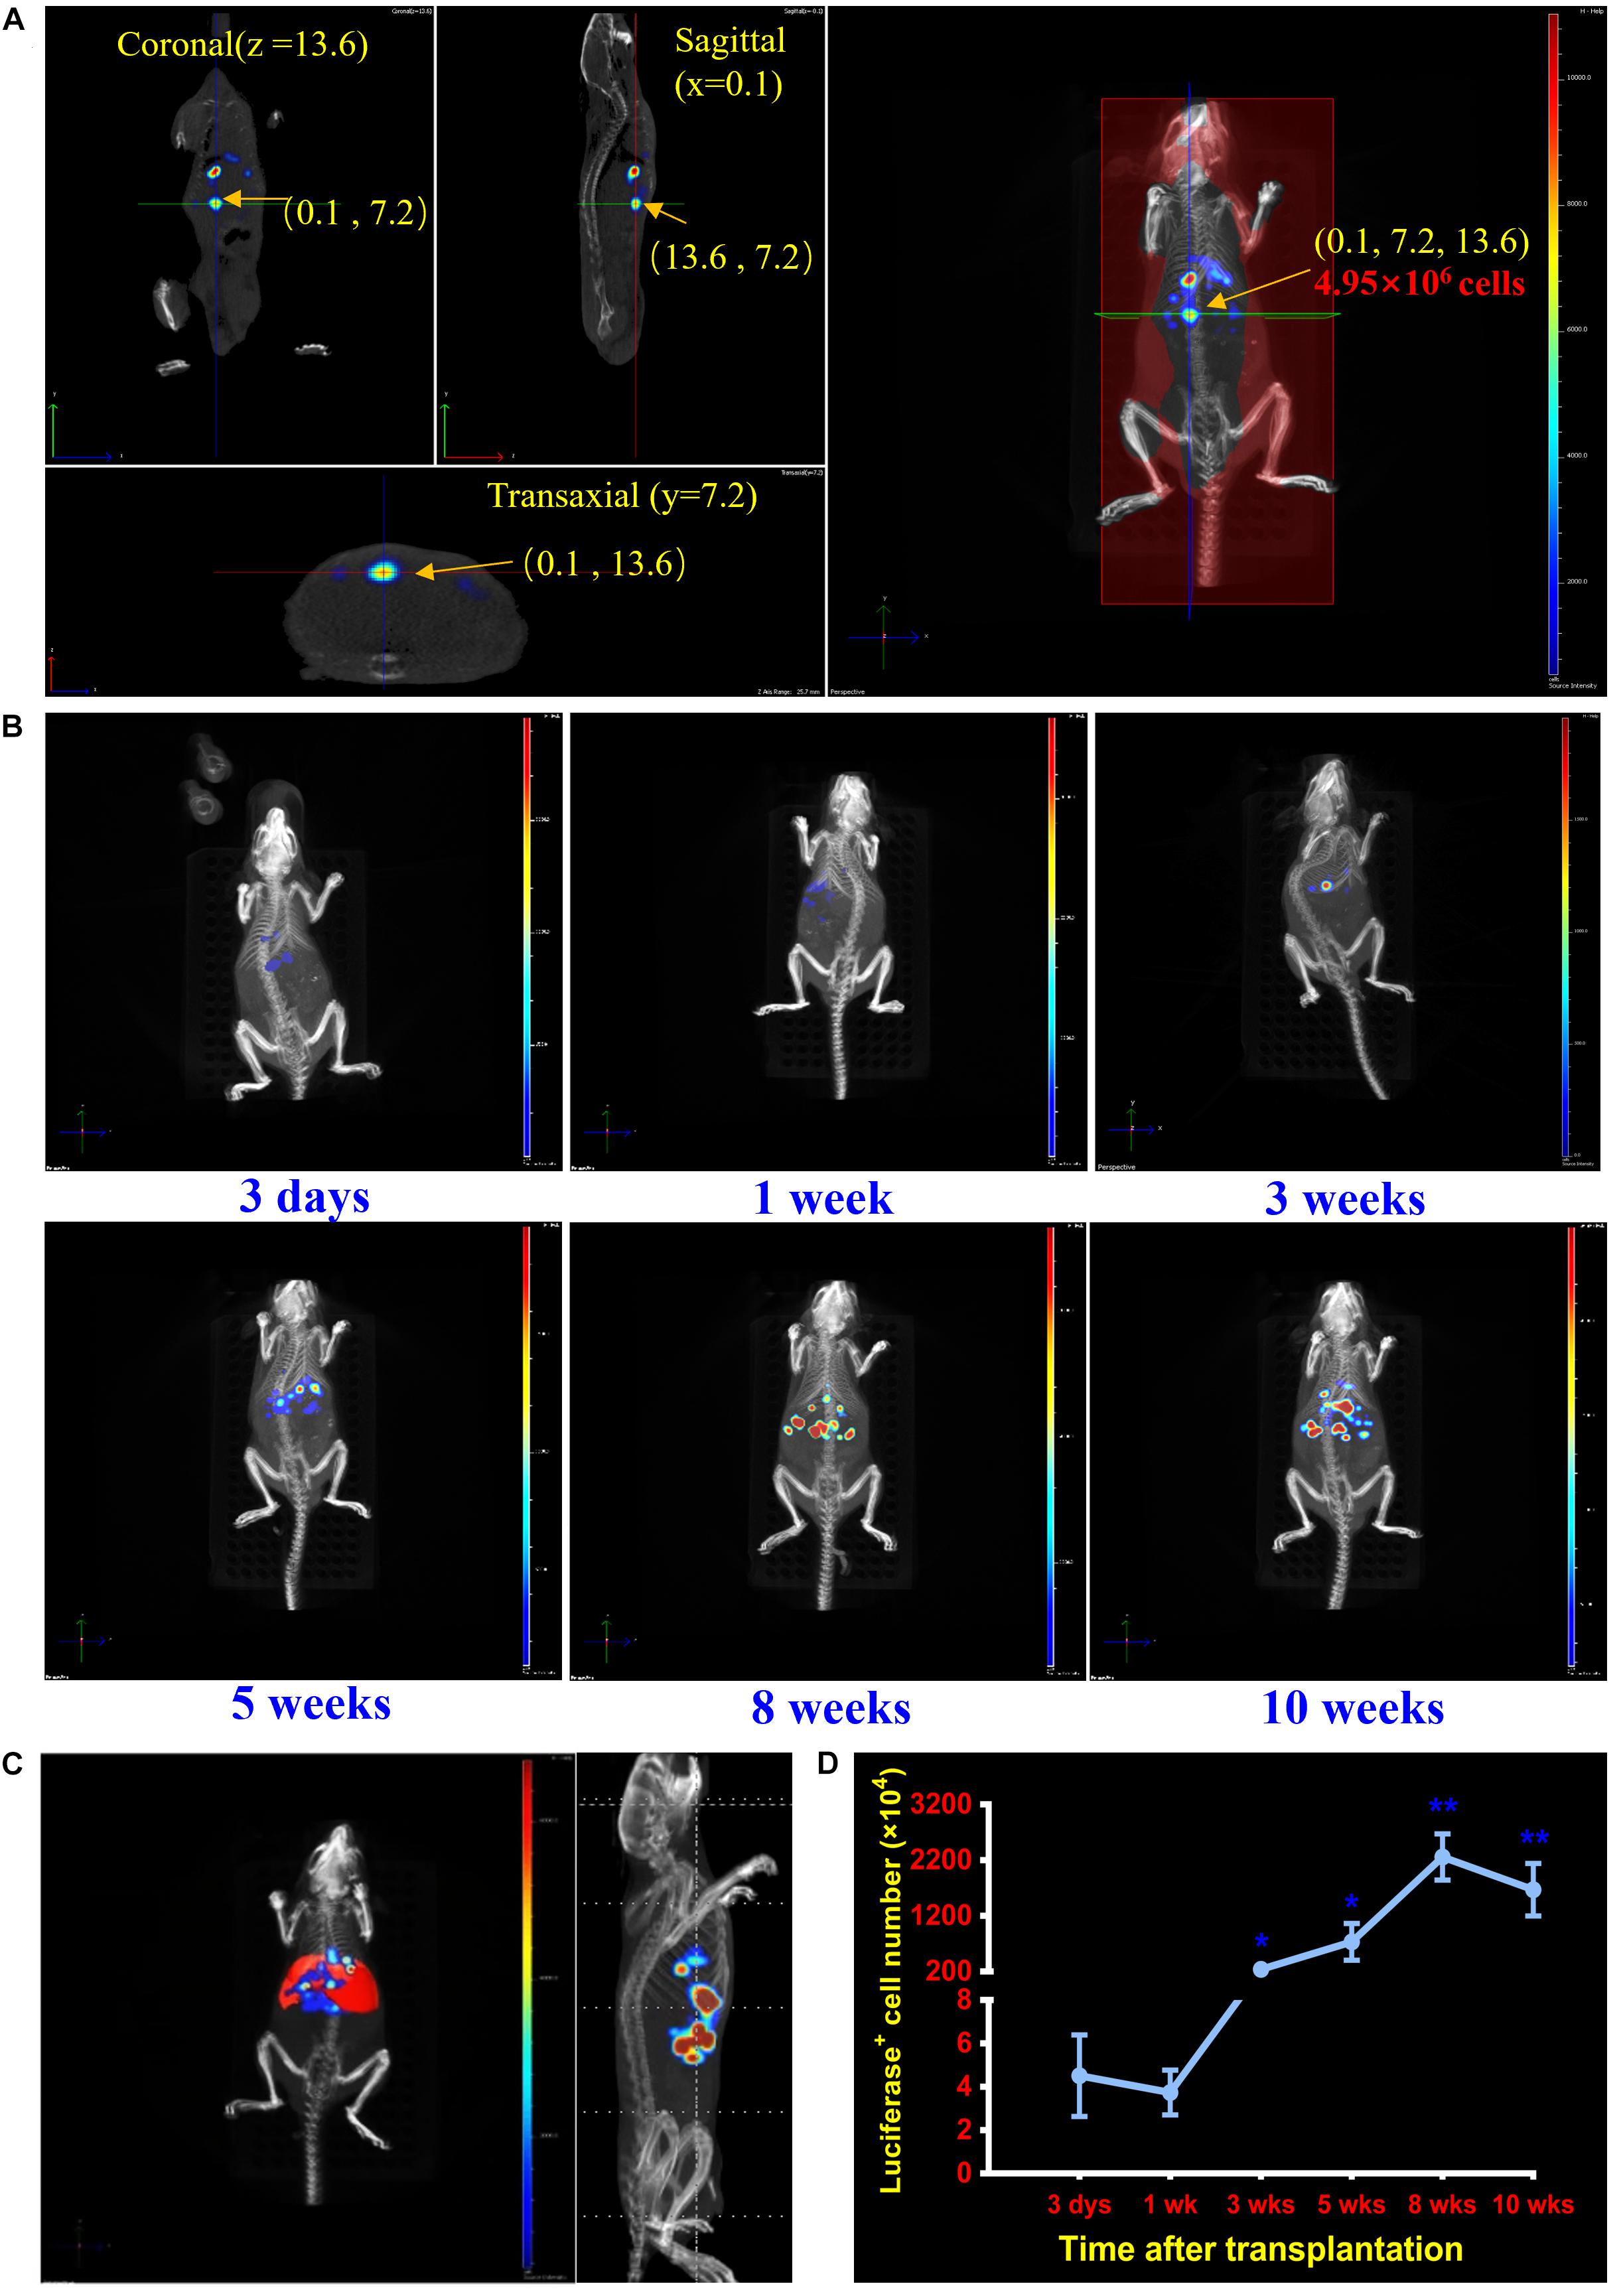
Figure 1. Localization and quantification analysis of transplanted cells in the liver of Fah–/– mice. (A) Establishment of the dynamic cell-tracking strategy for posttransplantation localizing and quantifying of grafted cells in vivo. A combination of 3D BLI and CT is established to locate and quantify the transplanted hepatocytes in livers of Fah–/– mouse recipients at any time point of detection. Representative image of accurate localization (0.1, 7.2, 13.6) cm and cell quantification (4.95 × 10⁶) of one nodule repopulated by transplanted hepatocytes (pointed by the arrow). (B) Dynamically localizing transplanted hepatocytes at different time points posttransplantation. Representative merged images of transplanted hepatocytes of Fah–/– mice at 3 days, 1, 3, 5, 8, and 10 weeks after hepatocyte transplantation. (C) Spectrum CT image of mouse liver was reconstructed by Living Image 4.5 software in Fah–/– mouse. (D) Quantification of transplanted hepatocytes in livers of Fah–/– mice at 3 days, 1, 3, 5, 8, and 10 weeks. Quantitative analyses of transplanted hepatocytes in liver of Fah–/– mice. Data are shown as mean ± SEM. *p < 0.05, **p < 0.01. N = 3. Student’s t-test.
To further localize the numbers of cells engrafted in livers of Fah–/– mice at detection time points, a liver module was calculated and added to the images according to the parameters of the liver sizes and its distances to the abdominal surface (Figure 1C). With such module, engrafted numbers of luciferase-expressing hepatocytes were determined. As shown in the Figure 1D, on the third day of transplantation, less than 1 × 10⁵ hepatocytes could be successfully engrafted into the livers of Fah–/– mouse recipients. However, by 10 weeks after transplantation, the number of luciferase-expressing hepatocytes in Fah–/– mice expended to 1.84 × 10⁷. Of note, there are no consideration of degradation or maldistribution when using luciferase expression as a marker, and therefore a long-term and timelessness of cell tracking can be performed.
Finally, to validate the results from 3D cell dynamic tracking process, the results from the traditional methods that are still routinely used in detection processes, involving conventional BLI imaging of isolated organs (liver, spleen, kidney), quantitative PCR test and the histochemical observations, were performed. In the liver of transplanted Fah–/– mice, BLI signal analysis showed the signal value was significantly improved at 10 weeks compared with that at 3 days. In contrast, the BLI value was significantly decreased in the spleen at 10 weeks compared with that at 3 days. There was no evident difference between the BLI values in the kidney of Fah–/– mice between 10 weeks and 3 days (Supplementary Figure 2A).
FAH protein, the donor cell-specific marker, was used to prove the existence of donor-derived hepatocytes in transplanted Fah–/– mice. To unravel the detailed number of regenerative hepatocytes, we assessed the regeneration efficiency via FAH+ area/liver area based on the immunohistochemistry staining of FAH antibody. The results showed that FAH+ hepatocytes was about 0.77% after 3 days posttransplantation, while it reached to approximately 80% after 10 weeks of repopulation (Supplementary Figures 2B,C). Consistently, the expression level of luciferase gene at 10 weeks was obviously higher than that at 3 days after cell transplantation (Supplementary Figure 2D).
To further validate regenerative status, we also examined liver functions of donor-derived hepatocytes grafted Fah–/– mice. Results showed that several parameters of liver function, including alanine aminotransferase (ALT), aspartate aminotransferase (AST), total bilirubin (T-BIL), and albumin (ALB), were recovered to the normal ranges at 10 weeks posttransplantation (Supplementary Figure 2E).
For the first time, a 3D BLI imaging system was established and was successfully used in combination with CT scanning to evaluate the dynamic process of in vivo cell tracking for the transplanted cells, which can precisely assess the localization and quantification of transplanted cells in the relative animal recipients.
Previously, several traditional methods had been developed for judging the transplanted donor cells during preclinical studies, which required enormous experimental animals while still only capable of conducting limited numbers of assays, and analyses for evaluating expected outcomes of cell transplantation. Moreover, these analytical processes could only rely on the multiple rounds of animal sacrificing and sample harvesting at limited time points after cell transplantations (Massoud and Gambhir, 2003). Therefore, a large number of animals were required for one study. In addition, these traditional methods also have chances of mistaken organ collections and misinterpretations due to inaccurate observations during necropsy and animal harvesting, partially because of the indirect or delayed interpretations for the real-time facts of those in situ and dynamic occurrences (Phair and Misteli, 2001). Therefore, the non-invasive tracking methods are crucial for achieving the goal of evaluating the cell fate posttransplantation.
Among several non-invasive tracking methods, the two representative ones used currently are magnetic particle imaging (MPI) and photoacoustic imaging (PAI). MPI is a method based on tomography for detecting the spatial distribution of superparamagnetic iron oxide nanoparticles (SPIONs) (Haegele et al., 2012; Wei et al., 2018). When labeled with Resovit, a particular type of SPIONs, a minimum of 200 mesenchymal stem cells can be successfully detected after transplantation during a tracking period up to 3 months (Bulte et al., 2015). However, both traceability and accuracy of SPIONs for MPI could be susceptibly influenced from gas, calcification, and blood flow in tissues (Bourquin et al., 2018; Zhou et al., 2018).
On the other hand, the method of PAI combines high optical contrast with high ultrasound resolution in a single imaging modality (Knox and Chan, 2018). During PAI analyses, the transplanted cells are labeled by the nanogold particles with photoacoustic effects. After transplantation, the nanogold particle-labeled cells could be dynamically tracked in real time by photoacoustic signal for 4 weeks (Jokerst et al., 2012; Zheng et al., 2015; Zhang et al., 2017). In similar with MPI, PAI also has some limitations. For instance, the nanomaterials used in PAI can be mainly distributed in the lysosomes after entering cells through endocytosis. Therefore, it may become difficult to ensure the equal distributions in the offspring cells derived from original donor cells that carry nanomaterials with such limitations (Knox and Chan, 2018).
Bioluminescence imaging is another currently used technology to detect the signal of luminescence light emitted from enzyme-catalyzed reactions. In our previous study, the 2D BLI was performed to measure numbers of repopulating hepatocytes during liver repopulation (Wangensteen et al., 2008). However, these results from 2D BLI could only provide the information on survival and proliferation tendency for the transplanted luciferase-expressing hepatocytes. The key information on localization and quantification of the transplanted luciferase-expressing hepatocytes in Fah–/– mice recipients could not be obtained under 2D BLI. Notably, the combined methods of both 3D BLI and CT developed in this study enabled us to make a dynamic tracking on the localization and quantification of transplanted luciferase-expressing hepatocytes. Here, 3D BLI was tested for its first use to dynamically monitor the transplanted luciferase-expressing hepatocytes in Fah–/– mice recipients in real time. In addition, our results indicated that the combined technologies with both 3D BLI and CT made it possible to monitor the spatial and temporal distribution of transplanted cells in recipient and to determine the exact number of cells in different distributive regions during cell transplantation assay. Furthermore, with our model system, a new analysis program for localization and quantitation was established for our following studies, to finalize a standard protocol for transplanting any luciferase-expressing cells when 3D BLI and CT were performed simultaneously.
Although our method has achieved the in vivo localization and quantification of transplanted hepatocytes, there are still some issues to be further addressed. Firstly, the detection sensitivity of the current system still needs to be improved. With our 3D dynamic cell tracking system, clusters of ∼50 cells can be detected, but it is not sufficient to localize and quantitatively detect a single cell. The establishment of AkaLuc mutagenesis from luciferase may help us to achieve this goal (Iwano et al., 2018). AkaLuc can pair with its optical substrate AkaLumine hydrochloride, which produces a roughly fourfold improvement in the expression level than luciferase. This ultra-enhanced signal enables scientists to non-invasively visualize single cells deep inside freely moving animals (Iwano et al., 2018). Secondly, the resolution of CT also needs to be improved. We are currently improving our resolution by establishing a Bruker micro-CT-based system, which enable us to convert images into a complete microscopic visualization solution with the specialized software for further analysis. Finally, the in vivo depth of transplanted cells currently established for detection is limited. Our method is commonly used for posttransplant internal localization in small animals such as mice and rats; the application of the system on large animal or in human will be tested in the future study.
Taken together, the combination of 3D BLI and CT scanning could be used to analyze transplanted hepatocytes on several parameters in real time, including cell distribution, quantification, and location. Significantly, a protocol for such study process could be applied to judge whether the donor hepatocytes were qualified candidates for the potential clinical cell transplantation to liver failure patients, on considering both safety, and therapeutic efficiency. In addition, our established protocol is also expected to become a valuable and referable standard for visually analyzing other cell candidates, which were used for transplantation therapies in any kinds of animal models during their preclinical studies (He et al., 2010).
The original contributions presented in the study are included in the article/Supplementary Material, further inquiries can be directed to the corresponding author/s.
The animal study was reviewed and approved by Tongji University Animal Care and Use Committees.
FL and XP conducted most of the experiments and imaging analysis. XS, YG, HQ, SS, and CL conducted the Fah–/– mice management and hepatocytes grafting with FL and XP. WL and ZZ conducted the in vitro assays which were provided as controls of this study. ZH designed the study. ZH and ZL supported and supervised the study. ZH, FL, WZ, XP, and XW wrote the manuscript with help from the other authors. All authors contributed to the article and approved the submitted version.
This study was funded by Major Program of National Key Research and Development Project (2020YFA0112600 and 2019YFA0801502), Shanghai Zhangjiang National Innovtaion Demonstration Zone (ZJ2018-ZD-004), National Natural Science Foundation of China (81772954 and 82002945), the Top-Level Clinical Discipline Project of Shanghai Pudong (PWYgf2018-04), Program of Shanghai Academic/Technology Research Leader (20XD1434000), Peak Disciplines (Type IV) of Institutions of Higher Learning in Shanghai, and Shanghai Engineering Research Center of Stem Cells Translational Medicine (20DZ2255100).
The authors declare that the research was conducted in the absence of any commercial or financial relationships that could be construed as a potential conflict of interest.
All claims expressed in this article are solely those of the authors and do not necessarily represent those of their affiliated organizations, or those of the publisher, the editors and the reviewers. Any product that may be evaluated in this article, or claim that may be made by its manufacturer, is not guaranteed or endorsed by the publisher.
We are thankful to PerkinElmer and Sinoneural (Shanghai) Cell and Gene Engineering Holdings Co., Ltd. for their technical support.
The Supplementary Material for this article can be found online at: https://www.frontiersin.org/articles/10.3389/fcell.2021.698795/full#supplementary-material
Supplementary Figure 1 | Analysis of bioluminescence intensity of luciferase hepatocytes in vitro and in vivo after transplanting into Fah–/– mice. (A) BLI image of luciferase hepatocytes in vitro. (B) The linear correlation assay between the number of luciferase hepatocytes and BLI signal intensity, respectively. (C) Representative pictures of 2D BLI imaging of Fah–/– mice (3 days, 1, 3, 5, 8, and 10 weeks). (D) Quantified analysis of 2D BLI signal intensity of Fah–/– mice in vivo. (E) Quantified analysis of transplanted hepatocytes in 2D of Fah–/– mice in vivo. Data are shown as mean ± SEM. ∗p < 0.05, ∗∗p < 0.01, ∗∗∗p < 0.001. N = 3. Student’s t-test.
Supplementary Figure 2 | Assessment of posttransplantation hepatocytes in Fah–/– mice. (A) Bioluminescence intensity of isolated livers, spleen, kidney of Fah–/– mice, respectively. (B) Immunohistochemistry staining of histological sections of the livers from Fah–/– mice with luciferase-hepatocyte transplantation. N = 3. Scale bars, 200 μm (up) and 50 μm (down). (C) Quantification analysis for liver regeneration of Fah–/– mice at 3 days and 10 weeks after transplantation, respectively. (D) The relative expression level of luciferase gene in the liver of Fah–/– mice. (E) Serum levels of ALT (a), AST (b), ALB (c), and total bilirubin (d) in Fah–/–, Fah–/– + luciferase hepatocytes (Fah–/– + Luc-Heps). Data are presented as mean ± SD. ∗p < 0.05, ∗∗p < 0.01, ∗∗∗p < 0.001. N = 3. Student’s t-test.
Supplementary Movie 1 | 3D-BLI signal intensity of Fah–/– mice after transplantation. Real-time 3D BLI imaging and CT scanning of transplanted hepatocytes in Fah–/– mice at 3 days, 1, 3, 5, 8, and 10 weeks after transplantation, respectively.
Supplementary Movie 2 | Localization analysis of transplanted cells. 3D localization analysis of transplanted cells from horizontal (Z), vertical (Y), and longitudinal plane (X) in vivo.
Aalipour, A., Chuang, H. Y., Murty, S., D’Souza, A. L., Park, S. M., Gulati, G. S., et al. (2019). Engineered immune cells as highly sensitive cancer diagnostics. Nat. Biotechnol. 37, 531–539. doi: 10.1038/s41587-019-0064-8
Bourquin, J., Milosevic, A., Hauser, D., Lehner, R., Blank, F., Petri-Fink, A., et al. (2018). Biodistribution, clearance, and long-term fate of clinically relevant nanomaterials. Adv. Mater. 30:e1704307. doi: 10.1002/adma.201704307
Bulte, J. W., Walczak, P., Janowski, M., Krishnan, K. M., Arami, H., Halkola, A., et al. (2015). Quantitative “Hot Spot” imaging of transplanted stem cells using superparamagnetic tracers and Magnetic Particle Imaging (MPI). Tomography 1, 91–97. doi: 10.18383/j.tom.2015.00172
Cossu, G., Birchall, M., Brown, T., De Coppi, P., Culme-Seymour, E., Gibbon, S., et al. (2018). Lancet commission: stem cells and regenerative medicine. Lancet 391, 883–910. doi: 10.1016/s0140-6736(17)31366-1
Dubey, P. (2012). Reporter gene imaging of immune responses to cancer: progress and challenges. Theranostics 2, 355–362. doi: 10.7150/thno.3903
Feigenbaum, G. S., Lemberg, L., and Hare, J. M. (2009). Tracking cell fate with noninvasive imaging. J. Am. Coll. Cardiol. 54, 1627–1628. doi: 10.1016/j.jacc.2009.05.067
Haegele, J., Rahmer, J., Gleich, B., Borgert, J., Wojtczyk, H., Panagiotopoulos, N., et al. (2012). Magnetic particle imaging: visualization of instruments for cardiovascular intervention. Radiology 265, 933–938. doi: 10.1148/radiol.12120424
He, Z., Zhang, H., Zhang, X., Xie, D., Chen, Y., Wangensteen, K. J., et al. (2010). Liver xeno-repopulation with human hepatocytes in Fah-/-Rag2-/- mice after pharmacological immunosuppression. Am. J. Pathol. 177, 1311–1319. doi: 10.2353/ajpath.2010.091154
He, Z. Y., Deng, L., Li, Y. F., Xiang, D., Hu, J. K., Chen, Y. X., et al. (2012). Murine embryonic stem cell-derived hepatocytes correct metabolic liver disease after serial liver repopulation. Int. J. Biochem. Cell Biol. 44, 648–658. doi: 10.1016/j.biocel.2012.01.002
Herter-Sprie, G. S., Korideck, H., Christensen, C. L., Herter, J. M., Rhee, K., Berbeco, R. I., et al. (2014). Image-guided radiotherapy platform using single nodule conditional lung cancer mouse models. Nat. Commun. 5:5870. doi: 10.1038/ncomms6870
Iwano, S., Sugiyama, M., Hama, H., Watakabe, A., Hasegawa, N., Kuchimaru, T., et al. (2018). Single-cell bioluminescence imaging of deep tissue in freely moving animals. Science 359, 935–939. doi: 10.1126/science.aaq1067
Jokerst, J. V., Thangaraj, M., Kempen, P. J., Sinclair, R., and Gambhir, S. S. (2012). Photoacoustic imaging of mesenchymal stem cells in living mice via silica-coated gold nanorods. ACS Nano 6, 5920–5930. doi: 10.1021/nn302042y
Kircher, M. F., Gambhir, S. S., and Grimm, J. (2011). Noninvasive cell-tracking methods. Nat. Rev. Clin. Oncol. 8, 677–688. doi: 10.1038/nrclinonc.2011.141
Knox, H. J., and Chan, J. (2018). Acoustogenic probes: a new frontier in photoacoustic imaging. Acc. Chem. Res. 51, 2897–2905. doi: 10.1021/acs.accounts.8b00351
Kocher, B., and Piwnica-Worms, D. (2013). Illuminating cancer systems with genetically engineered mouse models and coupled luciferase reporters in vivo. Cancer Discov. 3, 616–629. doi: 10.1158/2159-8290.Cd-12-0503
Krohn, N., Kapoor, S., Enami, Y., Follenzi, A., Bandi, S., Joseph, B., et al. (2009). Hepatocyte transplantation-induced liver inflammation is driven by cytokines-chemokines associated with neutrophils and Kupffer cells. Gastroenterology 136, 1806–1817. doi: 10.1053/j.gastro.2009.01.063
Kuo, C., Coquoz, O., Troy, T. L., Xu, H., and Rice, B. W. (2007). Three-dimensional reconstruction of in vivo bioluminescent sources based on multispectral imaging. J. Biomed. Opt. 12:024007. doi: 10.1117/1.2717898
Massoud, T. F., and Gambhir, S. S. (2003). Molecular imaging in living subjects: seeing fundamental biological processes in a new light. Genes Dev. 17, 545–580. doi: 10.1101/gad.1047403
Nguyen, P. K., Riegler, J., and Wu, J. C. (2014). Stem cell imaging: from bench to bedside. Cell Stem Cell 14, 431–444. doi: 10.1016/j.stem.2014.03.009
Ott, M., and Castell, J. V. (2019). Hepatocyte transplantation, a step forward? J. Hepatol. 70, 1049–1050. doi: 10.1016/j.jhep.2019.03.022
Phair, R. D., and Misteli, T. (2001). Kinetic modelling approaches to in vivo imaging. Nat. Rev. Mol. Cell Biol. 2, 898–907. doi: 10.1038/35103000
Thomas, E. D. (1987). Bone marrow transplantation. CA Cancer J. Clin. 37, 291–301. doi: 10.3322/canjclin.37.5.291
Thomas, E. D. (2005). Bone marrow transplantation from the personal viewpoint. Int. J. Hematol. 81, 89–93. doi: 10.1532/ijh97.04197
Thompson, S. M., Callstrom, M. R., Knudsen, B. E., Anderson, J. L., Sutor, S. L., Butters, K. A., et al. (2013). Molecular bioluminescence imaging as a noninvasive tool for monitoring tumor growth and therapeutic response to MRI-guided laser ablation in a rat model of hepatocellular carcinoma. Invest. Radiol. 48, 413–421. doi: 10.1097/RLI.0b013e31827a4a3f
Wang, C., Chen, W. J., Wu, Y. F., You, P., Zheng, S. Y., Liu, C. C., et al. (2018). The extent of liver injury determines hepatocyte fate toward senescence or cancer. Cell Death Dis. 9:575. doi: 10.1038/s41419-018-0622-x
Wang, M. J., Chen, F., Li, J. X., Liu, C. C., Zhang, H. B., Xia, Y., et al. (2014). Reversal of hepatocyte senescence after continuous in vivo cell proliferation. Hepatology 60, 349–361. doi: 10.1002/hep.27094
Wangensteen, K. J., Wilber, A., Keng, V. W., He, Z., Matise, I., Wangensteen, L., et al. (2008). A facile method for somatic, lifelong manipulation of multiple genes in the mouse liver. Hepatology 47, 1714–1724. doi: 10.1002/hep.22195
Wei, Y., Zhou, L., Yang, D., Yao, T., and Shi, S. (2018). Stem cells controlling, imaging and labeling by functional nanomaterials. Nano LIFE 08, 1841007. doi: 10.1142/S1793984418410076
Yao, Z., Zhang, B. S., and Prescher, J. A. (2018). Advances in bioluminescence imaging: new probes from old recipes. Curr. Opin. Chem. Biol. 45, 148–156. doi: 10.1016/j.cbpa.2018.05.009
Zhang, Y., Zhang, Y., Yin, L., Xia, X., Hu, F., Liu, Q., et al. (2017). Synthesis and bioevaluation of iodine-131 directly labeled cyclic RGD-PEGylated gold nanorods for tumor-targeted imaging. Contrast Media Mol. Imaging 2017:6081724. doi: 10.1155/2017/6081724
Zheng, B., Vazin, T., Goodwill, P. W., Conway, A., Verma, A., Saritas, E. U., et al. (2015). Magnetic particle imaging tracks the long-term fate of in vivo neural cell implants with high image contrast. Sci. Rep. 5:14055. doi: 10.1038/srep14055
Keywords: cell transplantation, in vivo tracking, bioluminescence imaging (BLI), computer tomography (CT), cell distribution
Citation: Lu F, Pan X, Zhang W, Su X, Gu Y, Qiu H, Shen S, Liu C, Liu W, Wang X, Zhan Z, Liu Z and He Z (2021) A Three-Dimensional Imaging Method for the Quantification and Localization of Dynamic Cell Tracking Posttransplantation. Front. Cell Dev. Biol. 9:698795. doi: 10.3389/fcell.2021.698795
Received: 22 April 2021; Accepted: 03 August 2021;
Published: 07 September 2021.
Edited by:
Melissa R. Andrews, University of Southampton, United KingdomReviewed by:
Ragai Mitry, King’s College London, United KingdomCopyright © 2021 Lu, Pan, Zhang, Su, Gu, Qiu, Shen, Liu, Liu, Wang, Zhan, Liu and He. This is an open-access article distributed under the terms of the Creative Commons Attribution License (CC BY). The use, distribution or reproduction in other forums is permitted, provided the original author(s) and the copyright owner(s) are credited and that the original publication in this journal is cited, in accordance with accepted academic practice. No use, distribution or reproduction is permitted which does not comply with these terms.
*Correspondence: Zhongmin Liu, bGl1Lnpob25nbWluQHRvbmdqaS5lZHUuY24=; Zhiying He, enloZUB0b25namkuZWR1LmNu
†These authors have contributed equally to this work
Disclaimer: All claims expressed in this article are solely those of the authors and do not necessarily represent those of their affiliated organizations, or those of the publisher, the editors and the reviewers. Any product that may be evaluated in this article or claim that may be made by its manufacturer is not guaranteed or endorsed by the publisher.
Research integrity at Frontiers
Learn more about the work of our research integrity team to safeguard the quality of each article we publish.