 Jingyi Chen1,2
 Baocheng Deng
 Yan Wang
94% of researchers rate our articles as excellent or good
Learn more about the work of our research integrity team to safeguard the quality of each article we publish.
Find out more
ORIGINAL RESEARCH article
Front. Cell Dev. Biol., 01 October 2021
Sec. Molecular and Cellular Pathology
Volume 9 - 2021 | https://doi.org/10.3389/fcell.2021.689917
This article is part of the Research TopicThe Application of AI and Other Advanced Technology in Studying Eye Diseases and Visual DevelopmentView all 21 articles
Myopia is a major public health concern with increasing global prevalence and is the leading cause of vision loss and complications. The potential role of the cornea, a substantial component of refractive power and the protective fortress of the eye, has been underestimated in the development of myopia. Our study acquired corneal stroma tissues from myopic patients undergoing femtosecond laser-assisted small incision lenticule extraction (SMILE) surgery and investigated the differential expression of circulating proteins between subjects with low and high myopia by means of high-throughput proteomic approaches—the quantitative tandem mass tag (TMT) labeling method and parallel reaction monitoring (PRM) validation. Across all corneal stroma tissue samples, a total of 2,455 proteins were identified qualitatively and quantitatively, 103 of which were differentially expressed between those with low and high myopia. The differentially abundant proteins (DAPs) between the groups of stroma samples mostly demonstrated catalytic activity and molecular function regulator and transporter activity and participated in metabolic processes, biological regulation, response to stimulus, and so forth. Pathway enrichment showed that mineral absorption, ferroptosis, and HIF-1 signaling pathways were activated in the human myopic cornea. Furthermore, TMT analysis and PRM validation revealed that the expression of ferritin light chain (FTL, P02792) and ferritin heavy chain (FTH1, P02794) was negatively associated with myopia development, while the expression of serotransferrin (TF, P02787) was positively related to myopia status. Overall, our results indicated that subjects with low and high myopia could have different proteomic profiles or signatures in the cornea. These findings revealed disturbances in iron metabolism and corneal oxidative stress in the more myopic eyes. Iron metabolic proteins could serve as an essential modulator in the pathogenesis of myopia.
Myopia, as a complex multifactorial disease, is a globally recognized epidemic and a common cause of vision impairment characterized by its increasing prevalence among younger generations and heterogeneity among regions and ethnicities (Holden et al., 2016). Moreover, high myopia also foreshadows the irreversible visual damage caused by its pathological complications, such as retinal detachment, myopia-related retinopathy, and choroidal neovascularization (Wong et al., 2014).
To date, the underlying pathogenesis of myopia is still elusive, and various theories have been proposed to explain its development. The projected mechanisms for myopia are universally considered to be triggered by a combination of genetic susceptibility and environmental elements, among which metabolic factors are the most intricate, with little implications from the available evolutionary analyses (Morgan et al., 2012). Previous practices have attempted to address the impact of retinal defocus, which triggers the retina–choroid pathway, or hypoxia of the sclera, which would cause scleral collagen remodeling (Morgan et al., 2018). The associated mechanisms have been predominantly studied in animal models. Steeper corneas have been implicated in high amounts of form-deprived myopia in experimental animal models (Qiao-Grider et al., 2010). Furthermore, several manipulations justified alterations of the anterior and posterior segments in mammalian and avian ametropia models (Troilo et al., 2019). Nonetheless, the potential roles of the cornea, representing a substantial component of refractive power, and the protective fortress of the eyeball have been underestimated in myopic studies. High-quality analyses conducted in regions with the highest prevalence of myopia could provide useful information using representative clinical ocular samples.
Recent omics studies on myopia have predominantly focused on genomics, in order to identify genetic risk factors. Various international and polycentric genome-wide association studies (GWAS) and meta-analyses have been conducted on refractive phenotypes (Hysi et al., 2014). Proteomic analyses of myopia have hitherto included serum, tear, and aqueous humor samples from humans and retinal, scleral, and vitreous humor samples from animal models, considering sample availability and visually guided structural alterations during model establishment (Grochowski et al., 2020). A recent study first reported differentially abundant corneal proteins in high myopia chick models (Kang et al., 2021). However, no biomarker that corresponds to the diagnosis and classification of human myopia has yet been identified. The exploration of novel biomarkers would provide additional information on disease pathogenesis and related pathways. Therefore, a more comprehensive understanding of the molecular functions and processes involved in the development of high myopia is necessary to promote these interventions.
Small incision lenticule extraction (SMILE) surgery takes advantage of a femtosecond laser to shape a refractive lenticule from the corneal stroma, which is then removed through a particular small incision (Kim et al., 2019). The present study aimed to characterize the potential molecular pattern of the distinct evolution of low versus high myopia in patients scheduled to undergo SMILE surgery for myopia.
The current study acquired approval from the Institutional Review Board of Nankai University and Nankai University Eye Hospital (Ethics Number 201922) and abided by the tenets of the World Medical Association Declaration of Helsinki. The study was case-controlled and cross-sectional and conformed to the Strengthening the Reporting of Observational Studies in Epidemiology (STROBE) guidelines of observational studies. All enrolled participants agreed to the sample collection, and informed consent was obtained. In total, 62 systemically healthy subjects aged 18–34 years (96 eyes), were recruited between 2019 and 2020. Complete general and ophthalmic histories were collected from all participants. Since this study aimed at a proteomic evaluation for low versus high myopia eyes, an individual eye was set as a target, rather than an individual subject, which meant both eyes could be selected from the same subject. The enrolled eyes were divided into the low-myopia and high-myopia groups. The group stratification in our study was determined with respect to the spherical equivalent (SE), which was assessed as sphere + cylinder/2. The SE was defined as less than –3.00D for low myopia and over –6.00D for high myopia (Morgan et al., 2012). The inclusion criteria were as follows: generalized myopic patients scheduled for SMILE surgery with written informed consent; absence of a history or examination evidence of ocular trauma; and absence of unrelated ocular diseases such as cataract, glaucoma, or retinopathy. The systemic exclusion criteria were the presence of systemic disorders such as diabetes mellitus, respiratory or cardiovascular diseases, hypertension, kidney disease, severe infection status, conditions of inflammation or current pregnancy, and not taking any medication such as antimetabolites, immunosuppressants, or steroids.
Among the 96 eyes of 62 participants, 18—9 eyes with low myopia and 9 eyes with high myopia, respectively, were randomly selected for sample collection. Corneal stroma tissue samples were acquired during VisuMax (Carl Zeiss Meditec, Jena, Germany) SMILE surgery at Nankai University Eye Hospital. Each stroma sample was kept separately in an Eppendorf tube, marked, and frozen in liquid nitrogen immediately after the lenticule extraction procedure. The samples were then stored at –80°C until measurement.
The nine corneal stroma samples in either group were randomly mixed into three sample mixtures for the tandem mass tag (TMT) proteomic experiment and future validation study. Three mixed samples from low or high myopia eyes were randomly set as one biological parallel (Huang et al., 2020). An equal batch of adequate corneal stroma tissue from each sample was amalgamated and pulverized into a powder. The sorted samples were then homogenized by adding SDT1 buffer [4% sodium dodecyl sulfate (SDS), 1 mmol dithiothreitol (DTT), 100 mmol Tris–HCl, pH 7.6] and transferred to Eppendorf tubes with quartz sand (MP homogenizer, 24 × 2, 6.0 M/S, 60 s, twice). Homogenate of protein extraction was carried out by sonication (power 80 W, worktime 10 s, interval 10 s, cycle 10 times) on ice, and the extractions were then boiled for 15 min. The crude digest was centrifuged for 40 min at 14,000 g, and the supernatant was filtered through 0.22 μm filters. The filtrate was calculated using a BCA Protein Assay Kit (Bio-Rad, United States), and the collection was stored at –80°C for future measurement. Sodium dodecyl sulfate polyacrylamide gel electrophoresis (SDS-PAGE) protein separation was performed. Protein samples (20 μg) were mixed in 5 × loading buffer and boiled for 5 min. Protein separation was performed using a 12.5% SDS-PAGE gel (with 14 mA constant current for 90 min). Coomassie Blue R-250 staining was used to visualize the acquired protein bands (Zhu et al., 2014).
Protein digestion was performed using filter-aided sample preparation. Briefly, 200 μg of total protein from each sample was incorporated into SDT2 buffer (4% SDS, 100 mmol DTT, 150 mmol Tris–HCl, pH 8.0), boiled for 5 min, and then cooled to 25°C. Excessive DTT, detergents, and other low-molecular-weight components in the protein samples were washed out using UA buffer (8 M urea, 150 mmol Tris–HCl, pH 8.0) by repeated ultrafiltration (Microcon units, 10 kD, 14,000 g, 15 min). Each filter extract was then added to 100 mM iodoacetamide to inhibit the reduced cysteine residues. The extracts were incubated for 30 min in the dark and then centrifuged for 40 min at 14,000 g. The filtrate was discarded, and the filter was washed in 100 μl UA buffer three times and then in 100 μl of 100 mM triethylammonium bicarbonate (TEAB) buffer twice. Subsequently, 4 μg trypsin (Promega, United States) was dissolved in 40 μl TEAB buffer, and protein suspension was added to this buffer and digested overnight at 37°C. Finally, the digested samples were centrifuged to harvest the resulting peptides, and the concentrations of peptide contents were calculated according to 280 nm UV light spectral density by means of an extinction coefficient of 1.1 in 0.1% (g/L) solution measured in the light frequency of tyrosine and tryptophan in the vertebrate protein atlas (Wiśniewski et al., 2009).
Each consequent peptide mixture (100 μg) was labeled with TMT reagent (Thermo Fisher Scientific, United States). Principally, the three mixed samples of low myopia were labeled with 126, 127C, and 127N isobaric TMT tags, and the three mixed samples of high myopia were labeled with 129C, 130C, and 130N isobaric TMT tags. After TMT labeling, the labeled digest samples were fractionated, and 10 fractions were obtained. The surplus labels and salts were diminished using a high reversed-phase fractionation kit (Thermo Fisher Scientific, United States) to increase the acetonitrile step-gradient elution.
Liquid chromatography–mass spectrometry/mass spectrometry (LC-MS/MS) analysis was performed for each fraction. The peptide compounds were dissolved in buffer A (0.1% formic acid) and then loaded onto a reverse-phase trap column (Thermo Fisher Scientific, PepMap100, 100 μm × 2 cm, nano Viper C18) which was coupled to a C18 reverse-phase analytical column (Thermo Scientific, 75 μm × 10 cm, 3 μm resin) and divided using linear-gradient buffer B (84% acetonitrile + 0.1% formic acid) at a flow rate of 300 nl/min. The linear gradient was processed using the following parameters: 0–55% buffer B for 80 min, 55–100% buffer B for 5 min, and 100% buffer B for 5 min.
LC-MS/MS was performed on a Q Exactive mass spectrometer connected to Easy nLC (Thermo Fisher Scientific) in positive ion mode for 90 min. The procedure was performed in peptide recognition mode. MS data were obtained using a data-dependent top 10 method, which allows dynamic selection of the most copious precursor ions from the 300 to 1,800 m/z survey scan for higher-energy collisional dissociation (HCD) fragmentation. The instrument parameters were set as follows: automatic gain control (AGC) target, 3e6; HCD spectra, 35,000 resolution at m/z 200; survey scans. Seventy thousand resolution at m/z 200; width of resolution, 2 m/z; maximum injection time, 10 ms; and dynamic exclusion duration, 40.0 s. The normalized collision energy was set to 30 eV, and the underfill ratio was defined as 0.1% to allow the minimum percentage of the target value to be accomplished at maximum full time.
The acquired LC-MS/MS spectra were searched using the MASCOT engine (version 2.2; Matrix Science, London, United Kingdom) in Proteome Discoverer 1.4 (Thermo Electron, San Jose, CA, United States). The following parameters were selected: the enzyme applied was trypsin, fragment mass tolerance of 0.1 Da, peptide mass tolerance of ± 20 ppm, and maximum missed cleavages of 2. Fixed modifications were set for the TMT-10 plex, and variable modifications were applied for oxidation. The false discovery rate of the peptides was set as < 0.01. Protein quantification was calculated using protein ratios, which were presented as the median of protein unique peptides. The median protein ratio was used to normalize all peptide ratios. The median protein ratio was defined as 1 after normalization for the experimental bias. The D’Agostino and Pearson normality test was used to calculate data normality. Chi-square and Student’s t-tests were used to analyze demographic and clinical data. For quantitative protein expression analysis, pair-wise group comparisons were performed using LC-MS, and significant differences between groups were assessed using normalized protein abundances in arcsinh transformation. To distinguish differentially abundant proteins (DAPs), the fold change was set as > 1.2 or < 0.83. A p-value (Student’s t-test) of < 0.05 was considered statistically significant (Li et al., 2019).
Hierarchical clustering analysis was performed using protein relative expression data via Cluster 3.0 software1 and Java Treeview software2. The Euclidean distance algorithm for similarity measure and average linkage clustering algorithm using centroids of the observations for clustering were selected. In addition to a dendrogram, a heatmap is often presented as a visual aid. The clustering heatmap and volcano plots of DAPs were visualized using R 3.6.0 software (R: A Language and Environment for Statistical Computing, R Development Core Team).
The expression trends of human corneal stromal proteins were searched in the UniProt KB database and retrieved in FASTA format in batches. The retrieved sequences of differentially expressed proteins were searched with reference to the local SwissProt database (human) using NCBI BLAST + client software for homolog sequences from which the gene ontology (GO) functional annotation could be merged. In this procedure, the top 10 blast hits with E-values of <1e–3 for every query sequence were restored and loaded into Blast2GO software (Version 3.3.5) (Götz et al., 2008) for GO prognostication and annotation, which was set with default gradual enzyme code (EC) weights, a GO weight of 5, an annotation cutoff of 75, and a filtered E-value of 1e–6. The unannotated sequences without BLAST hits were re-annotated with more permissive parameters and were then selected to go through InterProScan (Quevillon et al., 2005) meriting comparison with European Bioinformatics Institute (EBI) databases to fetch functional annotations of protein motifs and derive the InterProScan GO annotation terms. The results of the GO annotation sets were mapped using R scripts (R Development Core Team).
The protein sequences in FASTA form of differentially expressed proteins were searched in the Kyoto Encyclopedia of Genes and Genomes (KEGG) database3. The corresponding KEGG pathways were retrieved and extracted (Moriya et al., 2007).
Functional enrichment analysis was carried out to further explore the influence of differentially altered proteins in cellular physio-pathological processes and the discovery of internal connections between the DAPs. The entire protein quantification dataset was set as the background. GO term enrichment on three ontology modules (BP—biological process, MF—molecular function, and CC—cellular component) and KEGG pathway annotation analyses were measured using Fisher’s exact test. The derived p-values were further adjusted by the application of Benjamin–Hochberg correction for multiple tests, and only GO functional categories and KEGG pathways with p-values < 0.05 were considered statistically significant.
The information of protein–protein interaction (PPI) of the target proteins was searched using the gene symbols and retrieved from the STRING (Search Tool for the Retrieval of Interacting Genes/Proteins) online database4 or IntAct molecular interaction database5. The results were downloaded and imported into Cytoscape software (version 3.2.1)6. Visualization and functional analysis of the PPI networks were conducted. Additionally, the degree of interaction of each target protein was calculated to assess its significance in the PPI network.
The next step after the TMT discovery experiment involved an LC-parallel reaction monitoring (PRM)-based workflow to establish sensitive and accurate detection of the relative abundance of the candidate protein markers. Considering the scarcity of clinically available corneal stroma samples, the PRM validation study was carried out using the same cohort in the phase 1 exploratory study to reinforce the consistency between studies. However, reagent costs have limited the possibility of performing analyses for all identified candidate proteins, which necessitates a further step of prioritization. As a result, the identified proteins from the phase 1 TMT experiment were coped with hierarchical clustering, GO functional enrichment, KEGG pathway enrichment, and PPI network analysis for a comprehensive overview of the DAPs between the comparisons.
In the next step of targeted PRM assays, the selected proteins were optimized in corneal stroma samples using a set of three proteo-unique peptides. The unique peptides were screened from the phase 1 study. For proteins with fewer than three proteo-unique peptides, extra peptides were searched through the online selected reaction monitoring (SRM) Atlas7 (Bostanci et al., 2018). All designated peptides ranged from 6 to 20 amino acids in length and contained tryptic ends without any missing cleavages. For the PRM analysis, SPOT synthesis (JPT Peptide Technologies, Germany) was applied to standard stable isotope-labeled peptides that were identical to the proteo-typic peptides and contained either a C-terminal arginine or lysine residue in unpurified form for chemical synthesis.
The protein expression levels obtained by TMT analysis were further quantified by LC-PRM/MS analysis (Peterson et al., 2012). A portion of 200 μg proteins from each sample was designated for in-solution trypsin digestion following the TMT protocol, and an aqua-stable isotope peptide was spiked per sample as an internal standard reference. Tryptic peptides were loaded on C18 stage tips (Wicom International AG, Maienfeld, Switzerland) for desalting prior to reversed-phase liquid chromatography (RPLC) on the Easy nLC-1200 system (Thermo Fisher Scientific). We proceeded with LC for 1 h with gradients of acetonitrile ranging from 5 to 35% in 45 min.
The succeeding PRM measurements were continued on a Q Exactive Plus mass spectrometer (Thermo Scientific). Highly intensive proteo-unique peptides were utilized for the confidential analysis of each target protein with optimization for charge state, collision time, and retention times. The mass spectrometer was operated in positive ion mode. The following parameters were set: full MS1 scan resolution, 70,000 (at 200 m/z); AGC target, 3.0 × 10⁻⁶; and ion injection time, 200 ms maximum. After the full MS scans, 20 PRM scans were followed at 35,000 resolution (at 200 m/z) with AGC 3.0 × 10⁻⁶ and 200 ms maximum injection times. The resulting peptides were consequently isolated in a 2Th window with ion activation/dissociation at a collision energy of 27 within a higher energy dissociation collision cell (Zhang et al., 2019).
The PRM raw data were processed using the Skyline bioinformatics tool (MacCoss Lab, University of Washington, United States) (MacLean et al., 2010) where the detected signal intensities for individual peptide sequences of each target protein were quantified with standard reference normalization and relative to the respective sample. The Skyline PRM acquisition methods were time-scheduled, and the quantification files contained the results from all selected samples with measurements of the target proteins, including three target proteins and five unique peptide sequences, both heavy and light. A proper Q-value was selected to filter the results of peptide assays for high data quality, where a Q-value > 0.05 was removed. In addition, assays with reported 0 intensity were removed. Subsequently, the light-to-heavy ratio was programmed as log2 fold change. The correlation between peptide transitions was computed and demanded a quality filter. All peptide transitions with more than 10 nucleic acids and with a Pearson correlation of <0.5 were removed from the dataset. The median of the log2(l/h) ratios for peptide transitions was used to acquire peptide quantification and to obtain the protein log2(l/h) ratios.
The STRING functional protein association networks online database (see text footnote 4) and GeneMANIA online database for genes and gene sets functional predictions8 were used for the critical evaluation and integration of predictive PPI networks based on the PRM validation evidence as well as genomic and proteomic knowledge gained from human studies. The prioritized proteins were mapped individually and integrally to create the predicted images.
The present study included 96 eyes of 62 systemically healthy subjects, among which 18 eyes from 13 subjects were randomly selected for proteomic discovery analysis. The low myopia group included nine eyes (OD = 4/OS = 5) from seven subjects (six males/one female), aged 24 ± 6.5 years, with an SE of –1.94 ± 0.30D. The high myopia group included nine eyes (OD = 5/OS = 4) from six subjects (five males/one female), aged 22.6 ± 6.8 years, with an SE of –8.68 ± 0.60D. No significant differences were noted between the two groups in terms of age, gender, and left or right eye selected, but subjects in the low myopia group had a significantly lower SE than did those in the high myopia group (p < 0.001).
The discovery study was conducted using high-throughput TMT quantitative proteomic techniques. A total of 2,455 different proteins in the Homo sapiens protein atlas were identified (Supplementary Table 1). Overall, 103 DAPs were confirmed in the comparison between low and high myopic eyes. Among the DAPs, 47 proteins were upregulated, and 56 proteins were downregulated (Figure 1). A heat map was plotted for the visualization of the hierarchical clustering analysis of the identified DAPs (Figure 2).
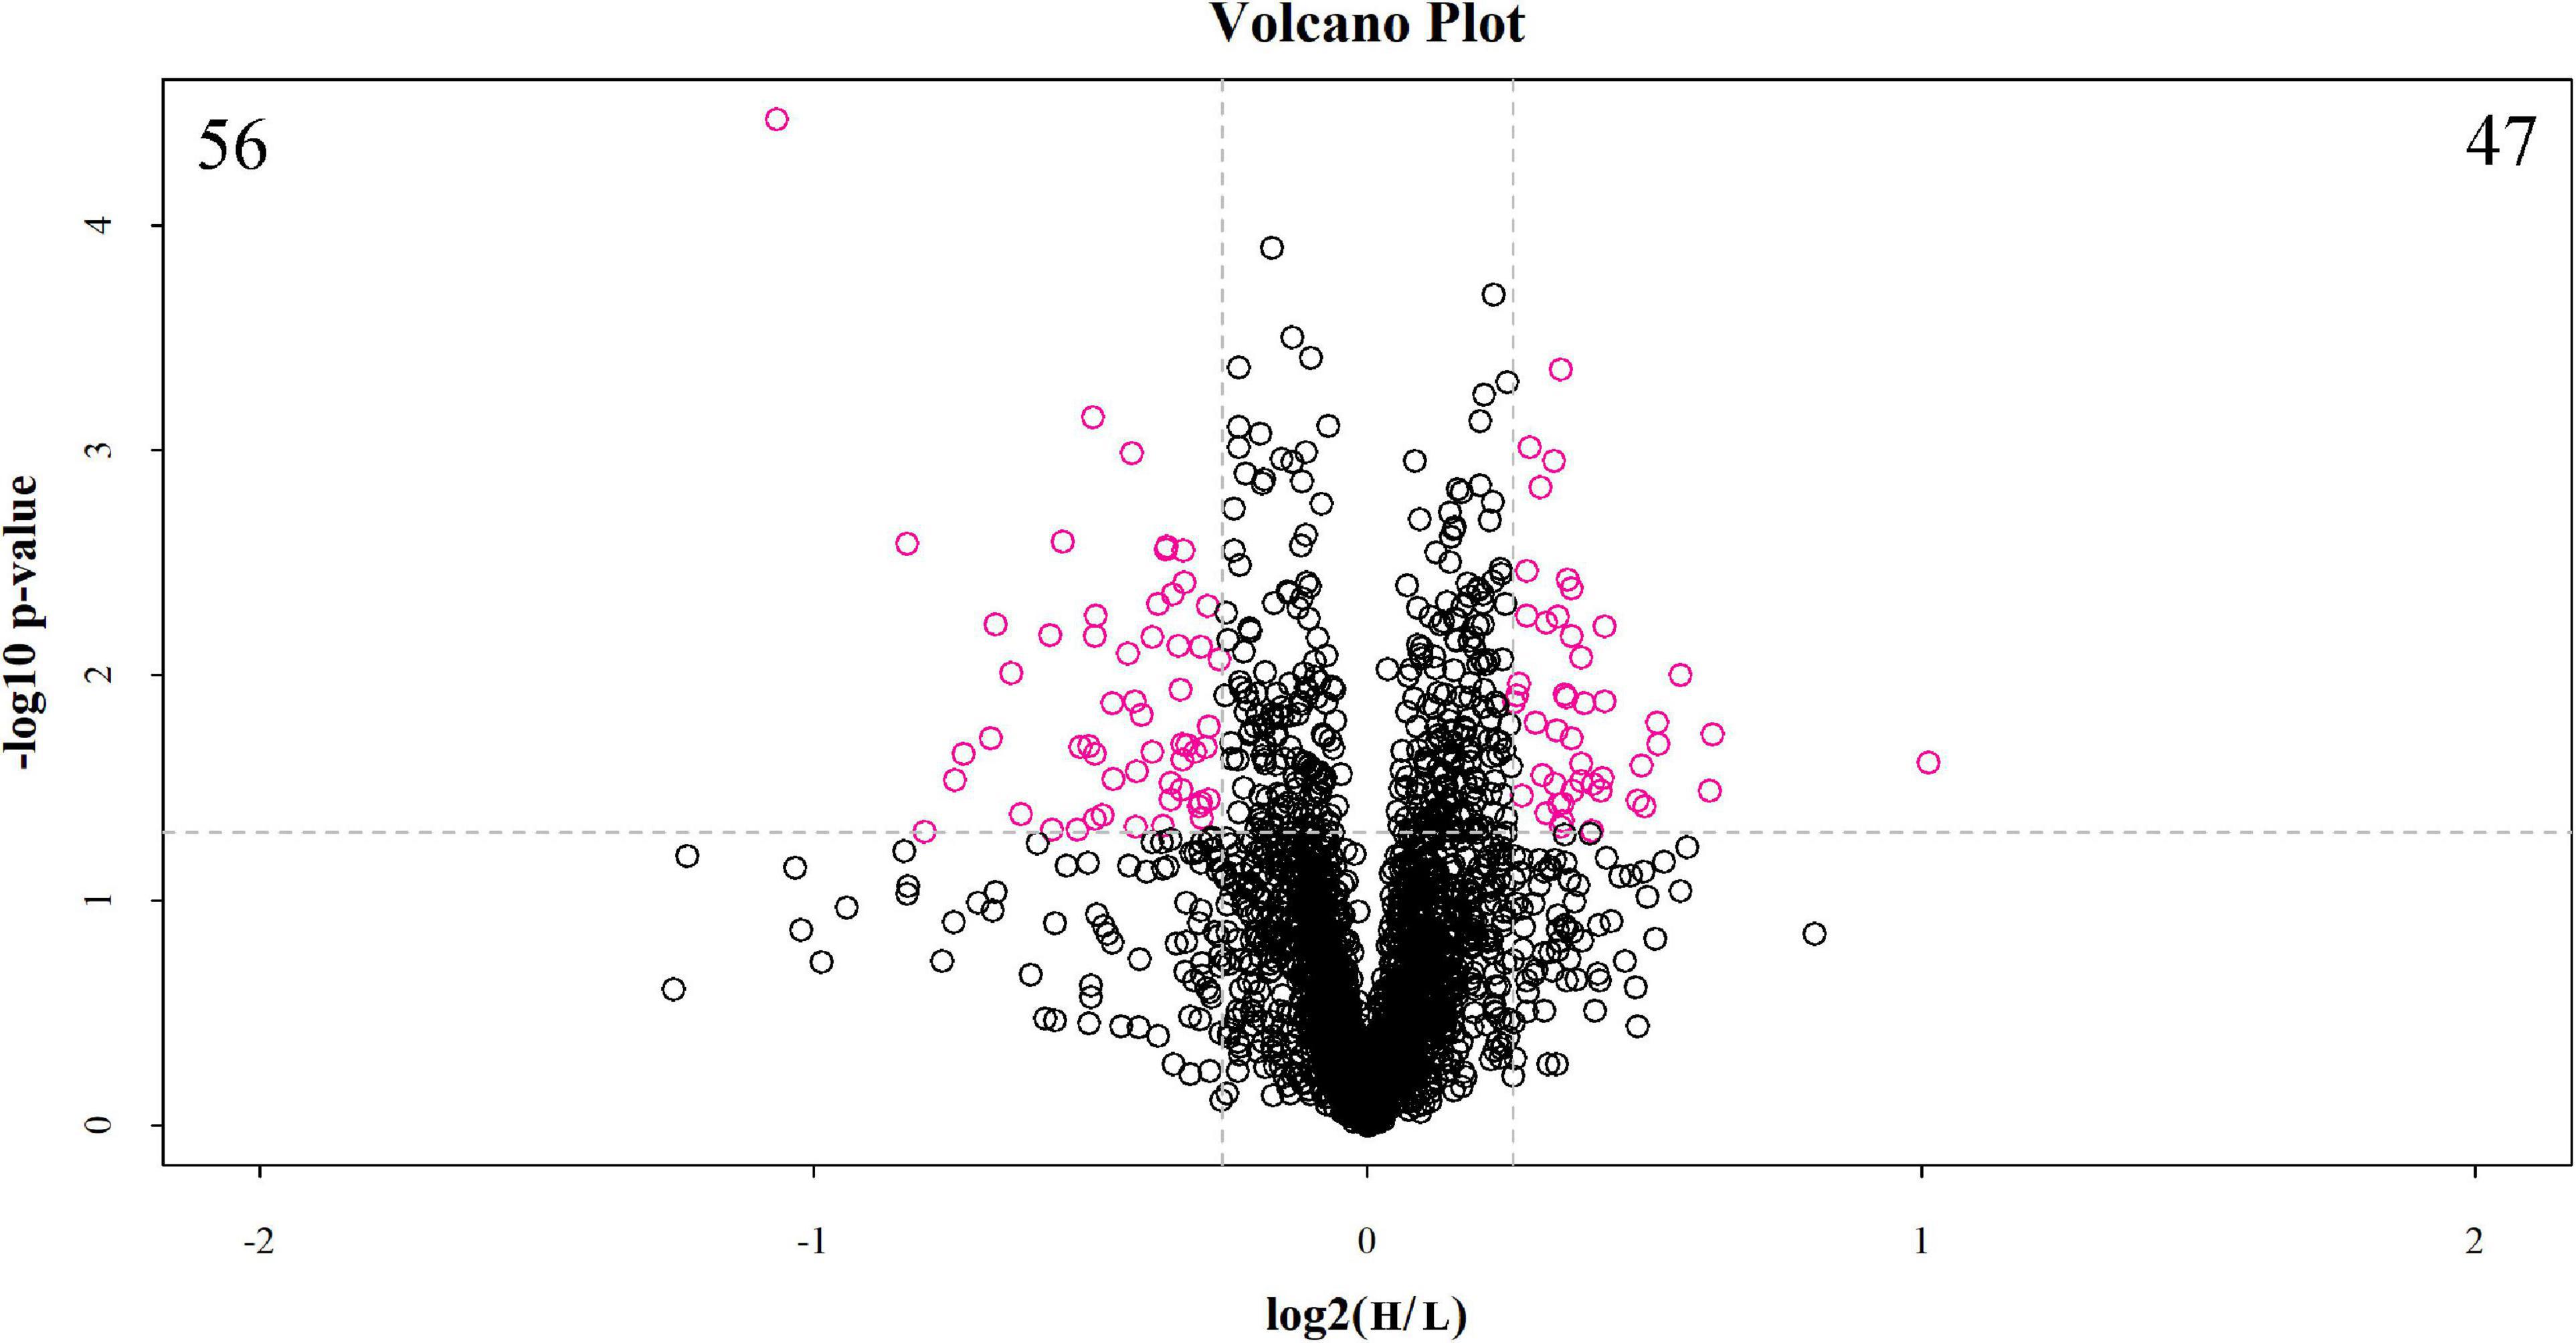
Figure 1. Volcano plot of differentially abundant proteins between the low and high myopia groups. The volcano plot shows a significant difference in differentially abundant proteins (DAPs) between the two groups of samples. The x-axis represents the difference multiple (log2 fold change), and the y-axis represents the p-value of the difference (–log10). The red dots in the figure represent the significant DAPs (multiple changes > 1.2 or < 0.83 and p < 0.05), and the black dots show that there are no differences detected in the proteins between the two groups. H, high myopia group; L, low myopia group.
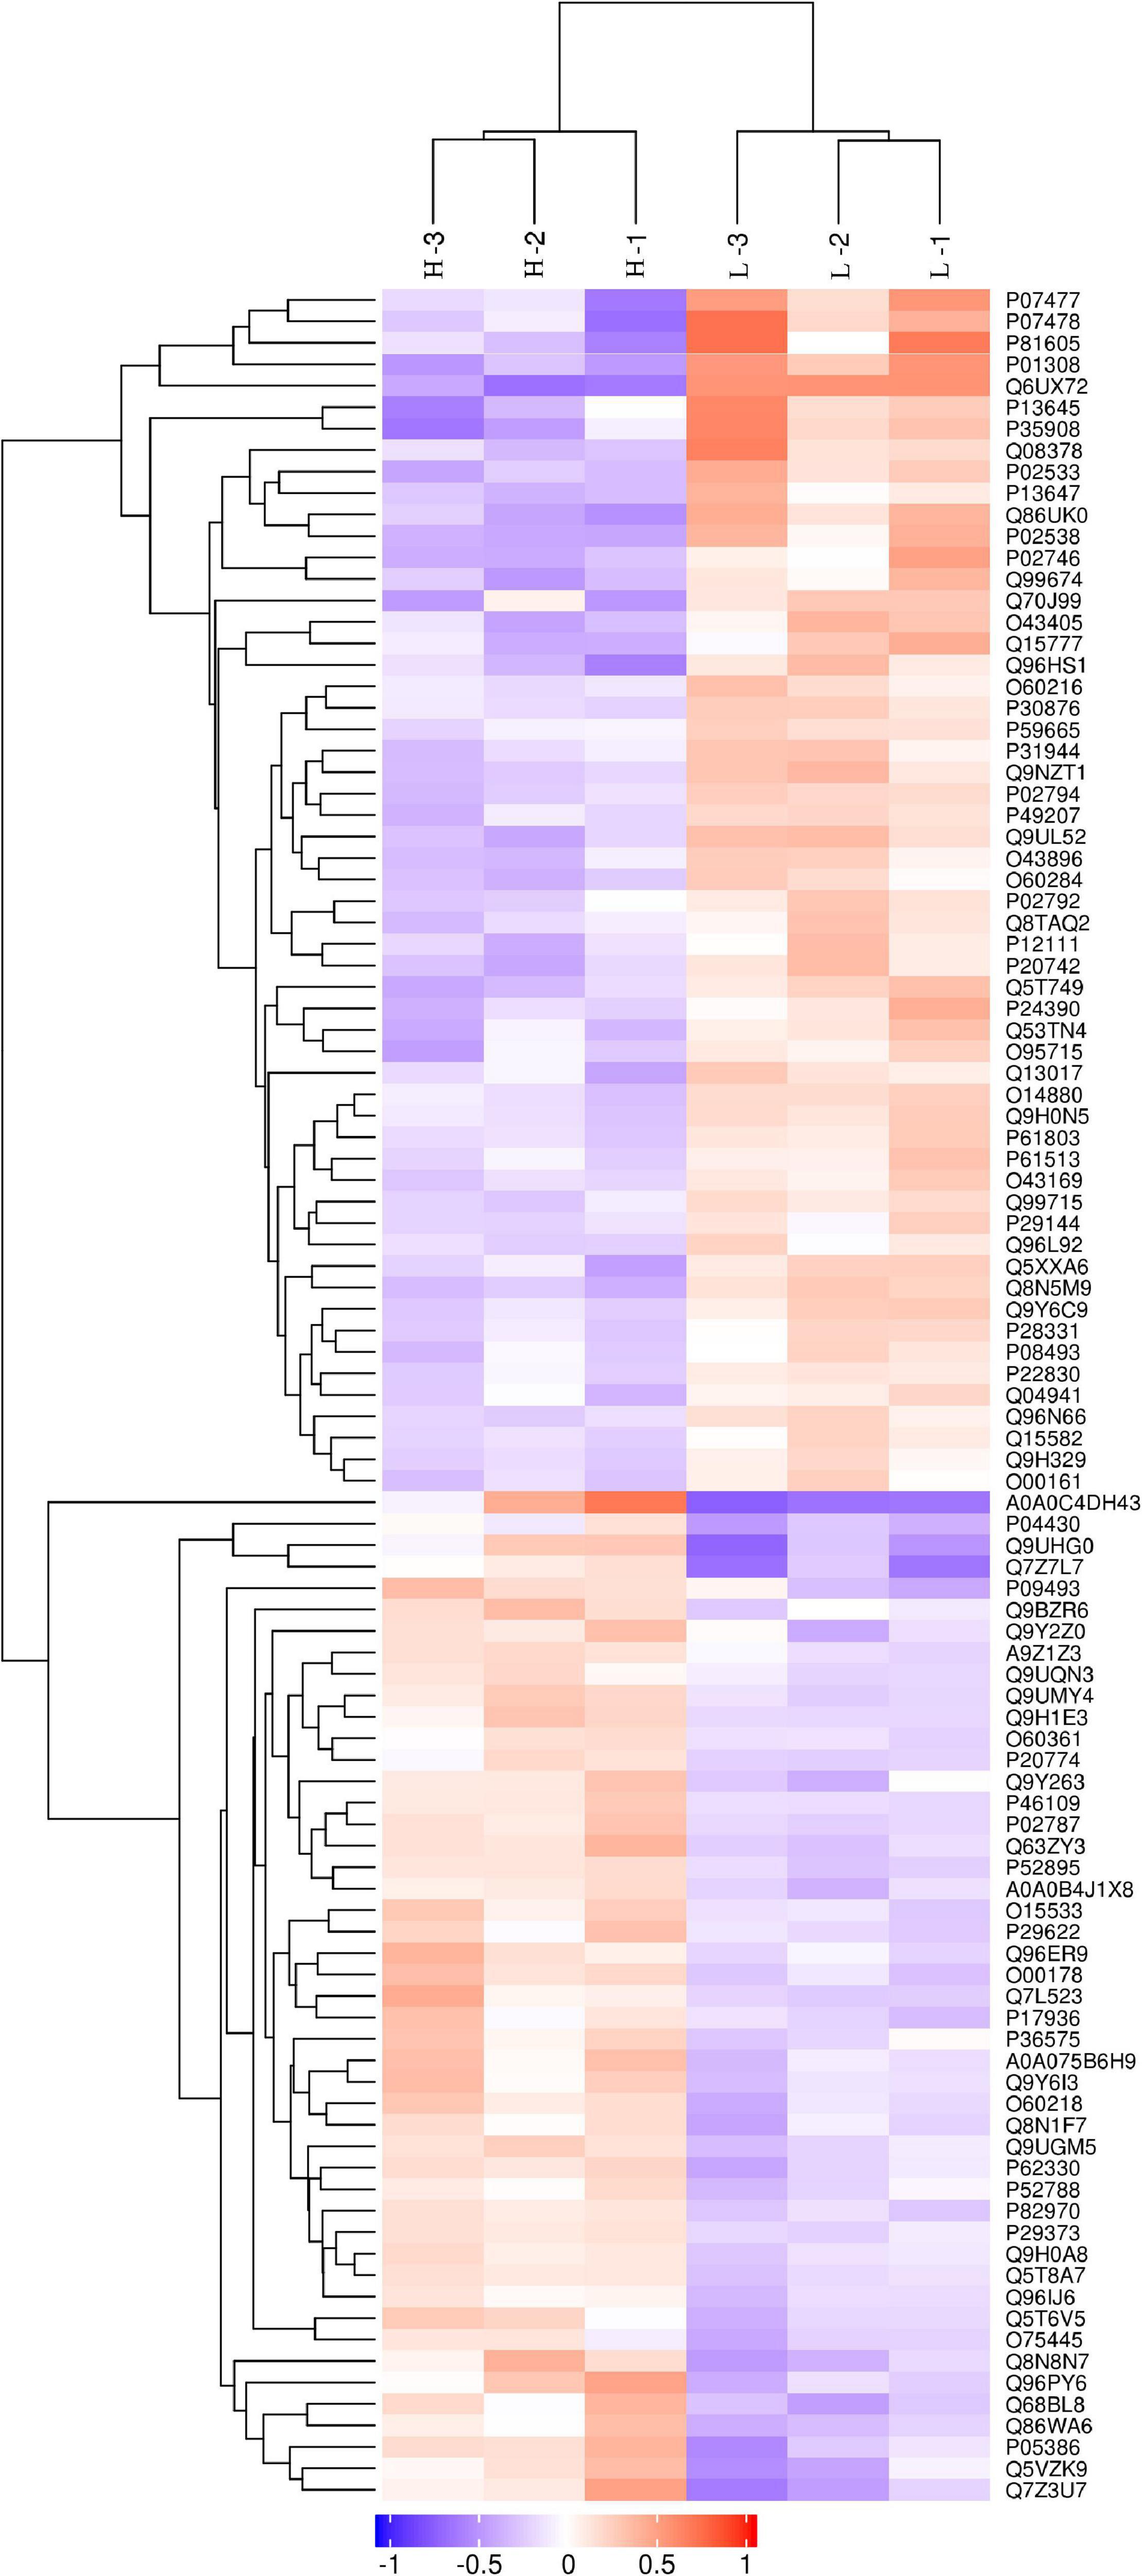
Figure 2. Clustering analysis of differentially abundant proteins. Hierarchical clustering analysis was performed using a tree heat map. In the heat map, each row represents a protein [i.e., the ordinate represents the significant differentially abundant proteins (DAPs)], and each column represents a group of samples (the abscissa is the sample information). The logarithm values (log2 expression) of the significant DAPs are displayed in different colors, where red represents significantly upregulated proteins, purple represents significantly downregulated proteins, and gray represents no available protein quantitative information.
The results of the bioinformatics and functional enrichment analyses are presented in Table 1. The significantly altered proteins between the low-myopia and high-myopia groups were further categorized, whereby relevant GO and KEGG term enrichment were prioritized with regard to their E-value and p-value. The mapped GO function and KEGG pathway demonstrated that the functions of the DAPs were predominantly catalytic activity, binding, molecular function regulator, structural molecule activity, and transporter activity, and the most significantly regulated processes in high myopia compared with low myopia were “metabolic process,” “cellular process,” “biological regulation,” “response to stimulus,” and “regulation of biological process.”
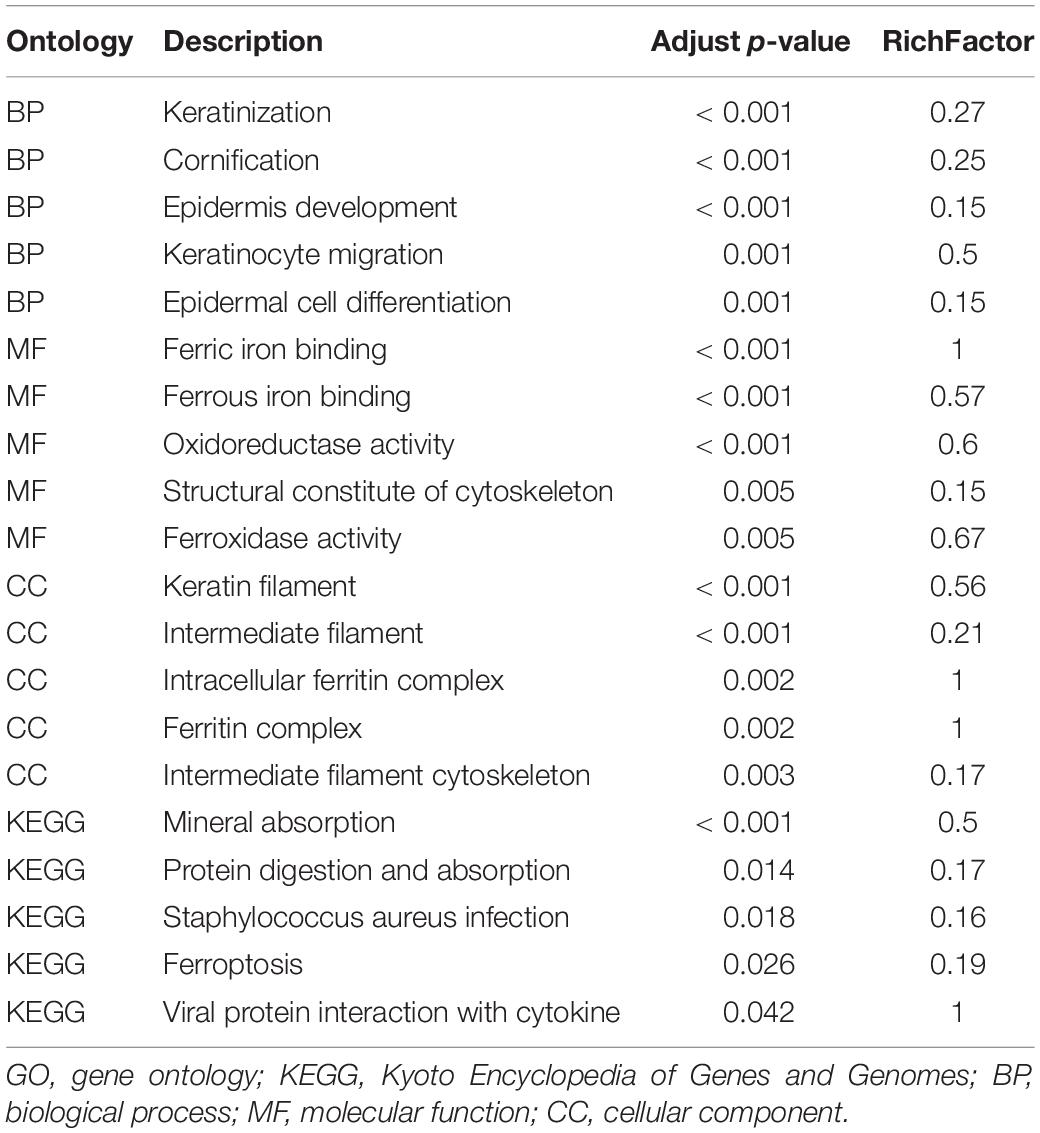
Table 1. Top five ontology terms for GO and KEGG analysis.
Figure 3 demonstrates the top 20 enriched GO terms of BP (Figure 3A), MF (Figure 3B), and CC (Figure 3C). The main biological processes of DAPs involved metabolic process, cellular process, biological regulation, and response to stimulus. The main molecular functions were associated with ferric iron binding, ferrous iron binding, structural molecule activity, catalytic activity, and molecular transducer activity. The main cellular components of these proteins were exhibited as cell and organelle part, ferritin complex, intracellular ferritin complex, and protein-containing complex (Figure 4).
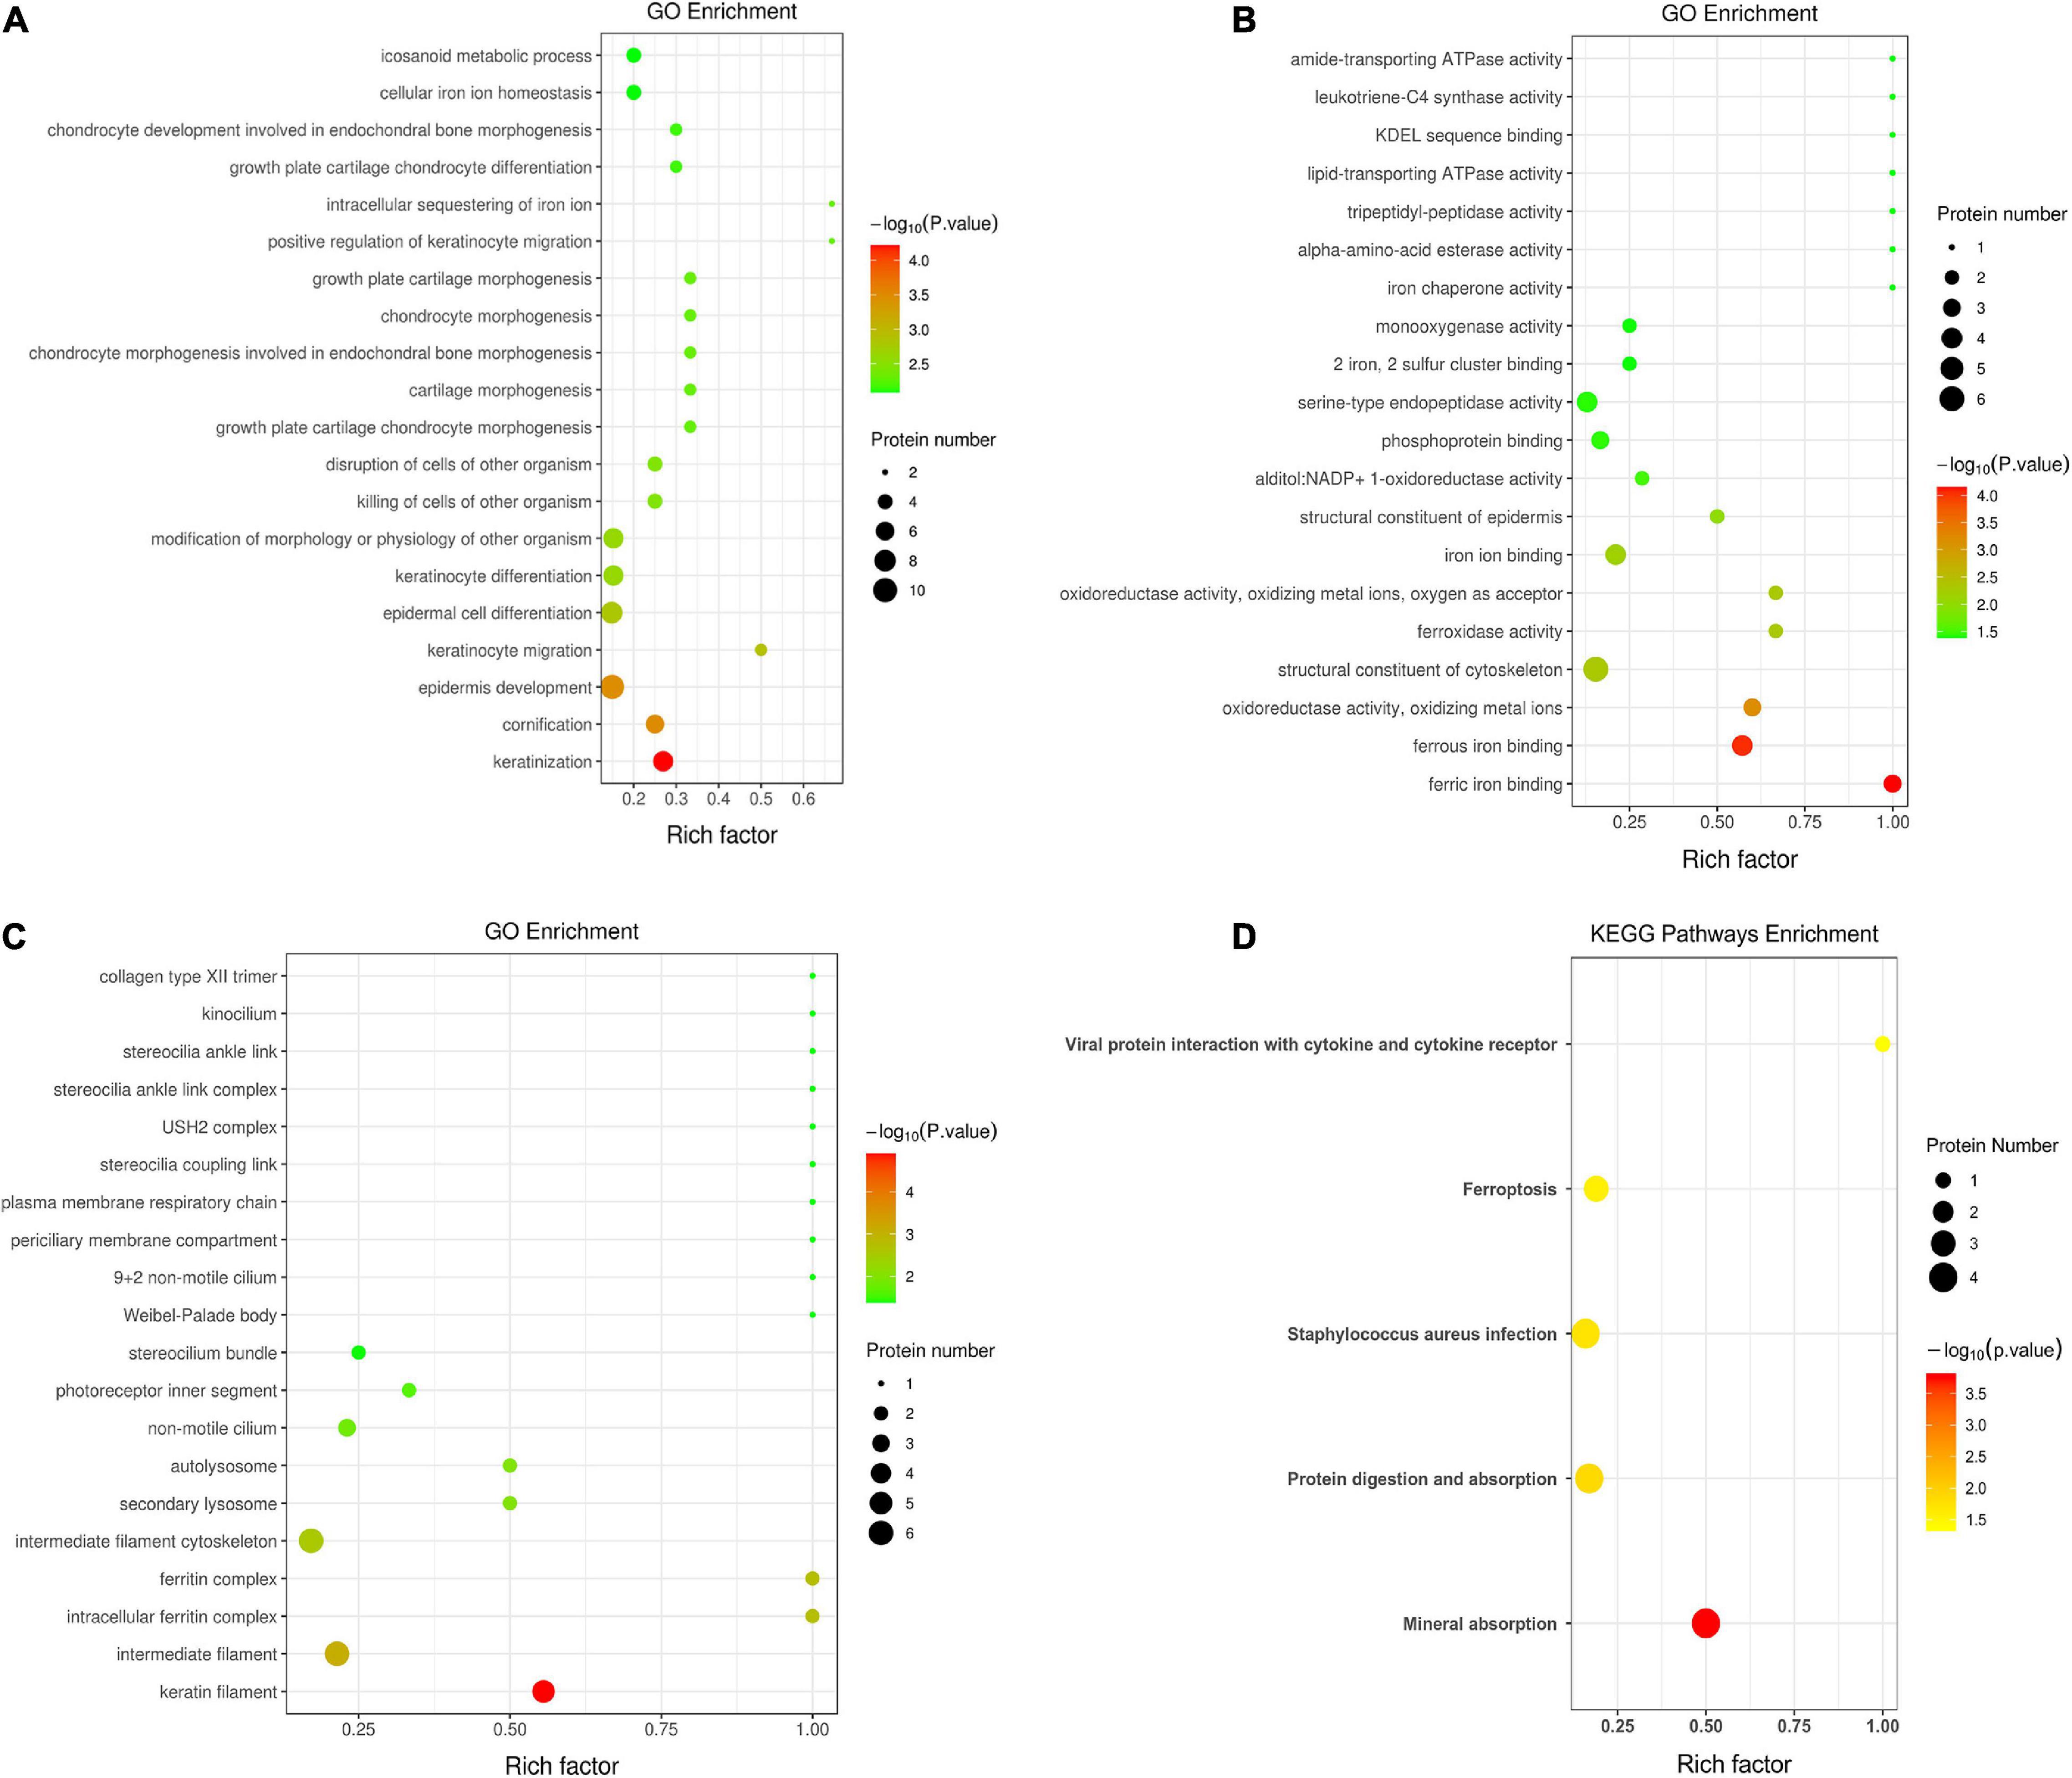
Figure 3. Gene ontology annotation and Kyoto Encyclopedia of Gene and Genomes pathway enrichment analysis between the low and high myopia groups. The ordinate in the figure stands for the enriched gene ontology (GO) functional annotation, which can be divided into (A) BP, (B) MF, and (C) CC or (D) enriched Kyoto Encyclopedia of Genes and Genomes (KEGG) pathways. The abscissa stands for enrichment factors (rich factor ≤ 1). The rich factor represents the proportion of DAPs annotated in a functional ontology to the number of all identified proteins annotated in that functional ontology. The size of the bubbles in the figure indicates the number of differentially expressed proteins in each classified functional ontology. The color of the bubbles indicates the significance of the enriched functional categories. The color gradient displays the p-value, where the closer to red, the smaller the p-value and the higher the significance level of the corresponding ontology.
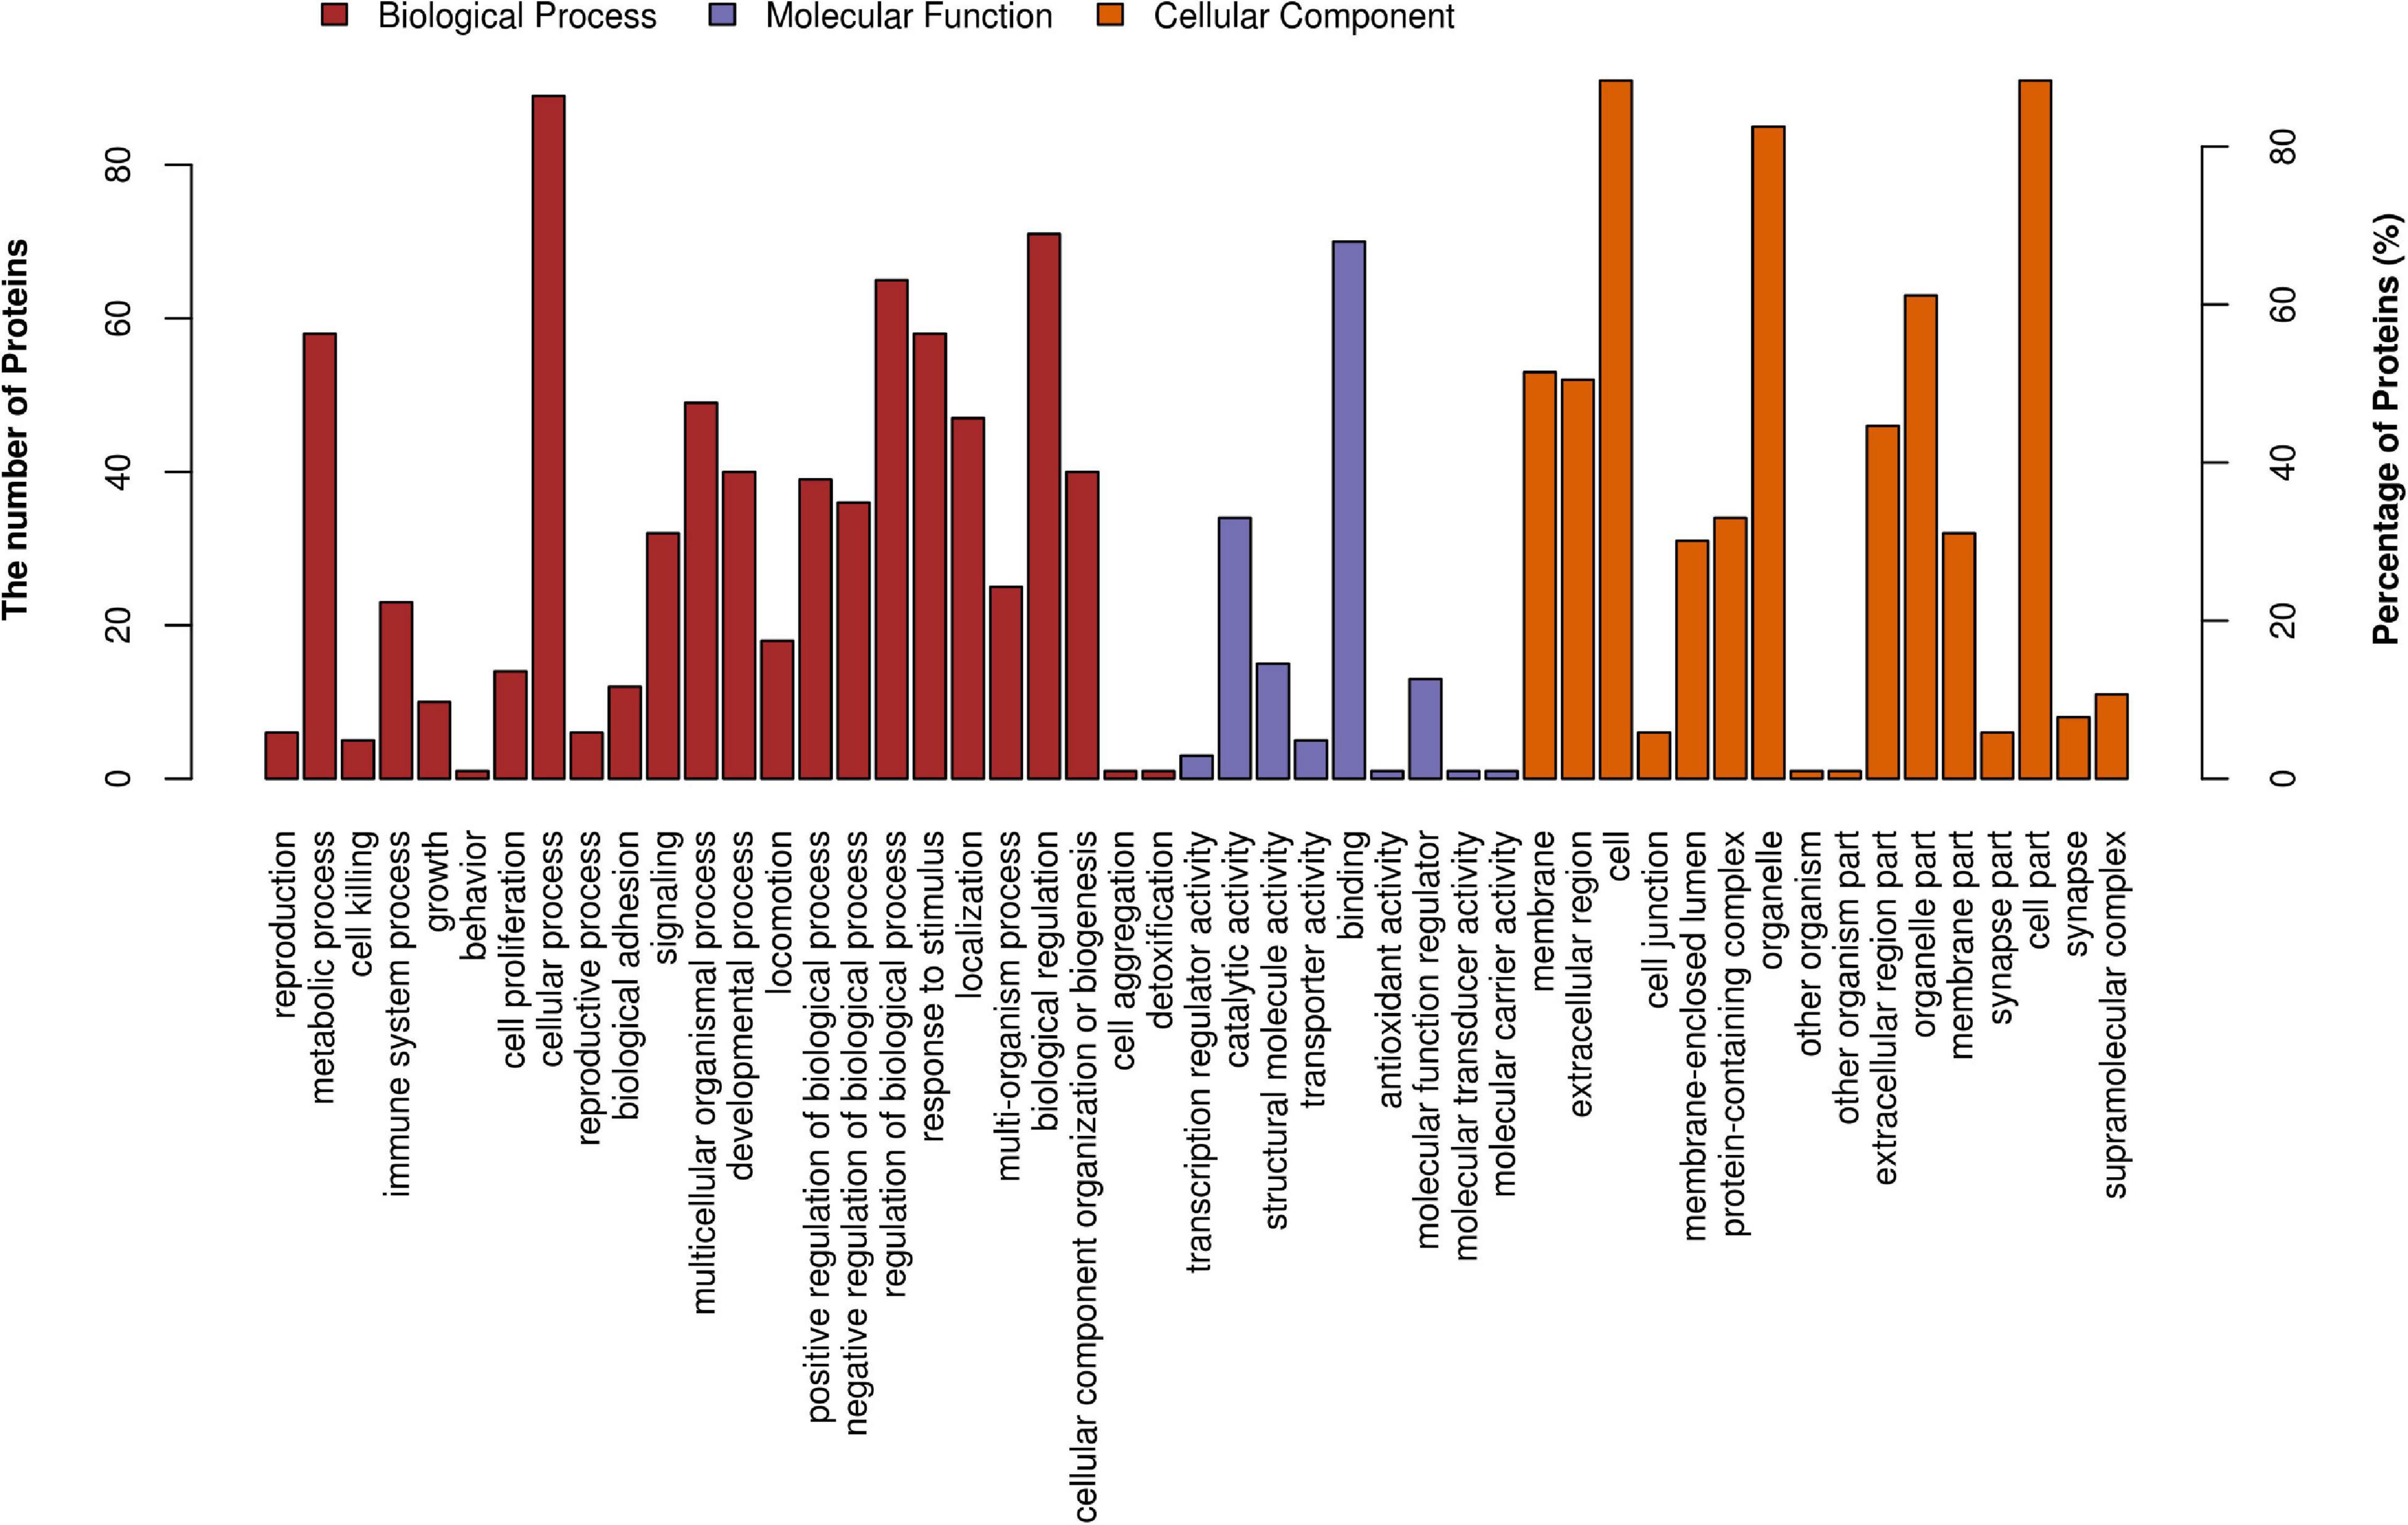
Figure 4. GO level 2 functional analysis. The x-axis shows the enriched GO level 2 functional annotation, which was demonstrated as BP (red), MF (purple), and CC (orange). The y-axis shows the number and percentage of proteins detected. BP, biological process; MF, molecular function; CC, cellular component.
Figure 3D shows the KEGG pathway enrichment analysis. The DAPs were enriched into mineral absorption, ferroptosis, staphylococcus aureus infection, protein digestion, and absorption pathways. Figure 5 demonstrates the top 20 enriched KEGG pathways.
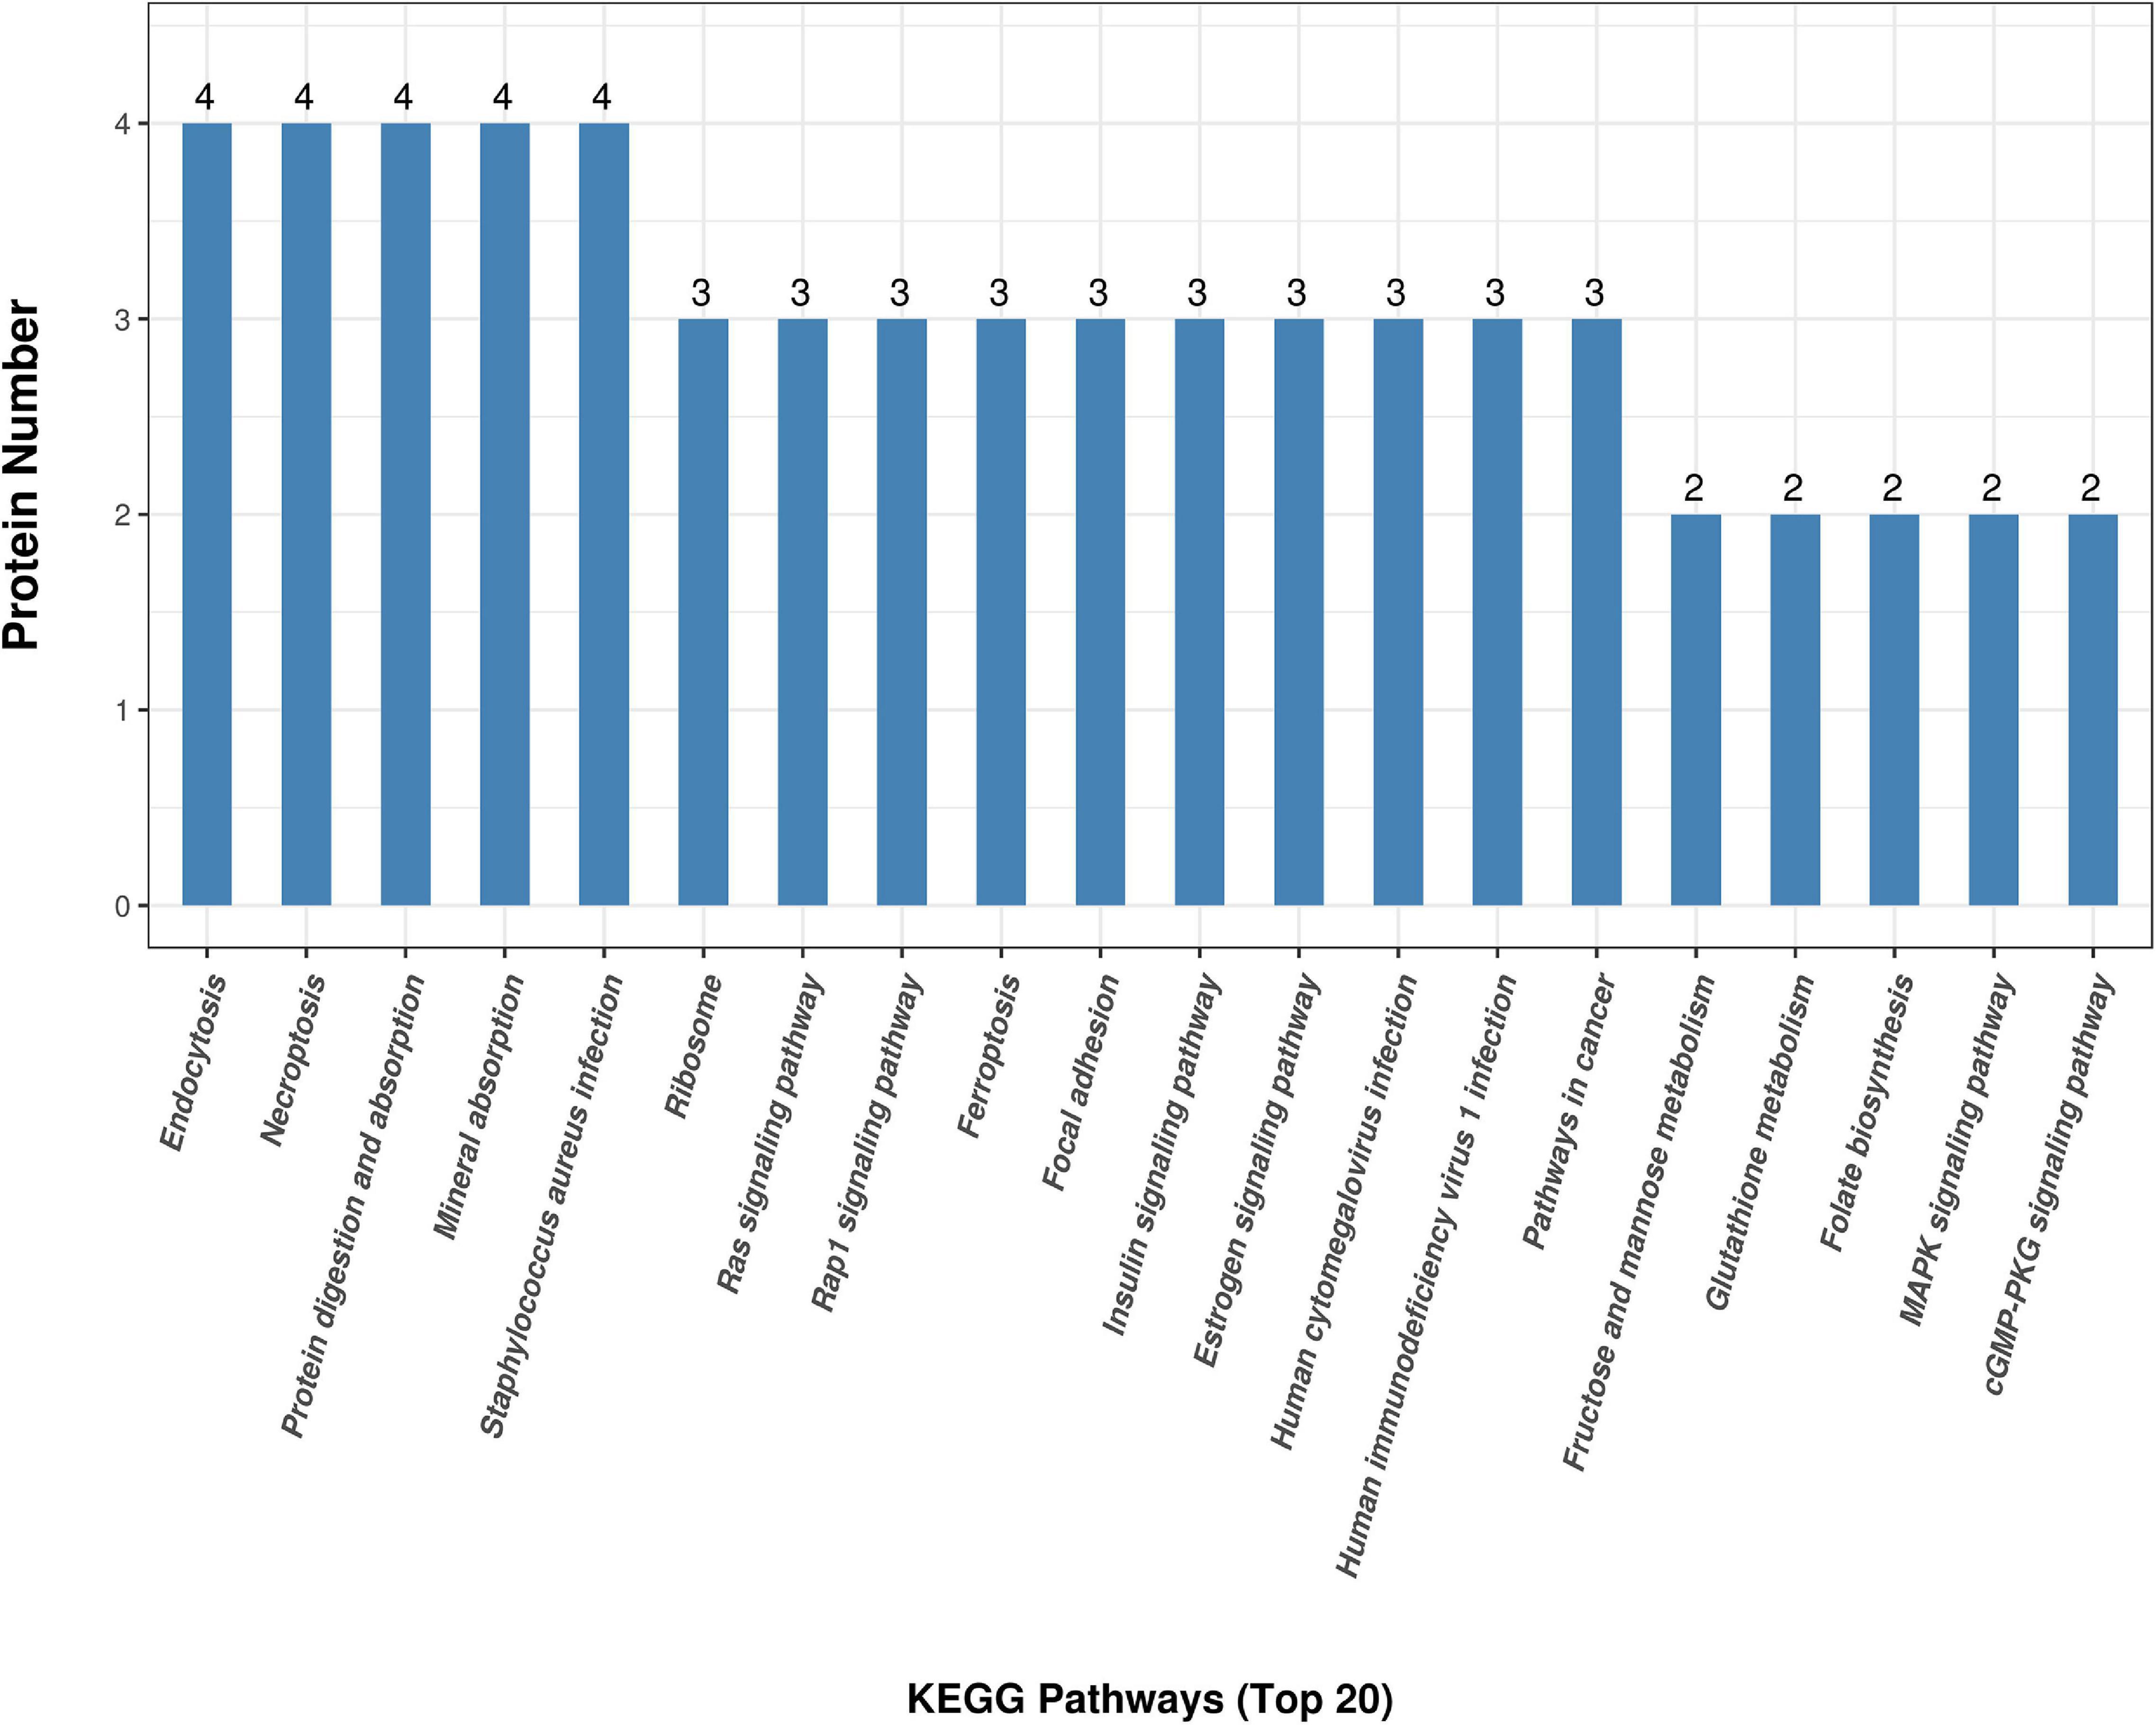
Figure 5. KEGG top 20 pathway enrichment. The x-axis demonstrates the top 20 KEGG enriched pathways. The y-axis demonstrates the number of proteins participating in the enriched pathways.
The interaction map of the differentially expressed proteins, which were enriched in a larger interaction network, is presented in Figure 6. PPI analysis suggested that the development of myopia could result from the dysfunction of multiple pathways.
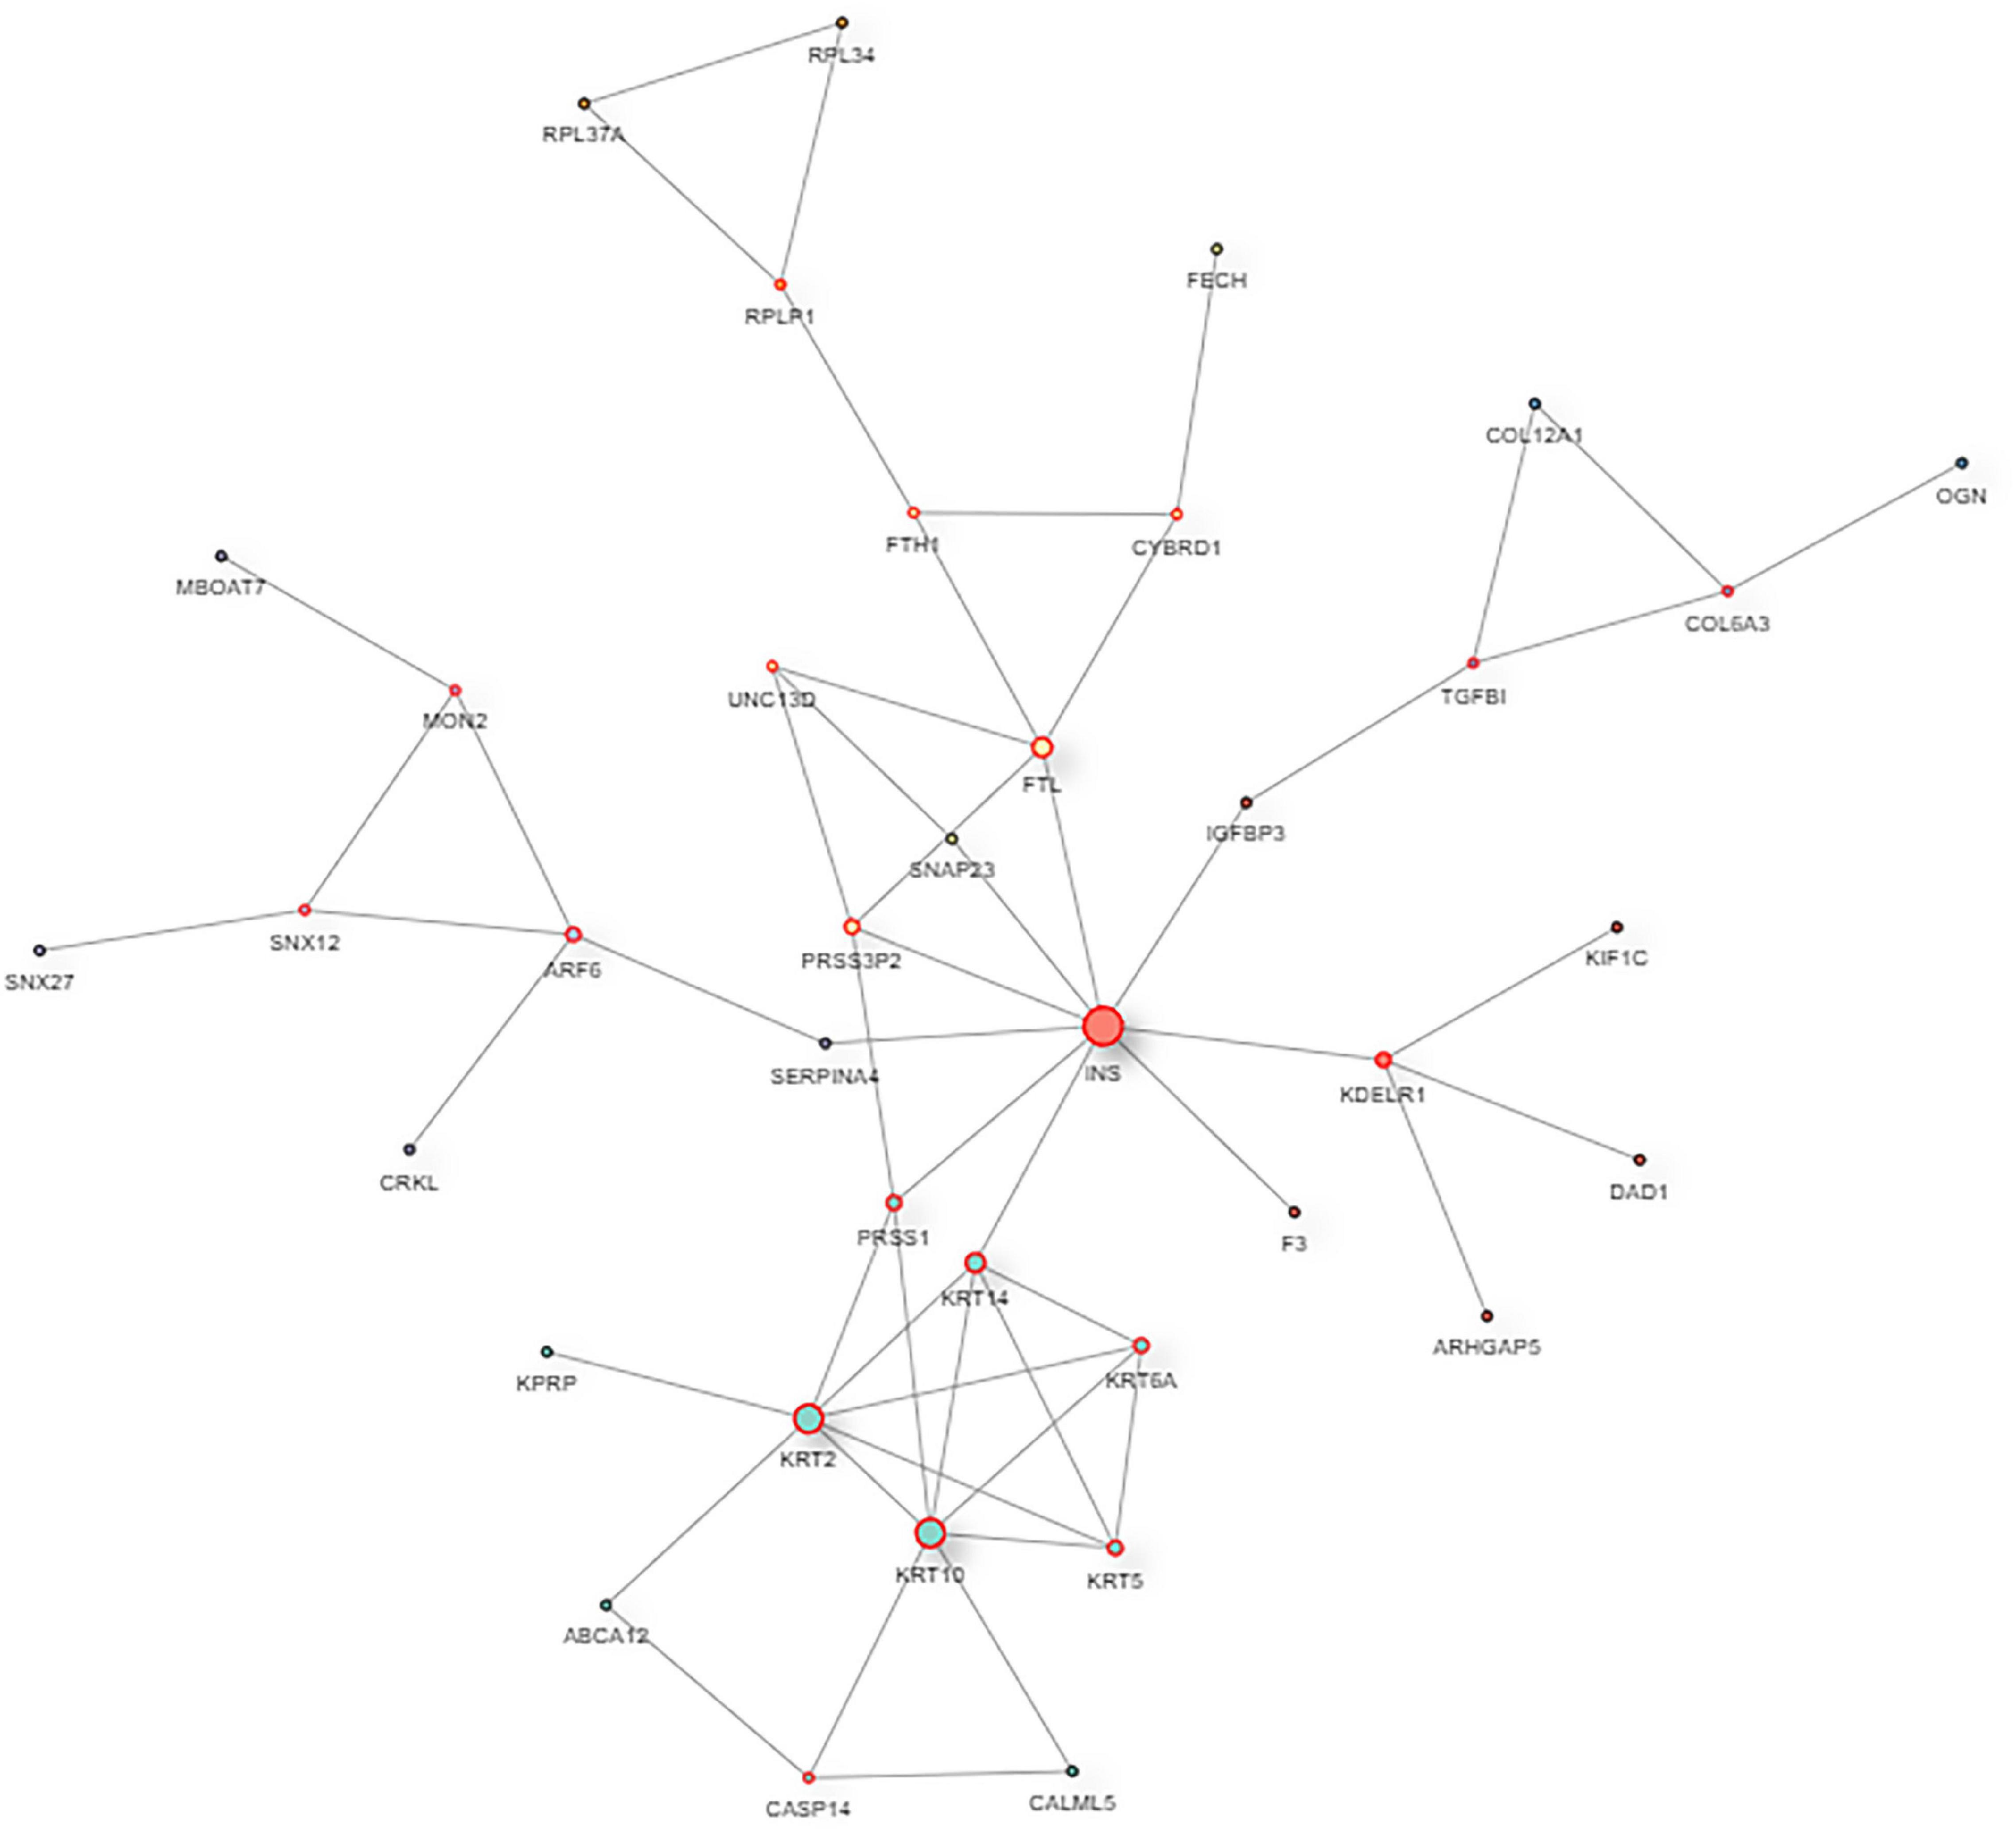
Figure 6. The protein–protein interaction network of DAPs. In the protein–protein interaction (PPI) network, the colored nodes stand for differentially altered proteins, and lines are mapped for the interactions between proteins. Larger nodes correspond to a higher degree of protein aggregation in the PPI network.
After a thorough evaluation of the GO annotation, KEGG pathway analysis, and PPI network analysis, we focused on the main GO terms “ferric iron binding” and “oxidizing metal irons” and the main KEGG pathways “mineral absorption” and “ferroptosis.” Therefore, we further selected three iron- and redox-related DAPs, including serotransferrin (TF, P02787), ferritin light chain (FTL, P02792), and ferritin heavy chain (FTH1, P02794) for validation studies using the PRM approach. TF is a major iron-uptake protein. Ferritin is a major iron-storage protein. Among the validation results, the abundance of TF was increased in the high myopia group, while FTL and FTH1 expression were both reduced in the high myopia group compared to the low myopia group (Figure 7). It could be deduced from the PRM results that the selected proteins presented semblable trends, similar to the aforementioned TMT proteomic results. Verification of the candidate DAPs confirmed the credibility of our proteomic research.
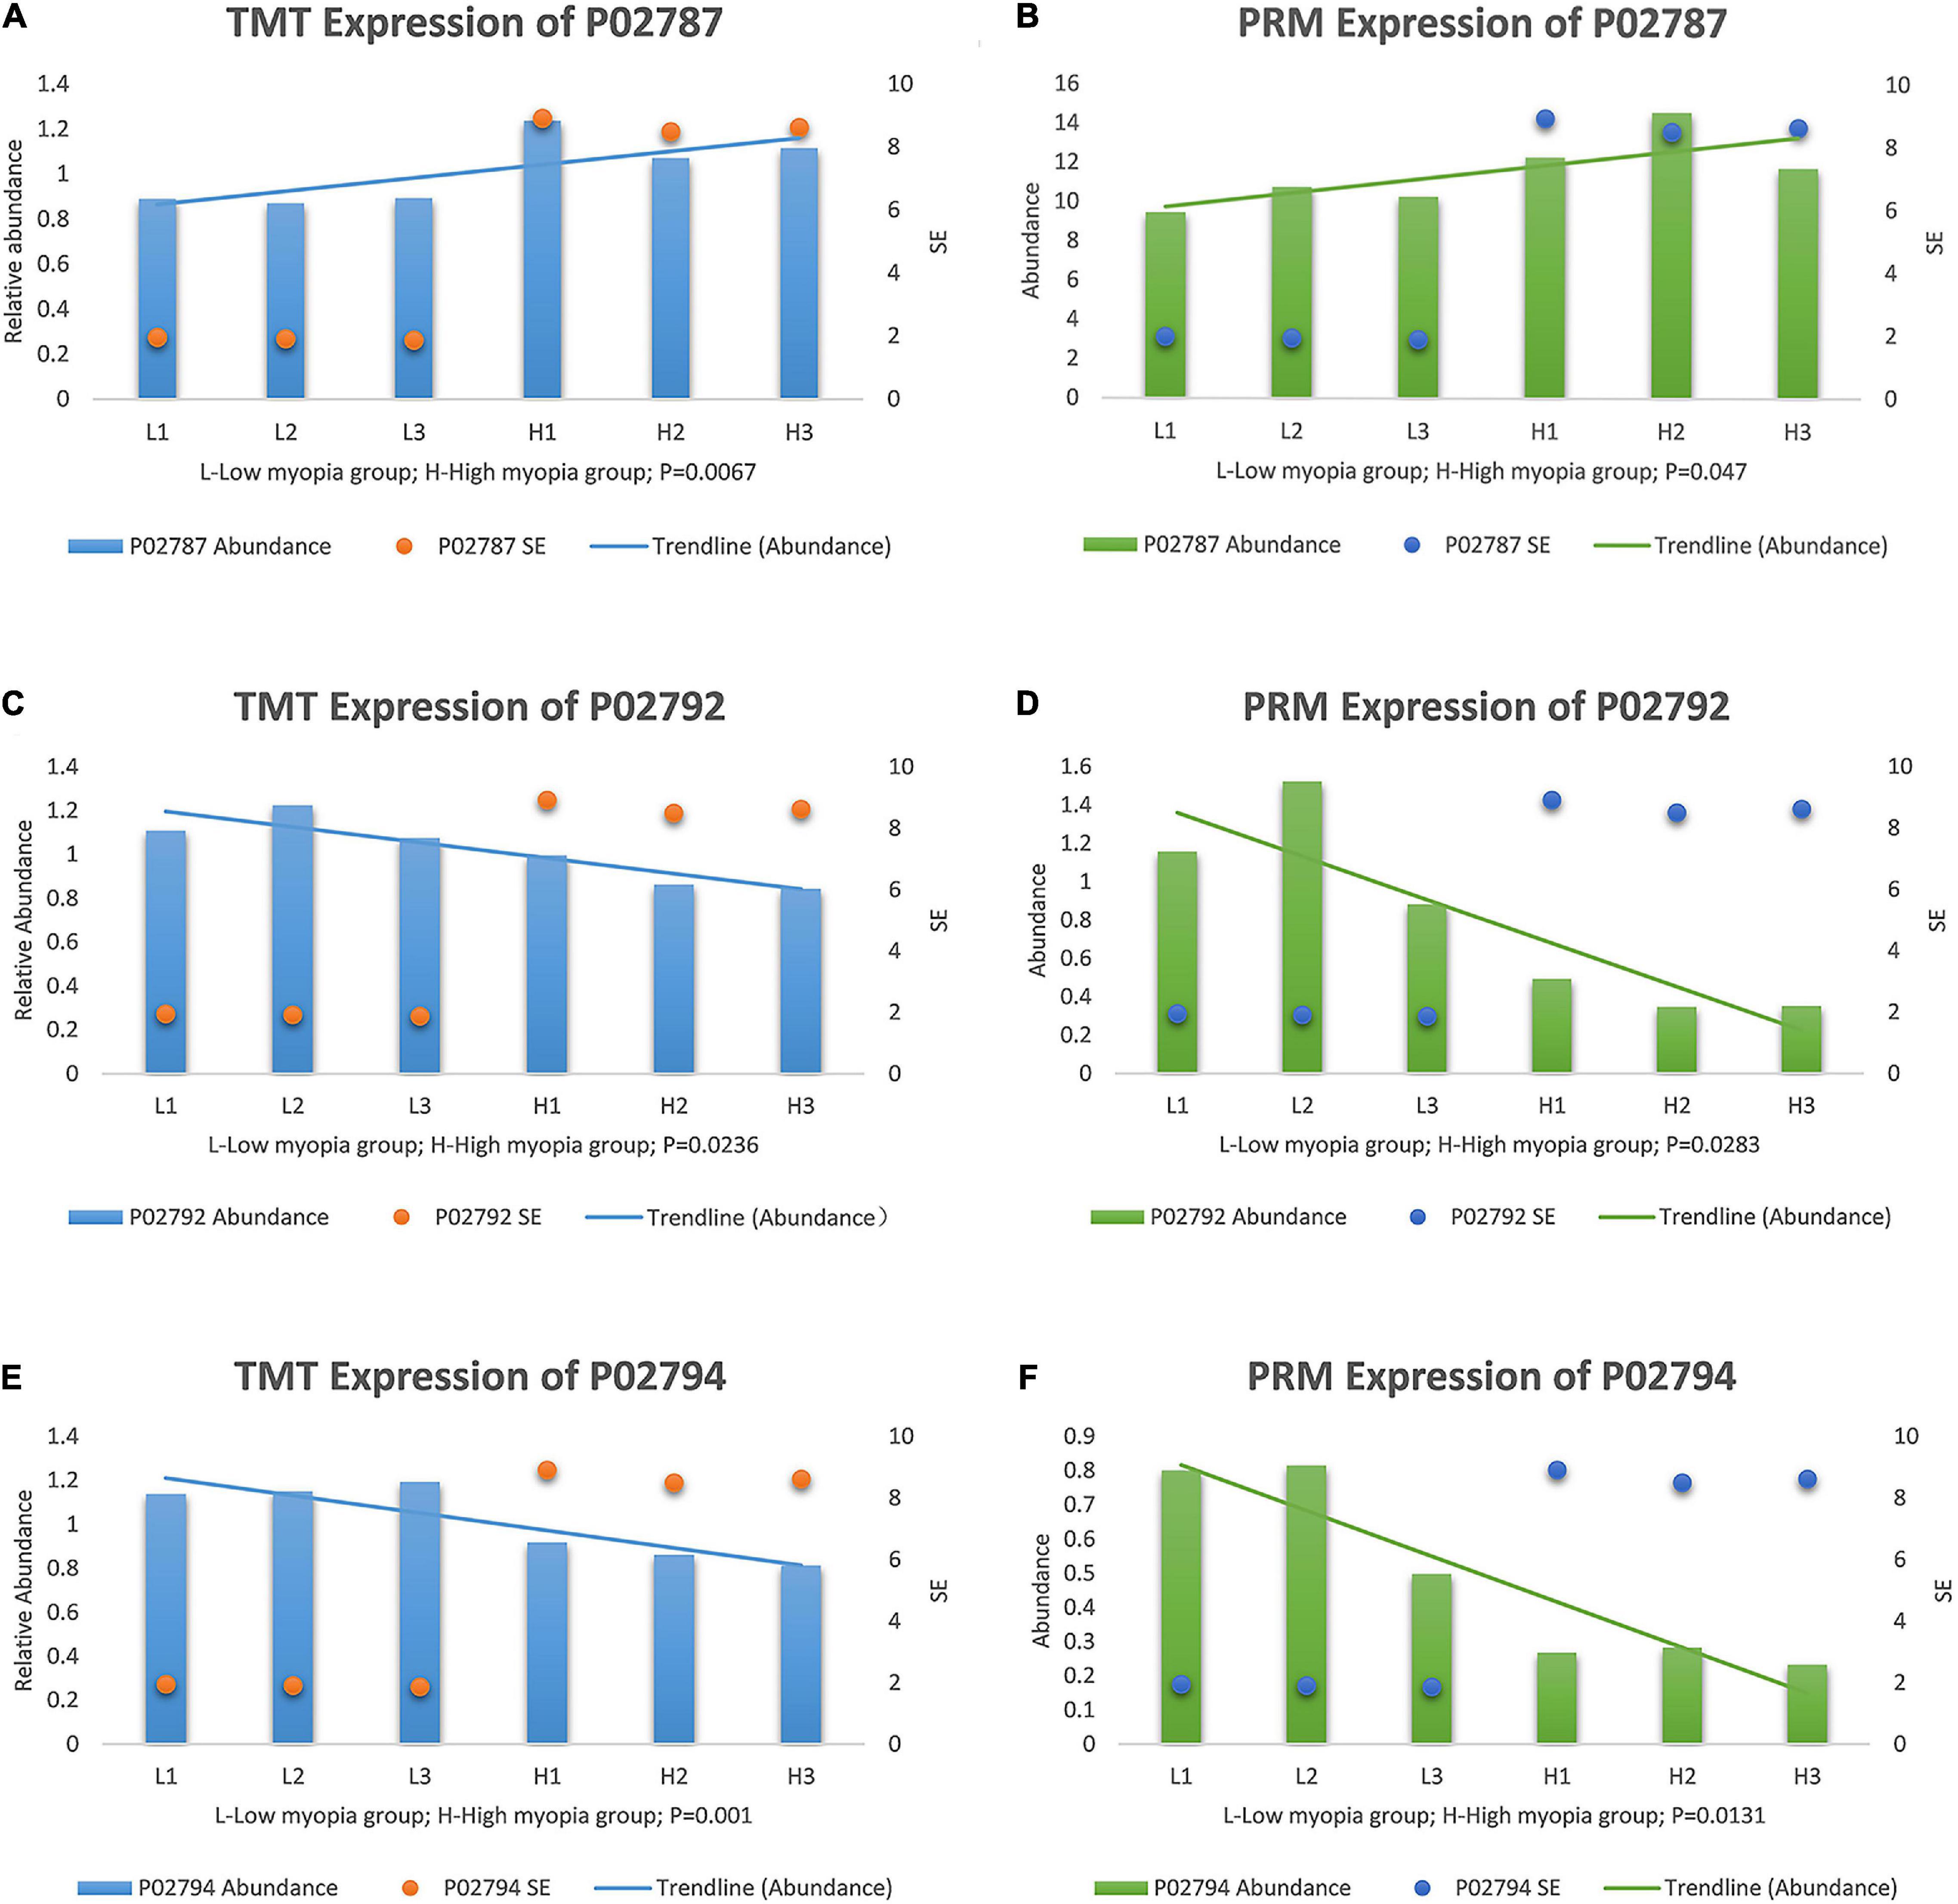
Figure 7. Expression patterns of target protein biomarker candidates using tandem mass tag (TMT) analysis and parallel reaction monitoring (PRM) validation with their expression trends compared with SE, (A) TMT expression of serotransferrin (P02787). (B) PRM expression of P02787. (C) TMT expression of ferritin light chain (P02792). (D) PRM expression of P02792. (E) TMT expression of protein ferritin heavy chain (P02794). (F) PRM expression of P02794.
The STRING and GeneMANIA online tools were further applied for the integration and prediction analysis of PPIs of the validated target proteins. The prioritized proteins—TF, FTL, and FTH1—were mapped, and an integrated predicting PPI network image was created (Figures 8–11 and Supplementary Figure 1).
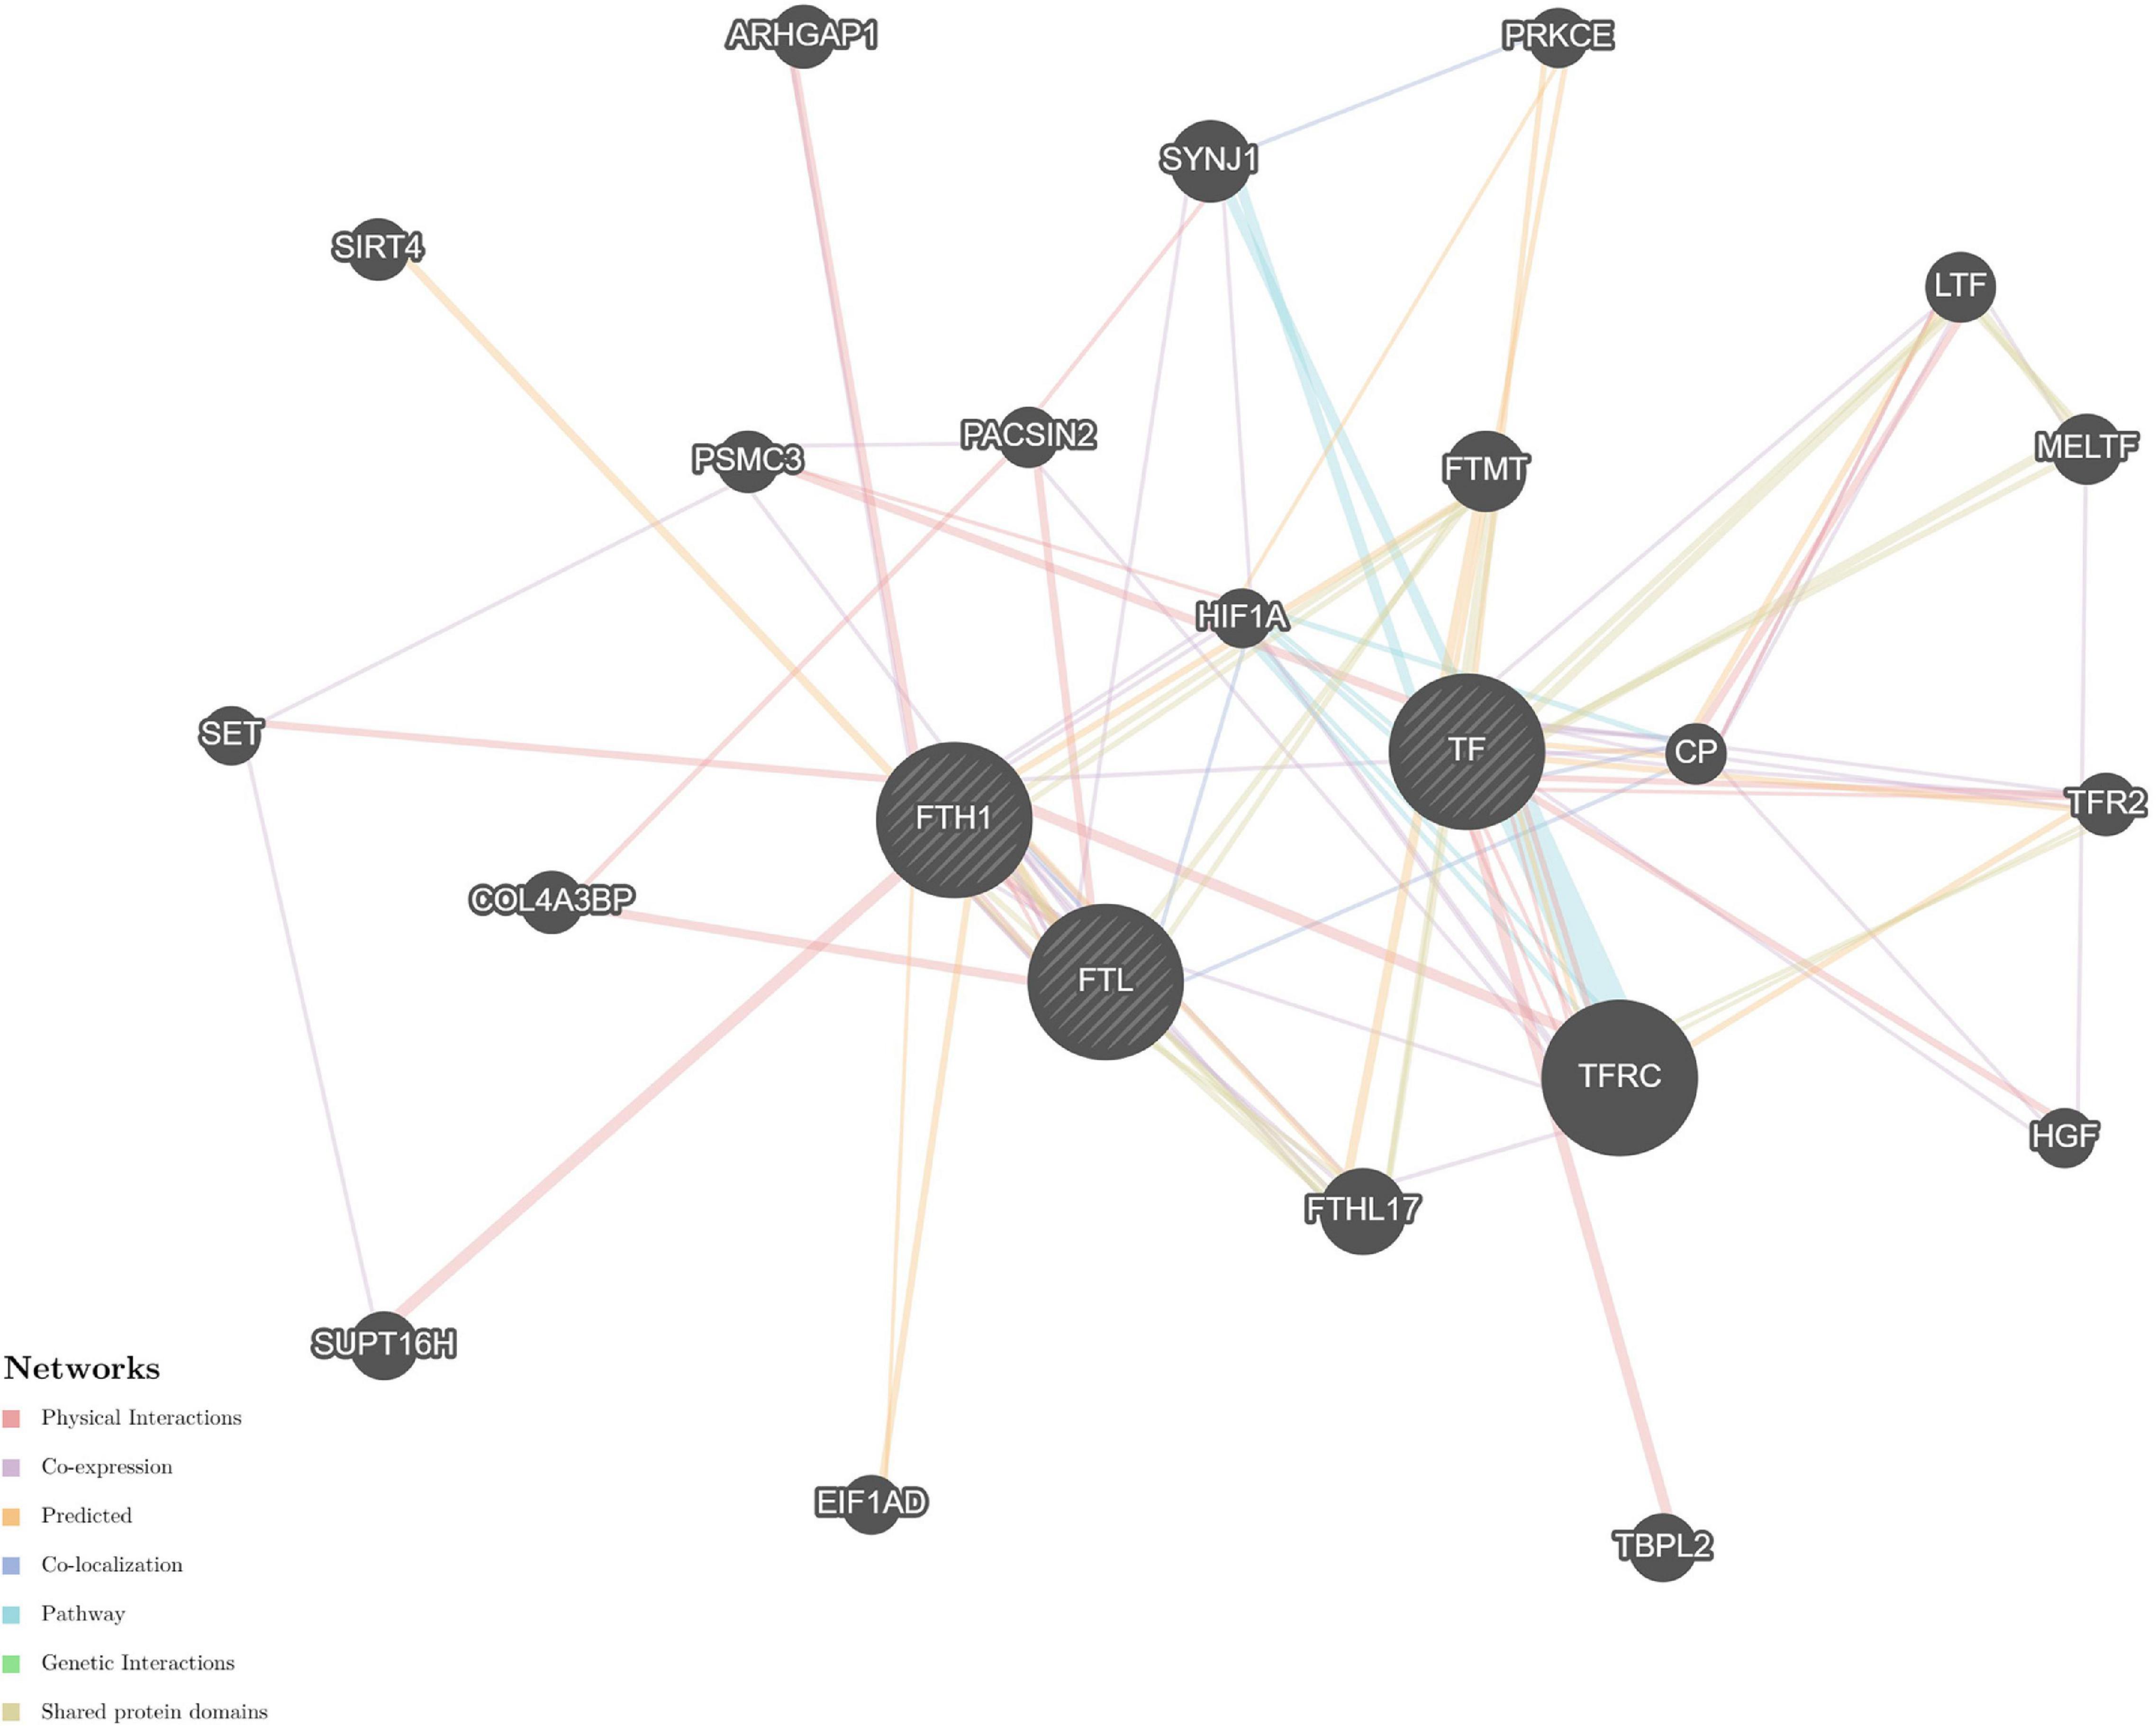
Figure 8. Predictive PPI network of the validated protein biomarker candidates: TF-FTL-FTH1. In the PPI network prediction, the nodes in the middle with bias represent the validated protein biomarkers, and lines are mapped for the interactions between proteins. Larger nodes correspond to a higher degree of protein aggregation in the PPI network, and different colors correspond to various functional networks.
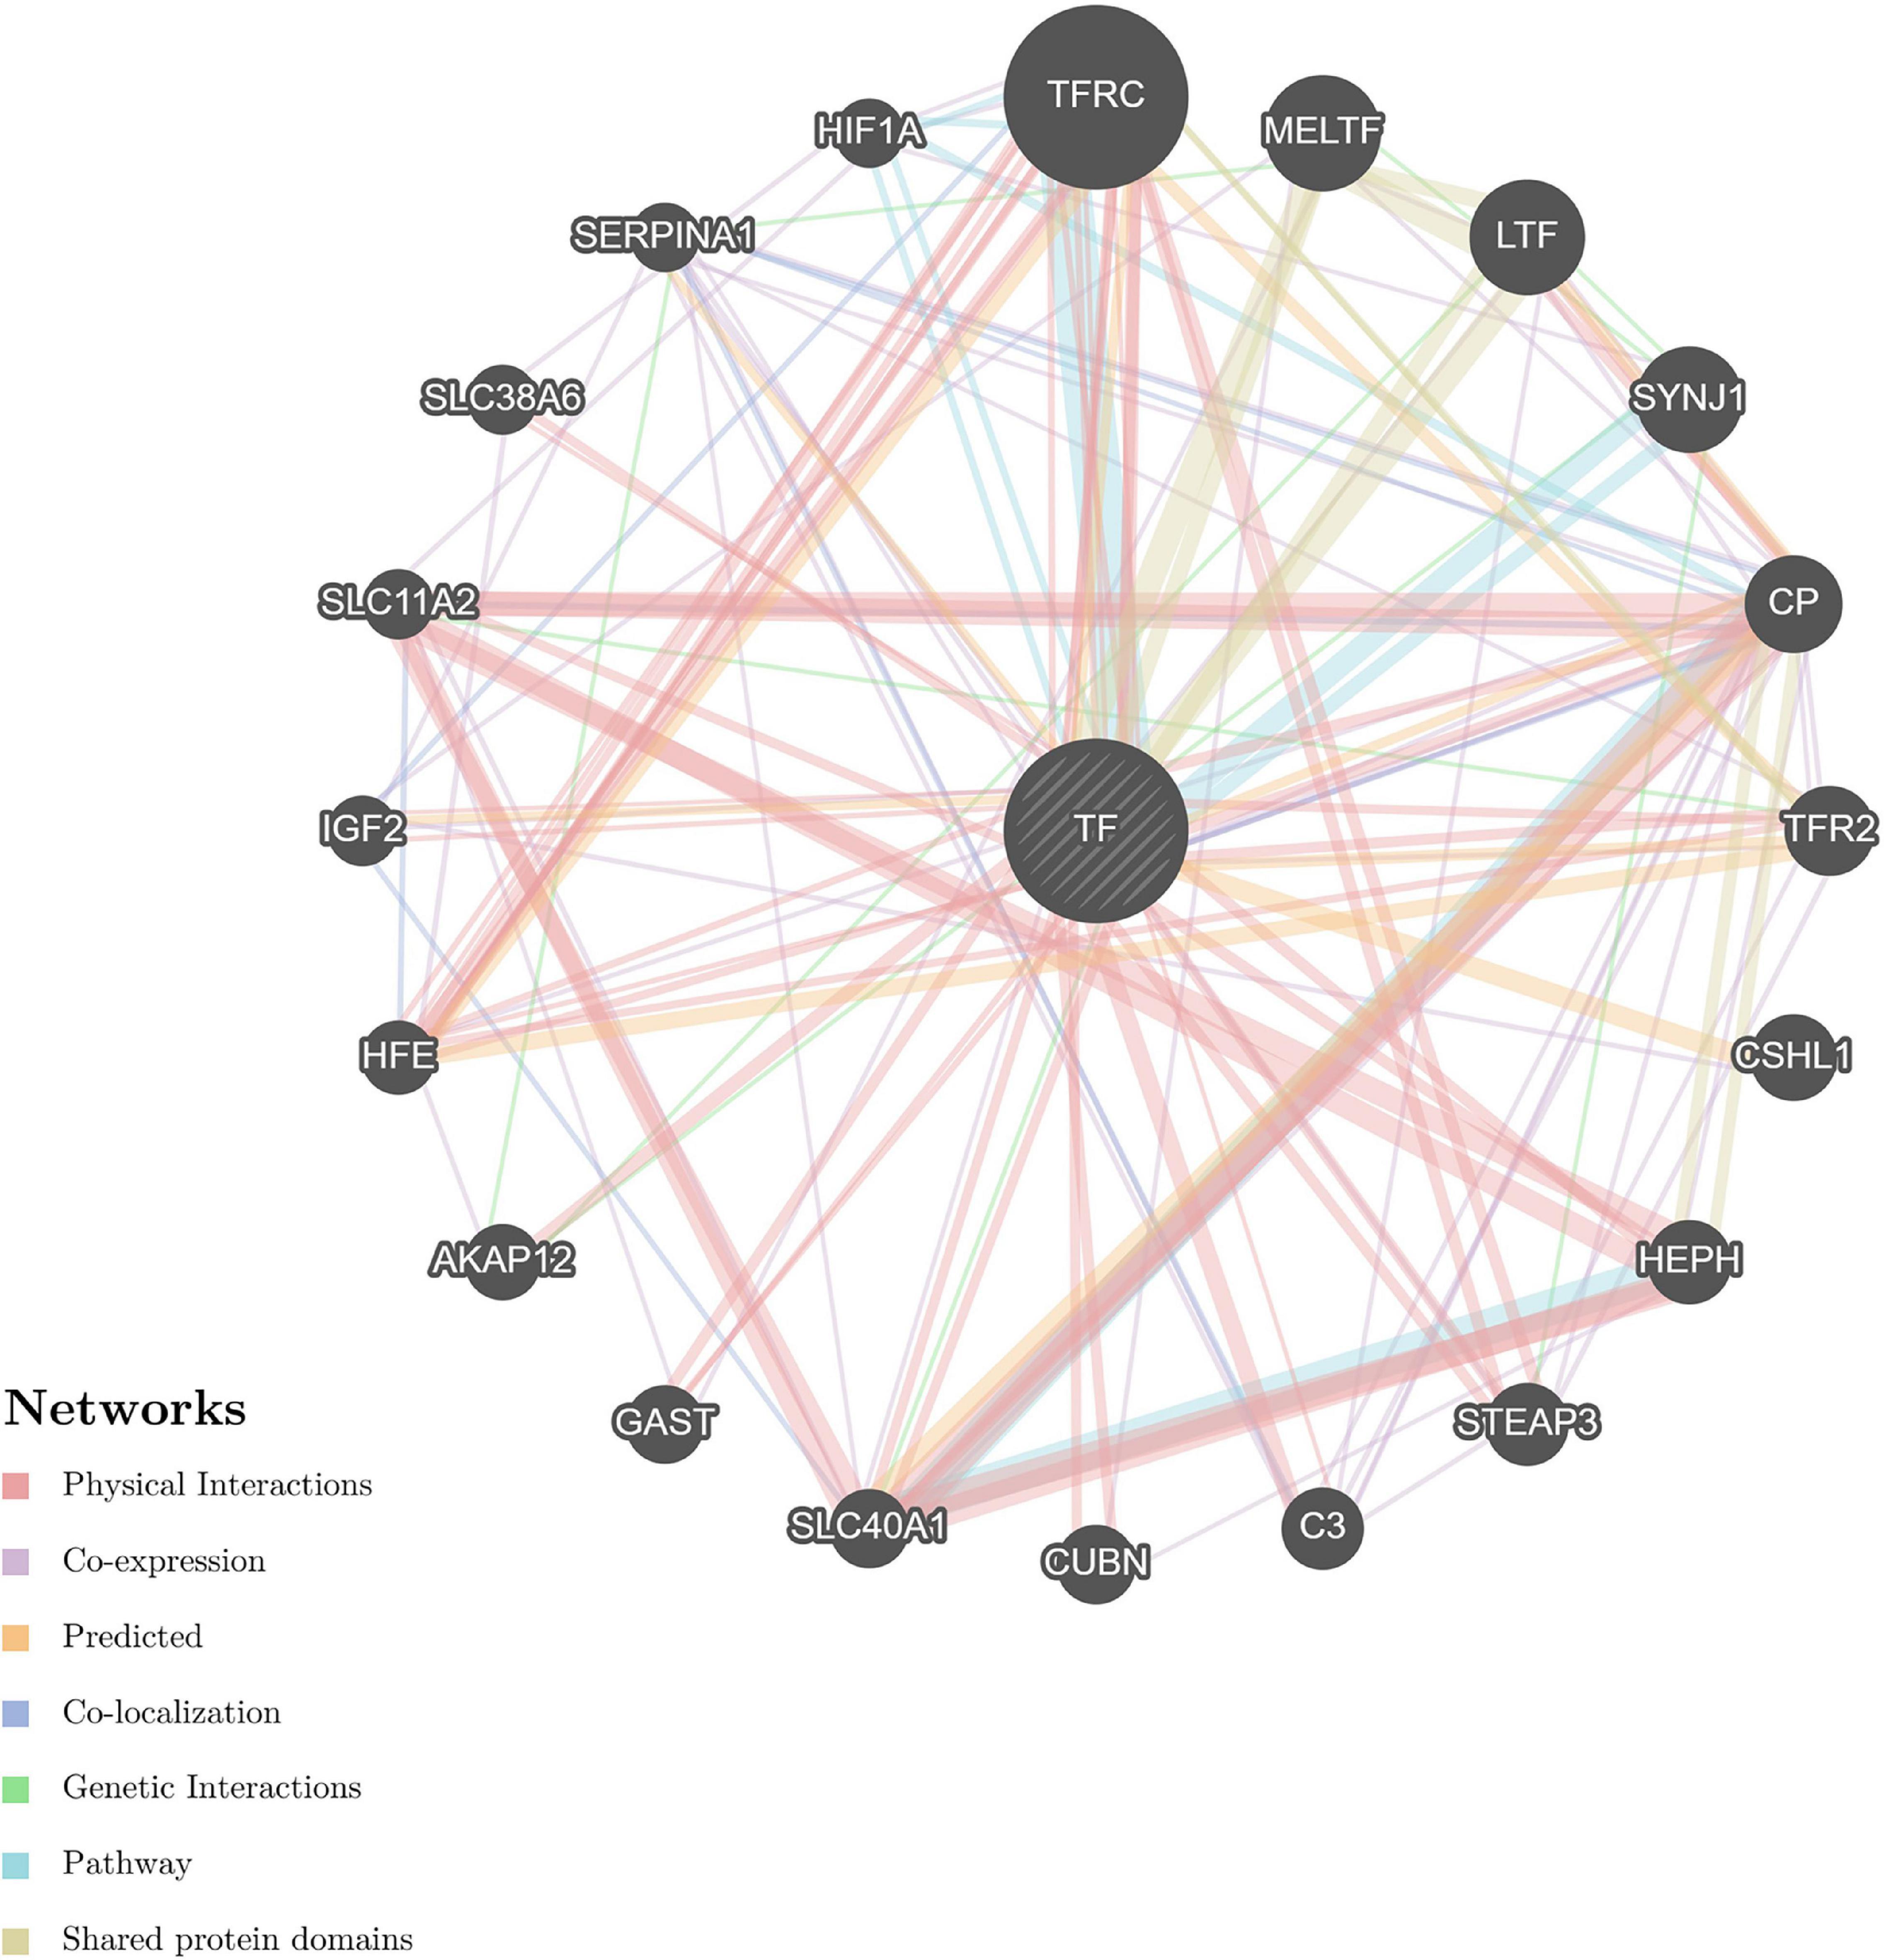
Figure 9. Predictive PPI network of the target protein biomarker candidates: TF. In the PPI network prediction, the node in the middle with bias represents the target protein biomarker, and lines are mapped for the interactions between proteins. Larger nodes correspond to a higher degree of protein aggregation in the PPI network, and different colors correspond to various functional networks.
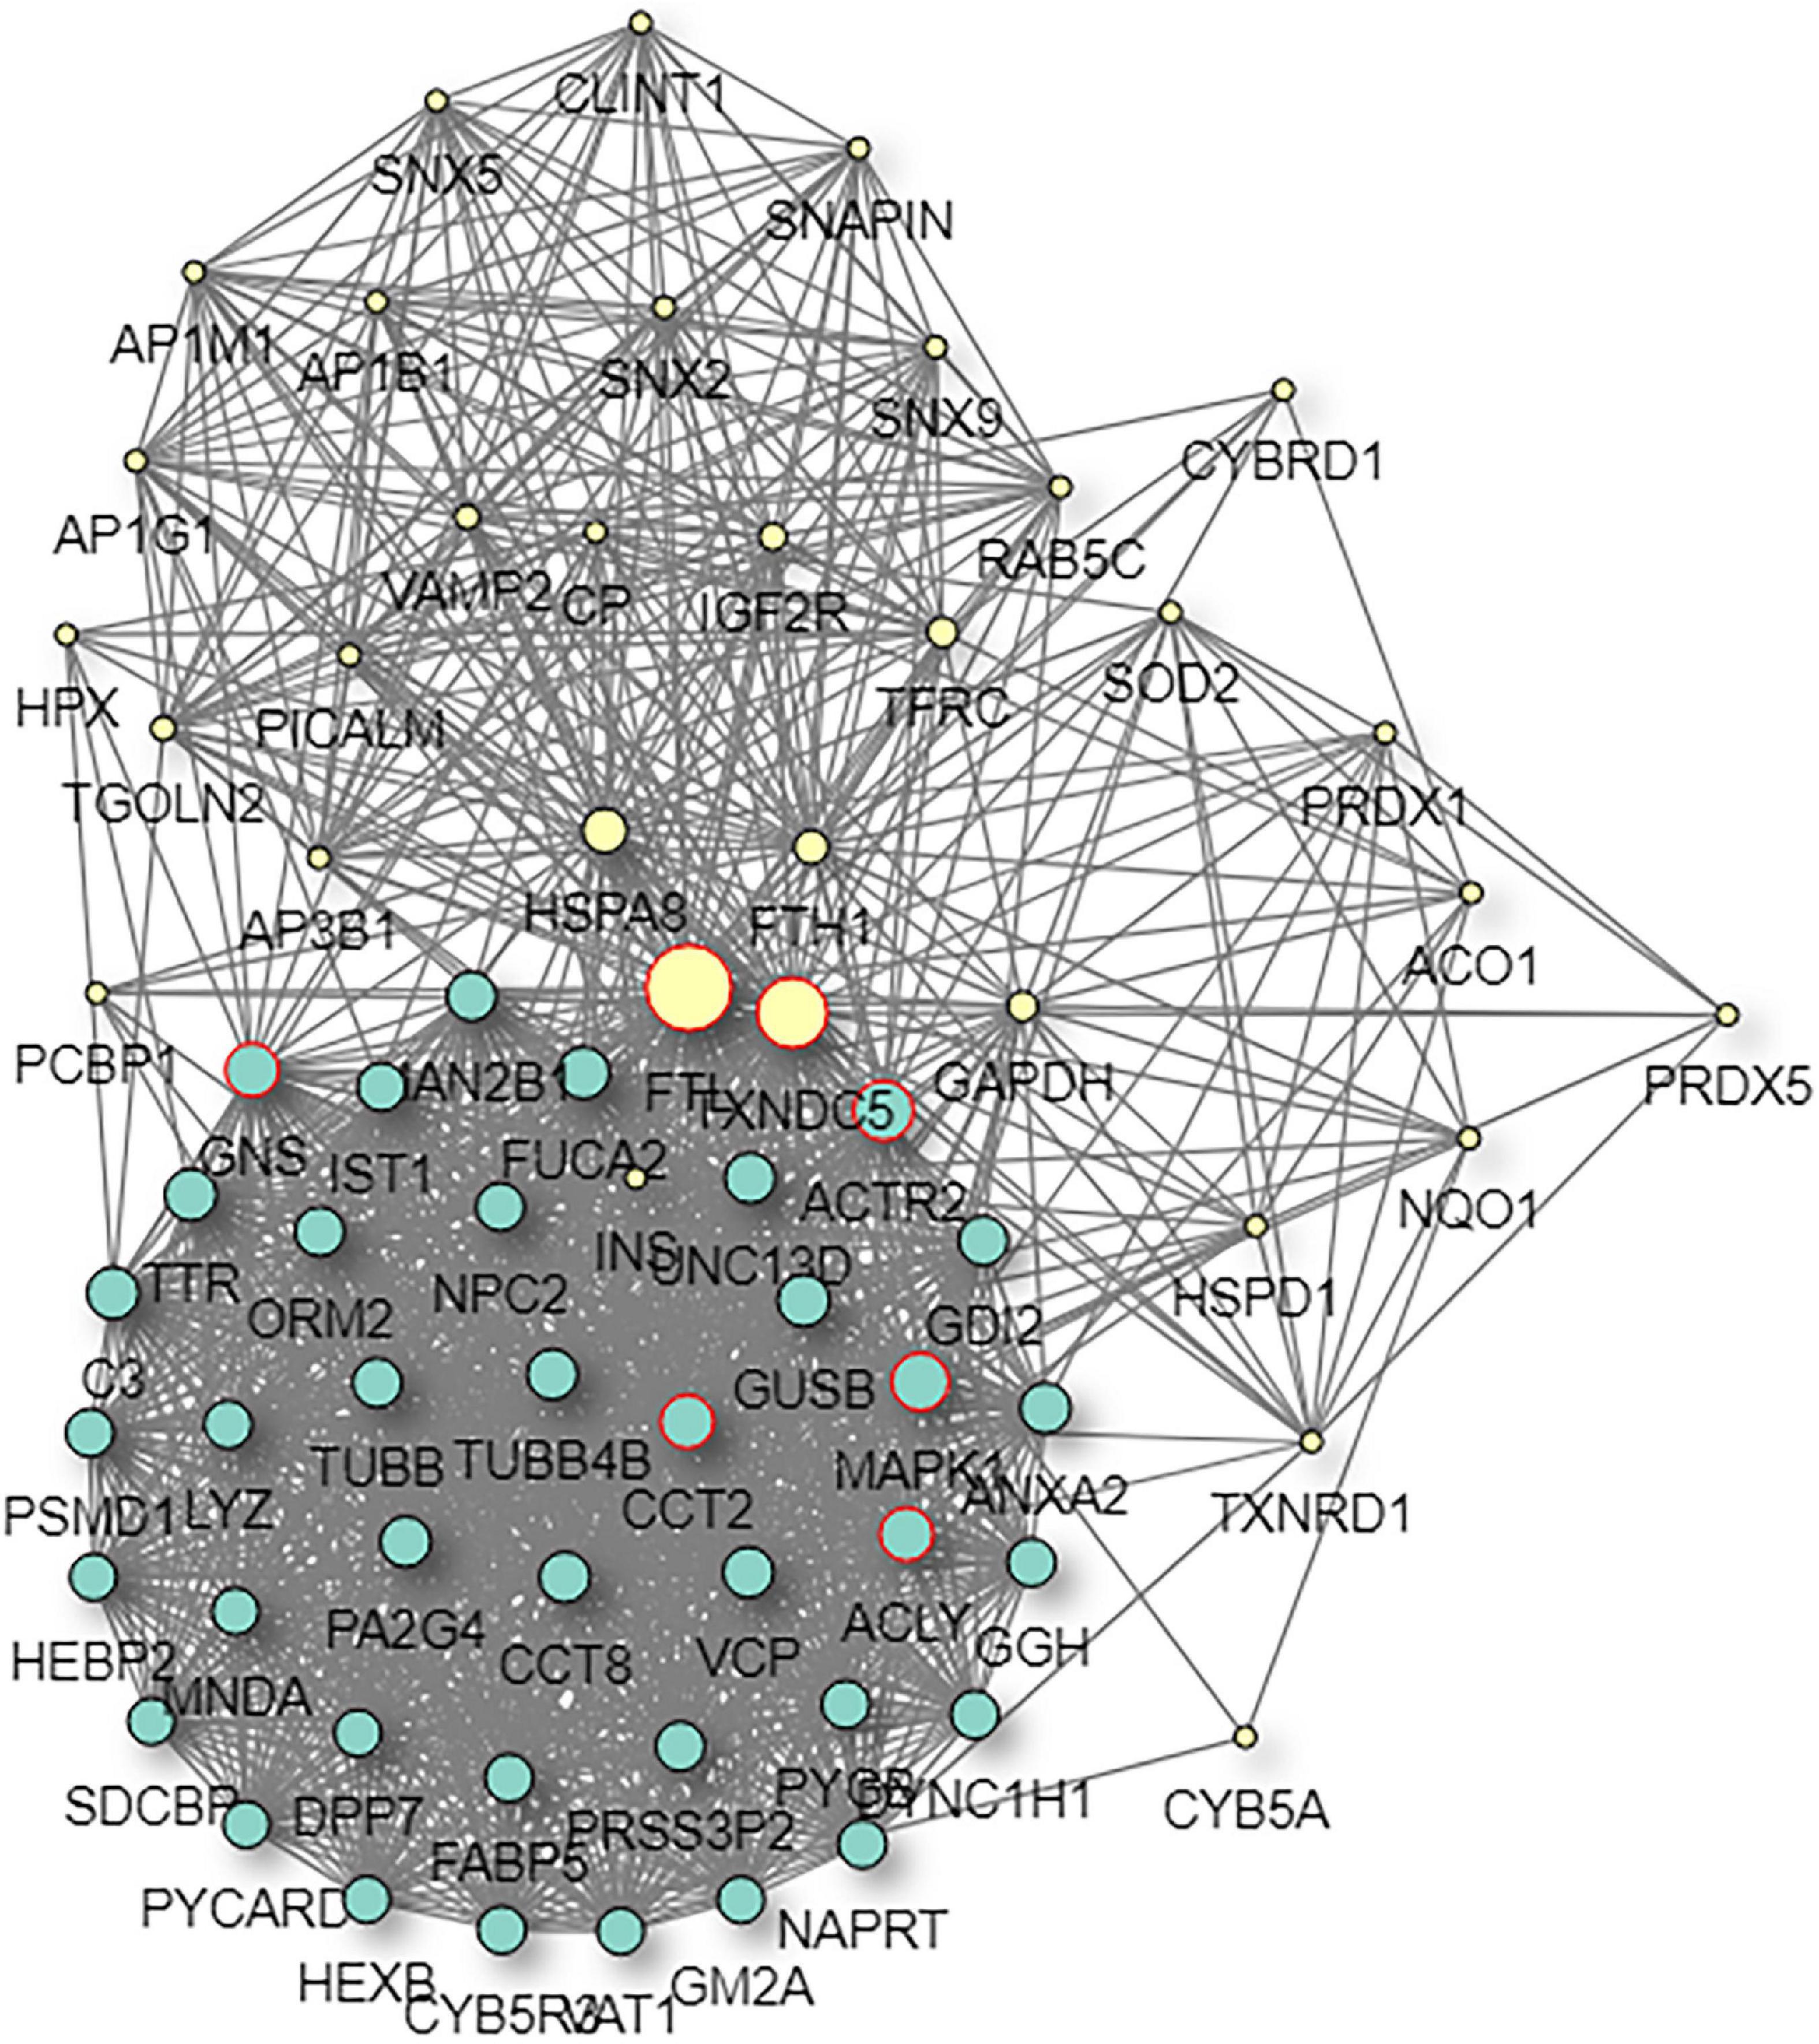
Figure 10. Predictive PPI network of the target protein biomarker candidate: FTL. In the PPI network prediction, the colored node in the middle represents the target protein biomarker, and lines are mapped for the interactions between proteins. Larger nodes correspond to a higher degree of protein aggregation in the PPI network.
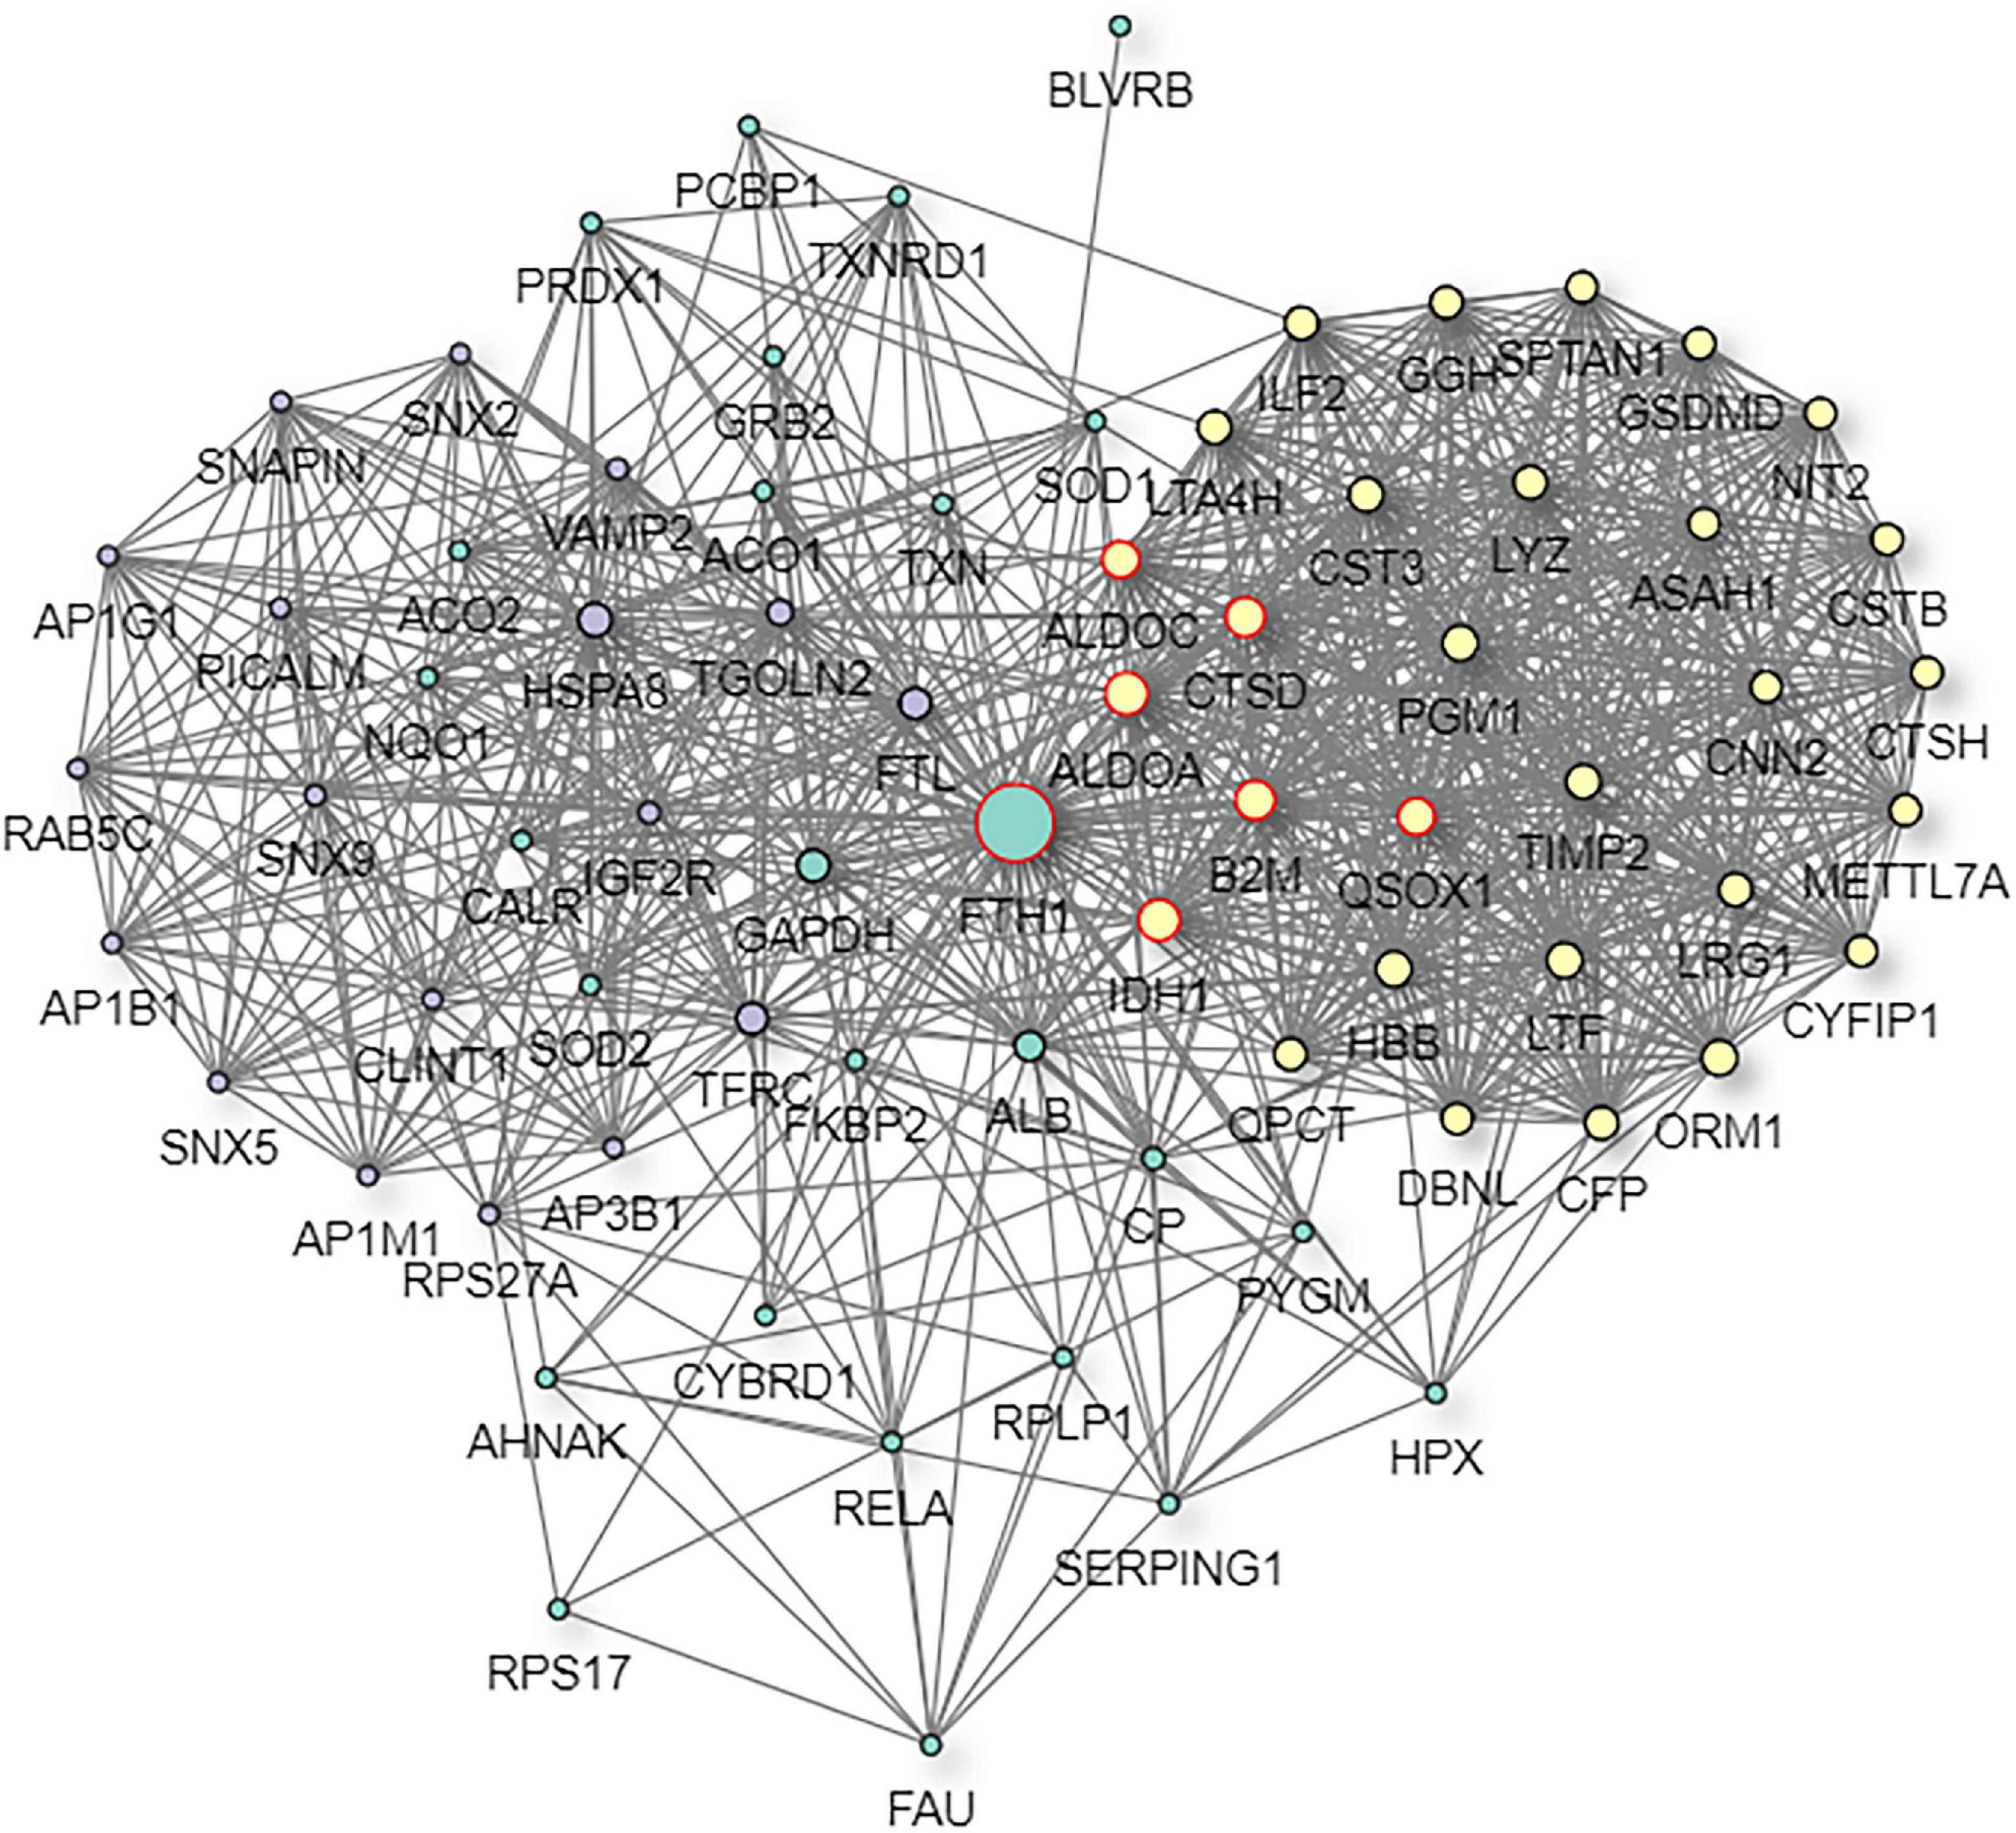
Figure 11. Predictive PPI network of the target protein biomarker candidate: FTH1. In the PPI network prediction, the colored node in the middle represents the target protein biomarker, and lines are mapped for the interactions between proteins. Larger nodes correspond to a higher degree of protein aggregation in the PPI network.
In this study, for the first time, we employed proteomic approaches to investigate the molecular characterization of the human corneal stroma in relation to myopia. The present study has uncovered the broadest human corneal stroma proteome to date, as compared with previous studies (Dyrlund et al., 2012), and discovered different proteomic signatures between low and high myopia eyes. The stroma proteome provides novel biomarker candidates and signaling pathways to further elucidate the mechanisms underlying myopia development.
The pending issue of the complex pathogenesis and lack of adequate treatment has made the prevention and control of myopia difficult. Moreover, the available approaches for differentiating low and high myopia rely primarily on ocular biometric parameters, including SE and axial length. Therefore, the identification of potential molecular patterns is essential for further understanding the mechanism and susceptibility of myopia and offer new perspectives for early diagnosis and therapeutic targets.
Generally speaking, GWAS are valuable in myopia-associated research but may not succeed in addressing a large portion of genetic variability. Analysis of gene–gene interaction networks and regulation of signaling pathways, rather than studying genes individually, has greater potential for investigating related phenotypes (Lauwen et al., 2017). In the past decade, human proteomic studies have played an essential role in discerning the molecular mechanisms involved in the diagnosis and treatment of different diseases. The high stringency human proteome analysis developed targeted proteomic assays for the investigation of key proteins and signaling pathways (Adhikari et al., 2020). The novel tandem MS methods and PRM assays could permit the identification of peptides from various samples simultaneously according to their relative abundance with better performance, higher sensitivity, and greater accuracy than other proteomic methods (Thompson et al., 2003; Stergachis et al., 2011).
The DAP profiles and functional enrichment analyses of our study revealed novel iron metabolism features of myopic eyes, with implications for corneal reactive oxygen species (ROS) acceleration. The main GO annotations implicated the major biological processes “metabolic process” and “cellular iron ion homeostasis,” remarkable molecular functions of “ferric iron binding” and “ferroxidase activity,” and an outstanding cellular component of “ferric complex” (Figures 3A–C). The KEGG pathways were mainly enriched to “mineral absorption” and “ferroptosis” (Figure 3D). Furthermore, the three selected proteins (TF, FTL, and FTH1) associated with iron metabolism and oxidative stress exhibited a similar gradient between the TMT and PRM quantitative results.
Proteins play a significant role in ocular metabolism. The distribution of iron and iron homeostasis proteins in the rodent retina has been reported previously (Yefimova et al., 2000). Iron is an essential biometal and a principal source of nutrients for the eye. Previous studies characterized circulating iron and associated homeostasis proteins, such as ferritin and TF, in various ocular tissues, including the cornea (Linsenmayer et al., 2005), aqueous humor (Yu and Okamura, 1988), and lens (Harned et al., 2006).
TFs are iron-binding transport proteins responsible for heme absorption and utilization. TF binds two Fe3+ ions together with an anion, most commonly bicarbonate. They are growth factors required for all cells and play a central role in stimulating cell proliferation (Fulcher et al., 1988). It has been demonstrated that proliferating cells are capable of expressing TF receptors with enhanced density, making them preferential targets for the inhibition of malignant cells (Trowbridge and Domingo, 1981). The GO-biological process annotation implicates its role in cellular protein metabolic and iron homeostasis processes. To the best of our knowledge, this is the first study to illustrate the role of TF in human myopia, which, as an eye disorder, could present with hyperproliferative features. A previous animal quantitative proteomic analysis reported a remarkable upregulation of ovotransferrin, which belongs to the transferrin family in myopic chick vitreous. Ovotransferrin could function as an antioxidant in tissues, and its upregulation in the vitreous chamber indicates increased oxidative stress along with axial elongation (Yu et al., 2017). Future investigation of the mechanism of TF and TF receptors in corneal and other ocular cell divisions could offer further avenues for the study of proliferative conditions in myopic eyes.
Cellular iron is stored as cytosolic ferritin. Ferritins sequester intracellular iron in an innoxious and readily soluble form, which is vital for iron homeostasis. A ferritin molecule can hold up to 4,500 ferric-state iron molecules in its center core (Aisen et al., 2001). Iron is ingested in the ferrous form and deposited after oxidation as ferric hydroxides. Human ferritins consist of two types of ferritin subunits: H chain for heavy or heart and L chain for light or liver. A previous proteomic study by Karring et al. (2005) identified the presence of ferritin subunits in the human corneal epithelium. Free iron has the ability to catalyze ultraviolet-induced oxidation reactions via the Fenton reaction. FTH1 is a ferroxidase, and its increase is believed to reduce intracellular free iron oxidation levels and improve cellular resistance against oxidative stress. In contrast, FTL shares 50% identity with the FTH1 at the amino acid level. The light chain lacks the ferroxidase feature of the heavy chain but can facilitate iron cooperation within the ferritin cavity (Cozzi et al., 2000).
The intracellular iron status is registered by iron-regulatory proteins (IRPs). Regarding the status of intracellular iron deficiency, IRPs would bind to iron-responsive elements (IREs), which are present on the mRNAs of the regulated proteins. The IRE of ferritin lies on the 5′- terminal of ferritin mRNAs, and its binding with IRPs could efficiently obstruct the steric translation of ferritin, thereby inducing iron deficiency with insufficient ferritin levels. Reciprocally, the connection of IRPs with the IREs of transferrin and receptors, which lie on the 3′-portion of the mRNAs, would restrain the process of mRNA degradation, resulting in an increase in transferrin in iron deficiency (Rouault, 2002). In our proteomic study, the expression levels of FTL and FTH1 were both decreased in the high myopia group, while the TF abundance was increased in the high myopia group compared to the low myopia group, indicating the potential impact of iron deficiency on the progression of myopia.
Previous attempts to investigate ferritin metabolism in the cornea have been conducted in avian corneal epithelial cells, where FTH1 was observed to function as a developmentally regulated nuclear protein, although ferritin is one of the cytoplasmic components in most cells. The study revealed the similarity between the structure and biological properties of nuclear and cytoplasmic ferritin. Considering that corneal epithelial cells can be constantly exposed to ultraviolet light, nuclear ferritin is speculated to promote iron sequestration and prevent oxidative damage to cell DNA (Linsenmayer et al., 2005). Iron has been implicated in a wide range of ophthalmic disorders, such as cataracts, glaucoma, macular degeneration, and intraocular hemorrhage. However, the underlying correlation with myopia was underestimated. The derived PPI networks involved in iron metabolism are intriguing (Figures 8–11 and Supplementary Figure 1). Transferrin and ferritins are circulation proteins and are also considered essential cofactors in the integration of dopamine, neurotransmitters, and norepinephrine (He et al., 2007). Their alterations could suggest an environmental impact on the ocular surface and would in turn represent circulating features shown in the cornea.
Iron is crucial for various metabolic processes but can also cause oxidative stress by functioning as a reactive free radical. Iron ions are redox-active metals that can catalyze the production of OH– from H2O2 (He et al., 2007). Oxidative stress can cause oxidative damage, resulting from the disequilibrium between free radical production and antioxidant defenses, which implicates the interaction of multiple molecular species. Oxidative stress has been described in previous reports of retinal and macular diseases with retinal pigment epithelium or choroidal atrophy. The cornea consumes oxygen mainly from oxygen in the air, and daily light exposure may have an impact on the cornea. Either of these processes could well generate ROS in the cornea (Francisco et al., 2015), which may induce DNA cleavage, protein alterations, and deleterious peroxidation of lipids. Hypoxia has been associated with various ophthalmic conditions caused by oxidative damage. This could be one of the key targets for myopia study since oxidative circumstances exist chronically (Wu et al., 2018).
Oxidative stress has been implicated in different ocular tissues in myopic eyes, such as the retina and sclera, which can explain the complex signaling pathways involved in the regulation of myopia, particularly the hypoxia-inducible factor-1 alpha (HIF-1α) signaling pathway. The TF gene was implicated in the HIF-1α signaling pathway according to a previous PPI network analysis (Wu et al., 2018). Hypoxia results in imbalanced cellular prooxidants and antioxidants via oxidative stress or ROS accumulation, which is a key mechanism of cytotoxicity (Junk et al., 2002). Oxidative stress leads to higher levels of HIF-1α, a subunit of the heterodimeric basic helix–loop–helix-structured HIF-1. HIF-1α protein is generally undetectable in well-oxygenated cells as it degrades rapidly. Under conditions of normoxia, prolyl hydroxylation is processed at its highly conserved prolyl residues by members of the prolyl hydroxylase domain family (PHD). Prolyl hydroxylases demand Fe2+, O2, ascorbate, and oxoglutarate for catalytic activity, and when HIF-1α is overexpressed, hydroxylation takes place and polyubiquitylation induces proteasomal degradation. PHD proteins belong to the Fe2+-dependent oxygenase superfamily. Conversely, the HIF-1α hydroxylation rate is suppressed under hypoxic conditions (Kaelin and Ratcliffe, 2008). Furthermore, the involvement of oxidative stress could implicate the process of chronic inflammation, leading to ocular tissue dysfunction during the progression of myopia.
Iron-associated corneal abnormalities are clinically manifest as corneal iron deposition. Investigations into such abnormalities have hitherto been conducted in physiological and pathological conditions (Yeung et al., 2006). Hudson–Stahli lines are typical in aging corneas, and a Fleischer ring is often suggestive of keratoconus (Gass, 1964). Other pathological conditions include a postoperative paracentral ring (Mannis, 1983) or central spot (Seiler and Holschbach, 1993) following ablative refractive surgery, and a fitting curve ring is observed in orthokeratology (Liang et al., 2003). The pathogenesis of corneal iron deposition has been an issue of major debate in recent decades. Both the epithelium basal cell migration theory and the combination theory of tear desiccation and senescent basal cell mechanism have been proposed (Assil et al., 1993). Previous observations have suggested that iron deposition is consistent with the area of greatest epithelial hyperplasia, which is promoted by basal cell mitosis and migration (Yeung et al., 2006).
Keratoectasia is considered the most devastating postoperative complication after ablative refractive surgeries because it causes severe vision loss. Fleisher’s ring is a typical sign of keratoconus, which represents corneal iron deposition in the epithelial basement membrane. Free iron in tissue can cause oxidative damage via Fenton and Haber-Weiss reactions that transfer hydrogen peroxide to free radicals. Ferritin expression is controlled by erythroid-derived 2. Ferritins block peroxide free radical formation and control the expression of nicotinamide adenine dinucleotide phosphate [NAD(P)H]: quinone oxidoreductase 1, which inhibits free radical formation by quinone redox cycling (Nioi and Hayes, 2004). Ferritin sequesters free iron, and the downregulated ferritin expression reported in corneas with keratoconus could explain the phenomenon of iron accumulation. Ferritins can protect cellular DNA from oxidative stress caused by free radicals or ultraviolet light (Joseph et al., 2011). The decrease in ferritin levels in the corneal stroma of myopic eyes implies reduced protective effects of the cornea and further increased oxidative damage in the cornea. Previous studies have implicated oxidative damage, metabolic malfunction, and increased cell death of corneal stromal keratocytes in keratoconus (Foster et al., 2014). The discovery of the associations among oxidative stress, alteration of iron metabolism, and myopia may offer further solutions for the identification of patients with potential keratectasia.
After reviewing a wealth of literature, we discovered potential clues between iron uptake and myopia. García-Casal and Leets (2014) investigated ferritin synthesis by Caco-2 cells and found that carotenoids—lycopene, lutein, and zeaxanthin—rather than vitamin A, could improve iron uptake from ferrous fumarate and NaFe-EDTA. Lutein is a major xanthophyll carotenoid found in the human retina at preferentially high concentrations. Various studies have reported its antioxidative and anti-inflammatory properties related to different ocular disorders, indicating a protective effect against oxidative and inflammatory diseases such as diabetic retinopathy, retinopathy of prematurity, and myopia. Furthermore, a significant inverse association was found between axial length and macular pigment levels in the Chinese adult population, including lutein and zeaxanthin (Li et al., 2020).
Collectively, our study identified novel corneal protein biomarker candidates in high-myopia eyes, discovering different proteomic profiles between low and high myopia. The results further demonstrate that disturbances in iron homeostasis could be closely implicated in myopia development, and accelerated corneal oxidative stress was induced in the more myopic eyes. The final identification of rigorous biomarkers for high myopia requires further biological and functional experiments, as well as clinical studies. The key protein biomarker candidates identified and hallmark signaling pathways enriched in the study are under investigation to further determine their specific roles in the pathogenesis and development of myopia. Iron metabolism and associated proteins might serve as potential diagnostic or predictive biomarker candidates for high myopia and other conditions characterized by ocular oxidative damage.
The mass spectrometry proteomics data have been deposited to the ProteomeXchange Consortium via the PRIDE (Perez-Riverol et al., 2019) partner repository with the dataset identifier PXD025145.
The studies involving human participants were reviewed and approved by the Ethical Committee of Nankai University. The patients/participants provided their written informed consent to participate in this study.
YW, JC, and WW designed the research, performed the research, and wrote the manuscript. JC, ZW, CZ, MA, and BD analyzed the data. JC, ZW, and CZ prepared the figures. JC, BD, and YW contributed analytic tools and edited the manuscript. JC and YW critically revised the manuscript and addressed feedbacks. YW acquired the funding. All authors contributed to the article and approved the submitted version.
The present study was funded by the National Natural Science Foundation of China (Nos. 81670884 and 81873684) and the Youth Program of the National Natural Science Foundation of China (No. 81900828)—had no role in the study design, research performance, data analysis, or article composition. YW had full access to all the data and had final responsibility for the decision to submit for publication.
The authors declare that the research was conducted in the absence of any commercial or financial relationships that could be construed as a potential conflict of interest.
All claims expressed in this article are solely those of the authors and do not necessarily represent those of their affiliated organizations, or those of the publisher, the editors and the reviewers. Any product that may be evaluated in this article, or claim that may be made by its manufacturer, is not guaranteed or endorsed by the publisher.
We gratefully acknowledge Tianjin Key Lab of Ophthalmology and Visual Science (Tianjin, China) and Applied Protein Technology facility (Shanghai, China) for the technical support during the study.
The Supplementary Material for this article can be found online at: https://www.frontiersin.org/articles/10.3389/fcell.2021.689917/full#supplementary-material
Adhikari, S., Nice, E. C., Deutsch, E. W., Lane, L., Omenn, G. S., Pennington, S. R., et al. (2020). A high-stringency blueprint of the human proteome. Nat. Commun. 11:5301. doi: 10.1038/s41467-020-19045-9
Aisen, P., Enns, C., and Wessling-Resnick, M. (2001). Chemistry and biology of eukaryotic iron metabolism. Int. J. Biochem. Cell Biol. 33, 940–959. doi: 10.1016/s1357-2725(01)00063-2
Assil, K. K., Quantock, A. J., Barrett, A. M., and Schanzlin, D. J. (1993). Corneal iron lines associated with the intrastromal corneal ring. Am. J. Ophthalmol. 116, 350–356. doi: 10.1016/s0002-9394(14)71353-4
Bostanci, N., Selevsek, N., Wolski, W., Grossmann, J., Bao, K., Wahlander, A., et al. (2018). Targeted proteomics guided by label-free quantitative proteome analysis in saliva reveal transition signatures from health to periodontal disease. Mol. Cell Proteomics 17, 1392–1409. doi: 10.1074/mcp.RA118.000718
Cozzi, A., Corsi, B., Levi, S., Santambrogio, P., Albertini, A., and Arosio, P. (2000). Overexpression of wild type and mutated human ferritin H-chain in HeLa cells: in vivo role of ferritin ferroxidase activity. J. Biol. Chem. 275, 25122–25129. doi: 10.1074/jbc.M003797200
Dyrlund, T. F., Poulsen, E. T., Scavenius, C., Nikolajsen, C. L., Thøgersen, I. B., Vorum, H., et al. (2012). Human cornea proteome: identification and quantitation of the proteins of the three main layers including epithelium, stroma, and endothelium. J. Proteome Res. 11, 4231–4239. doi: 10.1021/pr300358k
Foster, J., Wu, W. H., Scott, S. G., Bassi, M., Mohan, D., Daoud, Y., et al. (2014). Transforming growth factor β and insulin signal changes in stromal fibroblasts of individual keratoconus patients. PLoS One 9:e106556. doi: 10.1371/journal.pone.0106556
Francisco, B. M., Salvador, M., and Amparo, N. (2015). Oxidative stress in myopia. Oxid. Med. Cell. Longev. 2015:750637. doi: 10.1155/2015/750637
Fulcher, S., Lui, G. M., Houston, L. L., Ramakrishnan, S., Burris, T., Polansky, J., et al. (1988). Use of immunotoxin to inhibit proliferating human corneal endothelium. Invest. Ophthalmol. Vis. Sci. 29, 755–759.
García-Casal, M. N., and Leets, I. (2014). Carotenoids, but not vitamin A, improve iron uptake and ferritin synthesis by Caco-2 cells from ferrous fumarate and NaFe-EDTA. J. Food Sci. 79, H706–H712. doi: 10.1111/1750-3841.12374
Gass, J. D. (1964). The iron lines of the superficial cornea. Hudson-Stahli line. Stocker’s line and Fleischer’s ring. Arch. Ophthalmol. 71, 348–358.
Götz, S., García-Gómez, J. M., Terol, J., Williams, T. D., Nagaraj, S. H., Nueda, M. J., et al. (2008). High-throughput functional annotation and data mining with the Blast2GO suite. Nucleic Acids Res. 36, 3420–3435. doi: 10.1093/nar/gkn176
Grochowski, E. T., Pietrowska, K., Kowalczyk, T., Mariak, Z., Kretowski, A., Ciborowski, M., et al. (2020). Omics in myopia. J. Clin. Med. 9:3464. doi: 10.3390/jcm9113464
Harned, J., Fleisher, L. N., and McGahan, M. C. (2006). Lens epithelial cells synthesize and secrete ceruloplasmin: effects of ceruloplasmin and transferrin on iron efflux and intracellular iron dynamics. Exp. Eye Res. 83, 721–727. doi: 10.1016/j.exer.2006.01.018
He, X., Hahn, P., Iacovelli, J., Wong, R., King, C., Bhisitkul, R., et al. (2007). Iron homeostasis and toxicity in retinal degeneration. Prog. Retin. Eye Res. 26, 649–673. doi: 10.1016/j.preteyeres.2007.07.004
Holden, B. A., Fricke, T. R., Wilson, D. A., Jong, M., Naidoo, K. S., Sankaridurg, P., et al. (2016). Global prevalence of myopia and high myopia and temporal trends from 2000 through 2050. Ophthalmology 123, 1036–1042. doi: 10.1016/j.ophtha.2016.01.006
Huang, D., Wang, Y., Lv, J., Yan, Y., Hu, Y., Liu, C., et al. (2020). Proteomic profiling analysis of postmenopausal osteoporosis and osteopenia identifies potential proteins associated with low bone mineral density. PeerJ 8:e9009. doi: 10.7717/peerj.9009
Hysi, P. G., Wojciechowski, R., Rahi, J. S., and Hammond, C. J. (2014). Genome-wide association studies of refractive error and myopia, lessons learned, and implications for the future. Invest. Ophthalmol. Vis. Sci. 55, 3344–3351. doi: 10.1167/iovs.14-14149
Joseph, R., Srivastava, O. P., and Pfister, R. R. (2011). Differential epithelial and stromal protein profiles in keratoconus and normal human corneas. Exp. Eye Res. 92, 282–298. doi: 10.1016/j.exer.2011.01.008
Junk, A. K., Mammis, A., Savitz, S. I., Singh, M., Roth, S., Malhotra, S., et al. (2002). Erythropoietin administration protects retinal neurons from acute ischemia-reperfusion injury. Proc. Natl. Acad. Sci. U.S.A. 99, 10659–10664. doi: 10.1073/pnas.152321399
Kaelin, W. G., and Ratcliffe, P. J. (2008). Oxygen sensing by metazoans: the central role of the HIF hydroxylase pathway. Mol. Cell 30, 393–402. doi: 10.1016/j.molcel.2008.04.009
Kang, B. S., Lam, T. C., Cheung, J. K., Li, K. K., and Kee, C. S. (2021). Corneal proteome and differentially expressed corneal proteins in highly myopic chicks using a label-free SWATH-MS quantification approach. Sci. Rep. 11:5495. doi: 10.1038/s41598-021-84904-4
Karring, H., Thøgersen, I. B., Klintworth, G. K., Møller-Pedersen, T., and Enghild, J. J. (2005). A dataset of human cornea proteins identified by peptide mass fingerprinting and tandem mass spectrometry. Mol. Cell Proteomics 4, 1406–1408. doi: 10.1074/mcp.D500003-MCP200
Kim, T. I., Alió Del Barrio, J. L., Wilkins, M., Cochener, B., and Ang, M. (2019). Refractive surgery. Lancet 393, 2085–2098. doi: 10.1016/S0140-6736(18)33209-4
Lauwen, S., de Jong, E. K., Lefeber, D. J., and den Hollander, A. (2017). Omics biomarkers in ophthalmology. Invest. Ophthalmol. Vis. Sci. 58, BIO88–BIO98. doi: 10.1167/iovs.17-21809
Li, J., Liu, X., Zhou, Z., Tan, L., Wang, X., Zheng, Y., et al. (2019). Lysozyme-assisted photothermal eradication of methicillin-resistant Staphylococcus aureus infection and accelerated tissue repair with natural melanosome nanostructures. ACS Nano 13, 11153–11167. doi: 10.1021/acsnano.9b03982
Li, L. H., Lee, J. C., Leung, H. H., Lam, W. C., Fu, Z., and Lo, A. (2020). Lutein supplementation for eye diseases. Nutrients 12:1721. doi: 10.3390/nu12061721
Liang, J. B., Chou, P. I., Wu, R., and Lee, Y. M. (2003). Corneal iron ring associated with orthokeratology. J. Cataract. Refract. Surg. 29, 624–626. doi: 10.1016/s0886-3350(02)01458-x
Linsenmayer, T. F., Cai, C. X., Millholland, J. M., Beazley, K. E., and Fitch, J. M. (2005). Nuclear ferritin in corneal epithelial cells: tissue-specific nuclear transport and protection from UV-damage. Prog. Retin. Eye Res. 24, 139–159. doi: 10.1016/j.preteyeres.2004.08.004
MacLean, B., Tomazela, D. M., Shulman, N., Chambers, M., Finney, G. L., Frewen, B., et al. (2010). Skyline: an open source document editor for creating and analyzing targeted proteomics experiments. Bioinformatics 26, 966–968. doi: 10.1093/bioinformatics/btq054
Mannis, M. J. (1983). Iron deposition in the corneal graft. Another corneal iron line. Arch. Ophthalmol. 101, 1858–1861. doi: 10.1001/archopht.1983.01040020860003
Morgan, I. G., French, A. N., Ashby, R. S., Guo, X., Ding, X., He, M., et al. (2018). The epidemics of myopia: aetiology and prevention. Prog. Retin. Eye Res. 62, 134–149. doi: 10.1016/j.preteyeres.2017.09.004
Morgan, I. G., Ohno-Matsui, K., and Saw, S. M. (2012). Myopia. Lancet 379, 1739–1748. doi: 10.1016/S0140-6736(12)60272-4
Moriya, Y., Itoh, M., Okuda, S., Yoshizawa, A. C., and Kanehisa, M. (2007). KAAS: an automatic genome annotation and pathway reconstruction server. Nucleic Acids Res. 35, W182–W185. doi: 10.1093/nar/gkm321
Nioi, P., and Hayes, J. D. (2004). Contribution of NAD(P)H:quinone oxidoreductase 1 to protection against carcinogenesis, and regulation of its gene by the Nrf2 basic-region leucine zipper and the arylhydrocarbon receptor basic helix-loop-helix transcription factors. Mutat. Res. 555, 149–171. doi: 10.1016/j.mrfmmm.2004.05.023
Perez-Riverol, Y., Csordas, A., Bai, J., Bernal-Llinares, M., Hewapathirana, S., Kundu, D. J., et al. (2019). The PRIDE database and related tools and resources in 2019: improving support for quantification data. Nucleic Acids Res. 47, D442–D450. doi: 10.1093/nar/gky1106
Peterson, A. C., Russell, J. D., Bailey, D. J., Westphall, M. S., and Coon, J. J. (2012). Parallel reaction monitoring for high resolution and high mass accuracy quantitative, targeted proteomics. Mol. Cell Proteomics 11, 1475–1488. doi: 10.1074/mcp.O112.020131
Qiao-Grider, Y., Hung, L. F., Kee, C. S., Ramamirtham, R., and Smith, E. L. III (2010). Nature of the refractive errors in rhesus monkeys (Macaca mulatta) with experimentally induced ametropias. Vision Res. 50, 1867–1881. doi: 10.1016/j.visres.2010.06.008
Quevillon, E., Silventoinen, V., Pillai, S., Harte, N., Mulder, N., Apweiler, R., et al. (2005). InterProScan: protein domains identifier. Nucleic Acids Res. 33, W116–W120. doi: 10.1093/nar/gki442
Rouault, T. A. (2002). Post-transcriptional regulation of human iron metabolism by iron regulatory proteins. Blood Cells Mol. Dis. 29, 309–314. doi: 10.1006/bcmd.2002.0571
Seiler, T., and Holschbach, A. (1993). Central corneal iron deposit after photorefractive keratectomy. Ger. J. Ophthalmol. 2, 143–145.
Stergachis, A. B., MacLean, B., Lee, K., Stamatoyannopoulos, J. A., and MacCoss, M. J. (2011). Rapid empirical discovery of optimal peptides for targeted proteomics. Nat. Methods 8, 1041–1043. doi: 10.1038/nmeth.1770
Thompson, A., Schäfer, J., Kuhn, K., Kienle, S., Schwarz, J., Schmidt, G., et al. (2003). Tandem mass tags: a novel quantification strategy for comparative analysis of complex protein mixtures by MS/MS. Anal. Chem. 75, 1895–1904. doi: 10.1021/ac0262560
Troilo, D., Smith, E. L. III, Nickla, D. L., Ashby, R., Tkatchenko, A. V., Ostrin, L. A., et al. (2019). IMI – report on experimental models of emmetropization and myopia. Invest. Ophthalmol. Vis. Sci. 60, M31–M88. doi: 10.1167/iovs.18-25967
Trowbridge, I. S., and Domingo, D. L. (1981). Anti-transferrin receptor monoclonal antibody and toxin-antibody conjugates affect growth of human tumour cells. Nature 294, 171–173. doi: 10.1038/294171a0
Wiśniewski, J. R., Zougman, A., Nagaraj, N., and Mann, M. (2009). Universal sample preparation method for proteome analysis. Nat. Methods 6, 359–362. doi: 10.1038/nmeth.1322
Wong, T. Y., Ferreira, A., Hughes, R., Carter, G., and Mitchell, P. (2014). Epidemiology and disease burden of pathologic myopia and myopic choroidal neovascularization: an evidence-based systematic review. Am. J. Ophthalmol. 157, 9–25.e12. doi: 10.1016/j.ajo.2013.08.010
Wu, H., Chen, W., Zhao, F., Zhou, Q., Reinach, P. S., Deng, L., et al. (2018). Scleral hypoxia is a target for myopia control. Proc. Natl. Acad. Sci. U.S.A. 115, E7091–E7100. doi: 10.1073/pnas.1721443115
Yefimova, M. G., Jeanny, J. C., Guillonneau, X., Keller, N., Nguyen-Legros, J., Sergeant, C., et al. (2000). Iron, ferritin, transferrin, and transferrin receptor in the adult rat retina. Invest. Ophthalmol. Vis. Sci. 41, 2343–2351.
Yeung, L., Chen, Y. F., Lin, K. K., Huang, S. C., and Hsiao, C. H. (2006). Central corneal iron deposition after myopic laser-assisted in situ keratomileusis. Cornea 25, 291–295. doi: 10.1097/01.ico.0000183532.32825.ce
Yu, F. J., Lam, T. C., Liu, L. Q., Chun, R. K., Cheung, J. K., Li, K. K., et al. (2017). Isotope-coded protein label based quantitative proteomic analysis reveals significant up-regulation of apolipoprotein A1 and ovotransferrin in the myopic chick vitreous. Sci. Rep. 7:12649. doi: 10.1038/s41598-017-12650-7
Yu, T. C., and Okamura, R. (1988). Quantitative study of characteristic aqueous humor transferrin, serum transferrin and desialized serum transferrin in aqueous humor. Jpn. J. Ophthalmol. 32, 268–274.
Zhang, G., Li, J., Zhang, J., Liang, X., Zhang, X., Wang, T., et al. (2019). Integrated analysis of transcriptomic, miRNA and proteomic changes of a novel hybrid yellow catfish uncovers key roles for miRNAs in heterosis. Mol. Cell Proteomics 18, 1437–1453. doi: 10.1074/mcp.RA118.001297
Keywords: myopia, cornea, protein biomarkers, signal, iron metabolism, protein–protein interaction, oxidative stress
Citation: Chen J, Wu W, Wang Z, Zhai C, Deng B, Alzogool M and Wang Y (2021) Novel Corneal Protein Biomarker Candidates Reveal Iron Metabolic Disturbance in High Myopia Eyes. Front. Cell Dev. Biol. 9:689917. doi: 10.3389/fcell.2021.689917
Received: 01 April 2021; Accepted: 30 August 2021;
Published: 01 October 2021.
Edited by:
Wei Chi, Sun Yat-sen University, ChinaReviewed by:
Dequan Li, Baylor College of Medicine, United StatesCopyright © 2021 Chen, Wu, Wang, Zhai, Deng, Alzogool and Wang. This is an open-access article distributed under the terms of the Creative Commons Attribution License (CC BY). The use, distribution or reproduction in other forums is permitted, provided the original author(s) and the copyright owner(s) are credited and that the original publication in this journal is cited, in accordance with accepted academic practice. No use, distribution or reproduction is permitted which does not comply with these terms.
*Correspondence: Yan Wang, d2FuZ3lhbjcxNDNAdmlwLnNpbmEuY29t
Disclaimer: All claims expressed in this article are solely those of the authors and do not necessarily represent those of their affiliated organizations, or those of the publisher, the editors and the reviewers. Any product that may be evaluated in this article or claim that may be made by its manufacturer is not guaranteed or endorsed by the publisher.
Research integrity at Frontiers
Learn more about the work of our research integrity team to safeguard the quality of each article we publish.