 Shaobo Mo1,2†
 Weixing Dai1,2†
 Zheng Zhou1,2†Ruiqi Gu1,2Yaqi Li1,2Wenqiang Xiang1,2
 Lingyu Han1,2
 Long Zhang1,3
 Renjie Wang1,2
 Guoxiang Cai1,2
 Sanjun Cai1,2,3*‡Lu Gan4,5,6*‡Qingguo Li1,2*‡
- 1Department of Colorectal Surgery, Fudan University Shanghai Cancer Center, Shanghai, China
- 2Department of Oncology, Shanghai Medical College, Fudan University, Shanghai, China
- 3Department of Cancer Institute, Fudan University Shanghai Cancer Center, Fudan University, Shanghai, China
- 4Department of Medical Oncology, Zhongshan Hospital, Fudan University, Shanghai, China
- 5Department of Cancer Center, Zhongshan Hospital, Fudan University, Shanghai, China
- 6Center of Evidence-Based Medicine, Fudan University, Shanghai, China
Lymph node metastasis (LNM) is closely related to the postoperative recurrence of colorectal cancer (CRC), and greatly affects patient survival. Conducting Gene set variation analysis (GSVA) and gene set enrichment analysis (GSEA), we found that the epithelial-mesenchymal transition (EMT) signaling pathway is the signaling pathway most relevant to the process of LNM. An EMT-related gene signature was identified from a discovery dataset obtained 489 patients using LIMMA and LASSO Cox methods. Six external independent dataset analyses including a total of 1,045 CRC patients and stratification analysis showed that EMT-related gene signature could sort out those high- and low-risk CRC patients accurately. Functional analysis and loss-of-function exploration in vitro and in vivo indicated that the EMT-related-signature-associated coding genes might play functional roles in the sophisticated regulation of CRC proliferation and metastasis. Prognostic nomograms integrating the EMT-related gene signature and clinicopathological risk factors were constructed for use as numerical prediction tools to assess clinical prognosis and clinical decision-makings. The comprehensive transcriptomic analysis in this article highlights the prognostic value of an EMT-related gene signature for postoperative disease recurrence in CRC patients and reveals a potential prognostic and therapeutic biomarker for CRC.
Introduction
The United States’ 14.8 million new colorectal cancer (CRC) cases made CRC the most common cancer of the digestive tract; with 146 deaths per day in 2019 (Siegel et al., 2020). Closely related to economic development, CRC has emerged as a critical public health problem in China as the standard of living of its people has improved; the incidence of CRC in China was approximately 37.6/100,000 in 2016, which ranks third among all types of cancer in both the United States and China (Chen et al., 2016). Colorectal resection is followed by relapse, and most such relapses occur within 2 years. The survival and quality of life of CRC patients are affected by early relapse, which includes locoregional recurrence (∼10%), distant metastasis (∼80%), and local recurrence with distant metastasis (∼10%) occurring within 2 years after primary resection (Beets-Tan and Beets, 2004). The mechanism through which early recurrence after radical resection of CRC occurs remains unclear, and the current incidence of recurrence and metastasis requires improved postoperative prediction and monitoring.
According to current National Comprehensive Cancer Network (NCCN) guidelines, lymph node metastasis (LNM) may contribute to poor survival outcomes in CRC patients, since LNM status provides valuable information about the prognosis for CRC. Epithelial-mesenchymal transformation (EMT), firstly described in the 1980s. EMT is involved in physiological embryogenesis as well as in some pathological processes, enables epithelial cells to acquire tumor characteristics such as invasive properties and LNM ability (Hanada et al., 2009). Over the course of EMT, cells lose the characteristics of epithelial and obtain certain mesenchymal properties, including motile and invasive features. EMT may enhance migration, invasion, and metastasis by tumor cells by reducing the expression of cadherin. However, these mesenchymal properties are reversible. Cells can regain epithelial characteristics through a process referred to as mesenchymal-epithelial transition (MET), enabling malignant cells to relocate to lymph metastasis (Trusolino et al., 2010). Various studies have indicated that EMT is associated with neoplastic invasion and with the progression of various cancers, including CRC (De Craene and Berx, 2013). Since EMT is a vital process in the development of CRC, it remains a subject of intense research aimed at determining whether EMT is a trigger for lymphatic invasion by CRC. In this work, we attempted to determine whether EMT is closely related to local relapse and prognosis in CRC patients.
At present, the most common risk factor for predicting the survival rates of CRC patients is based on the tumor-node-metastasis (TNM) staging system. Although the TNM staging system has been used in the evaluation of CRC patients worldwide, prognoses vary significantly due to the heterogeneity of CRC patients with similar TNM stages. The occurrence of LNM in CRC patients is associated with higher TNM stage and mortality (Kitajima et al., 2004; Suh et al., 2012), and this has inspired scientists to search for genes related to LNM, in order to get a better prediction of the survival of CRC patients. Since 2001, several genetic and mathematical models have been developed to compensate for hidden defects in the TNM staging system. Numerous studies of many malignancies have suggested that multigene expression signatures can be used to make a good prediction of cancer prognosis (Chen et al., 2011; Tan and Tan, 2011; Zhou et al., 2019). Essentially, clinical parameters from the diagnostic workup, including sex and age, can be combined with information on TNM stage and gene expression, and this information can be used to predict CRC patient survival.
In this study, using data from several cohorts in the Gene Expression Omnibus (GEO) datasets, we found that the EMT signaling pathway is the only common enriched pathway in the transition of CRC from LNM-negative to LNM-positive. Then, an EMT-related gene signature was identified and validated in CRC; the results showed that CRC patients with high EMT risk scores were very likely to have shorter disease-free survival and overall survival than CRC patients with low-risk scores. Furthermore, functional analysis demonstrated that EMT-related signature-associated coding genes are significantly enriched in cell morphogenesis, development, junctions, and critical cancer pathways that could be pivotal in CRC recurrence. In particular, a loss-of-function assay of selected genes indicated that EMT-related signature-associated coding genes might play functional roles in the sophisticated regulation of CRC proliferation and metastasis. Nomograms integrating the EMT-related gene signature and clinicopathological risk factors were constructed for use as numerical prediction tools to assess clinical prognosis and clinical decision-making.
Materials and Methods
Study Design and Data Collection
Epithelial-mesenchymal transition-related genes were collected from public databases [dbEMT1 (Zhao et al., 2015) and MSigDB2 ]. A detailed list of EMT-related genes is presented in Supplementary Table 1. The 50 hallmark gene sets were downloaded from the Gene Set Enrichment Analysis (GSEA) database3. Raw microarray CRC datasets, including GSE39582, GSE37892, GSE33113, GSE17538, and GSE14333, were downloaded from the GEO database4. The detailed clinical information is shown in Supplementary Table 2. Robust Multiarray Average was used to normalize the raw data (Irizarry et al., 2003). CRC cases in the TCGA dataset with clinical and gene expression information were downloaded from UCSC Xena5. The detailed clinical information on these cases is shown in Supplementary Table 3.
Gene Set Variation Analysis (GSVA) and GSEA
Lymph node metastasis-positive and LNM-negative CRC groups in this study were defined from the GSE39582, GSE37892, GSE17538, and GSE14333 datasets. According to the reference gene set, hallmark gene sets, we used GSVA to calculate a signaling pathway variation score for each sample in stages I–III CRC using the “GSVA” R package (Hanzelmann et al., 2013), setting the p–value <0.05 as statistical significance. Using the same datasets described above, GSEA was also performed to analyze differences between CRC patients in the LNM-positive and LNM-negative subgroups via “javaGSEA” to show the common GSEA result (Subramanian et al., 2005). In GSVA and differently expressed genes (DEGs) analysis, Benjamini and Hochberg method was used to adjust p-value as FDR correction to ensure that FDR < 0.25.
Construction of the Prognostic EMT-Related Gene Signature
Patients who experienced disease recurrence within 2 years after primary resection were classified into the early relapse group. Long-term survival refers to no relapse after a minimum of 5 years of follow-up. We found out several optimum prognostic genes for GSE39582 CRC samples by applying biomarkers related to the EMT signaling pathway (Friedman et al., 2010) and using least absolute shrinkage and selection operator (LASSO) Cox regression analysis, with the help of “glmnet” package in R. This research used linear models for microarray data (LIMMA) to conduct an analysis of DEGs between the early relapse group and the long-term survival group. We set the DEG identification threshold to p < 0.05 and fold change ≥ 1.2. Taking the results of the LASSO and LIMMA analyses into account simultaneously, 19 biomarkers with the best log2-fold change or λ were identified.
Establishment of the EMT-Related Gene Signature for the Prognosis of CRC Patient
By LIMMA and LASSO Cox regression analysis, a risk score formula for the optimal prognostic EMT-related gene signature for each sample was calculated based on the relative expression of each prognostic EMT-related gene and its associated expression value, which was weighted by the LASSO Cox regression coefficient of the gene. Based on this specific risk score formula, the patients were divided into high-risk and low-risk groups by using the “Best” cutoff point (threshold) of the GSE39582 set as the cutoff point. Using the Time-dependent receiver operating characteristic (ROC) analysis, we calculate the area under the curve (AUC) for 1−, 3−, and 5-year RFS and OS and to verify the accuracy of the prognosis predicted by the signature using the ‘survivalROC’ R package in GSE39582 (Heagerty and Zheng, 2005). By Kaplan–Meier (K–M) survival curve analyses and log-rank tests, we evaluated the prognostic significance of the EMT-related signature. The distributions of patients’ risk score, survival and recurrence status were plotted to show the relationship between the calculated risk score and patient survival. In addition, with the help of the “ComplexHeatmap” R package, a heatmap was constructed with cluster analysis in view of the 19 EMT-related gene differentiation methods according to the EMT-related gene signature risk score.
Fudan University Shanghai Cancer Center (FUSCC) Validation Cohort
To prove that the results are significant regardless of the dataset used in the study, we verified the results in the FUSCC validation cohort. This study retrospectively analyzed 104 CRC patients who underwent radical surgery at the FUSCC from 2013 to 2014. The study design was approved by the ethics committee and by the institutional review committee of our cancer center, and written informed consent was obtained from all patients. All cancer tissues were stored at −80°C. Total RNA extraction and reverse transcription were performed according to the manufacturer’s protocol. SYBR Green Supermax (Takara) was used for real-time PCR on an ABI PRISM 7500 Fast Sequence Detection System (Applied Biosystems). The primers used to amplify specific genes are shown in Supplementary Table 6. A risk score formula was constructed for patients. According to the risk score formula, the patients were divided into a low-risk group and a high-risk group by using the median risk score as the cutoff point. Kaplan–Meier analysis was used to evaluate the difference in survival between the two groups, and the log rank test was used for comparison.
Validation of the EMT-Related Gene Signature in Independent Data Sets
To further investigate the reliability of the identified EMT-related gene signature for classification, this study verified it in four independent datasets (GSE37892, GSE33113, GSE17538, and GSE14333) using the analysis methods for each dataset. Additionally, in the TCGA dataset, besides to the expression values of each selected gene, a new risk score formula, weighted by the estimated regression coefficient in the multivariate Cox regression, was constructed for each patient. Estimation of the new EMT-related gene signature for CRC patient prognosis in the TCGA dataset was then performed.
Correlation Between the EMT-Related-Gene Signature and Patients’ Clinicopathological Characteristics
K–M survival analyses of the indicated subtypes of various clinicopathological characteristics were performed. These characteristics included sex, age, tumor site, pathological T stage, LNM, chemotherapy, TP53 mutation status, KRAS mutation state, and BRAF mutation state. The statistical significances of the differences between them were analyzed using the t test or one-way ANOVA. The relationship between each clinicopathological characteristic and risk level was measured using the chi-square test.
Functional Enrichment Analysis
Functional enrichment analysis of GO pathways was performed to determine significantly enriched GO terms for the genes correlated with the 19-EMT-related gene signature using the ClueGO plugin (version 2.5.6) in Cytoscape limited to biological processes (Bindea et al., 2009) and the “clusterProfiler” R package. Functional maps and clusters of enriched GO terms were obtained and visualized using a two-sided hypergeometric test with Bonferroni stepdown correction and a kappa score threshold of 0.4 and limited to level intervals 3–8 with p ≤ 0.05. Biological pathways for which p < 0.05 using functional annotation chart options with the whole human genome as background were considered significant.
Loss-of-Function Exploration
The detailed materials and methods used in “loss-of-function exploration” can be found in the Supplementary Appendix: Methods.
Predictive Nomograms and Clinical Usefulness
Based on the GSE39582 and TCGA cohorts, we adopted the univariable and multivariable Cox regression analyses to calculate each variable’s influence. Selecting the variables with p < 0.05 in the univariate model, the multivariate Cox regression algorithm was adopted. EMT-related gene signature, pathological T stage, and LNM were independent prognostic factors that could be effective in predicting RFS, and EMT-related gene signature, pathological T stage, LNM, age, and sex were independent prognostic factors that could be effective in predicting OS. Based on the results of multivariable Cox regression analysis, two nomograms that integrated clinicopathological parameters with the gene signature were formulated, applying the “rms” R package. The overall points for each patient in the GSE39582 and TCGA cohorts was calculated using these nomograms.
Decision curve analysis (DCA) integrating the risk prediction model into a clinical approach, evaluates a predictive model and visualizes the latent profit of therapy (Vickers and Elkin, 2006). Thus, DCA was performed to analyze the clinical consequences of the predictive nomogram.
Statistical Analysis
Distribution differences between the variables examined were assessed using the χ2 test or Fisher’s exact test when appropriate. The ROC curves, calibration curves and DCA were used to determine the predictive accuracy of the prognostic models. The Kaplan–Meier method was used to draw survival curves, and the curves were compared using the log-rank test. Multivariate analyses were performed using the Cox proportional hazards model. All statistical analyses were performed using R (version 3.3.36). All statistical tests were two-side analysis, and p < 0.05 was considered to indicate statistical significance.
Results
CRC Datasets Preparation
The detailed EMT-related gene list was collected from public databases (dbEMT: see Text Footnote 1) (Supplementary Table 1). 1,430 patients with stages I–III CRC, including 489 patients from GSE39582, 130 cases from GSE37892, 90 cases from GSE33113, 167 cases from GSE17538, 222 cases from GSE14333, and 332 cases from the TCGA database, were sampled and fully studied. Cases lacking the necessary clinicopathological or prognostic data were excluded. The detailed clinicopathological information on the five GEO datasets is displayed in Supplementary Table 2, and TCGA cohort information is shown in Supplementary Table 3. An overview of the comprehensive transcriptome analysis of an EMT-related gene signature in CRC is shown in Supplementary Figure 1.
EMT Signaling Pathway Is Dramatically Activated in the Transition of CRC From LNM-Negative to LNM-Positive
We performed gene set variation analysis (GSVA) of hallmark gene sets in 4 independent GEO datasets: GSE39582, GSE37892, GSE17538, and GSE14333. The results displayed in the heatmap (Figures 1A–D) concentrated on the active EMT signaling pathway and were significantly focused between the LNM-positive and LNM-negative subtype groups (Figures 1E,F). The detailed results of the Venn plot are shown in Supplementary Table 4. GSEA of the HALLMARK_EPITHELIAL_MESENCHYMAL_TRANSITION gene set was then performed; the results indicated that the EMT signaling pathway was noticeably enriched in all datasets (Figures 1G–J). The Enrichment score (ES) is 0.73, 0.77, 0.80, and 0.67 in GSE39582, GSE37892, GSE17538, and GSE14333, respectively. Moreover, the survival outcomes for patients in the LNM-negative and LNM-positive groups were significantly different in view of the K–M analysis results (Figures 1K–O). Overall, the results of the GSVA, GSEA, and K–M survival analysis suggested that EMT-related genes might be prognostic biomarker candidates in stages I–III CRC.
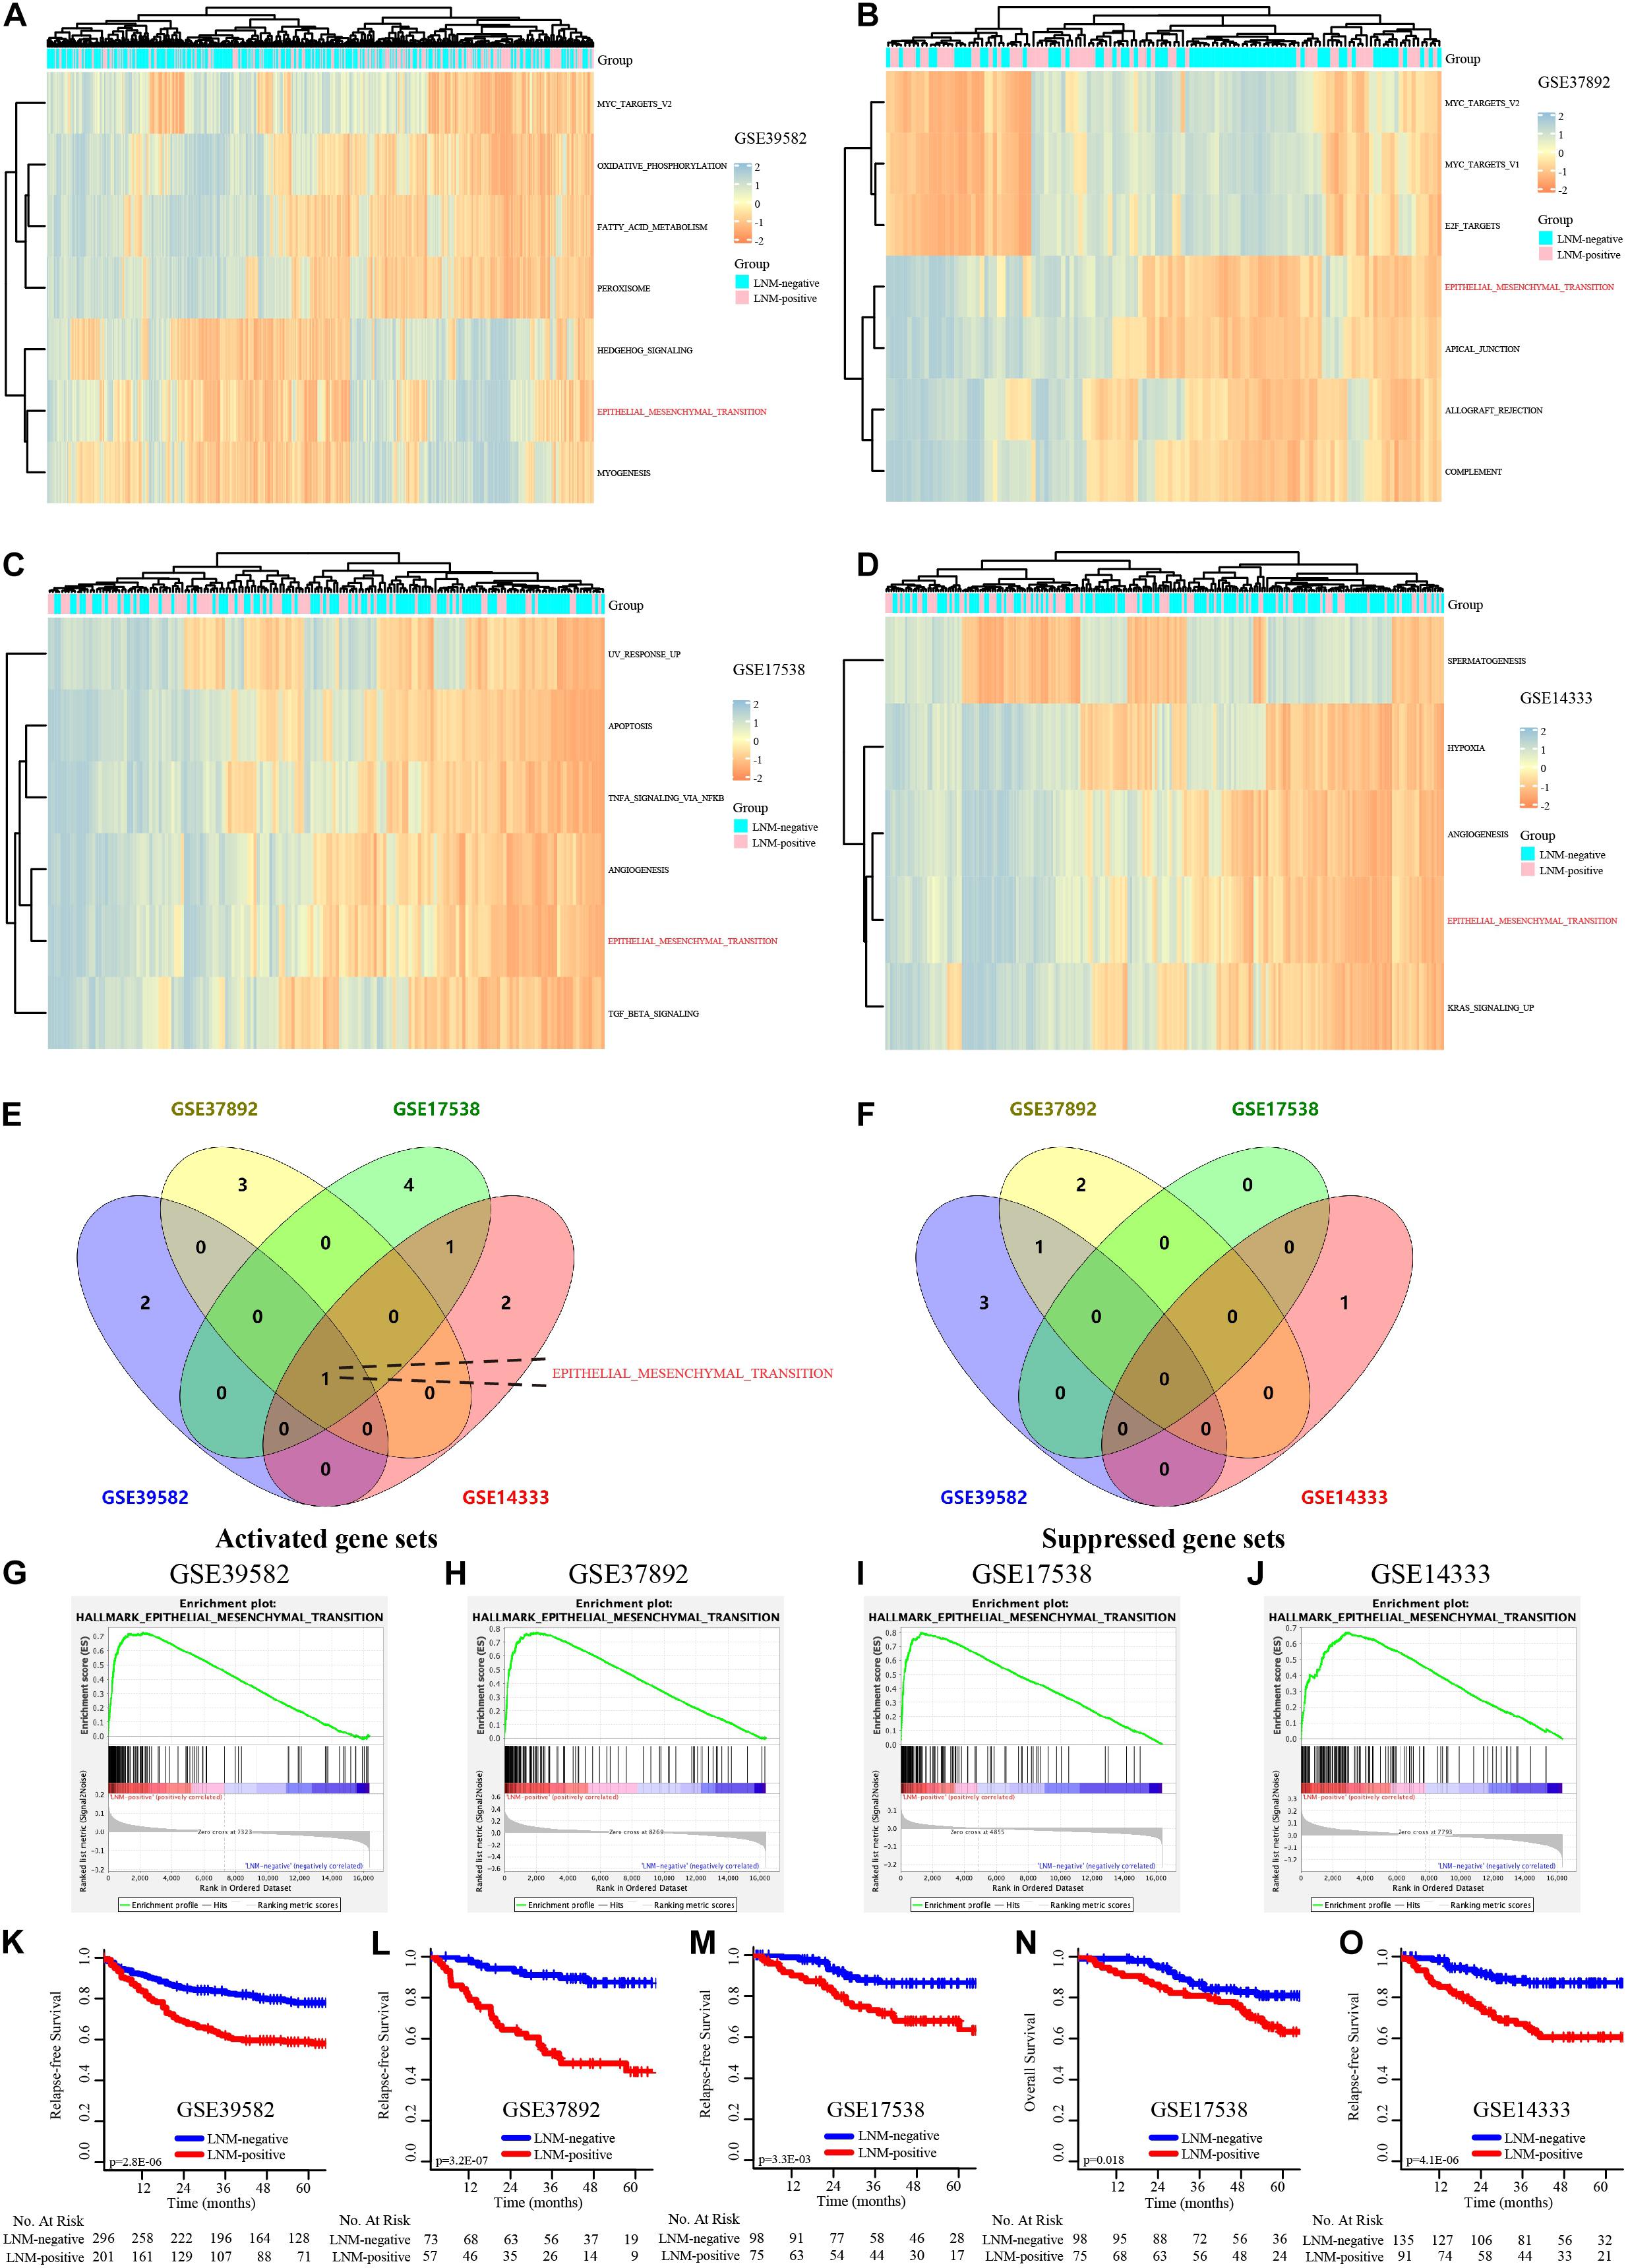
Figure 1. The EMT signaling pathway is dramatically activated in the CRC transition from LNM-negative to LNM-positive. (A–D) GSVA of the GSE39582, GSE37892, GSE17538, and GSE14333 data sets. (E,F) Venn diagram of the activated (E) and suppressed (F) gene sets in the indicated data sets. (G–J) GSEA of “HALLMARK_EPITHELIAL_MESENCHYMAL_TRANSITION” of GSE39582, GSE37892, GSE17538, and GSE14333. (K–O) K–M survival analysis of LNM-negative and LNM-positive CRC patients in GSE39582, GSE37892, GSE17538, and GSE14333.
Development of the EMT-Related-Gene Signature for Prognosis
LASSO and Cox regression analyses were used to screen prognosis-related EMT genes in the GSE39582 dataset. The analysis of discrepantly expressed EMT-related genes (DEEGs) between the early-relapse and long-term-survival groups in the GSE39582 dataset was performed using the LIMMA method. Thirty-one EMT-related genes were found to be related to prognosis based on LASSO analysis (Supplementary Figure 2 and Supplementary Table 5). In addition, thirteen genes (Supplementary Table 5) appeared to be differentially expressed when the LIMMA method was used; the heatmap of these genes is displayed in Supplementary Figure 3. Sifting the results of LASSO by DEEG, nineteen EMT-related genes were found to be differentially expressed between the two groups (Supplementary Figure 4). The formula used to calculate the risk score by LASSO Cox regression modeling was as follows: −0.3063694 ∗ (PLOD2 expression) + 0.4994757 ∗ (DST expression) + 0.7659238 ∗ (CDH6 expression) + 0.6310006 ∗ (ACTA2 expression) + 0.2181532 ∗ (CRLF1 expression) − 0.161345 ∗ (CXCL1 expression) − 0.2057906 ∗ (CXCL12 expression) + (DKK1 expression) ∗ 0.1861136 − (DPYSL3 expression) ∗ 0.3017105 + (FUCA1 expression) ∗ 0.4318945 + (GJA1 expression) ∗ 0.2273617 + (ITGB1 expression) ∗ 0.7700945 − (LAMA2 expression) ∗ 0.3587109 + (LAMC2 expression) ∗ 0.134651 + (MAGEE1 expression) ∗ 0.4941341 + (NT5E expression) ∗ 0.2159442 + (PLOD3 expression) ∗ 0.2229214 − 0.2060671 ∗ (MEST expression) − 0.2939619 ∗ (IL15 expression). CRC patients were divided into low-risk and high-risk groups according to this signature using the value at the best sensitivity and specificity as the cutoff point. The expression of EMT-related genes in the low− and high-risk groups is shown in the heatmap (Figure 2A). The distribution of relapse time and status as a result of risk score is shown in Figure 2B; it suggests that patients with lower risk scores tend to have better survival than other patients. Further K–M survival analysis indicated that the high-risk group had a notably higher relapse rate and shorter survival time than the low-risk group (p < 0.001, Figure 2C). Time-dependent ROC analysis at 1, 3, and 5 years after resection was conducted to determine the accuracy of the signature for predicting prognosis. The AUCs were 0.702 (95% CI, 0.695–0.722), 0.749 (95% CI, 0.721–0.768), and 0.735 (95% CI, 0.713–0.757) at survival times of 1, 3, and 5 years, respectively (Figure 2D).
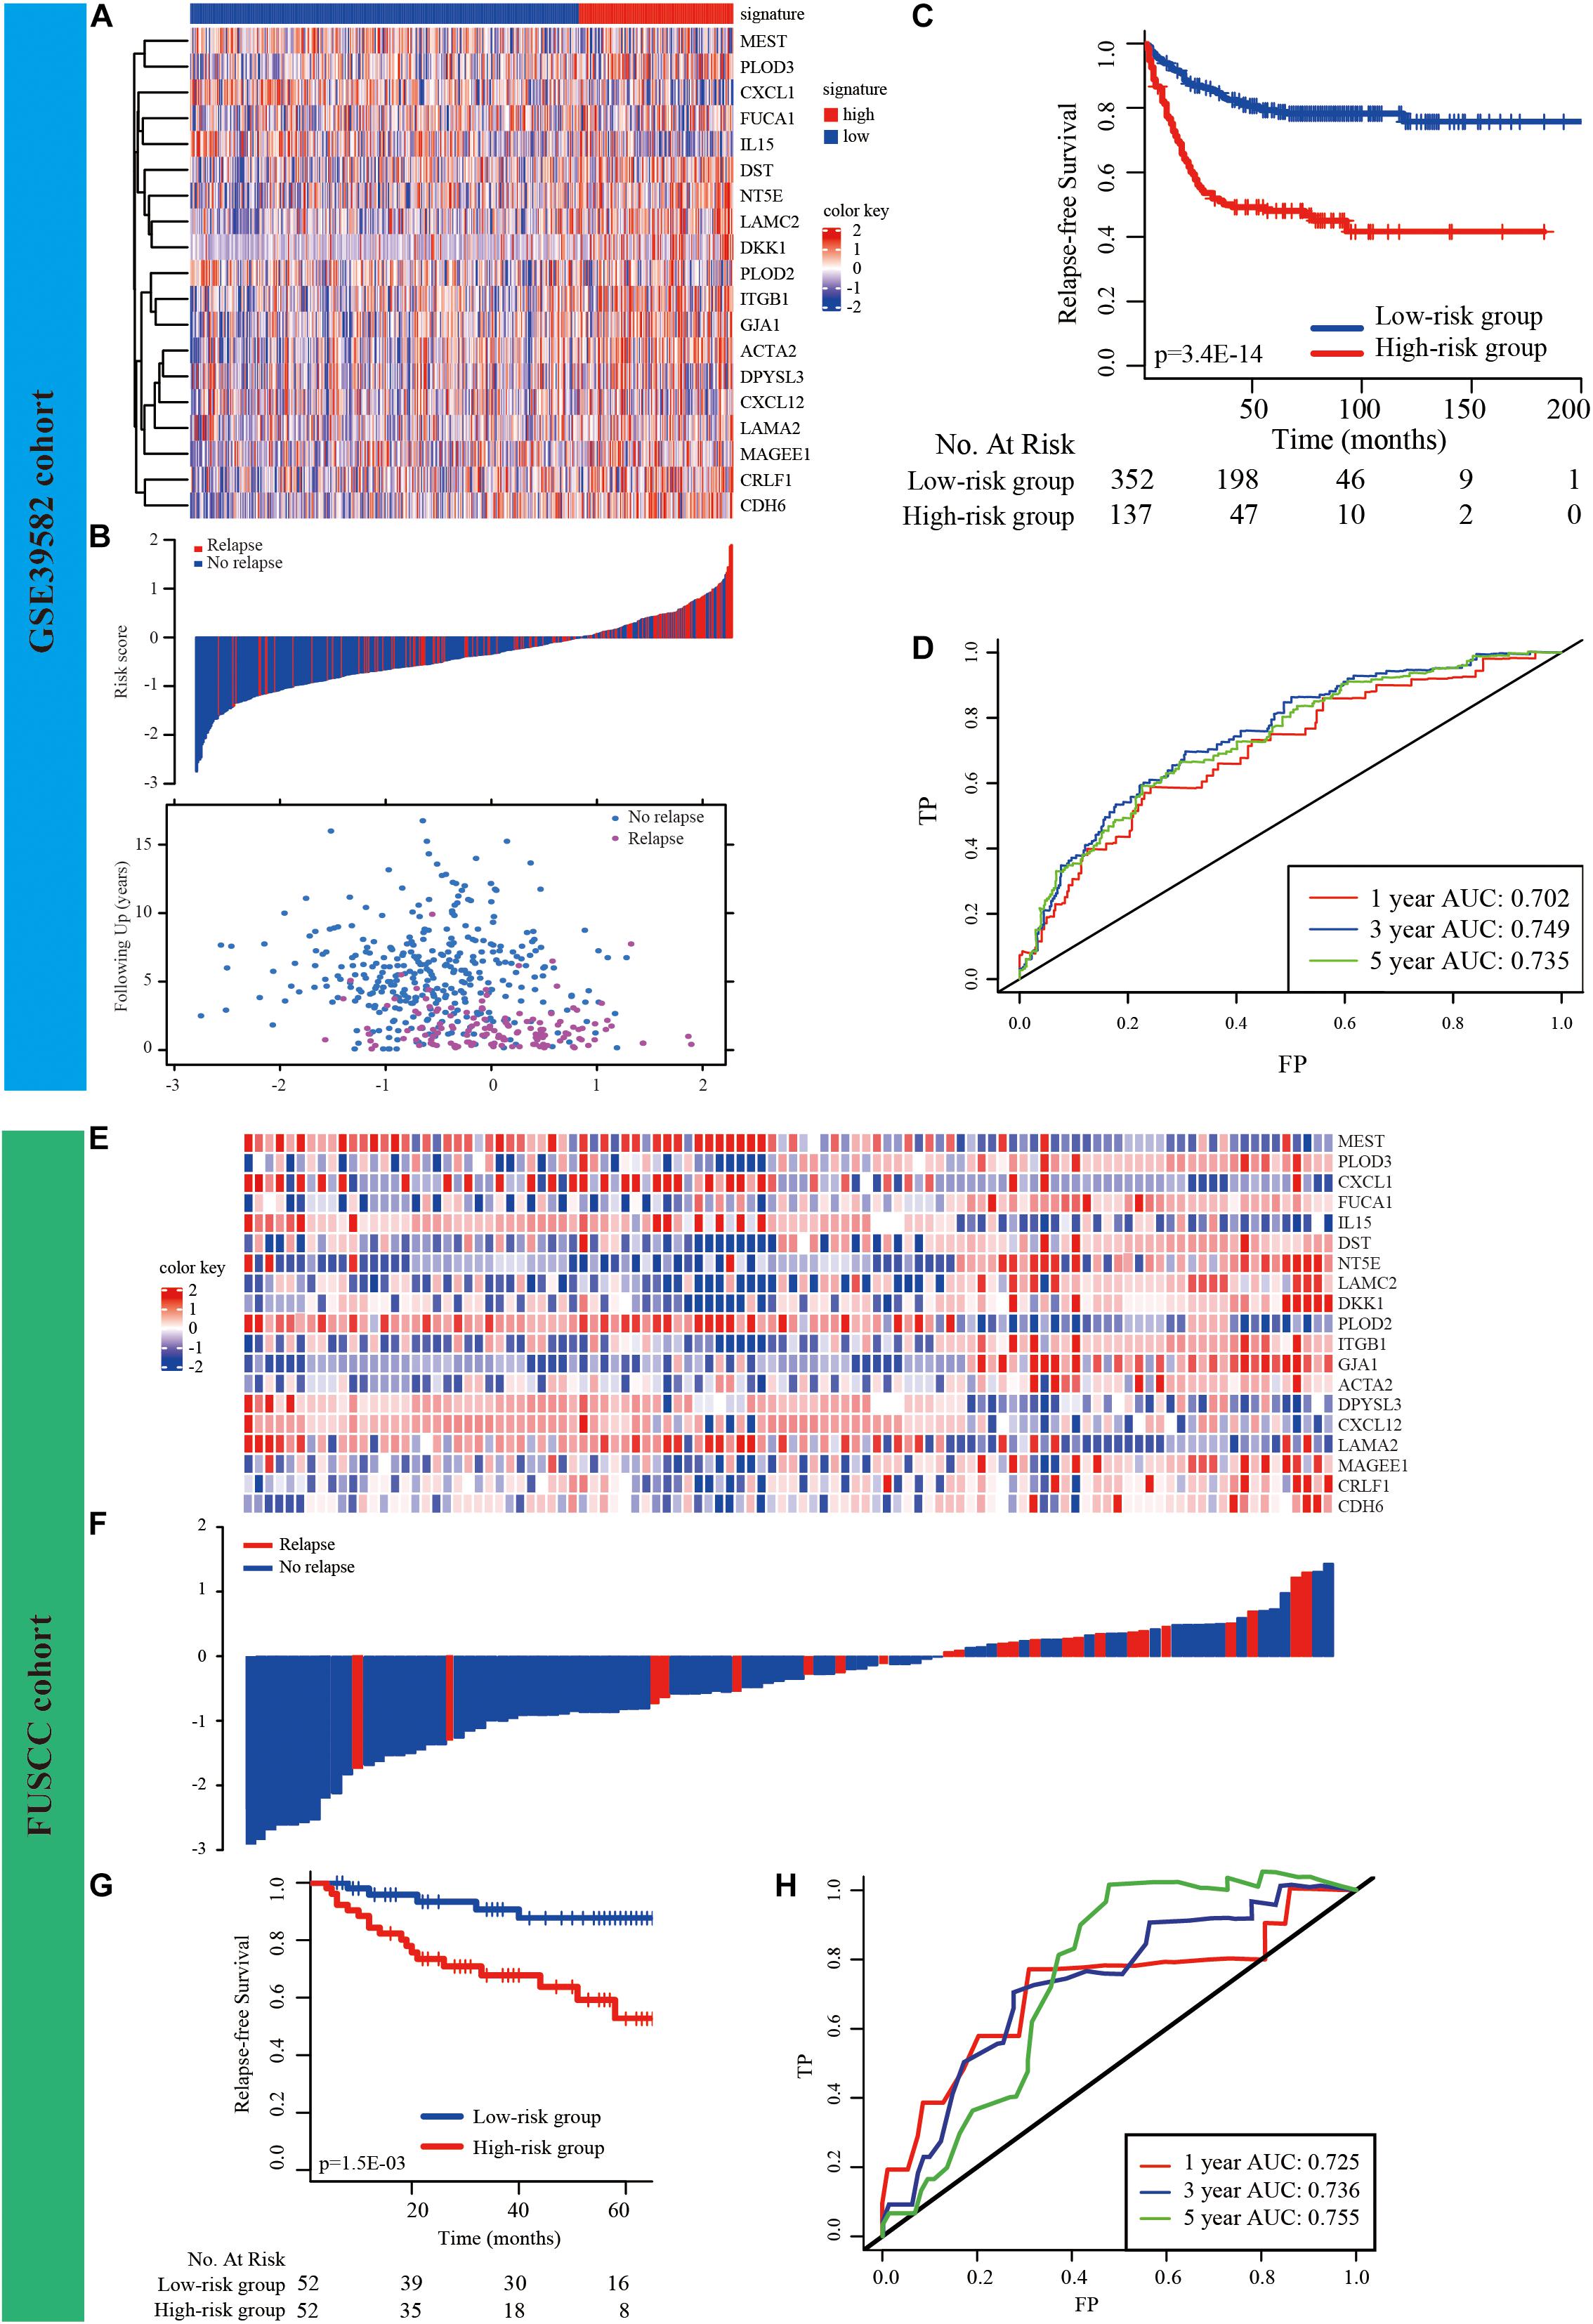
Figure 2. Development and validation of prognostic EMT-related gene signature. (A) The expression of the EMT-related genes between low− and high-risk groups was shown in the heatmap. (B) Relationship between the survival status/risk score rank and survival time (years)/risk score rank. (C) K–M survival analysis of high− and low-risk groups. (D) Time-dependent ROC curve for RFS. The AUC was assessed at 1−, 3−, and 5-year. (E–H) Validation of the prognostic EMT-related gene signature in FUSCC cohort.
External Validation of the EMT-Related Gene Signature
First, based on our cancer center dataset (FUSCC cohort, n = 104, Supplementary Table 7), this novel signature could also be used for risk stratification in CRC patients, as it has substantial clinical prognostic value (p = 0.0015, Figures 2E–G). The AUCs were 0.725 (95% CI, 0.701–0.732), 0.736 (95% CI, 0.714–0.762), and 0.755 (95% CI, 0.730–0.767) at survival times of 1, 3, and 5 years, respectively (Figure 2H).
We then validated the EMT-related gene signature based on the cases from the GEO dataset (GSE37892, GSE33113, GSE17538, and GSE14333) using the same method. The expression of EMT-related genes in the low− and high-risk groups in each dataset is shown in the heatmap (Figures 3A,E,I,M). The distribution of relapse time and status related to risk score in each dataset is shown in Figures 3B,F,J,N, respectively. The 1−, 3−, and 5-year AUCs for each dataset were considerable, indicating that the signature was accurate at predicting prognostic conditions (Figures 3C,G,K,3O). We found significantly higher survival rates in the low-risk group than in the high-risk group in each dataset (p < 0.001 in Figure 3D, p < 0.001 in Figure 3H, p < 0.001 in Figure 3L, and p = 0.001 in Figure 3P).
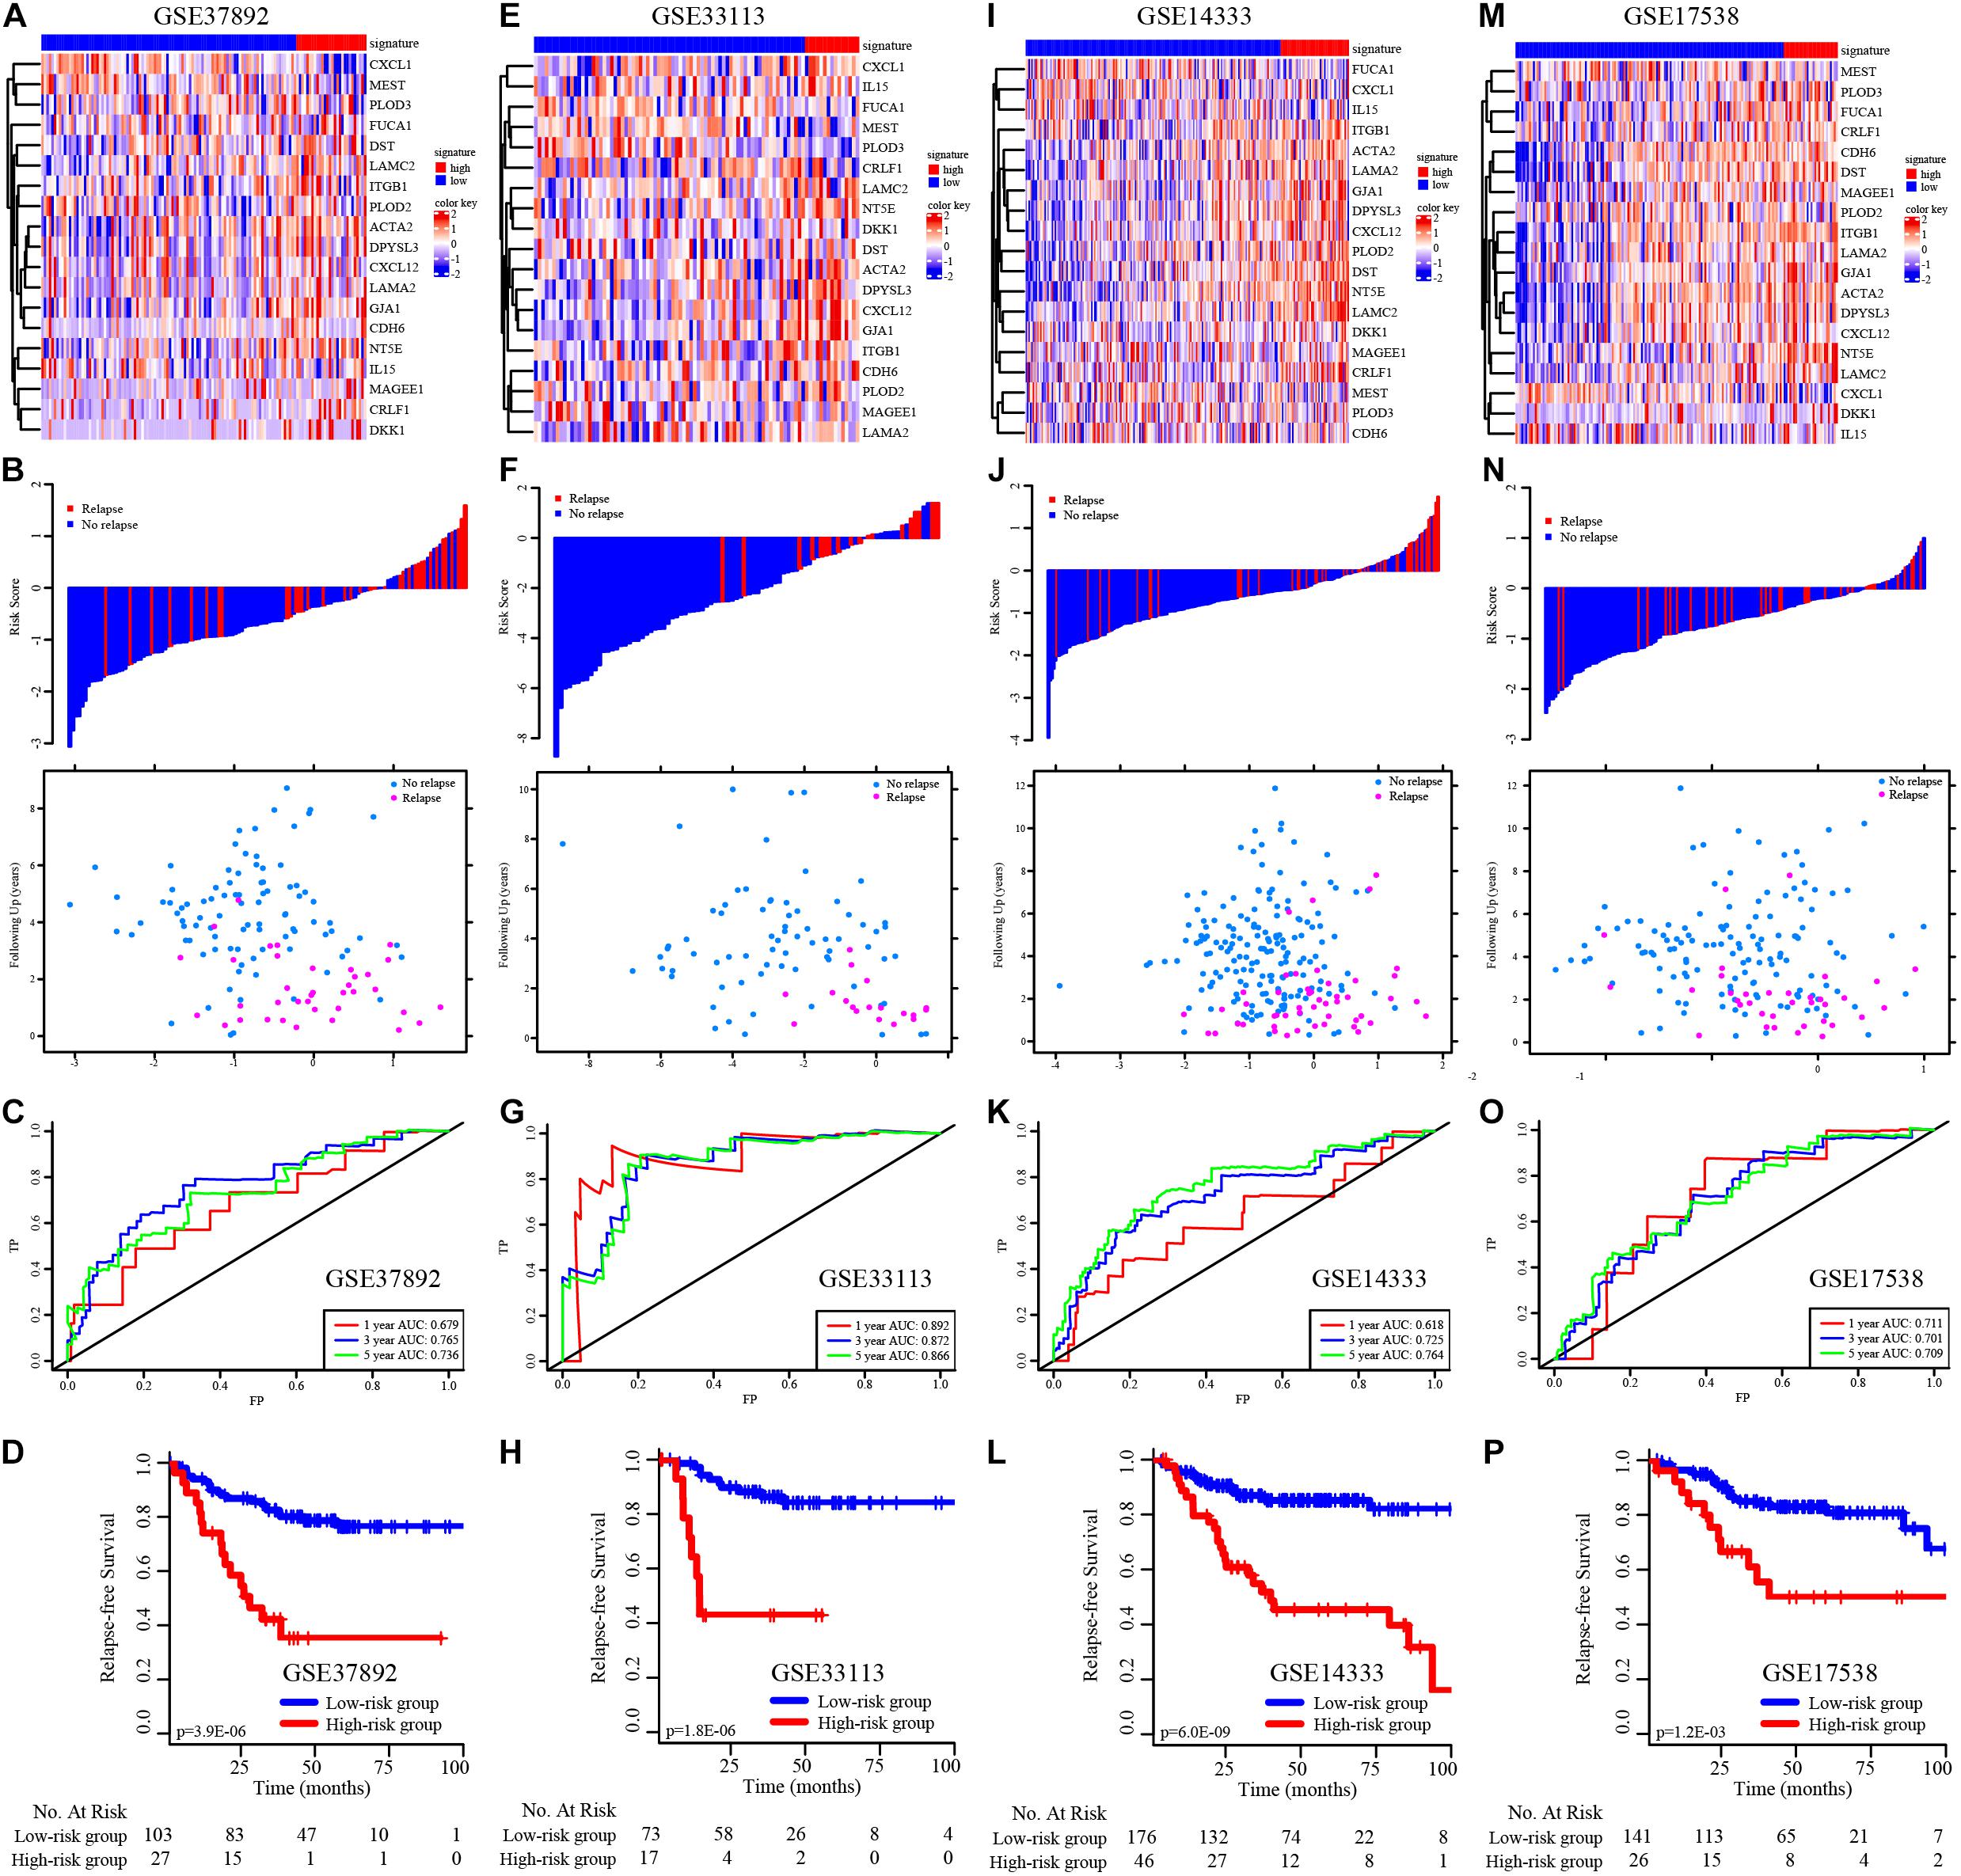
Figure 3. K–M survival analysis, risk score assessment by the EMT-related gene signature and time-dependent ROC curves in the external independent validation data sets. (A–D) The heatmap, distribution of relapse time and status related to risk scores, K–M survival analysis of high− and low-risk groups, and time-dependent ROC curve for RFS in GSE37892 set. (E–H) The heatmap, distribution of relapse time and status related to risk scores, K–M survival analysis of high− and low-risk groups, and time-dependent ROC curve for RFS in GSE33113 set. (I–L) The heatmap, distribution of relapse time and status related to risk scores, K–M survival analysis of high− and low-risk groups, and time-dependent ROC curve for RFS in GSE14333 set. (M–P) The heatmap, distribution of relapse time and status related to risk scores, K–M survival analysis of high− and low-risk groups, and time-dependent ROC curve for RFS in GSE17538 set.
We subsequently validated the ability of the EMT-related gene signature to predict OS in CRC patients. The distribution of survival time and status related to risk scores in each dataset is shown in Supplementary Figures 5A,D. We observed significant prognostic values in GSE39582 (p < 0.001, Supplementary Figure 5C) and GSE17538 (p = 0.008, Supplementary Figure 5F), with 1−, 3−, and 5-year prognostic accuracies of 0.767, 0.686, and 0.682 (Supplementary Figure 5B) and 0.709, 0.612, and 0.604, respectively (Supplementary Figure 5E).
Furthermore, we used the TCGA external cohort for RFS and OS validation (Supplementary Figure 6). We found significant prognostic values in both RFS and OS prediction (p < 0.001, Supplementary Figures 6F,G), with 1−, 3−, and 5-year prognostic accuracies of 0.649, 0.692, and 0.702 (Supplementary Figure 6E) and 0.727, 0.764, and 0.767, respectively (Supplementary Figure 6C).
Subgroup Analysis of the EMT-Related Gene Signature
To determine the predictive power of the EMT-related gene signature in different CRC patient subgroups, the CRC patients were divided into subgroups based on individual clinical factors. Stratified analysis suggested that the 19-EMT-related signature was still a clinically and statistically significant prognostic model in patients in the different sex, age, tumor site, pathological T stage, pathological N stage, chemotherapy status, TP53 status, KRAS status, and BRAF status subgroups (Figure 4).
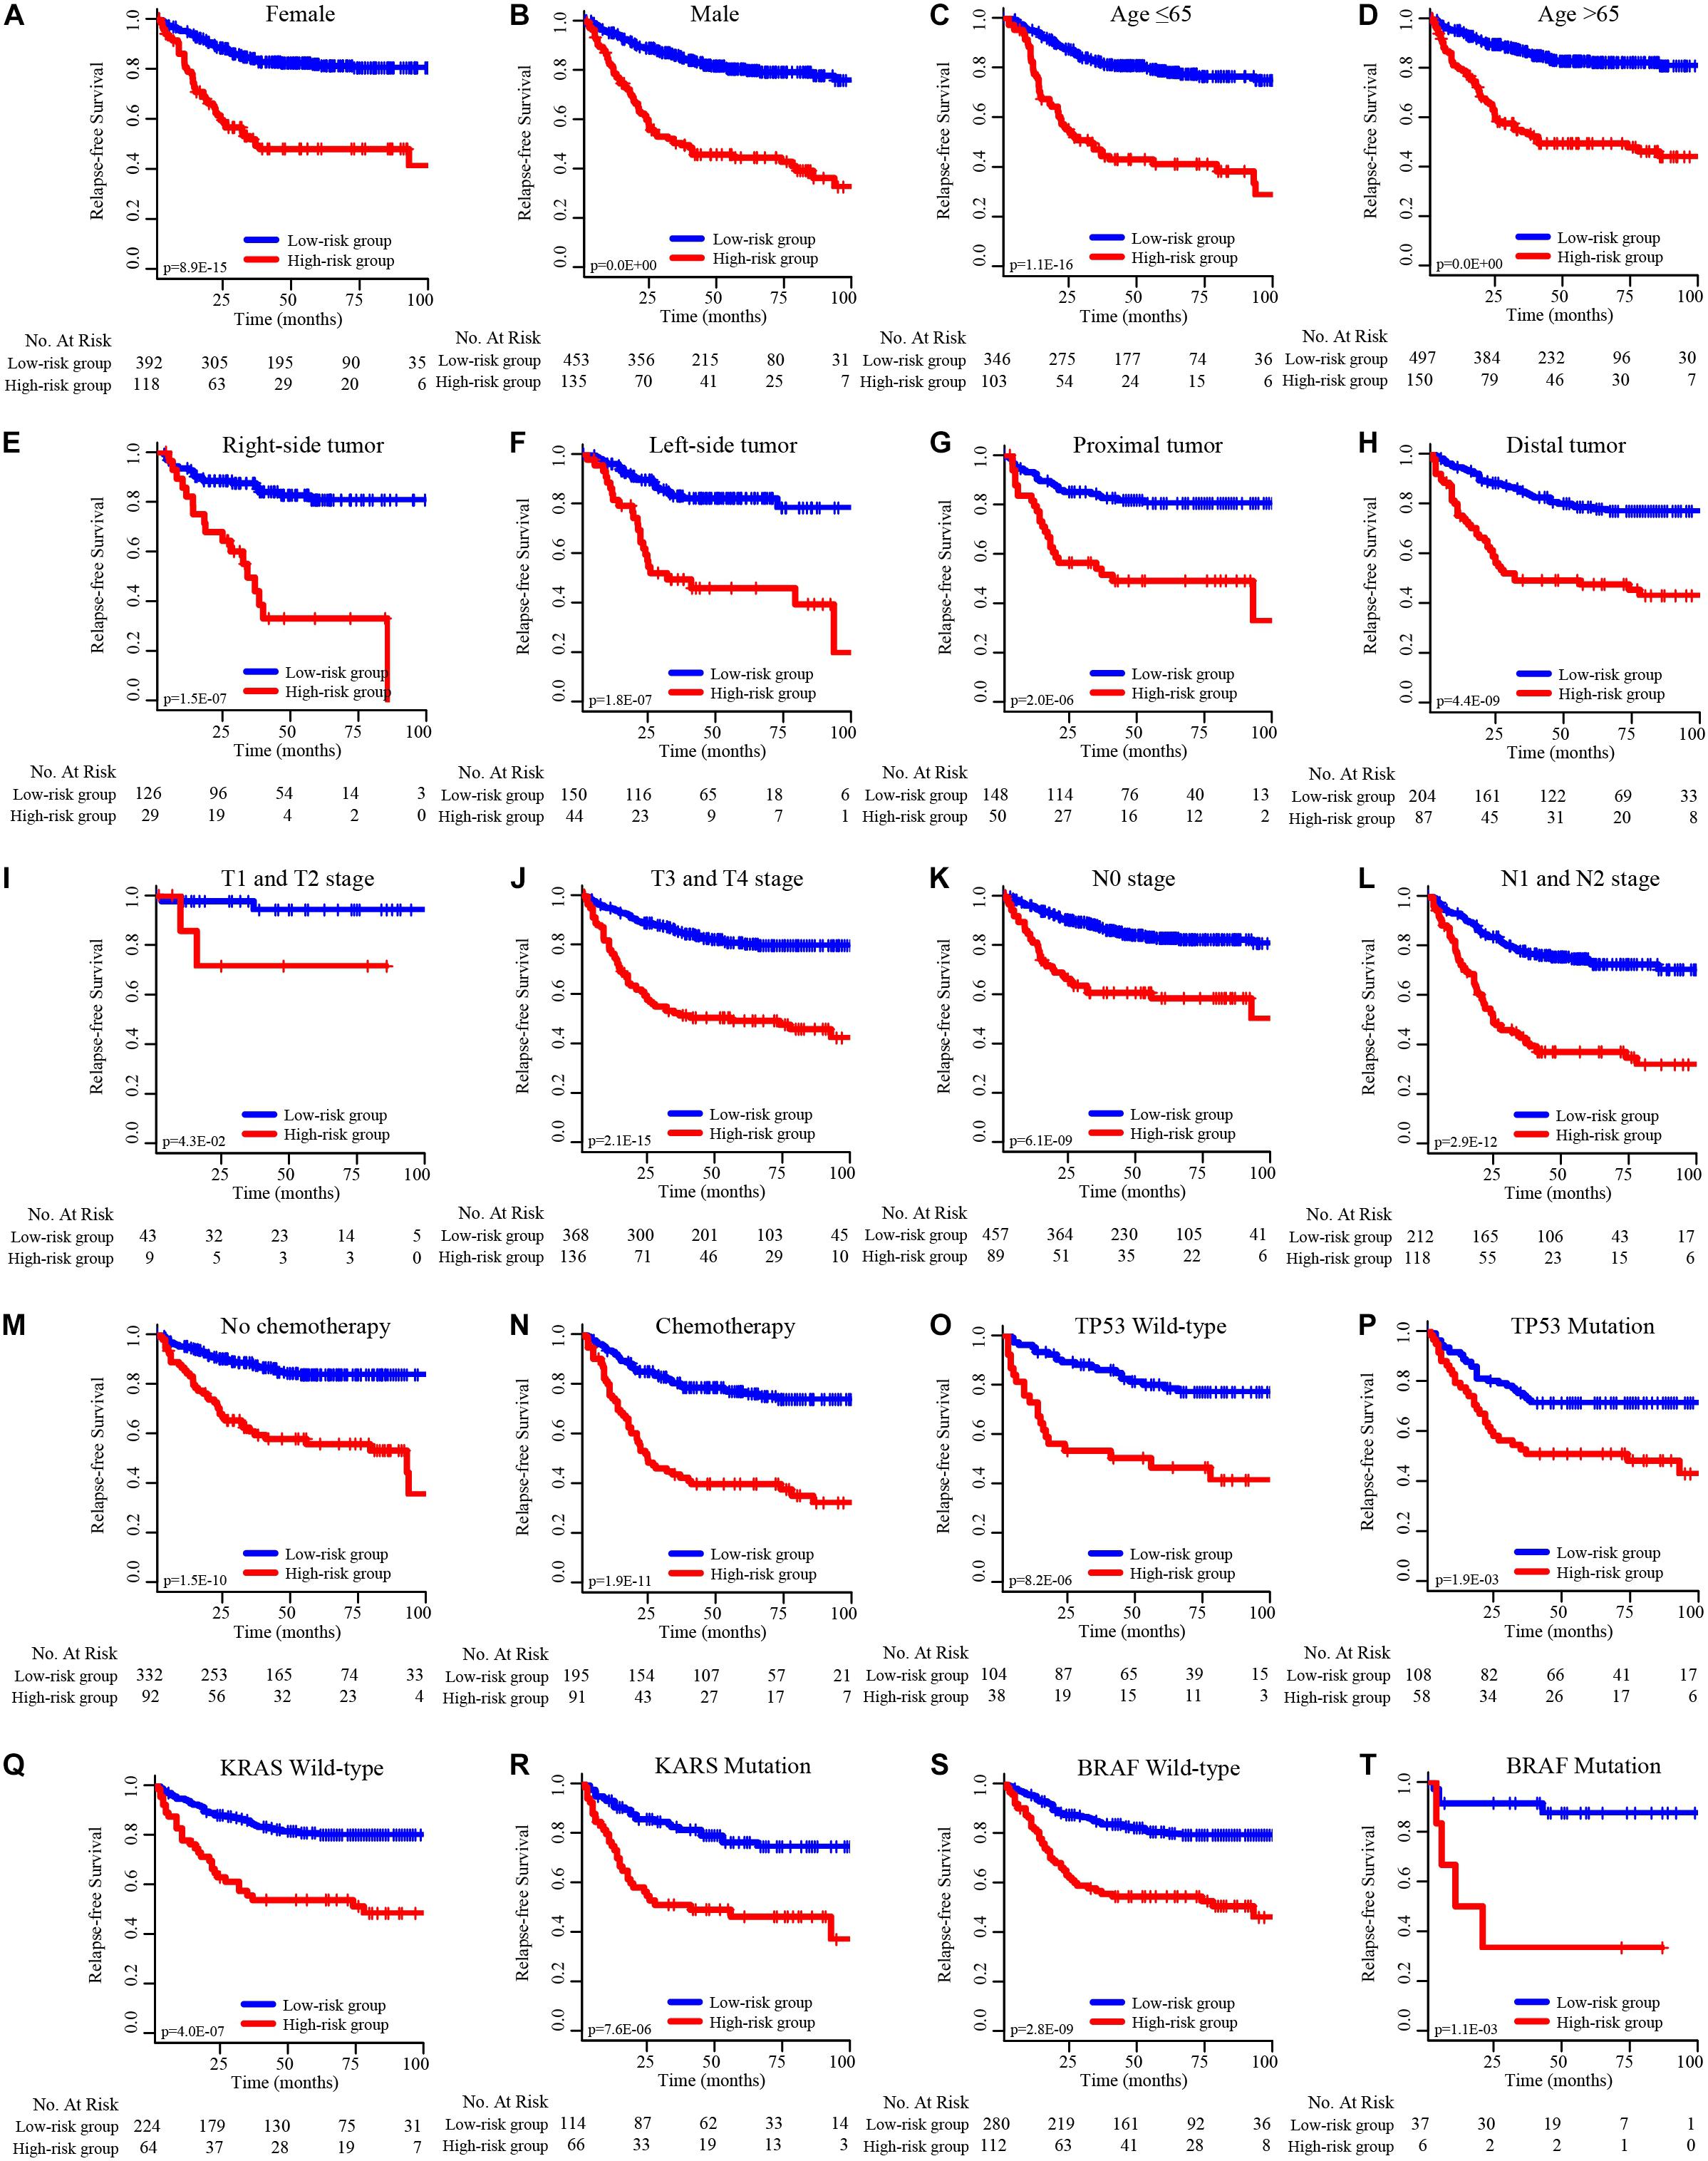
Figure 4. K–M survival subgroup analysis of all CRC patients according to the EMT-related gene signature stratified by clinical characteristics. (A) Female, (B) male, (C) age ≤ 65 years, (D) age > 65 years, (E) right-side tumor, (F) left-side tumor, (G) proximal tumor, (H) distal tumor, (I) T1 and T2 stage, (J) T3 and T4 stage, (K) N0 stage, (L) N1 and N2 stage, (M) no chemotherapy, (N) chemotherapy, (O) TP53 wild-type, (P) TP53 mutation, (Q) KRAS wild-type, (R) KRAS mutation, (S) BRAF wild-type, (T) BRAF mutation.
Functional Implication of the EMT-Related Gene Signature
Next, we further explored the potential functions and signaling pathways associated with EMT-related genes in tumorigenesis, tumor invasion and metastasis. The biological function pathway analysis indicated that the EMT-related gene signature plays functional roles in 20 markedly enriched biological pathways; most of these pathways are associated with the function of promoting tumor development and metastasis, including extracellular structure organization, cell junction organization, and regulation of the blood vessel size signaling pathway (Figures 5A,B). To further classify the above pathways, Gene Ontology (GO) analysis was performed; it divided the related significantly enriched biological pathways into four functional clusters: cell morphogenesis, cell development, cell junction assembly, and hydroxylysine metabolic process (Figure 5C). The above results indicate that the identified EMT-related genes are significantly enriched in critical cancer-related biological pathways involved in CRC progression.
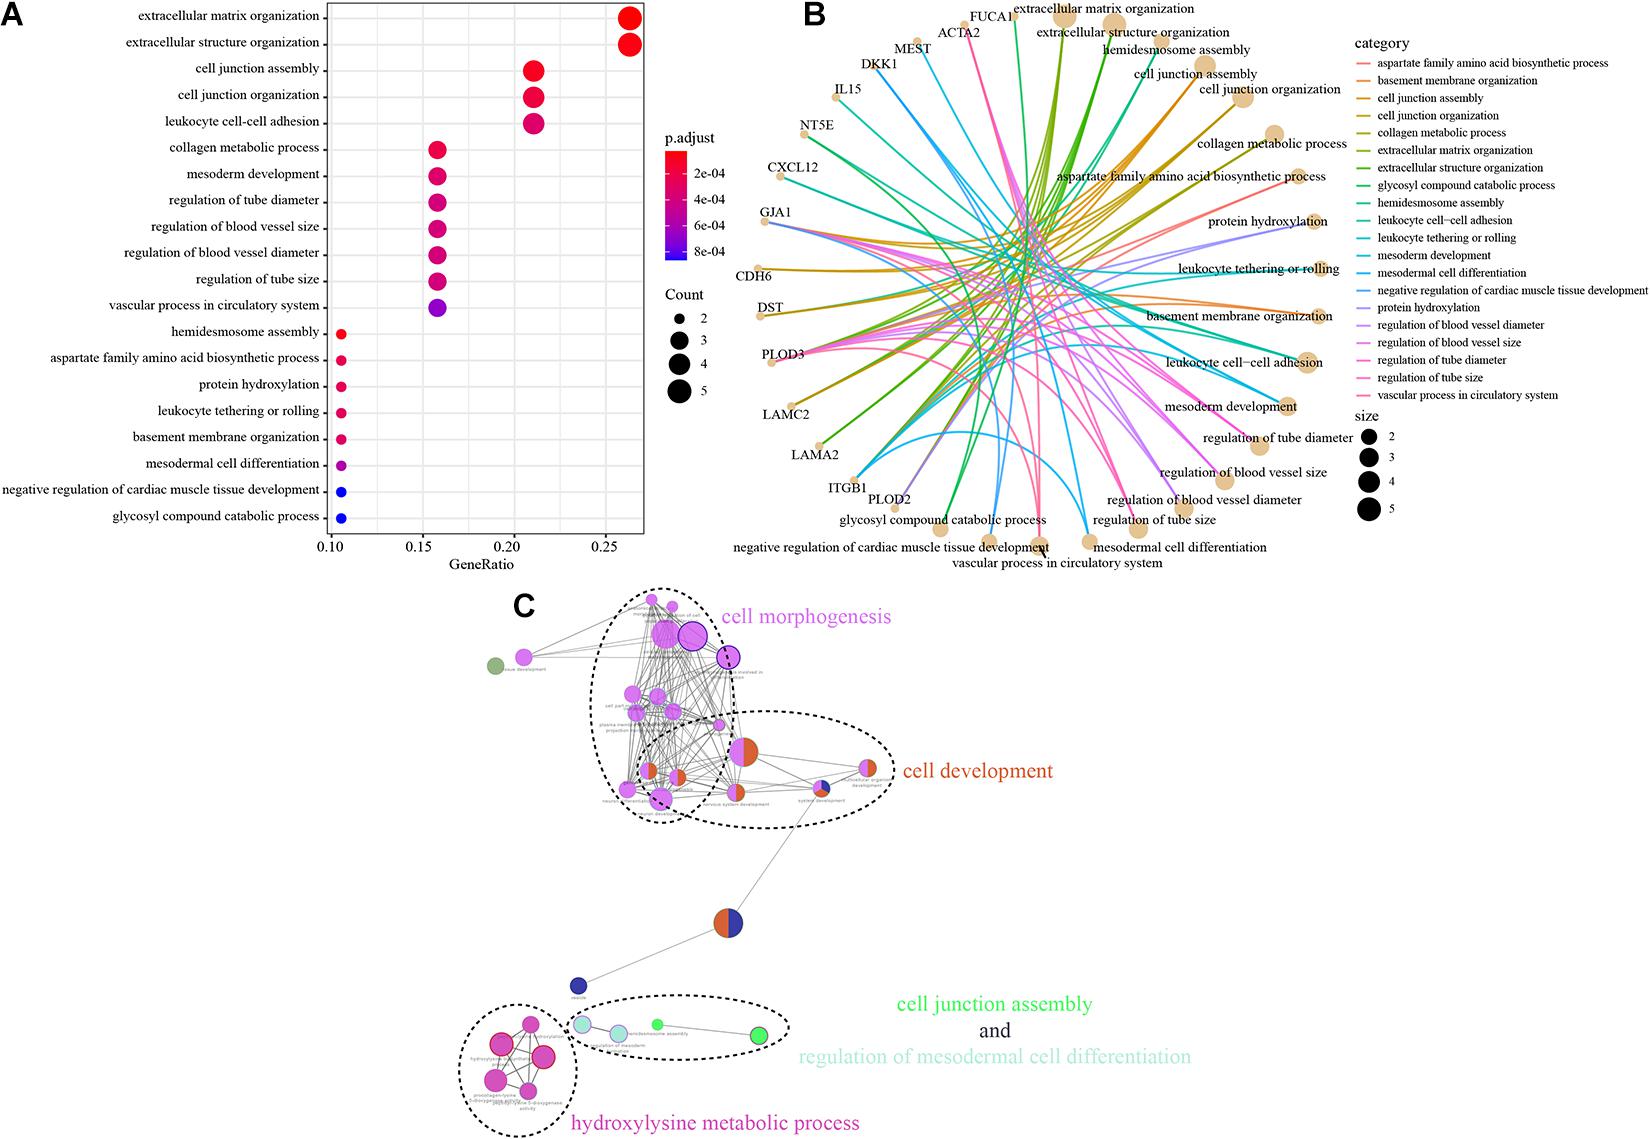
Figure 5. Functional analysis of the EMT-related gene signature. (A,B) The most significantly enriched KEGG pathways. The node size represents the number of genes in the pathways, and the color represents the pathway enrichment significance. (C) Functionally grouped network with enriched GO terms as nodes linked based on kappa score threshold of 0.4. Node size represents the term enrichment significance.
Loss-of-Function Assay of Selected EMT-Related Genes Monitoring Cell Proliferation and Metastasis
We evaluated the biological roles of the selected EMT-related genes in CRC. Of the 19 EMT-related genes, only CRLF1 was significantly associated with the prognosis of CRC at both the RFS (Supplementary Figure 7) and OS (Supplementary Figure 8) levels in the TCGA cohort. Then, to investigate the role of CRLF1 in CRC, we first examined CRLF1 expression levels in CRC cell lines. Notably, we observed higher CRLF1 expression in the RKO and DLD1 cell lines and lower CRLF1 expression in the LoVo cell line (Supplementary Figures 9A,B). Furthermore, we conducted a loss-of-function assay by knocking down the expression level of CRLF1 in the RKO and DLD1 cell lines (Supplementary Figures 9C,D). CCK-8 and colony formation assays were performed to examine whether CRLF1 expression affects CRC cell proliferation and viability in vitro. Cell proliferation and viability were significantly decreased in RKO-si-CRLF1 and DLD1-si-CRLF1 cells compared with si-NC cells (p < 0.05, Supplementary Figures 9E–G). Next, we aimed to confirm the metastasis-inhibiting role of CRLF1 downregulation. As shown in Figure S9H-S9K, silencing of CRLF1 significantly inhibited migration and invasion by RKO and DLD1 cells in vitro. To further determine the oncogenic effects of CRLF1 in promoting CRC proliferation and metastasis in vivo, CRLF1 knockdown and control cells were injected into male nude mice subcutaneously and into the distal tip of the spleen, and subcutaneous tumor growth and final tumor mass were monitored. Downregulation of CRLF1 in cancer cells led to a decrease in tumor growth rate and decreased final mean tumor volume compared with control cells (Supplementary Figures 9L–N). In addition, the mice injected with RKO-si-CRLF1 cells displayed liver metastases with fewer and smaller lesions (Supplementary Figures 9O,P). Taken together, the results of the loss-of-function assay suggest that CRLF1 may play a functional role in CRC proliferation and metastasis in vitro and in vivo.
Establishment and Evaluation of a Nomogram Incorporating the EMT-Related Gene Signature
Considering the results of univariable and multivariable analyses of RFS and OS (Supplementary Tables 8, 9), two types of nomograms incorporating the EMT-related gene signature into clinicopathological factors were established based on RFS (Figure 6A) and OS (Figure 6F) and used to quantify the possible risk of recurrence and overall prognosis for CRC patients in the GSE39582 cohort. The AUCs of the RFS nomogram and the OS nomogram were 0.750 (95% CI, 0.731–0.762), 0.796 (95% CI, 0.778–0.812), and 0.766 (95% CI, 0.745–0.787) (Figure 6B) and 0.826 (95% CI, 0.801–0.843), 0.763 (95% CI, 0.746–0.781) and 0.747 (95% CI, 0.731–0.762) (Figure 6G) at survival times of 1, 3, and 5 years, respectively. Calibration curves of the nomograms revealed no deviations from the reference line (Figures 6C–E,H–J). The results of decision curve analysis (DCA) also demonstrated that our nomogram had high potential for clinical utility (Supplementary Figure 10). To validate this result, the same protocol was applied to the TCGA cohort, and similar results were obtained (Supplementary Tables 10, 11 and Supplementary Figures 11, 12). The detailed standardized net benefits observed in the GSE39582 and TCGA cohorts are listed in Supplementary Table 12.
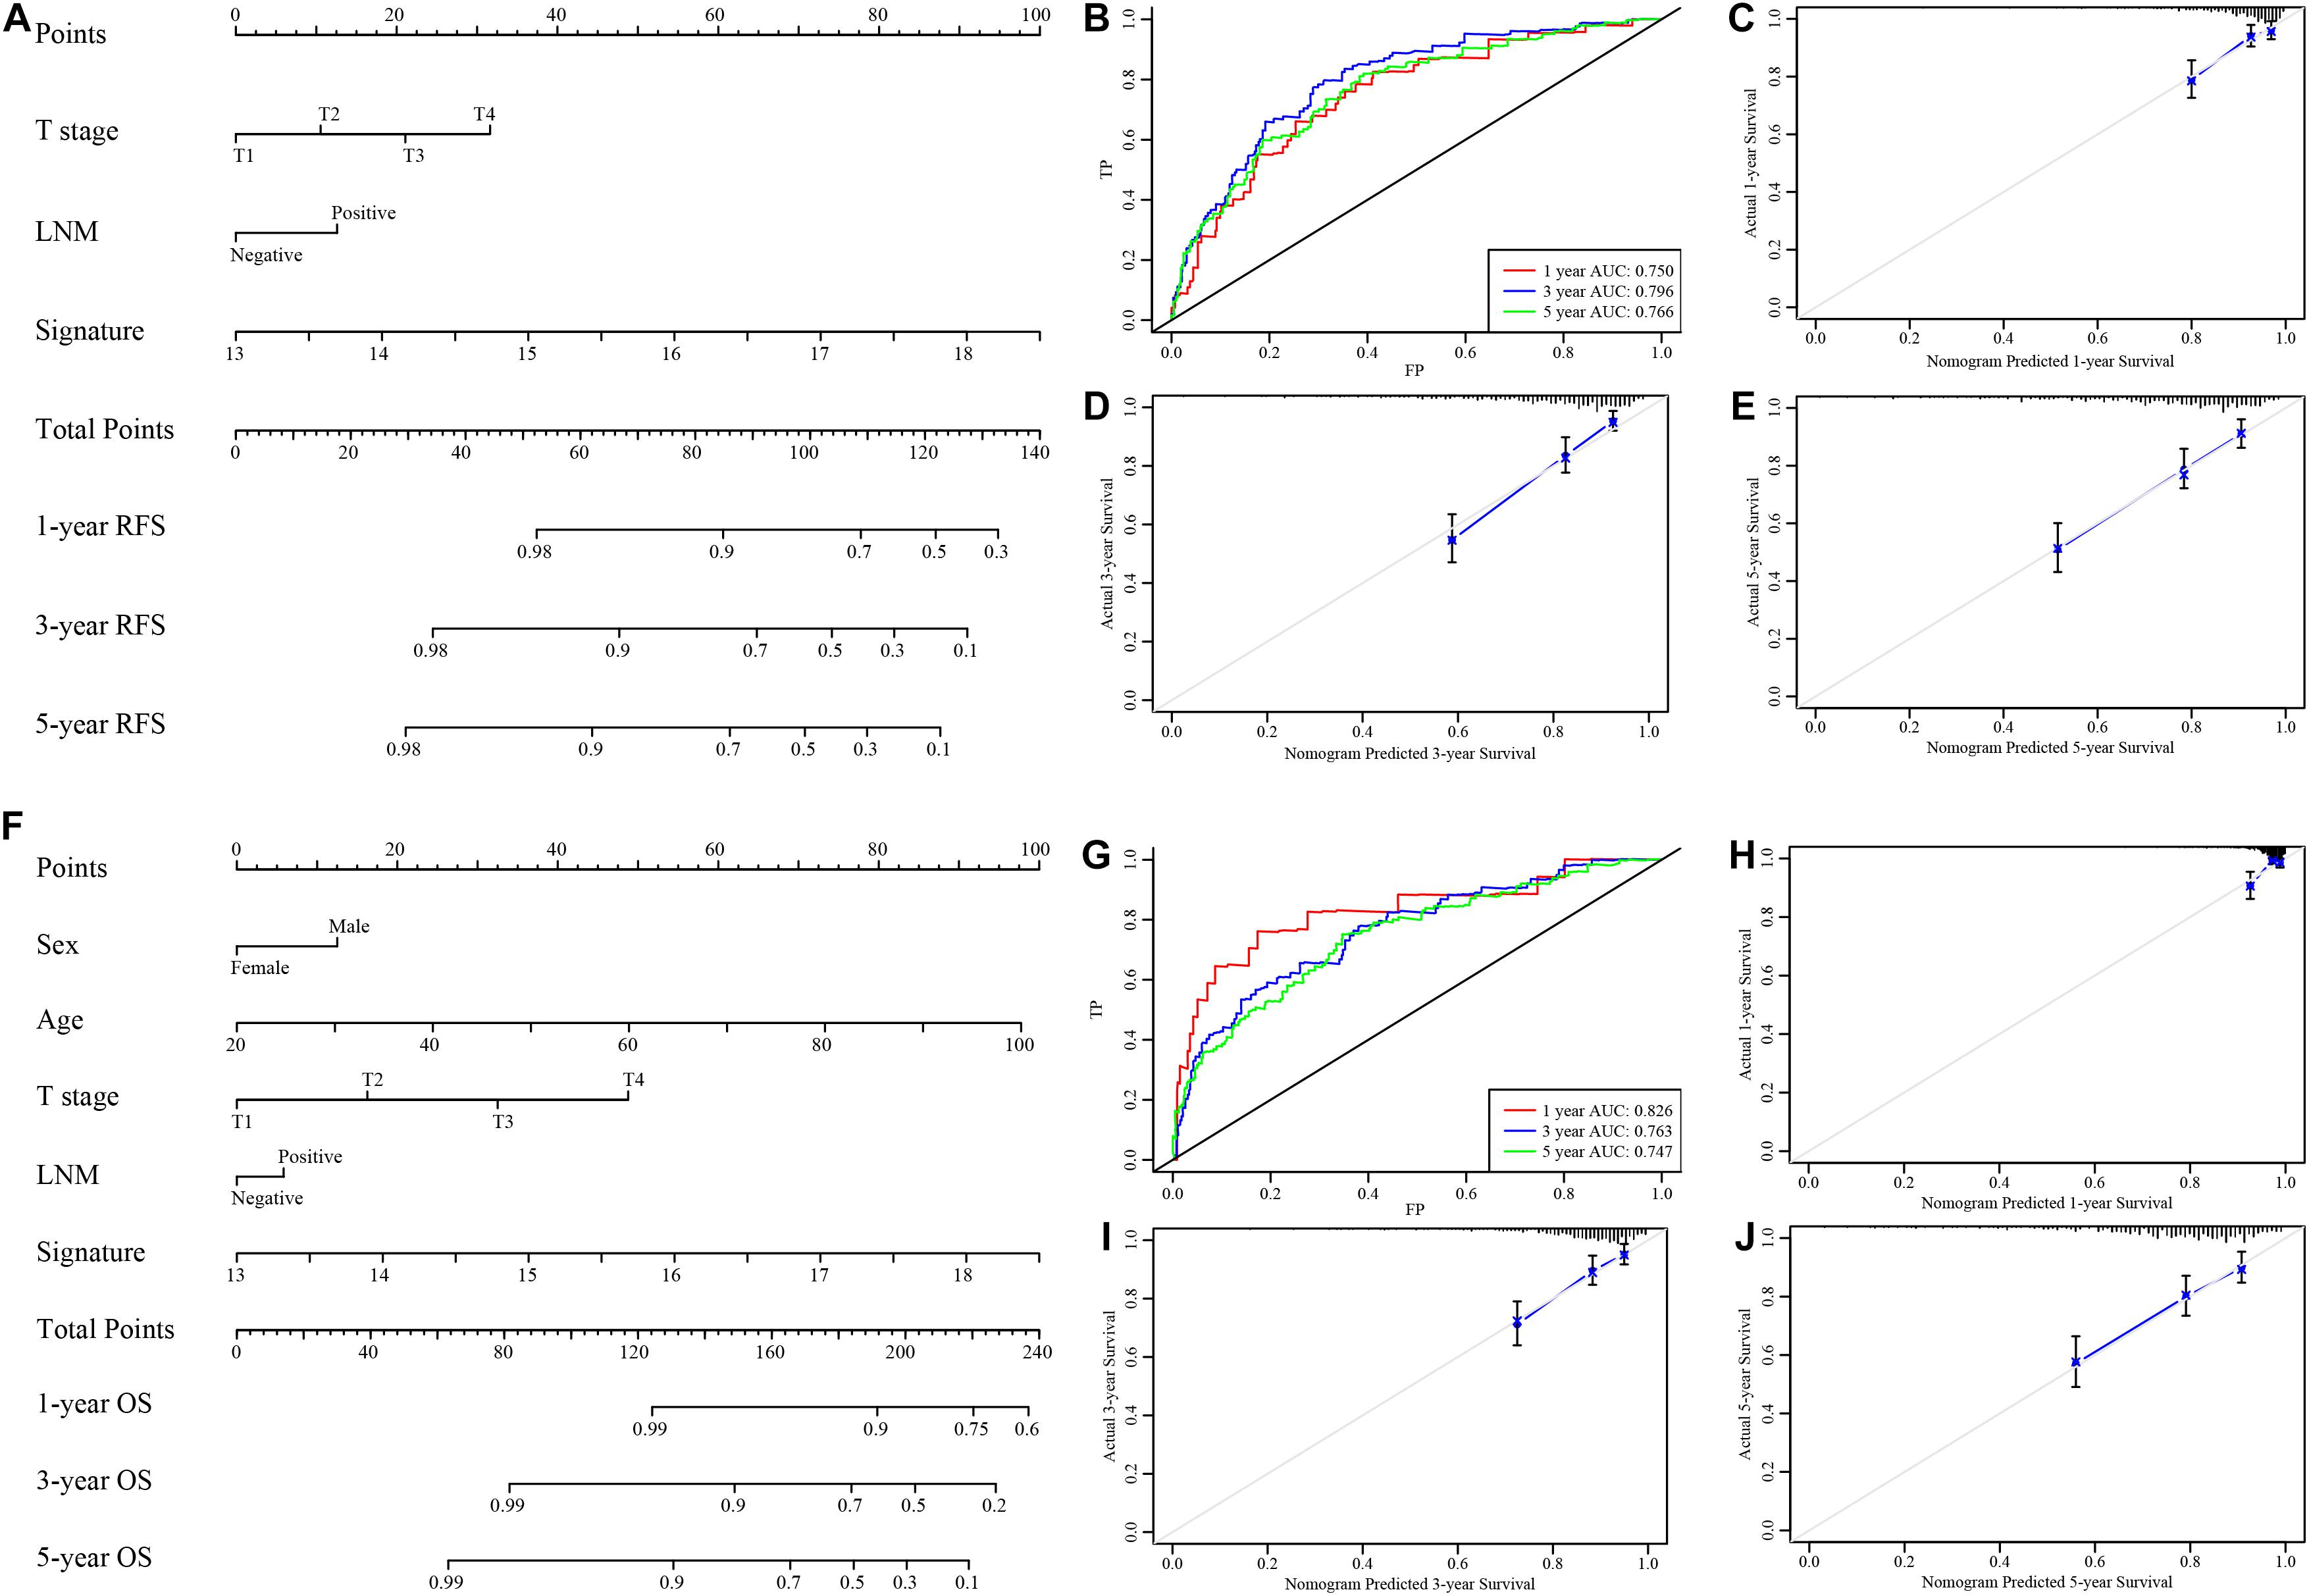
Figure 6. Nomograms to predict 1−, 3−, and 5-year RFS and OS in the GSE39582 set. (A) Nomogram for predicting the 1−, 3−, and 5-year RFS time in CRC patients. (B) Time-dependent ROC curve for RFS. The AUC was assessed at 1−, 3−, and 5-year. (C–E) Calibration curve for the prediction of 1−, 3−, and 5-year RFS. (F) Nomogram for predicting the 1−, 3−, and 5-year OS time in CRC patients. (G) Time-dependent ROC curve for OS. The AUC was assessed at 1−, 3−, and 5-year. (H–J) Calibration curve for the prediction of 1−, 3−, and 5-year OS.
Discussion
Lymph node metastasis is closely related to the postoperative recurrence of CRC and greatly affects patient survival. Clinical prognosis for stages I–III CRC often does not correspond to patients’ clinical situations due to their different genetic and epigenetic conditions (Bathe and Farshidfar, 2014). The availability of appropriate biomarkers for postoperative tumor progression would enhance the effectiveness of TNM classification and would enable physicians to formulate more individualized therapeutic and follow-up strategies.
The comprehensive transcriptome analysis conducted in the present study revealed the prognostic value of an EMT-related gene signature in CRC. Quantitative prediction results for CRC early relapse after surgical resection could be significantly improved. Applying the 19-EMT-related signature to CRC patients, obvious divergence between low-risk and high-risk patients’ recurrence and survival status was demonstrated. The signature identified in this study has been proven by several methods to be effective. The prediction results for CRC patients were highly accurate and consistent and were validated in several external independent cohorts. Furthermore, functional analysis showed that EMT-related genes are significantly enriched in cell morphogenesis, development, junctions, and critical cancer pathways that could play important roles in CRC relapse. In particular, a loss-of-function assay of selected genes indicated that EMT-related signature-associated coding genes might play functional roles in the sophisticated regulation of CRC proliferation and metastasis. By integrating the 19-EMT-related gene signature with clinicopathological factors, prognostic nomograms were constructed that can be used to predict RFS and OS probabilities at 1, 3, and 5 years after curative surgery and thereby assist clinical decisions.
The genes in the signature are strongly correlated with various types of cancer, as has been empirically proved by previous research. Of these, CXCL1, CXCL12, DKK1, FUCA1, LAMA2, ITGB1, LAMC2, NT5E, and PLOD2 have previously been reported to be strongly correlated with CRC. Wang et al. (2017) found that CXCL1 is critical for premetastatic niche formation and metastasis in CRC through its ability to recruit CXCR2-positive myeloid-derived suppressor cells. In addition, an association of high or strong expression of CXCL12 with better survival rate was observed by researchers studying CRC (Stanisavljevic et al., 2016). These conclusions about CXCL confirm the reliability of the formula established in this study. It was reported that gene expression or methylation levels of DKK1, FUCA1 and LAMA2 play a role in the occurrence, relapse and metastasis of CRC (Rawson et al., 2011; Lee et al., 2012; Ezawa et al., 2016; Rui et al., 2019). DKK1 is considered the upstream gene of the extracellular inhibitor of Wnt signaling. Thus, the amount of DKK1 methylation is closely related to prognosis status in CRC. It has also been observed that methylation of LAMA2 at the CpG site in CRC tumors was different compared to that in matched tumor-adjacent normal tissues. Thus, LAMA2 is hypermethylated in CRC and may serve as a potential biomarker of the tumor process. In patients with stage III CRC, 5-year RFS rates were significantly higher in an ITGB1-underexpression group than in an ITGB1-overexpression group, indicating that under expression of ITGB1is a risk factor for tumor recurrence, as was found in this study. Some scientists have demonstrated that ITGB1 alters the expression of N-cadherin, E-cadherin, and vimentin, proteins that are related to invasion and migration, thereby promoting invasive cell proliferation, motility, and metastasis (Ha et al., 2019). Huang et al. (2017) investigated the role of LAMC2 in CRC and suggested that overexpression of LAMC2, which was related to higher TNM stage and worse survival, promotes proliferation, migration, and invasion in CRC. Moreover, it was reported that patients with high serum NT5E expression had higher TNM stage and shorter OS than those with low NT5E expression. Du et al. (2019) demonstrated that PLOD2, which acts in the STAT3 signaling pathway, can inhibit the expression of HK2, leading to decreased cell proliferation, invasion and aerobic glycolysis in CRC cells and that higher PLOD2 expression correlated with longer OS. These findings further corroborate the signature established in this study.
The expression of CDH6, DPYSLE3, GJA1, IL15, and ACTA2 is also relevant to survival in many types of cancers, but its mechanism of action in CRC requires further study to explore its impact (Looyenga et al., 2013; Ji et al., 2018; Sun et al., 2018; Baek et al., 2019). Overexpression of CDH6 is closely associated with short OS in osteosarcoma patients. CDH6 expression was also found to be highly related to p53 expression in high-grade serous ovarian cancer (Ji et al., 2018). It has been reported that DPYSLE3 can reduce the expression of the EMT regulators SNAIL and TWIST and regulate cell proliferation in the CLOW subset of triple-negative breast cancers (Matsunuma et al., 2018). It was shown that GJA1 helps maintain cell differentiation and prevent transformation in endometrial carcinoma (Falck and Klinga-Levan, 2013). The expression of IL15 is a type of ramification in gastric cancer mesenchymal stem cells. Previous research demonstrated that IL15 can trigger the further expression of EMT and promote GC cell migration (Sun et al., 2018). It was also demonstrated that induction of ACTA2 by EGFR and HER2 dimerization is regulated through a JAK2/STAT1 signaling pathway and that abnormal ACTA2 expression accelerates the invasiveness and metastasis of breast cancer cells (Jeon et al., 2017).
In our research, we also identified certain genes, such as DST and CRLF1, that are worthy of further research. DST was reported to act as a tumor-specific alternative splicing factor in head and neck squamous cell carcinoma (Li et al., 2014). However, its relationship with cancers such as CRC needs further investigation. In view of the fact that high expression of CRLF1 is significantly related to poor prognosis, we evaluated the biological roles of CRLF1 in CRC. CRLF1 was significantly overexpressed in CRC cells. Remarkably, knockdown of CRLF1 expression significantly suppressed cell proliferation and migration capacity in the cells studied in vitro. Furthermore, downregulation of CRLF1 significantly inhibited the proliferation and metastasis of CRC cells in vivo. The loss-of-function assay indicated that CRLF1 might play functional roles in the sophisticated regulation of colon cancer progression, suggesting that it could be a potential therapeutic target for CRC.
This study indeed has some limitations. Firstly, it is based on data obtained from public datasets and does not include prospective testing in clinical trials. Besides, the underlying mechanism of action of the 19 identified EMT-related genes in the relapse of CRC will require further research.
Conclusion
We developed a 19-EMT-related mRNA signature that can be used to effectively sort CRC patients into low− and high-risk groups for postoperative relapse. Further functional analysis and loss-of-function assays showed that the identified EMT-related genes were significantly enriched in critical cancer pathways that could play important roles in CRC proliferation, metastasis and recurrence. Nomograms based on the EMT-related signature were developed and validated to assist physicians with clinical decision-making. Together, this comprehensive transcriptomic analysis highlights a functional role for the EMT-related gene signature and uncovers a potential prognostic and therapeutic biomarker for CRC.
Data Availability Statement
The datasets generated for this study can be found in online repositories. The names of the repository/repositories and accession number(s) can be found in the article/Supplementary Material.
Ethics Statement
The studies involving human participants were reviewed and approved by The Ethical Committee and Institutional Review Board of the Fudan University Shanghai Cancer Center. The patients/participants provided their written informed consent to participate in this study.
Author Contributions
SM, WD, and ZZ had the idea for this study and undertook the statistical analysis. WX and LH supervised the acquisition of the data. QL, GC, RW, YL, and LZ provided statistical advice. All authors contributed to interpretation of the results. SM, ZZ, and RG wrote the article. QL, LG, and SC revised the article and other authors contributed to the content. All authors approved the final version of the manuscript, including the authorship list.
Funding
This study was supported by the National Natural Science Foundation of China (Nos. 81702353 and 81802370), the Grant of National Natural Science Foundation of China (No. 81871958), the Grant of Science and Technology Commission of Shanghai Municipality (No. 16401970502), Shanghai Sailing Program (18YF1404200), and Shanghai Anticancer Association EYAS PROJECT (SACA-CY1A05). The funders had no role in the study design, data collection and analysis, decision to publish, or preparation of the manuscript.
Conflict of Interest
The authors declare that the research was conducted in the absence of any commercial or financial relationships that could be construed as a potential conflict of interest.
Acknowledgments
We thank the National Natural Science Foundation of China for the grant funding. We also acknowledge the contributions from GEO and TCGA databases.
Supplementary Material
The Supplementary Material for this article can be found online at: https://www.frontiersin.org/articles/10.3389/fcell.2021.681431/full#supplementary-material
Abbreviations
CRC, colorectal cancer; LNM, lymph node metastasis; FUSCC, Fudan University Shanghai Cancer Center; EMT, epithelial mesenchymal transformation; MET, mesenchymal-epithelial transition; TNM, tumor-node-metastasis; GEO, gene expression omnibus; TCGA, the Cancer Genome Atlas; DCA, decision curve analysis; GSVA, gene set variation analysis; GSEA, gene set enrichment analysis; AUC, the area under the curve; ROC, receiver operating characteristic; LIMMA, linear models for microarray data; DEGs, differentially expressed genes; LASSO, least absolute shrink-age and selection operator; RFS, relapse-free survival; OS, overall survival; K–M, Kaplan–Meier; DEEG, discrepantly expressed EMT-related genes; HR, hazard ratio; CI, confidence interval; SD, standard deviation.
Footnotes
- ^ http://dbemt.bioinfo-minzhao.org/
- ^ http://software.broadinstitute.org/gsea/msigdb/index.jsp
- ^ http://software.broadinstitute.org/gsea/index.jsp
- ^ http://www.ncbi.nlm.nih.gov/geo/
- ^ https://tcga.xenahubs.net
- ^ www.r-project.org
References
Baek, J. H., Yun, H. S., Kwon, G. T., Lee, J., Kim, J. Y., Jo, Y., et al. (2019). PLOD3 suppression exerts an anti-tumor effect on human lung cancer cells by modulating the PKC-delta signaling pathway. Cell Death Dis. 10:156.
Bathe, O. F., and Farshidfar, F. (2014). From genotype to functional phenotype: unraveling the metabolomic features of colorectal cancer. Genes 5, 536–560. doi: 10.3390/genes5030536
Beets-Tan, R. G., and Beets, G. L. (2004). Rectal cancer: review with emphasis on MR imaging. Radiology 232, 335–346. doi: 10.1148/radiol.2322021326
Bindea, G., Mlecnik, B., Hackl, H., Charoentong, P., Tosolini, M., Kirilovsky, A., et al. (2009). ClueGO: a Cytoscape plug-in to decipher functionally grouped gene ontology and pathway annotation networks. Bioinformatics 25, 1091–1093. doi: 10.1093/bioinformatics/btp101
Chen, D. T., Hsu, Y. L., Fulp, W. J., Coppola, D., Haura, E. B., Yeatman, T. J., et al. (2011). Prognostic and predictive value of a malignancy-risk gene signature in early-stage non-small cell lung cancer. J. Natl. Cancer Inst. 103, 1859–1870. doi: 10.1093/jnci/djr420
Chen, W., Zheng, R., Baade, P. D., Zhang, S., Zeng, H., Bray, F., et al. (2016). Cancer statistics in China, 2015. Cancer J. Clin. 66, 115–132. doi: 10.3322/caac.21338
De Craene, B., and Berx, G. (2013). Regulatory networks defining EMT during cancer initiation and progression. Nat. Rev. Cancer 13, 97–110. doi: 10.1038/nrc3447
Du, W., Liu, N., Zhang, Y., Liu, X., Yang, Y., Chen, W., et al. (2019). PLOD2 promotes aerobic glycolysis and cell progression in colorectal cancer by upregulating HK2. Biochem. Cell Biol. 98, 386–395. doi: 10.1139/bcb-2019-0256
Ezawa, I., Sawai, Y., Kawase, T., Okabe, A., Tsutsumi, S., Ichikawa, H., et al. (2016). Novel p53 target gene FUCA1 encodes a fucosidase and regulates growth and survival of cancer cells. Cancer Sci. 107, 734–745. doi: 10.1111/cas.12933
Falck, E., and Klinga-Levan, K. (2013). Expression patterns of Phf5a/PHF5A and Gja1/GJA1 in rat and human endometrial cancer. Cancer Cell Int. 13:43. doi: 10.1186/1475-2867-13-43
Friedman, J., Hastie, T., and Tibshirani, R. (2010). Regularization paths for generalized linear models via coordinate descent. J. Stat. Softw. 33, 1–22.
Ha, Y. J., Tak, K. H., Kim, S. K., Kim, C. W., Lee, J. L., Roh, S. A., et al. (2019). Biological characteristics and clinical significance of ITGB1 and RHOC in patients with recurrent colorectal cancer. Anticancer Res. 39, 4853–4864. doi: 10.21873/anticanres.13671
Hanada, H., Mugii, S., Takeoka, K., Maeda, I., Watanabe, M., Hidaka, Y., et al. (2009). Early detection of colorectal cancer metastasis and relapse by recognizing nonspecific cross-reacting antigen 2 in commercial carcinoembryonic antigen assays. Clin. Chem. 55, 1747–1748. doi: 10.1373/clinchem.2008.121897
Hanzelmann, S., Castelo, R., and Guinney, J. (2013). GSVA: gene set variation analysis for microarray and RNA-seq data. BMC Bioinform. 14:7. doi: 10.1186/1471-2105-14-7
Heagerty, P. J., and Zheng, Y. (2005). Survival model predictive accuracy and ROC curves. Biometrics 61, 92–105. doi: 10.1111/j.0006-341x.2005.030814.x
Huang, D., Du, C., Ji, D., Xi, J., and Gu, J. (2017). Overexpression of LAMC2 predicts poor prognosis in colorectal cancer patients and promotes cancer cell proliferation, migration, and invasion. Tumour Biol. 39:1010428317705849.
Irizarry, R. A., Hobbs, B., Collin, F., Beazer-Barclay, Y. D., Antonellis, K. J., Scherf, U., et al. (2003). Exploration, normalization, and summaries of high density oligonucleotide array probe level data. Biostatistics 4, 249–264. doi: 10.1093/biostatistics/4.2.249
Jeon, M., You, D., Bae, S. Y., Kim, S. W., Nam, S. J., Kim, H. H., et al. (2017). Dimerization of EGFR and HER2 induces breast cancer cell motility through STAT1-dependent ACTA2 induction. Oncotarget 8, 50570–50581. doi: 10.18632/oncotarget.10843
Ji, Q., Xu, X., Song, Q., Xu, Y., Tai, Y., Goodman, S. B., et al. (2018). miR-223-3p inhibits human osteosarcoma metastasis and progression by directly targeting CDH6. Mol. Ther. 26, 1299–1312. doi: 10.1016/j.ymthe.2018.03.009
Kitajima, K., Fujimori, T., Fujii, S., Takeda, J., Ohkura, Y., Kawamata, H., et al. (2004). Correlations between lymph node metastasis and depth of submucosal invasion in submucosal invasive colorectal carcinoma: a Japanese collaborative study. J. Gastroenterol. 39, 534–543. doi: 10.1007/s00535-004-1339-4
Lee, S., Oh, T., Chung, H., Rha, S., Kim, C., Moon, Y., et al. (2012). Identification of GABRA1 and LAMA2 as new DNA methylation markers in colorectal cancer. Int. J. Oncol. 40, 889–898.
Li, R., Ochs, M. F., Ahn, S. M., Hennessey, P., Tan, M., Soudry, E., et al. (2014). Expression microarray analysis reveals alternative splicing of LAMA3 and DST genes in head and neck squamous cell carcinoma. PLoS One 9:e91263. doi: 10.1371/journal.pone.0091263
Looyenga, B. D., Resau, J., and MacKeigan, J. P. (2013). Cytokine receptor-like factor 1 (CRLF1) protects against 6-hydroxydopamine toxicity independent of the gp130/JAK signaling pathway. PLoS One 8:e66548. doi: 10.1371/journal.pone.0066548
Matsunuma, R., Chan, D. W., Kim, B. J., Singh, P., Han, A., Saltzman, A. B., et al. (2018). DPYSL3 modulates mitosis, migration, and epithelial-to-mesenchymal transition in claudin-low breast cancer. Proc. Natl. Acad. Sci. U.S.A. 115, E11978–E11987.
Rawson, J. B., Manno, M., Mrkonjic, M., Daftary, D., Dicks, E., Buchanan, D. D., et al. (2011). Promoter methylation of Wnt antagonists DKK1 and SFRP1 is associated with opposing tumor subtypes in two large populations of colorectal cancer patients. Carcinogenesis 32, 741–747. doi: 10.1093/carcin/bgr020
Rui, Y., Hu, M., Wang, P., Zhang, C., Xu, H., Li, Y., et al. (2019). LncRNA HOTTIP mediated DKK1 downregulation confers metastasis and invasion in colorectal cancer cells. Histol. Histopathol. 34, 619–630.
Siegel, R. L., Miller, K. D., and Jemal, A. (2020). Cancer statistics, 2020. Cancer J. Clin. 70, 7–30.
Stanisavljevic, L., Assmus, J., Storli, K. E., Leh, S. M., Dahl, O., and Myklebust, M. P. (2016). CXCR4, CXCL12 and the relative CXCL12-CXCR4 expression as prognostic factors in colon cancer. Tumour Biol. 37, 7441–7452. doi: 10.1007/s13277-015-4591-8
Subramanian, A., Tamayo, P., Mootha, V. K., Mukherjee, S., Ebert, B. L., Gillette, M. A., et al. (2005). Gene set enrichment analysis: a knowledge-based approach for interpreting genome-wide expression profiles. Proc. Natl. Acad. Sci. U.S.A. 102, 15545–15550. doi: 10.1073/pnas.0506580102
Suh, J. H., Han, K. S., Kim, B. C., Hong, C. W., Sohn, D. K., Chang, H. J., et al. (2012). Predictors for lymph node metastasis in T1 colorectal cancer. Endoscopy 44, 590–595.
Sun, L., Wang, Q., Chen, B., Zhao, Y., Shen, B., Wang, X., et al. (2018). Human gastric cancer mesenchymal stem cell-derived IL15 contributes to tumor cell epithelial-mesenchymal transition via upregulation tregs ratio and PD-1 expression in CD4(+)T Cell. Stem Cells Dev. 27, 1203–1214. doi: 10.1089/scd.2018.0043
Tan, I. B., and Tan, P. (2011). Genetics: an 18-gene signature (ColoPrint(R)) for colon cancer prognosis. Nat. Rev. Clin. Oncol. 8, 131–133. doi: 10.1038/nrclinonc.2010.229
Trusolino, L., Bertotti, A., and Comoglio, P. M. (2010). MET signalling: principles and functions in development, organ regeneration and cancer. Nat. Rev. Mol. Cell Biol. 11, 834–848. doi: 10.1038/nrm3012
Vickers, A. J., and Elkin, E. B. (2006). Decision curve analysis: a novel method for evaluating prediction models. Med. Decis. Mak. 26, 565–574. doi: 10.1177/0272989x06295361
Wang, D., Sun, H., Wei, J., Cen, B., and DuBois, R. N. (2017). CXCL1 is critical for premetastatic niche formation and metastasis in colorectal cancer. Cancer Res. 77, 3655–3665. doi: 10.1158/0008-5472.can-16-3199
Zhao, M., Kong, L., Liu, Y., and Qu, H. (2015). dbEMT: an epithelial-mesenchymal transition associated gene resource. Sci. Rep. 5:11459.
Keywords: colorectal cancer, EMT, signature, prognosis, nomogram
Citation: Mo S, Dai W, Zhou Z, Gu R, Li Y, Xiang W, Han L, Zhang L, Wang R, Cai G, Cai S, Gan L and Li Q (2021) Comprehensive Transcriptomic Analysis Reveals Prognostic Value of an EMT-Related Gene Signature in Colorectal Cancer. Front. Cell Dev. Biol. 9:681431. doi: 10.3389/fcell.2021.681431
Received: 16 March 2021; Accepted: 25 May 2021;
Published: 15 June 2021.
Edited by:
Robson De Queiroz Monteiro, Federal University of Rio de Janeiro, BrazilReviewed by:
Mariana Boroni, National Cancer Institute (INCA), BrazilTalib Hassan Ali, University of Thi-Qar, Iraq
Copyright © 2021 Mo, Dai, Zhou, Gu, Li, Xiang, Han, Zhang, Wang, Cai, Cai, Gan and Li. This is an open-access article distributed under the terms of the Creative Commons Attribution License (CC BY). The use, distribution or reproduction in other forums is permitted, provided the original author(s) and the copyright owner(s) are credited and that the original publication in this journal is cited, in accordance with accepted academic practice. No use, distribution or reproduction is permitted which does not comply with these terms.
*Correspondence: Qingguo Li, b25jb3N1cmdlb25saUBzb2h1LmNvbQ==; Lu Gan, Z2FuLmx1QHpzLWhvc3BpdGFsLnNoLmNu; Sanjun Cai, Y2Fpc2FuanVuX3NoQDE2My5jb20=
†These authors have contributed equally to this work
‡These authors have jointly supervised this work