 Cong Chen
 Qing Xiang
 Jing Tao
- The Institute of Rehabilitation Industry, Fujian University of Traditional Chinese Medicine, Fuzhou, China
RNA m6A methylation plays an important role in the pathogenesis of type 2 diabetes mellitus (T2DM). RNA modifications and RNA-modifying regulators have recently emerged as critical factors involved in β-cell function and insulin resistance, including “writers,” “erasers,” and “readers.” However, their key roles in regulating gene expression in T2DM remain unclear. The construction of co-expression network could provide a cue to resolve this complex regulatory pathway. We collected the transcriptome datasets of β-cell in diabetic patients, calculated the partial correlation coefficient, excluded the influence from control variables of diabetes related genes, and identified the genes significantly co-expressed with m6A regulators. A total of 985 genes co-expressed with m6A regulators (Co-m6AR) were identified, which were enriched in metabolic process, MAPK and EGFR signaling pathways. Some of them have been confirmed to play a pivotal role in T2DM, including CCNL2, CSAD, COX5A, GAB2, and MIRLET7I, etc. Further, we analyzed the m6A modification characteristics of Co-m6AR in β-cell and identified 228 Co-m6AR containing m6A methylation sites, involving in several key signaling pathways regulating T2DM. We finally screened out 13 eQTL-SNPs localized in Co-m6ARs, and 4 have been reported strongly associated with diabetes, including GAB2, LMNB2, XAB2, and RBM39. This co-expression analysis provides important information to reveal the potential regulatory mechanism of RNA m6A methylation in T2DM.
Introduction
Type 2 diabetes mellitus (T2DM) is considered a major health problem worldwide. This complicated metabolic disorder is characterized by chronic hyperglycemia, which can trigger β-cell function impairment, insulin resistance, and deficiency. However, the pathogenesis of T2DM remains unclear. The critical factor of T2DM is an inadequate functional islet β-cell mass, and a variety of risk factors can lead to islet β-cell dysfunction, either due to a reduced β-cell mass, or to inadequate β-cell phenotype and functional maturity (Dayeh and Ling, 2015). Insulin dysfunction can induce toxicity in different tissues leading to pathological and functional changes in multiple organs (Singh et al., 2001; Giacco and Brownlee, 2010; Reusch and Manson, 2017). A classical insulin resistance mechanism consists in dysregulated insulin signaling with impaired phosphorylated insulin receptor substrates (IRSs)(Copps et al., 2016) and other altered factors such as insulin-regulated Ser/Thr kinases, AMP-activated protein kinase, and glucose transporter 4.
Epigenetic modifications on DNA, RNA, and proteins may provide the link gene expression into pathological mechanisms of T2DM. Studies have shown different patterns of epigenetic regulation of DNA and proteins, but RNA modifications in T2DM remain poorly understood (He, 2010). N6-methyladenosine (m6A) is one of the most abundant post-transcriptional modifications on eukaryote RNA. Over 7000 human transcripts contain at least one m6A site, enriched in the coding sequence and the 3’untranslated region (3’UTR), near the stop codon of mature polyadenylated mRNAs (Dominissini et al., 2012; Meyer et al., 2012). RNA m6A modifications of the eukaryotic transcriptome can modulate mRNA splicing, export, localization, translation, and stability (Wang et al., 2014; Liu et al., 2015). The function of this modification is controlled by a series m6A regulator. Intracellular m6A regulation is dynamic and reversible, which is composed of methyltransferases (writers) and demethylases (erasers), including METTL3, METTL14, WTAP, KIAA1429, and RBM15 (Bokar et al., 1997; Liu et al., 2014), fat mass and obesity-associated protein (FTO) (Jia et al., 2011) and alkylation repair homolog protein 5 (ALKBH5) (Zheng et al., 2013; Fedeles et al., 2015). On the other hand, recruiting m6A-binding proteins called “readers” can specifically bind to m6A-modified transcripts including the nuclear YTHDC1 and the cytoplasmic TYHDC2, YTHDF1, YTHDF2, and YTHDF3 (Wang et al., 2014).
Homeostasis of m6A modifications on RNA is essential for the regulation of human transcripts expression in T2DM. Demethylase FTO is the first gene strongly associated with adipose mass and obesity in β-cells (Scuteri et al., 2007; Taneera et al., 2018), positively correlated with serum glucose (Blauth and Falliner, 1986), and closely associated with metabolic alterations, cardiovascular diseases, and T2DM (Boissel et al., 2009; Church et al., 2010; Lee et al., 2014). FTO knockout mice exhibit growth retardation, weight loss, and heart defects (Boissel et al., 2009; Christian et al., 2014), whereas FTO-overexpressing mice present obesity, weigh gain, and enhanced food intake (Church et al., 2010). Recently, m6A sequencing of human T2DM islets revealed that the coefficient of variation of m6A methylation regulators is higher in patients with T2DM than in controls, with m6A in the patients with T2DM regulating β-cell gene expression to a higher extent than in controls (De Jesus et al., 2019). Further studies have shown that m6A methylated RNA and METTL3 levels are consistently higher in liver tissues of patients with T2DM than in controls; hepatocyte-specific knockout of METTL3 in mice fed with a high-fat diet (HFD) increases insulin sensitivity and decreases fatty acid synthesis (Xie et al., 2019). METTL3 significantly modulated HFD-induced metabolic disorders, insulin sensitivity, and hepatogenic diabetes (Li et al., 2020). In addition, m6A and RNA sequencing of diabetic hippocampi revealed that the alteration of m6A modifications might cause hippocampal neuron damage and further lead to cognitive impairment in patients with T2DM (Song et al., 2020). Collectively, studies have strongly indicated that m6A modifications may play a role in the pathogenesis of T2DM, but the biological role and the underlying mechanism of m6A still need to be explored.
Co-expression analysis is an effective bioinformatics method that has not been applied to analyze the mechanism of gene regulation. The construction of gene expression regulatory network by co-expression analysis has been widely used in the regulation of growth and development and the pathogenesis of various diseases. However, this method has not been applied to analyze the regulation of m6A regulator on T2DM. In the system composed of multiple variables, when studying the influence or correlation degree of one element on another, the influence of other elements is regarded as constant, that is, the influence of other factors is not considered temporarily, and the degree of the relationship between the two elements is studied separately. The numerical results are partial correlation coefficient. Thus, the utilization of partial correlation coefficient to analysis of co-expression is a powerful method. In the reported m6A profiling analysis, they only explore the regulatory genes of m6A regulator through differential expression (Scuteri et al., 2007; Taneera et al., 2018). Although this analysis method can display more information, it could not reveal the key influencing factors. Co-expression analysis can mine the most critical related genes from a large sample study. If combined with m6A profiling, it is relatively more able to dig out the key regulatory mechanisms.
To investigate the correlation of m6A modifications with human transcripts expression in patients with T2DM, we collected methylated RNA immunoprecipitation (MeRIP)-seq and RNA-seq transcriptome samples from human islet β-cells, and found 15 differentially expressed m6A genes and used these for analysis, including METTL3, FTO, and YTHDF1, etc. We further identified the potential human transcripts associated with m6A genes based on the partial correlation coefficient. Our analyses of GO and KEGG pathway enrichment revealed that most of the identified human transcripts were involved in metabolic pathway and MAPK1/MAPK3 signaling, which is a critical biological process controlling the pathogenesis and development of T2DM, suggesting that mRNA m6A methylation plays a crucial role in T2DM.
Materials and Methods
Datasets
We downloaded the gene expression profile of GSE50398 from the GEO database, a free and openly available database. The dataset used Agilent GPL6244 Platform and includes the genome-wide mRNA expression data of the 178 samples. We downloaded the processed data, that gene and exon expression normalizations have been carried on by the TMM method (Robinson and Oshlack, 2010) and further normalization has been performed using the adjusting the expression to gene or exon length, respectively.
Partial Correlation
We defined gene expression datasets as random variables G, expression of m6A regulators (Supplementary Table 1) as random variables M, and the expression matrix of diabetes-related genes (Supplementary Table 2) as control variable D. The partial correlation coefficient ρ reflects the association between G and M, where the effects of D are removed. Given the linear regression of G with D and the linear regression of M with D, the ρ is calculated as the linear correlation between the two residuals.
The calculation of partial correlation coefficient, the variable m6A factor x, the reference variable diabetes factor Z, the variable gene y to be analyzed, and the partial correlation coefficient between x and y were calculated after excluding the influence of Z variable:
The H0 of partial correlation coefficient test is the partial correlation coefficient of two variables in the population is 0. Using t-test method, the formula is as follows:
Where r is the corresponding partial correlation coefficient, n is the number of sample observations, K is the number of control variables, and n-k-2 is the degree of freedom. When p < 0.05, the original hypothesis is rejected.
Differential Expression
We analyzed the differentially-expressed genes in pancreatic islet β-cells between T2DM patients and healthy volunteers using GEO2R, based on R language, an online analysis tool for the GEO database. According to the GEO2R criteria, we identified genes as differentially-expressed if logFC > 2 (upregulated genes) or logFC < -2 (downregulated genes). Significant differences have been statistically tested and the FDR-adjusted P value has been applied, that FDR is an adjusted P value to trim false positive results. We considered adjusted P values < 0.05 as statistically significant and used the calculated value to decrease the false positive rate.
Gene Ontology and KEGG Pathway Analysis of Differentially Expressed Genes
We used gene ontology (GO) analysis to annotate genes and classify their functions into biological pathways, molecular function, and cellular components (Scuteri et al., 2007). The Kyoto Encyclopedia of Genes and Genomes (KEGG) is a set of databases that disposes biological pathways and genomes related to diseases and drugs. KEGG is a channel promoting an overall and deep understanding of biological systems (Kanehisa, 2002). An FDR-corrected p-value has been utilized, and we set a p < 0.05 as the cut-off criterion for statistically significant differences. Cellular components, molecular functions, and biological processes were analyzed using the DAVID online database (Huang da et al., 2009a,b).
Co-expression Network Analysis
We assessed and constructed the co-expression network of differentially-expressed genes. Flat expression patterns across samples in the derivation dataset were filtered out by excluding genes with standard deviations ≤ 0.1. We calculated the partial correlation coefficient, ρ, for each pair of genes, and we defined all gene pairs with ρ ≥ 0.3 as gene-gene associations in the network. In the co-expression network, the nodes represent genes and the edges represent the connections with coefficient ≥ 0.3.
eQTL Analysis
The trans-eQTL were download from eQTLGen database1. This database incorporates 37 datasets with a total of 31,684 individuals and established to identify the downstream consequences of trait-related genetic variants. the cis-eQTL, trans-eQTL, eQTS and replication results are available on this website. This database contains the trans-eQTL results for about 10,000 known genetic risk variants. The statistically significant trans-eQTLs are browsable, the full results were downloaded for further analysis. The m6A peaks were defined as a 100 bp region overlapping the m6A position which sequenced by Jesus group (De Jesus et al., 2019).
Software Tools
We used hierarchical cluster analysis to show the volcano plot and heat map of two groups on ImageGP website2. The network generation and statistical calculations were analyzed by the (R-platform) Affy package (Gautier et al., 2004). We generated a functional co-expression network annotation using PNATHER (Thomas et al., 2003; Mi et al., 2013). We used the DAVID tool to perform GO enrichment and KEGG analyses, and to estimate network candidate communities on the basis of their associations with functional annotations (Huang da et al., 2009b).
Results
Strategy
Figure 1A depicts our analysis strategy. First, we collected the transcriptome data of islet cells from diabetic patients and controls from published datasets. Then, we analyzed the differential expression of RNA m6A methylation regulators, including methyltransferases, demethylases, and methylation readers. Then we used genes associated with diabetes pathways as the control variables to calculate partial correlation coefficients, and we screened the genes co-expressed with RNA m6A regulators based on partial correlation coefficient factors. Next, we downloaded the published RNA m6A modification profiles of islet beta cells, analyzed the overlapping parts with the above identified genes, and further analyzed the potential biological functions of these genes through the GO enrichment and KEGG pathway analysis. Finally, we screened the trans-eQTL localized in the m6A peak of genes in our list.
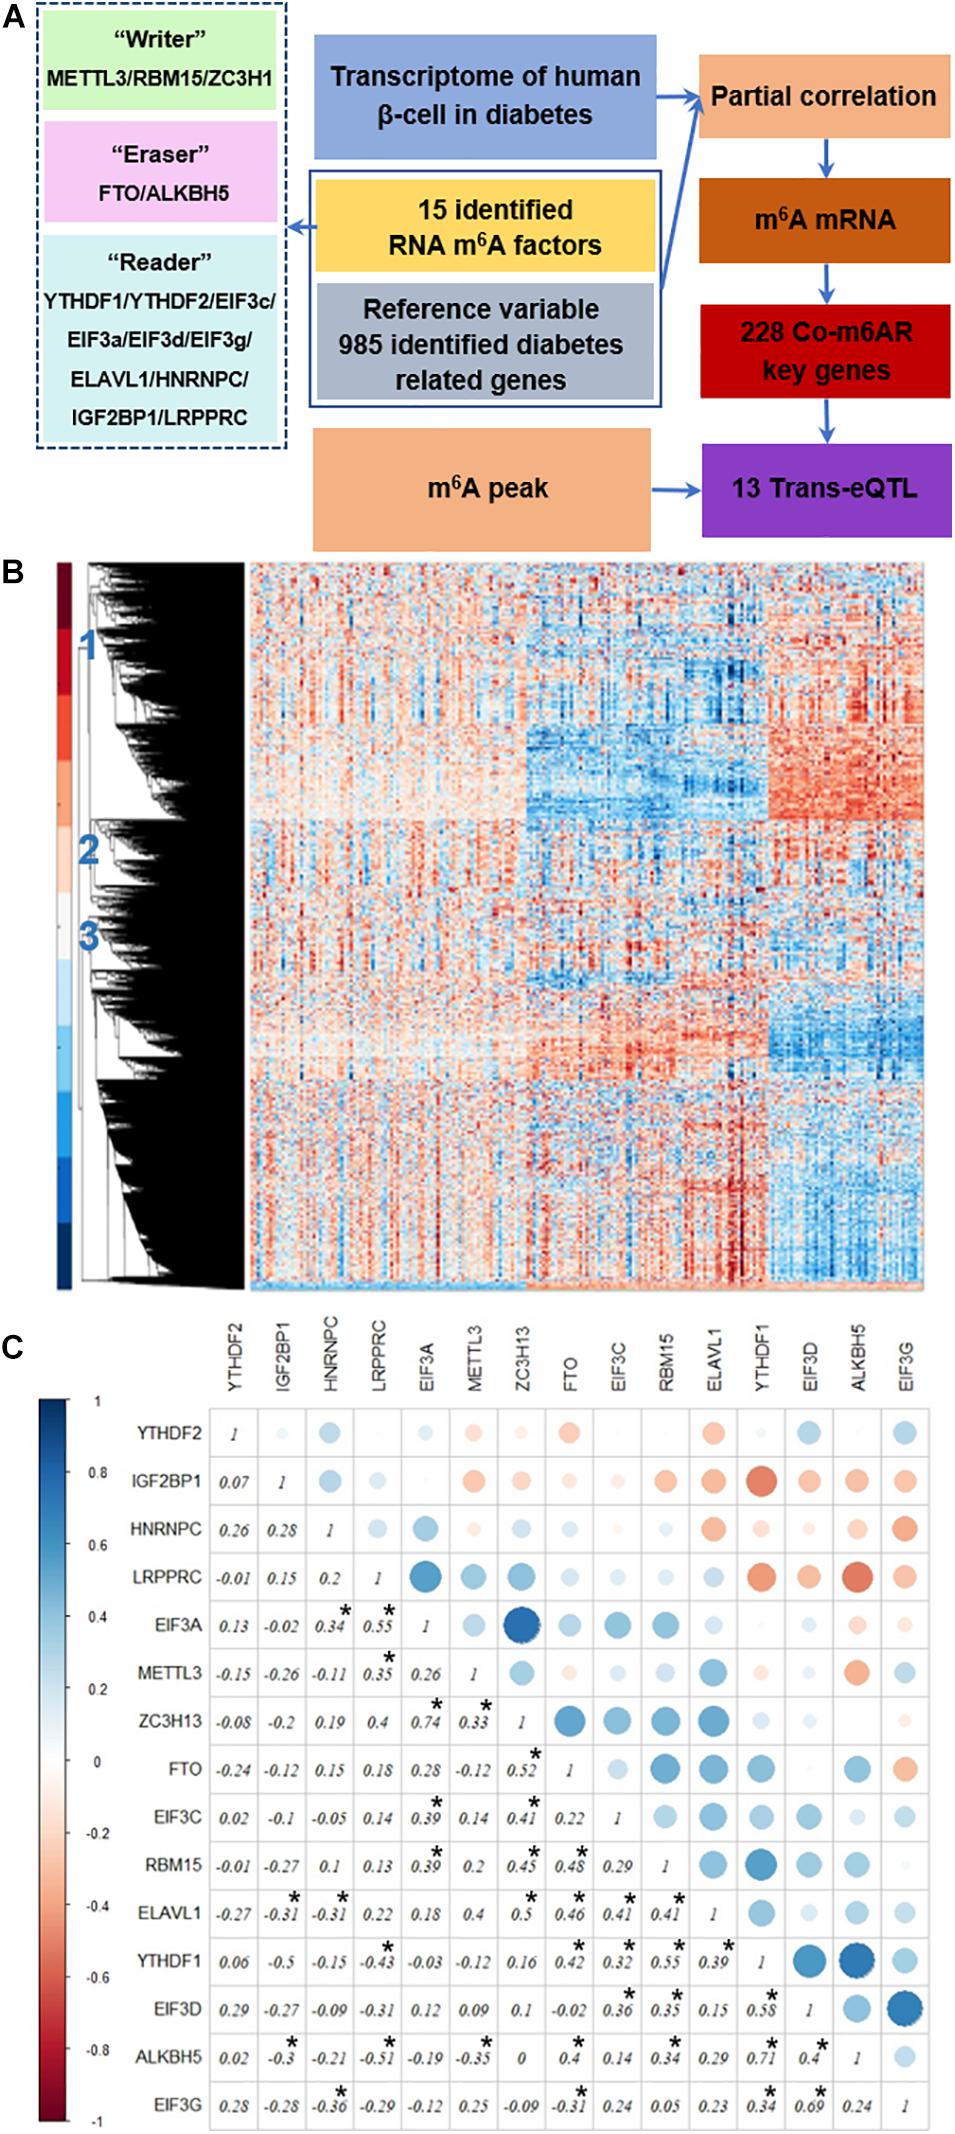
Figure 1. Strategy to identify co-expressed genes with m6A regulators. (A) Strategy. The transcriptome data of islet β-cells from T2DM patients and controls was applied, then the genes co-expressed with RNA m6A regulators was then detected due to the partial correlation coefficient factors, co-m6AR genes were further identified based on the published RNA m6A modification profiles of β-cells, and finally screened out 13 eQTL-SNPs. (B) Transcriptome heatmap of detected genes with their differential expressions in control versus T2DM islet β-cells. Three types of differential expressed genes have been marked. (C) Co-expression among m6A regulators. The correlation coefficients of 15 RNA m6A methylation regulators have been shown and marked with black asterisk.
Co-expression Among RNA m6A Regulators in T2DM
We downloaded the transcriptome datasets of human islet beta cells from 178 T2DM cases. These data had been obtained by gene chip detection, and 12261 genes were detected. The transcriptional heatmap in Figure 1B shows detected genes with their differential expressions and classified mainly into three types of expression patterns. We found 15 differentially-expressed genes among 20 RNA m6A methylation regulators, including EIF3C, FTO, METTL3, RBM15, etc; and 40 differentially-expressed genes among 46 diabetes related factors. We calculated the correlation coefficients of 15 RNA m6A methylation regulators by Pearson coefficient, and found a small correlation between them (Figure 1C). Among those, the correlation coefficient between ZC3H13 and EIF3a was 0.74, that between ALKBH5 and YTHDF1 was 0.71, that between EIF3G and EIF3D was 0.69, that between LRPPRC and ALKBH5 was -0.51, that between LRPPRC and YTHDF1 was -0.43, and that between EIF3G and HNRNPC was −0.36.
Genes Co-expressed With RNA m6A Regulators (Co-m6AR)
We used partial correlation coefficients to calculate the association between genes and 15 RNA m6A regulators (Supplementary Table 3). In the global analysis, the correlation coefficient distribution approximated the normal distribution, ranging from 0.658 to -0.671 (Figure 2A). Figure 2B shows that the maximum correlation coefficient between EIF3G and ETHE1 was 0.658, while the correlation coefficient between METTL3 and L1TD1 was the smallest at 0.671. More than 3000 genes had partial correlation coefficients close to 0. We set the threshold value at 0.35; therefore, co-expressed genes have an absolute value of correlation coefficient greater than 0.35. Our results show that the number of genes associated with the expression of ALKBH5 is the largest (approximately 150) followed by those associated with METTL3 (approximately 140 genes), and those associated with EIF3G expression (approximately 115 genes) (Figure 2C). The number of genes associated with FTO expression was the smallest (approximately 30 genes). The heatmap shows the large differences in transcriptional profiles of these clustered genes (Figure 2D).
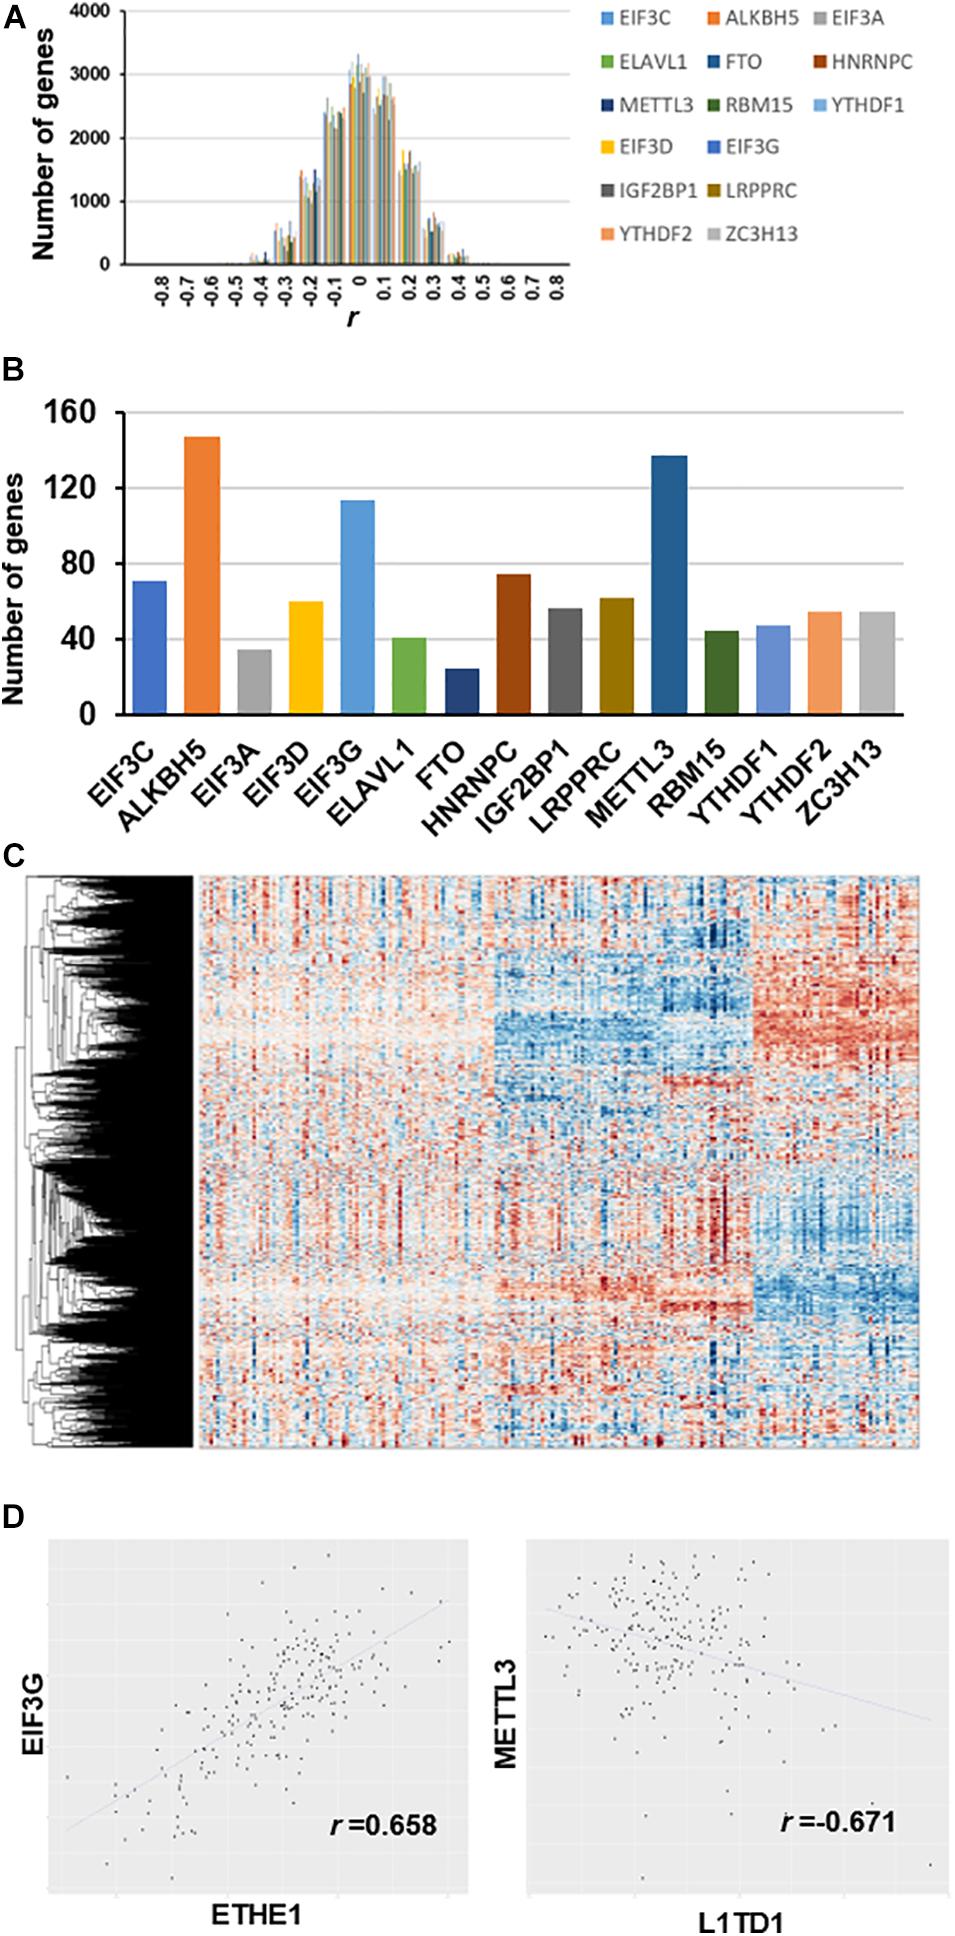
Figure 2. Co-expression between genes and m6A regulators after removal of diabetes related gene effects. (A) Distribution of partial correlation coefficient. The correlation coefficient distribution ranged from 0.658 to –0.671. (B) Number of genes co-expressed with each m6A regulator (r > 0.35). (C) Transcriptome heatmap of differential co-expressed genes in control versus T2DM islet β-cells. (D) Scatterplot of gene expression with top value of partial correlation coefficient.
Co-m6AR Genes Are Enriched in T2DM-Associated Biological Processes
To acquire a more comprehensive and deep understanding of the identified differentially-expressed genes, we used the DAVID tool to analyze GO function and KEGG pathway enrichments (Figure 3). The 985 identified m6A-associated genes with high significant enrichment levels were enriched in diverse biological processes, such as metabolic process, MAPK1/MAPK3 signaling, the T cell receptor signaling pathway, and EGFR signaling (Figure 3B).
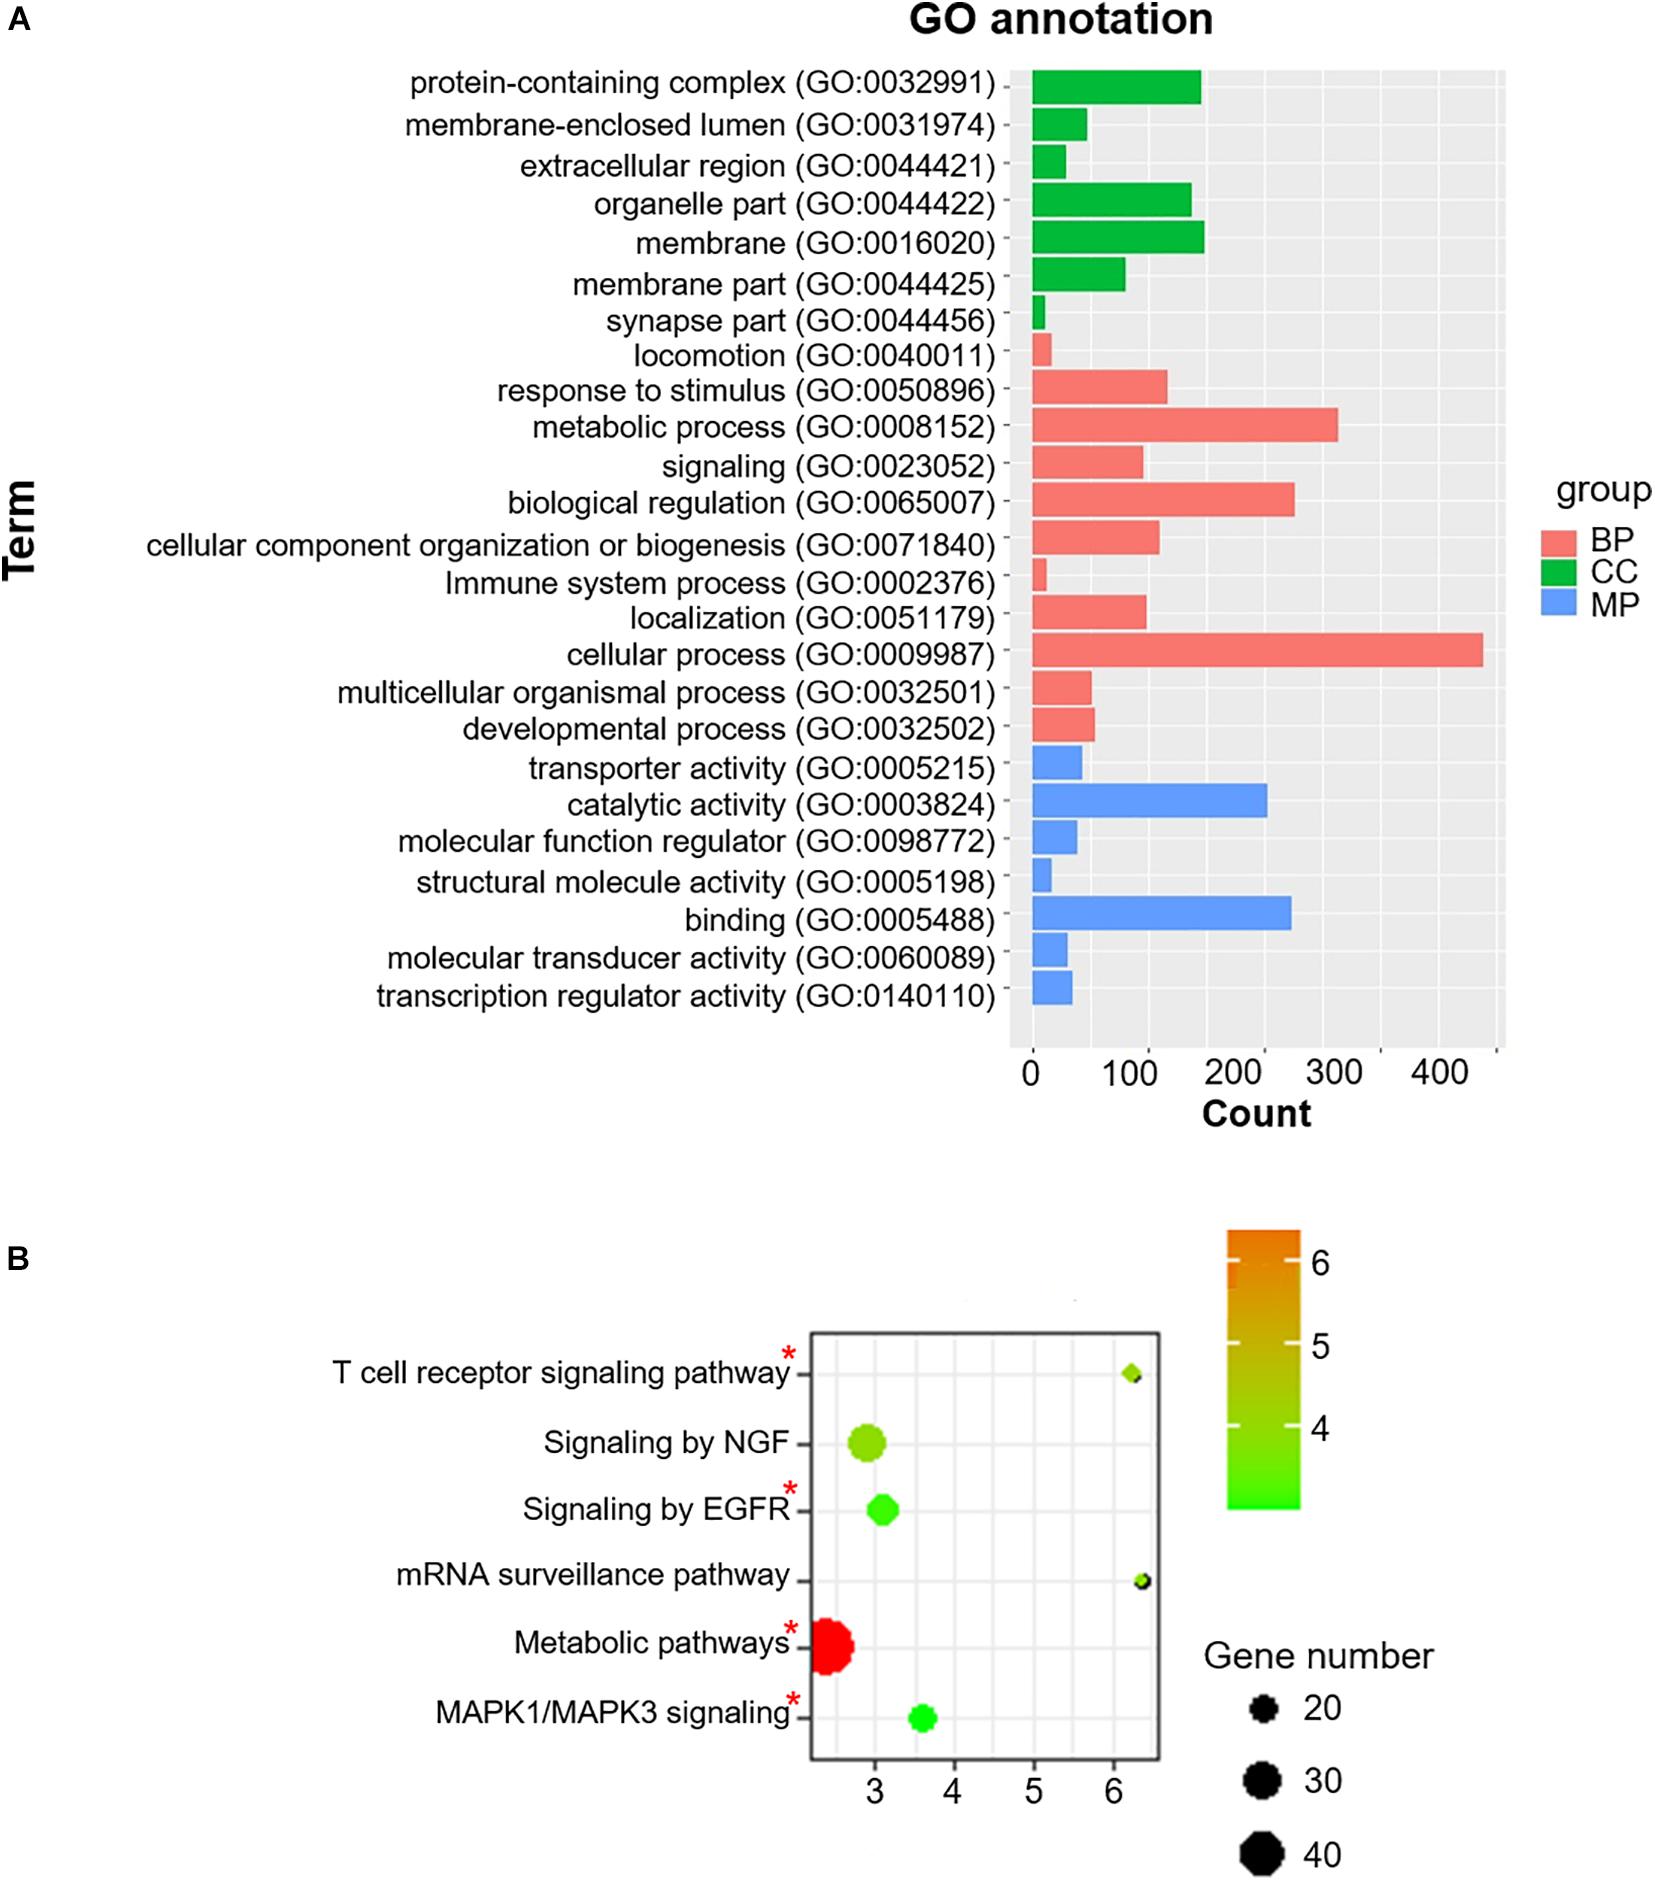
Figure 3. Co-m6AR GO functional classification and pathway enrichment analysis. (A) Gene-ontology (GO) functional classification. GO analyses of differently expressed genes in control versus T2DM islet β-cells. (B) Kyoto Encylopedia of Genes and Genomes (KEGG) pathway enrichment. KEGG analyses of 985 identified m6A-associated genes in control versus T2DM islet β-cells. The pathway involved in T2DM development was marked with red asterisk.
Key Co-m6ARs Related to T2DM Revealed by Co-expression Network
We used the co-expression between differentially-expressed genes and the 15 m6A methylation factors to generate a network that showed most genes were associated with METTL3, EIF3G, and ALKBH5 (Supplementary Figure 1). In Table 1, we show some genes co-expressed with more than one m6A regulator. Ankyrin repeat domain 1 (ANKRD1) was co-expressed with ALKBH5 and METTL3. Cyclin L2 (CCNL2) was co-expressed with ALKBH5 and EIF3G. LIM domain binding 3 (LDB3) and Stromal interaction molecule 1 (STIM1) were both co-expressed with other m6A regulators. Casein Kinase 1 Alpha 1 Like (CSNK1A1L) was co-expressed with both ALKBH and METTL3, which play important role in the hsa04310:Wnt and the hsa04340:Hedgehog signaling pathways. Cysteine sulfinic acid decarboxylase (CSAD) was co-expressed with ALKBH and EIF3C (involved in hsa00430:Taurine and hypotaur metabolism). Cytochrome c oxidase subunit 5A (COX5A) was co-expressed with ALKBH5 and other m6A regulators, which play critical roles in hsa00190:Oxidative phosphorylation, hsa01100:Metabolic pathways, hsa04260:Cardiac muscle contraction, hsa04932:Non-alcoholic fatty liver disease (NAFLD), hsa05010:Alzheimer’s disease, hsa05012:Parkinson’s disease, and hsa05016:Huntington’s disease. GRB2 associated binding protein 2 (GAB2) was co-expressed with METTL3 and EIF3G (an important factor in the hsa04014:Ras and hsa04071:Sphingolipid signaling pathways). miR-let-7i was co-expressed with other m6A regulators involved in hsa05206: MicroRNAs in cancer.
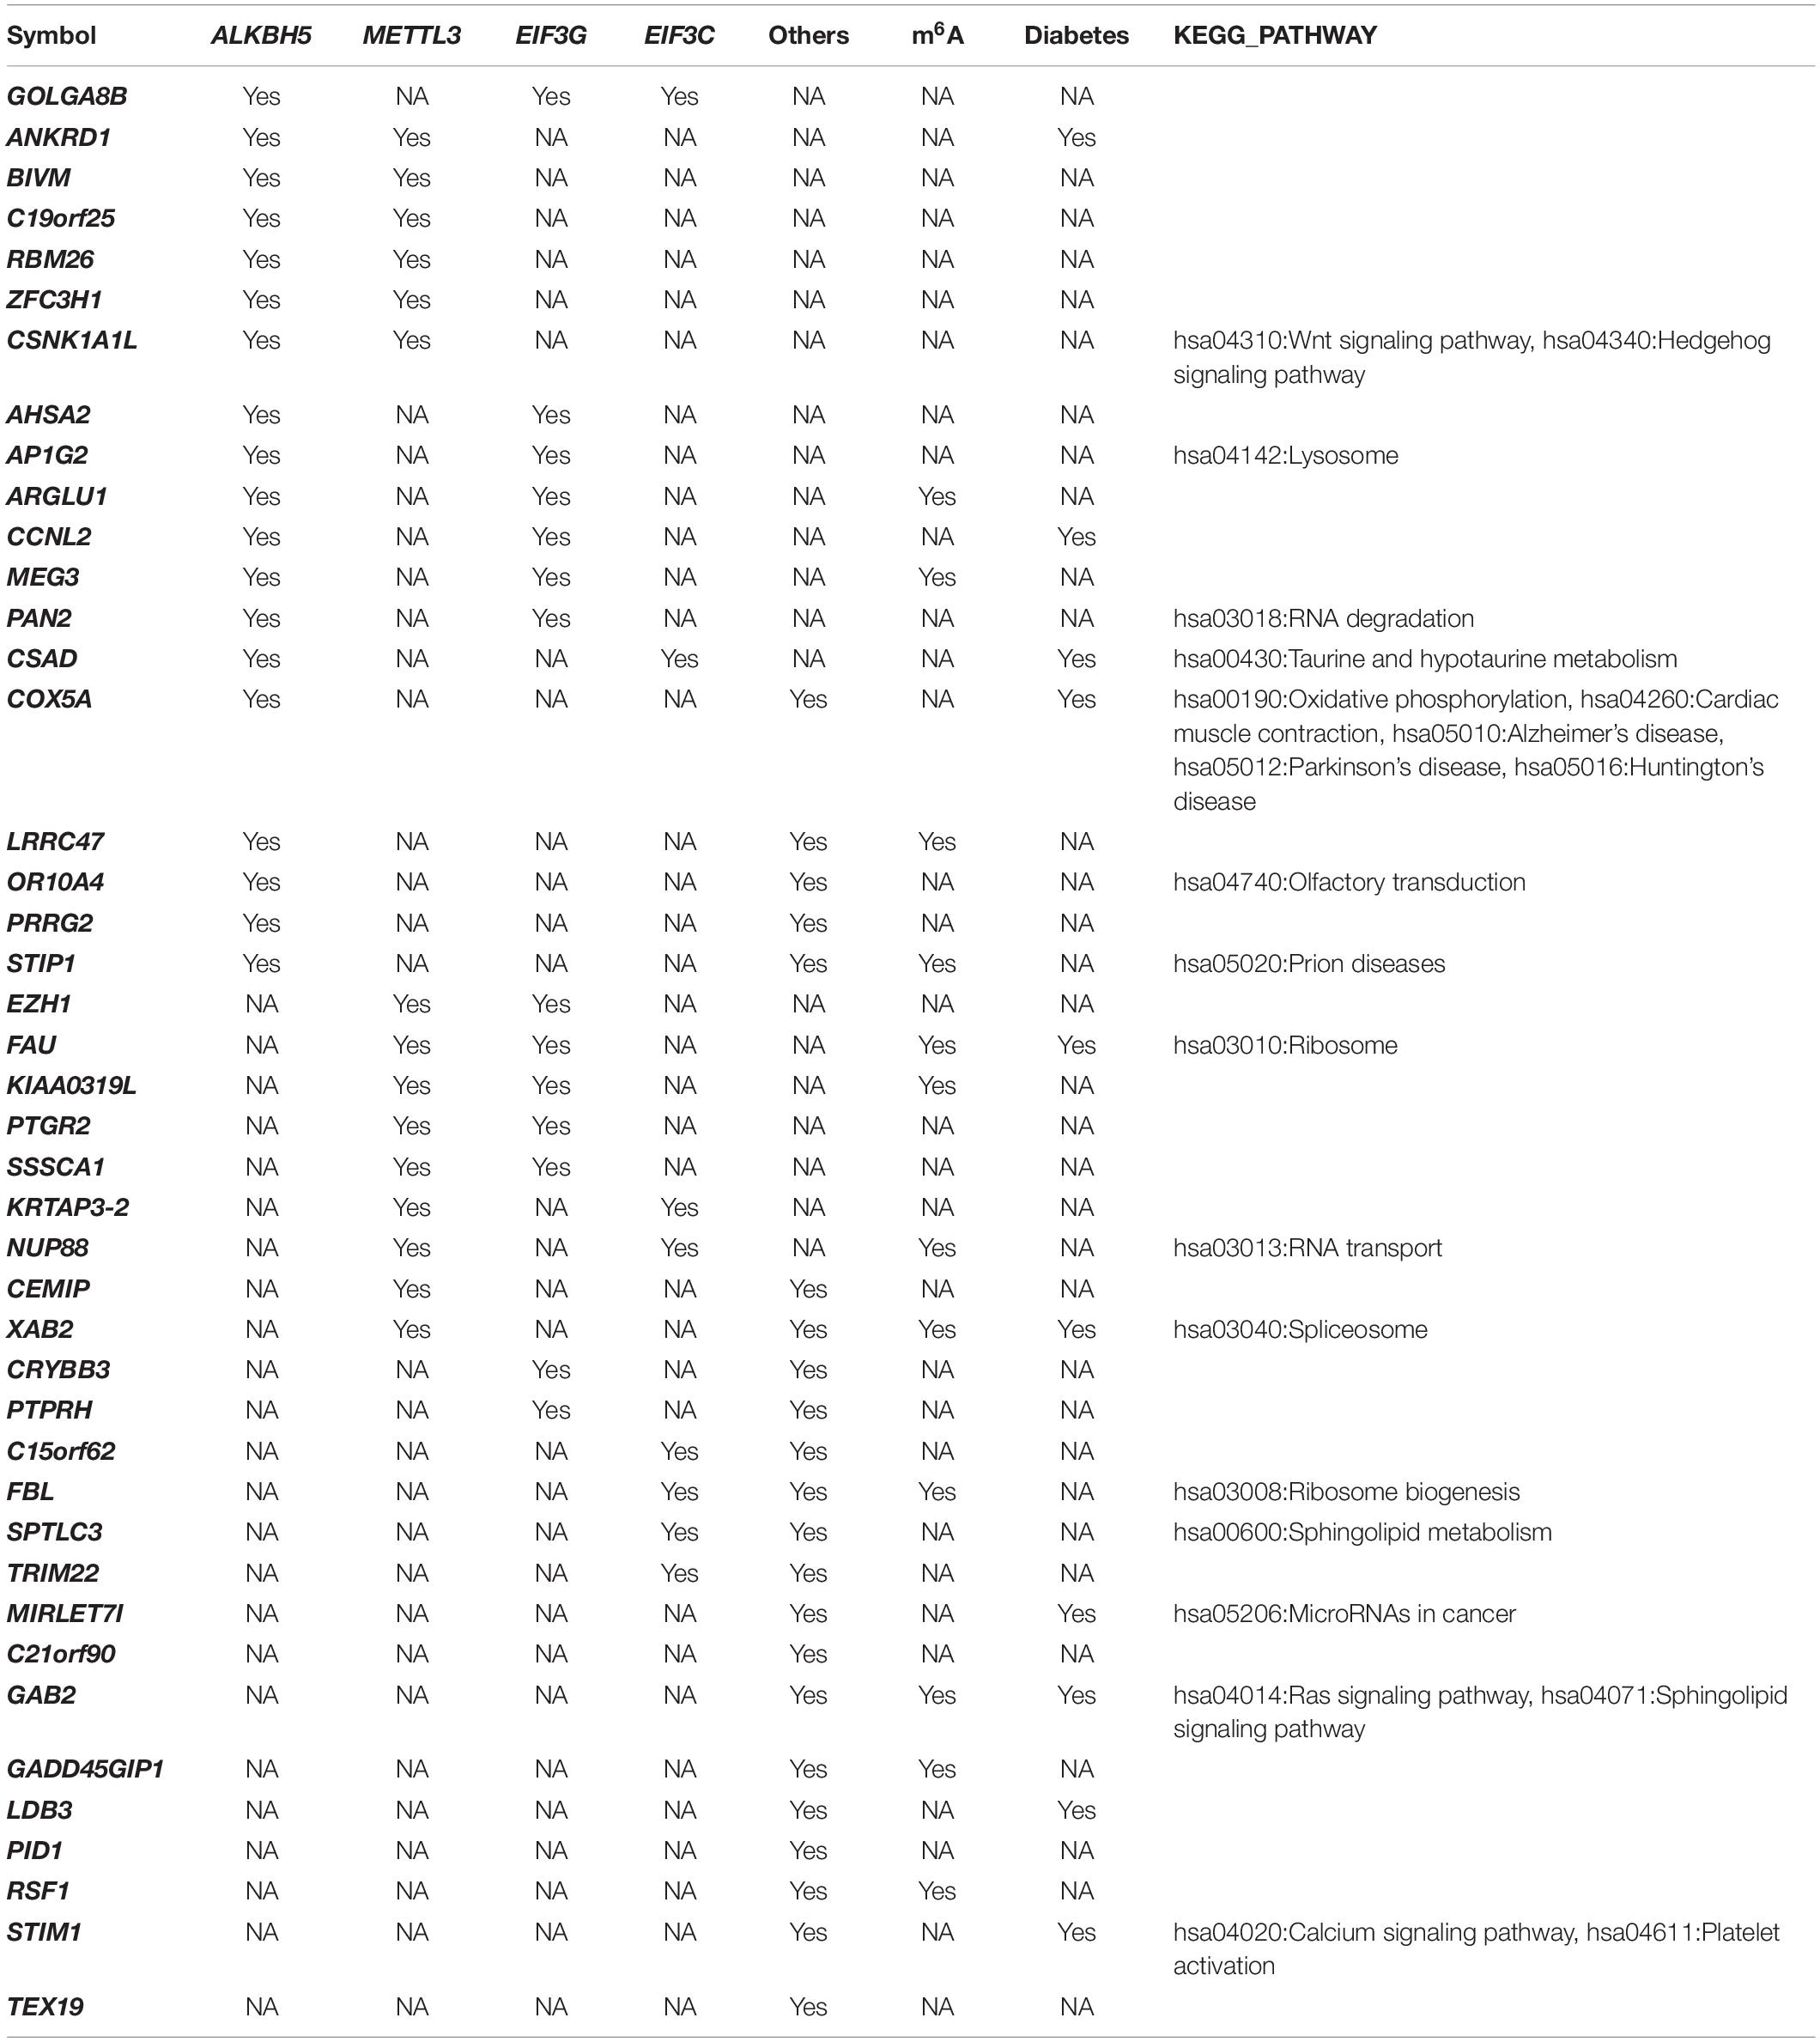
Table 1. Typical genes co-expressed with m6A regulators in T2DM.
mRNA of Co-m6AR Genes Have m6A Methylation in Islet β-Cells
We also identified 228 Co-m6ARs with m6A methylation based on the MeRIP-seq of human islet β-cells. As shown in Figure 4A, these genes play function in diverse biological processes (BP) such as signaling and stimulus responses. After the enrichment analysis, we found these genes to be enriched in EGFR, interleukin-2, MAPK1/MAPK3, and PDGF signaling, in the signaling cascades of insulin receptor and RAF/MAP kinase, in Epstein-Barr virus infections, and in mitochondrial translation initiation, VEGFA-VEGFR2, and SCF (Skp2)-mediated degradation pathways (Figure 4B).
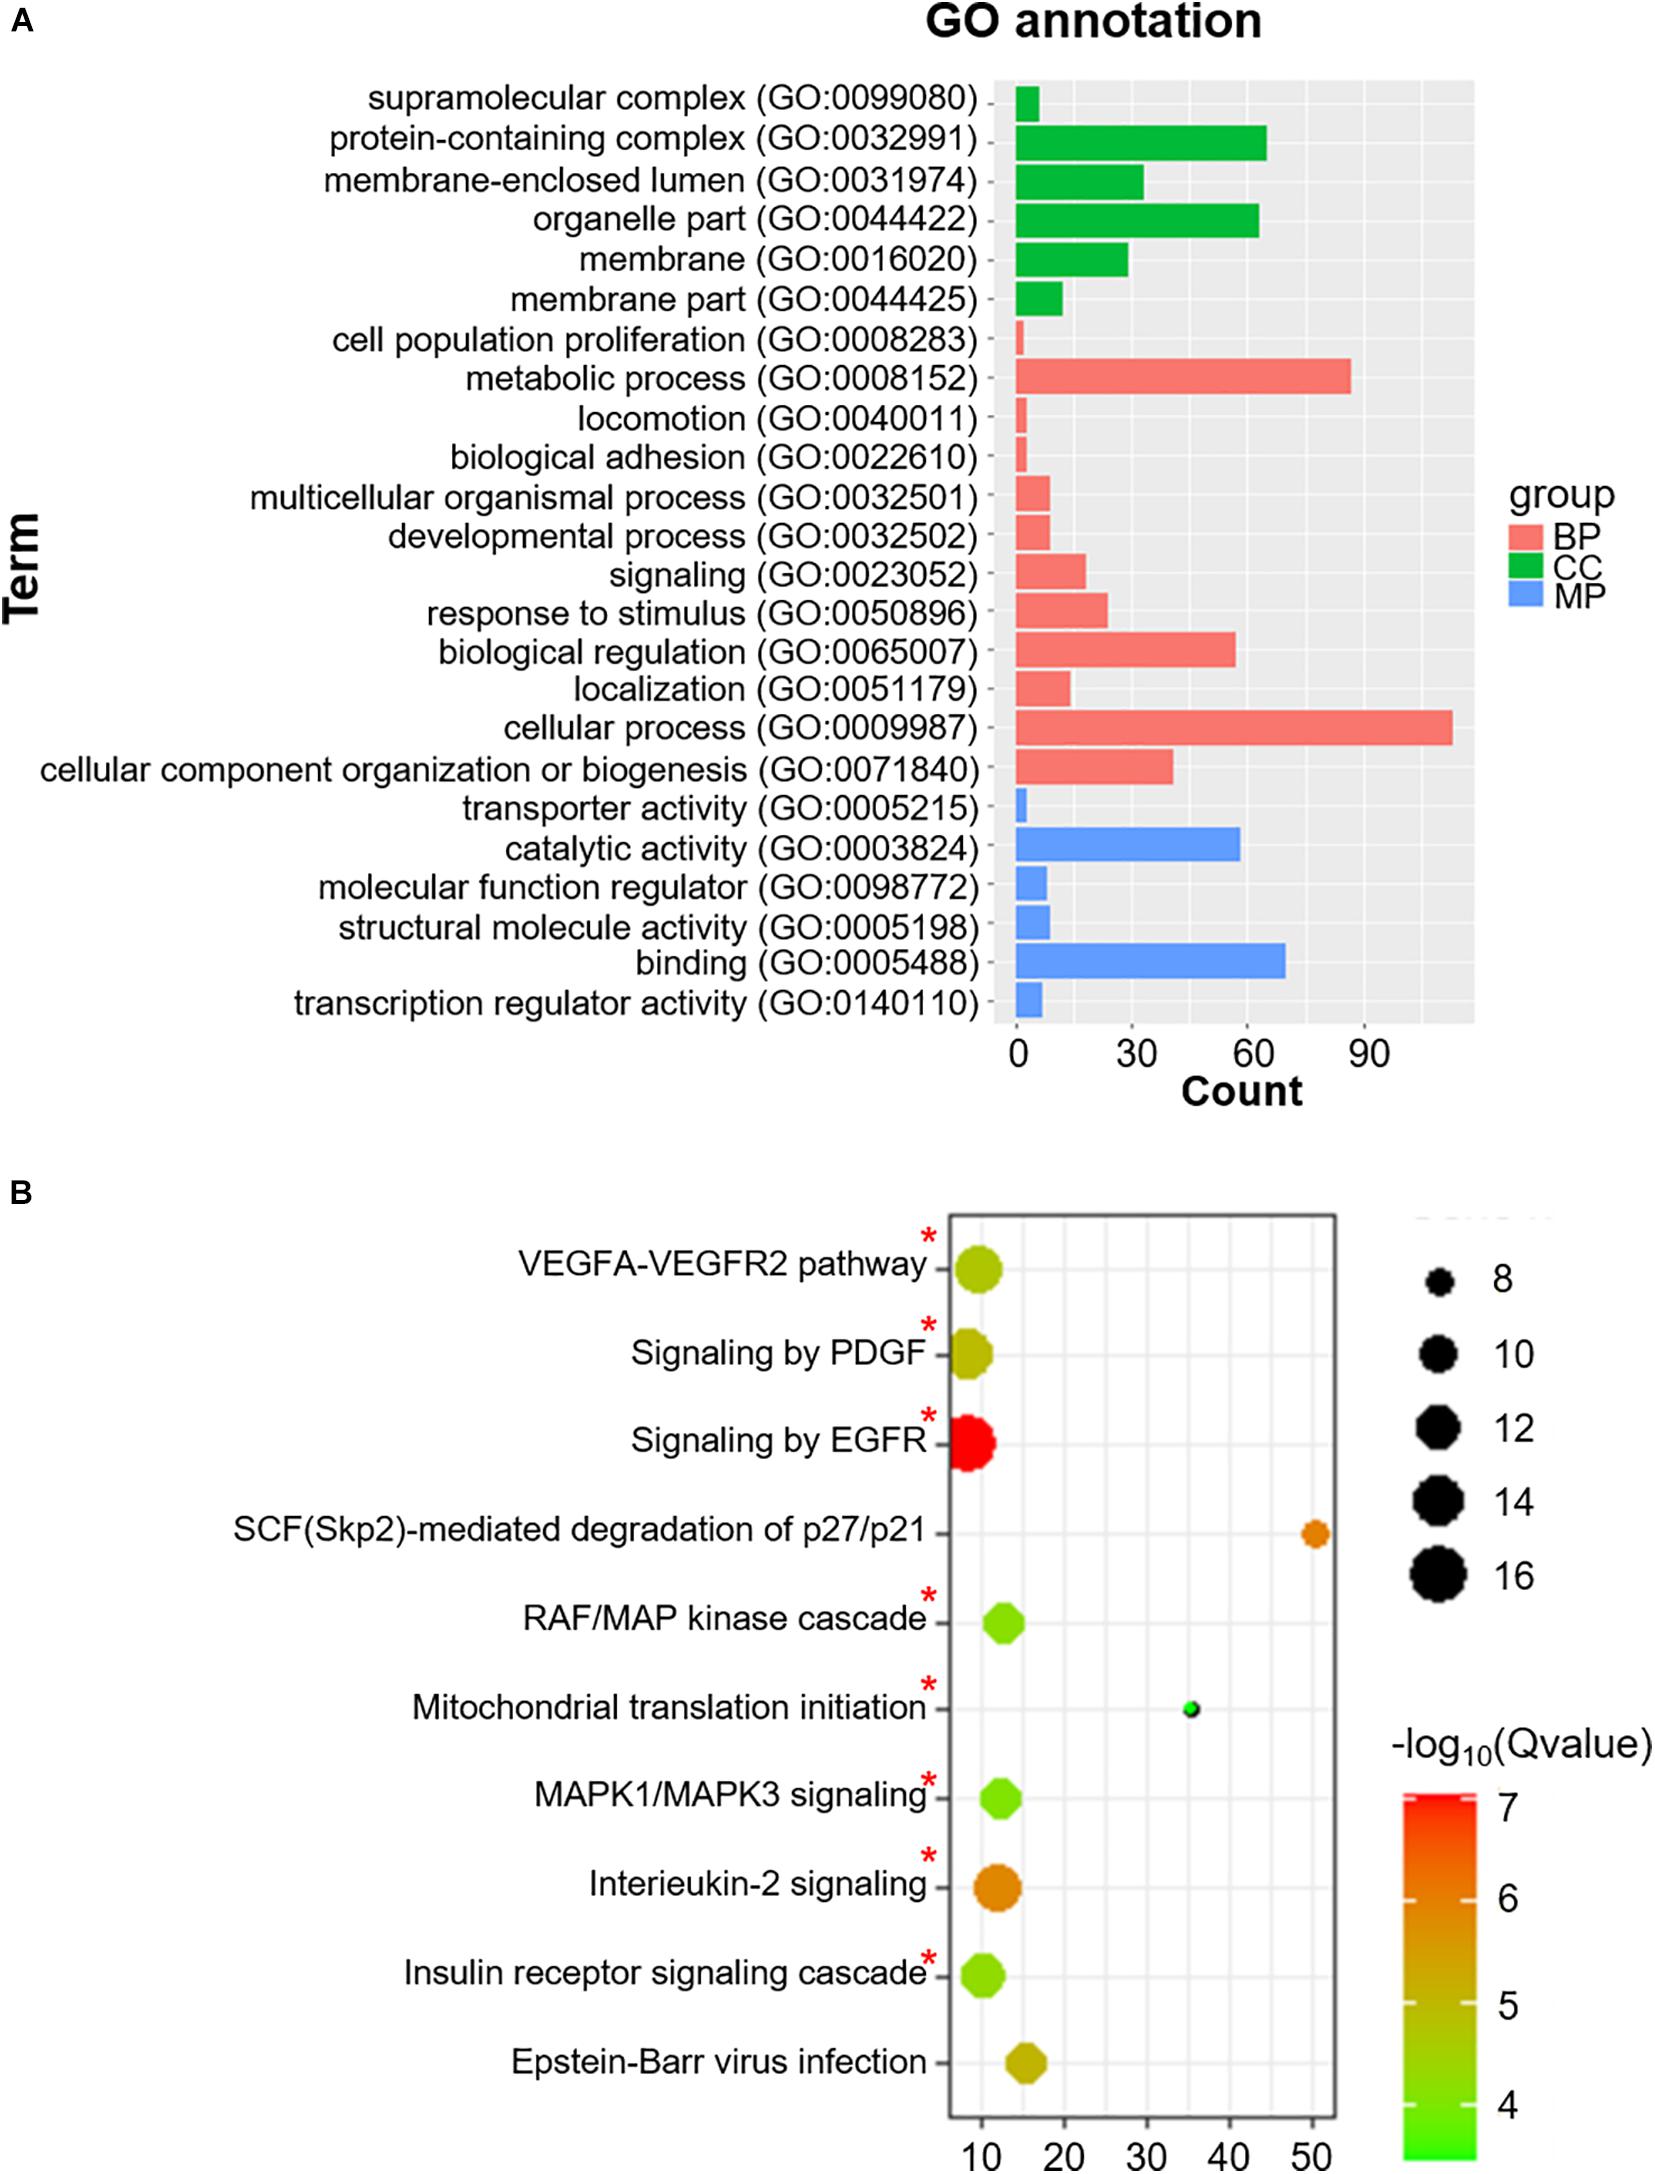
Figure 4. GO functional classification and pathway enrichment analysis of Co-m6AR with m6A methylation in β-cells. (A) GO functional classification. GO analyses of Co-m6AR genes in control versus T2DM islet β-cells. (B) KEGG pathway enrichment. KEGG analyses of Co-m6AR genes in control versus T2DM islet β-cells, and the enrichment pathway involved in T2DM development was marked with red asterisk.
Key Co-m6ARs With m6A Modification in Islet β-Cells Revealed by Co-expression Network
Our co-expression network revealed that most genes were associated with METTL3, EIF3G, YTHDF1, YTHDF2 and ALKBH5 (Supplementary Figure 2). In Table 1, we show some genes co-expressed with more than one m6A regulator. The gene ubiquitin like and ribosomal protein S30 fusion (FAU) was co-expressed with METTL3 and EIF3G (a member of the has03010:Ribosome pathway). XPA binding protein 2 (XAB2) was co-expressed with METTL3 and other m6A regulators involved in the hsa03040:Spliceosome pathway. We mentioned GRB2 in this network above.
eQTL Localizaed in the m6A Peaks of Genes Co-expressed With m6A Regulators
The trans-eQTL were downloaded from eQTLGen database. We identified 13 eQTL-SNP localized in the m6A peak region (around 100 bp) which is acquired from the m6A-MeRIP-seq of human islet beta cells. In Table 2, there are three eQTL-SNPs localized in chromosome 1, two in chromosome 11, five in chromosome 19. Chromosome 15, 16, and 20 has only 1, respectively. They are belonging to 10 genes. PHF13, SGTA and XAB2 contained 2 eQTL-SNP, respectively. Six eQTL-SNPs are involved in “A” allele. Four genes including GAB2, LMNB2, XAB2 and RBM39 are involved in the regulation of diabetes, fat and insulin signaling, according to text mining.
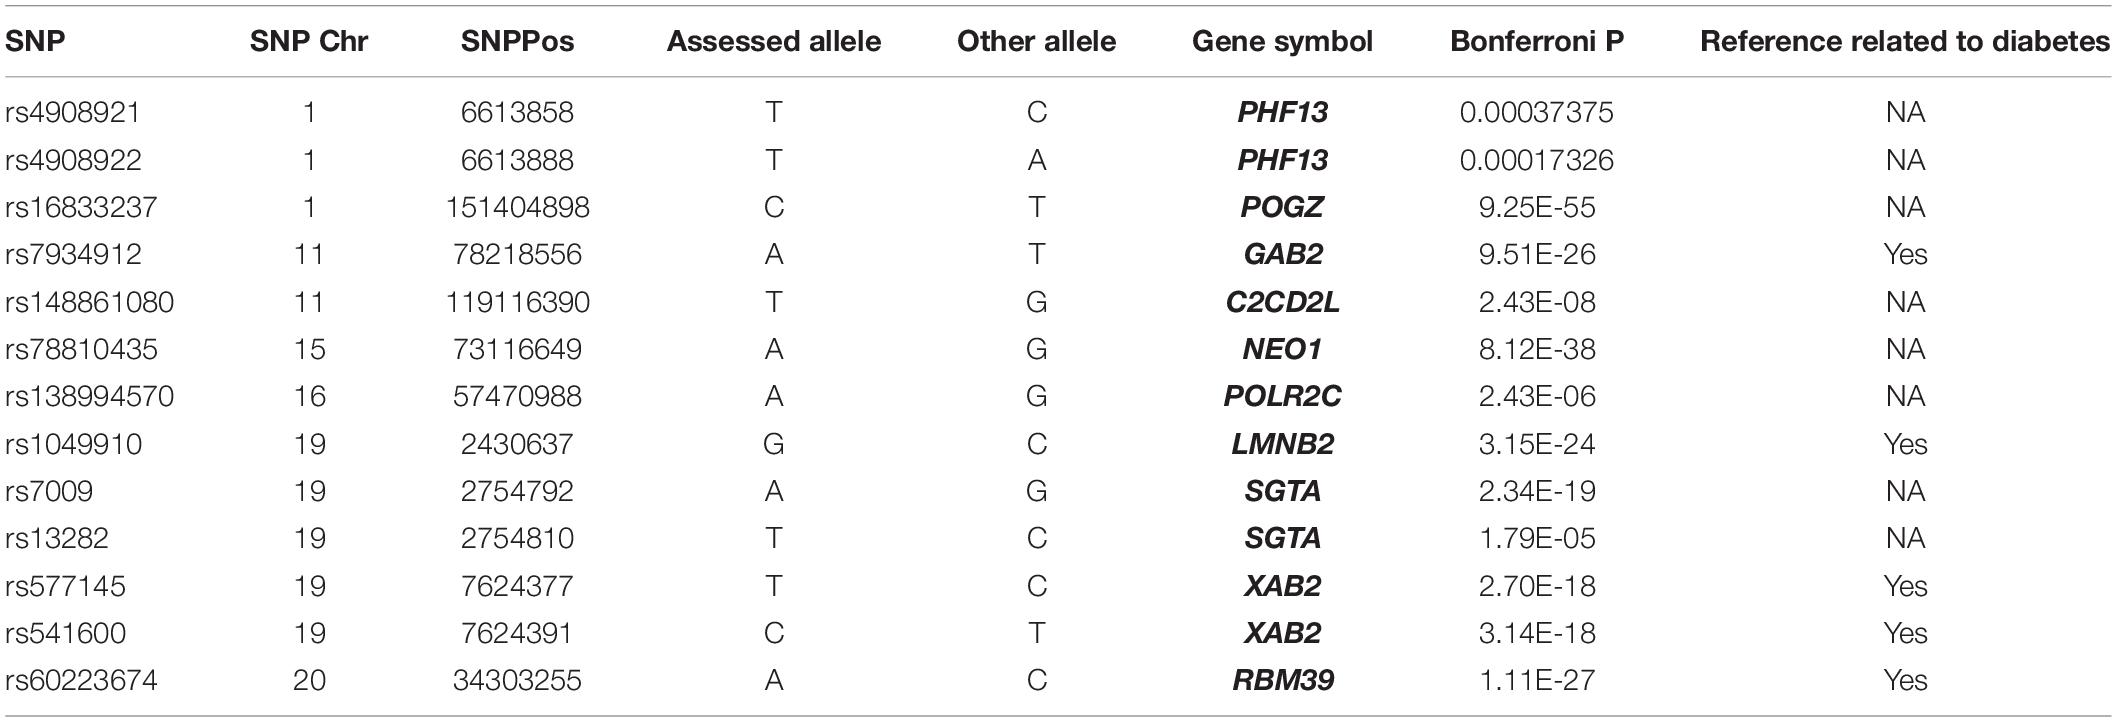
Table 2. eQTL localized in the m6A peaks of genes co-expressed with m6A regulators.
Discussion
Type 2 diabetes mellitus is a polygenic metabolic disease with a pathogenesis in which altered gene expressions at different levels play a crucial role. The analysis of gene expression regulation mechanisms in T2DM is helpful to determine potential therapeutic targets and provide new insights for diabetic therapies. Many m6A methylation modifications in eukaryotic mRNA participate in various biological processes by affecting mRNA splicing, translocation, degradation, and translation (Yue et al., 2015; Maity and Das, 2016). Thus, m6A can cumulatively regulate the expression of key regulatory genes through multiple effects during the diabetic pathogenic process.
Among the genes corresponding to RNA-seq transcriptomes in pancreatic β-cells, we found 15 m6A regulators. Subsequently, we identified the expression of 985 genes significantly correlated with these m6A regulators. To investigate the function of these genes, we analyzed their associated pathways. Our GO enrichment analysis assigned the genes to a “metabolic pathway” characterized by metabolic abnormalities, abdominal obesity, hypertension, dyslipidemia, and hyperglycemia. Our results indicate that this pathway is closely associated with T2DM in agreement with studies in which metabolic syndrome is a key etiological factor increasing the risk of T2DM (Hudish et al., 2019; Piche et al., 2020). In addition, other genes were enriched in processes confirmed to be also strongly associated with the pathogenesis and progression of T2DM such as the “MAPK signaling,” “EGFR signaling,” and “T cell receptor signaling pathway.” The findings suggest that m6A methylation factors may be modulating the expression of genes in pancreatic β-cells of patients with T2DM.
In addition, we evaluated the above genes based on MeRIP-seq transcriptomes of human islet β-cells, and we further identified the remaining 228 genes co-expressed with m6A regulators. We analyzed their associated processes by GO annotations. They were enriched in “epidermal growth factor receptor (EGFR) signaling,” “insulin receptor signaling,” “MAPK1/MAPK3 signaling,” and “RAF/MAP kinase signaling.” Genetic interaction analyses of enhancers and protein-coding genes suggested that EGFR might be a novel susceptibility gene for T2DM (Yang et al., 2020). In the insulin receptor signaling pathway, PIk3R2 is an important regulatory subunit of PI3K/p85, and it can significantly suppress the activation of the PI3K/Akt pathway participating in the physiological and pathological diabetes processes (Cantley, 2002; Taniguchi et al., 2006). In the MAPK signaling pathway, MAPK3 encodes the extracellular signal regulated kinase 1 (ERK1), considered a crucial factor for cell proliferation, regulating the insulin gene expression and β-cell survival (Briaud et al., 2003). ERK1 showed an increased expression in islet β-cells of diabetic mice (Kanda et al., 2009), and ERK1 knockout mice are significantly resistant to HFD-induced obesity and insulin resistance as compared with control mice (Jager et al., 2011).
Furthermore, we suggest that the genes co-expressed with multiple m6A regulators may be critical factors in the regulation of diabetes by m6A. Therefore, we classified these genes and analyzed the published data to explore the potential association between these genes and diabetes. Genome-wide association studies revealed SNPs in CCNL1 and COX5A that are significantly associated with the risk of T2DM and a high total urine arsenic content, respectively (Wang et al., 2016; Grau-Perez et al., 2018). Transcriptome studies have found miR-let-7i downregulated in diabetes mice and controlling β-cells (Cheng et al., 2015). The evidence supports that CSAD is involvement in a fulminant type of diabetes (Kawabata et al., 2019). The expression of STIM expression was low in islets from T2DM pancreas and was associated with proinflammatory cytokines and palmitate (Kono et al., 2018). As we expected, these identified Co-m6AR genes are strongly associated with T2DM processes. However, how m6A methylation regulates these genes remains unclear.
The m6A alterations in mRNA change gene expression profiles and, thus, regulate the pathogenesis and development of various diseases, including tumors, nervous system diseases, and T2DM. We found EGFR mRNA to be affected by the expression level of m6A methylation factors. This is consistent with previous findings on m6A-binding protein YTHDF2 and modulating the location and stability of EGFR mRNA at its 3’UTR site, enhancing the degradation of the EGFR mRNA, and playing an anti-tumor role in hepatocellular carcinoma (Yu et al., 2019). YTHDF2 has also been reported to promote the mRNA expression level of inflammatory response in LPS-stimulated monocyte macrophage cells, such as IL-6, IL-2, IL-1β, and TNF-α(Yu et al., 2019). Another important gene, ERK, has also been identified to be regulated by m6A, as confirmed by the interaction between ERK and METTL3 and WTAP. METTL3 binds to USP5 and active ERK-mediates phosphorylation, which makes the m6A methyltransferase complex more stable and results in a high level of m6A modifications (Prasun, 2020). Taken together, we suggest that the identified genes corresponding to diabetic m6A regulators may be crucial for different clinical characteristics of T2DM.
It can be seen that the identified genes are not only co-expressed with m6A regulators, but also have m6A methylation modifications. Subsequently, we screened these identified genes from the trans-eQTL database, and finally found 13 eQTL-SNPs localized in the m6A peak region. Among these eQTL-SNPs, four genes have been reported involved in diabetes. GRB2 associated binding protein 2 (GAB2) is an adaptor protein of the insulin receptor substrate 1 family and associated with the downstream signaling from cytokine receptors (Robinson and Oshlack, 2010). XPA binding protein 2 (XAB2) exerts as a regulator in hyperglycemia with chronic insulin (Lim et al., 2008). Lamin B2 (LMNB2) can regulate fasting blood glucose by increasing insulin secretion or regenerating beta cells (de Toledo et al., 2020). RNA binding motif protein 39 (RBM39) were associated with a higher risk of insulin in clinically significant retinopathy of prematurity (Lynch et al., 2016). Obviously, these genes will be of value for studying the prognosis and diagnosis of T2DM, however, the underlying mechanisms of the identified genes in T2DM remain to be elucidated.
In summary, we identified genes co-expressed with m6A regulators in human T2DM islets; some of them contained known m6A methylation modifications. These genes are enriched in T2DM-related biological processes. These promising genes provide a novel insight into the progression of T2DM and need to be confirmed in further. The identified transcripts may give helpful information for understanding the effects of m6A methylation in the prognosis and diagnosis of T2DM.
Data Availability Statement
The datasets presented in this study can be found in online repositories. The names of the repository/repositories and accession number(s) can be found in the article/Supplementary Material.
Author Contributions
CC and JT designed the project and wrote the manuscript. SL and MY collected the database. QX and WL did the experiments and analyzed the data. All authors contributed to the article and approved the submitted version.
Funding
This study was supported by grants from the Scientific Research Foundation for the High-level Talents, Fujian University of Traditional Chinese Medicine (X2020001-talents).
Conflict of Interest
The authors declare that the research was conducted in the absence of any commercial or financial relationships that could be construed as a potential conflict of interest.
Supplementary Material
The Supplementary Material for this article can be found online at: https://www.frontiersin.org/articles/10.3389/fcell.2021.651142/full#supplementary-material
Supplementary Figure 1 | Co-m6AR co-expression network. Functional protein-protein interaction network of Co-m6AR genes in control versus T2DM islet β-cells was shown, the key genes were marked with green asterisk.
Supplementary Figure 2 | Co-expression network of Co-m6AR with m6A methylation in β-cells. Functional protein-protein interaction network of differently expressed genes with METTL3, EIF3G, YTHDF1, YTHDF2, and ALKBH5 was shown, and these five RNA m6A methylation regulators were marked with blue asterisk.
Footnotes
References
Dayeh, T., and Ling, C. (2015). Does epigenetic dysregulation of pancreatic islets contribute to impaired insulin secretion and type 2 diabetes? Biochem Cell Biol. 93, 511–521. doi: 10.1139/bcb-2015-0057
Reusch, J. E., and Manson, J. E. (2017). Management of Type 2 Diabetes in 2017: Getting to Goal. JAMA. 317, 1015–1016. doi: 10.1001/jama.2017.0241
Giacco, F., and Brownlee, M. (2010). Oxidative stress and diabetic complications. Circ Res. 107, 1058–1070.
Singh, R., Barden, A., Mori, T., and Beilin, L. (2001). Advanced glycation end-products: a review. Diabetologia. 44, 129–146.
Copps, K. D., Hancer, N. J., Qiu, W., and White, M. F. (2016). Serine 302 Phosphorylation of Mouse Insulin Receptor Substrate 1 (IRS1) Is Dispensable for Normal Insulin Signaling and Feedback Regulation by Hepatic S6 Kinase. J Biol Chem. 291, 8602–8617. doi: 10.1074/jbc.m116.714915
He, C. (2010). Grand challenge commentary: RNA epigenetics? Nat Chem Biol. 6, 863–865. doi: 10.1038/nchembio.482
Meyer, K. D., Saletore, Y., Zumbo, P., Elemento, O., Mason, C. E., and Jaffrey, S. R. (2012). Comprehensive analysis of mRNA methylation reveals enrichment in 3’. UTRs and near stop codons, Cell. 149, 1635–1646. doi: 10.1016/j.cell.2012.05.003
Dominissini, D., Moshitch-Moshkovitz, S., Schwartz, S., Salmon-Divon, M., Ungar, L., Osenberg, S., et al. (2012). Topology of the human and mouse m6A RNA methylomes revealed by m6A-seq. Nature. 485, 201–206. doi: 10.1038/nature11112
Wang, X., Lu, Z., Gomez, A., Hon, G. C., Yue, Y., Han, D., et al. (2014). N6-methyladenosine-dependent regulation of messenger RNA stability. Nature. 505, 117–120. doi: 10.1038/nature12730
Liu, N., Dai, Q., Zheng, G., He, C., Parisien, M., and Pan, T. (2015). N(6)-methyladenosine-dependent RNA structural switches regulate RNA-protein interactions. Nature. 518, 560–564. doi: 10.1038/nature14234
Bokar, J. A., Shambaugh, M. E., Polayes, D., Matera, A. G., and Rottman, F. M. (1997). Purification and cDNA cloning of the AdoMet-binding subunit of the human mRNA (N6-adenosine)-methyltransferase. RNA. 3, 1233–1247.
Liu, J., Yue, Y., Han, D., Wang, X., Fu, Y., Zhang, L., et al. (2014). A METTL3-METTL14 complex mediates mammalian nuclear RNA N6-adenosine methylation. Nat Chem Biol. 10, 93–95. doi: 10.1038/nchembio.1432
Jia, G., Fu, Y., Zhao, X., Dai, Q., Zheng, G., Yang, Y., et al. (2011). N6-methyladenosine in nuclear RNA is a major substrate of the obesity-associated FTO. Nat Chem Biol. 7, 885–887. doi: 10.1038/nchembio.687
Zheng, G., Dahl, J. A., Niu, Y., Fedorcsak, P., Huang, C. M., Li, C. J., et al. (2013). ALKBH5 is a mammalian RNA demethylase that impacts RNA metabolism and mouse fertility. Mol Cell. 49, 18–29. doi: 10.1016/j.molcel.2012.10.015
Fedeles, B. I., Singh, V., Delaney, J. C., Li, D., and Essigmann, J. M. (2015). The AlkB Family of Fe(II)/alpha-Ketoglutarate-dependent Dioxygenases: Repairing Nucleic Acid Alkylation Damage and Beyond. J Biol Chem. 290, 20734–20742. doi: 10.1074/jbc.r115.656462
Taneera, J., Prasad, R. B., Dhaiban, S., Mohammed, A. K., Haataja, L., Arvan, P., et al. (2018). Silencing of the FTO gene inhibits insulin secretion: An in vitro study using GRINCH cells. Mol Cell Endocrinol. 472, 10–17. doi: 10.1016/j.mce.2018.06.003
Scuteri, A., Sanna, S., Chen, W. M., Uda, M., Albai, G., Strait, J., et al. (2007). Genome-wide association scan shows genetic variants in the FTO gene are associated with obesity-related traits. PLoS Genet. 3:e115. doi: 10.1371/journal.pgen.0030115
Blauth, W., and Falliner, A. (1986). [Morphology and classification of cleft hands]. Handchir Mikrochir Plast Chir. 18, 161–195.
Boissel, S., Reish, O., Proulx, K., Kawagoe-Takaki, H., Sedgwick, B., Yeo, G. S., et al. (2009). Loss-of-function mutation in the dioxygenase-encoding FTO gene causes severe growth retardation and multiple malformations. Am J Hum Genet. 85, 106–111. doi: 10.1016/j.ajhg.2009.06.002
Church, C., Moir, L., McMurray, F., Girard, C., Banks, G. T., Teboul, L., et al. (2010). Overexpression of Fto leads to increased food intake and results in obesity. Nat Genet. 42, 1086–1092. doi: 10.1038/ng.713
Lee, M., Kim, B., and Kim, V. N. (2014). Emerging roles of RNA modification: m(6)A and U-tail. Cell. 158, 980–987. doi: 10.1016/j.cell.2014.08.005
Christian, K. M., Song, H., and Ming, G. L. (2014). Functions and dysfunctions of adult hippocampal neurogenesis. Annu Rev Neurosci. 37, 243–262. doi: 10.1146/annurev-neuro-071013-014134
De Jesus, D. F., Zhang, Z., Kahraman, S., Brown, N. K., Chen, M., Hu, J., et al. (2019). m(6)A mRNA Methylation Regulates Human beta-Cell Biology in Physiological States and in Type 2 Diabetes. Nat Metab. 1, 765–774. doi: 10.1038/s42255-019-0089-9
Xie, W., Ma, L. L., Xu, Y. Q., Wang, B. H., and Li, S. M. (2019). METTL3 inhibits hepatic insulin sensitivity via N6-methyladenosine modification of Fasn mRNA and promoting fatty acid metabolism. Biochem Biophys Res Commun. 518, 120–126. doi: 10.1016/j.bbrc.2019.08.018
Li, Y., Zhang, Q., Cui, G., Zhao, F., Tian, X., Sun, B. F., et al. (2020). m(6)A Regulates Liver Metabolic Disorders and Hepatogenous Diabetes. Genomics Proteomics Bioinformatics.∗∗vol page,
Song, Y., Wang, Q., Li, L., Chen, S., Zhao, Y., and Gao, L. (2020). Comprehensive epigenetic analysis of m6A modification in the hippocampal injury of diabetic rats. Epigenomics. 12, 1811–1824. doi: 10.2217/epi-2020-0125
Robinson, M. D., and Oshlack, A. (2010). A scaling normalization method for differential expression analysis of RNA-seq data. Genome Biol. 11, R25.
Huang da, W., Sherman, B. T., and Lempicki, R. A. (2009b). Systematic and integrative analysis of large gene lists using DAVID bioinformatics resources. Nat Protoc. 4, 44–57. doi: 10.1038/nprot.2008.211
Huang da, W., Sherman, B. T., and Lempicki, R. A. (2009a). Bioinformatics enrichment tools: paths toward the comprehensive functional analysis of large gene lists. Nucleic Acids Res. 37, 1–13. doi: 10.1093/nar/gkn923
Gautier, L., Cope, L., Bolstad, B. M., and Irizarry, R. A. (2004). affy–analysis of Affymetrix GeneChip data at the probe level. Bioinformatics. 20, 307–315. doi: 10.1093/bioinformatics/btg405
Mi, H., Muruganujan, A., and Thomas, P. D. (2013). PANTHER in 2013: modeling the evolution of gene function, and other gene attributes, in the context of phylogenetic trees. Nucleic Acids Res. 41, D377–D386.
Thomas, P. D., Campbell, M. J., Kejariwal, A., Mi, H., Karlak, B., Daverman, R., et al. (2003). PANTHER: a library of protein families and subfamilies indexed by function. Genome Res. 13, 2129–2141. doi: 10.1101/gr.772403
Yue, Y., Liu, J., and He, C. (2015). RNA N6-methyladenosine methylation in post-transcriptional gene expression regulation. Genes Dev. 29, 1343–1355. doi: 10.1101/gad.262766.115
Maity, A., and Das, B. (2016). N6-methyladenosine modification in mRNA: machinery, function and implications for health and diseases. FEBS J. 283, 1607–1630. doi: 10.1111/febs.13614
Piche, M. E., Tchernof, A., and Despres, J. P. (2020). Obesity Phenotypes, Diabetes, and Cardiovascular Diseases. Circ Res. 126, 1477–1500. doi: 10.1161/circresaha.120.316101
Hudish, L. I., Reusch, J. E., and Sussel, L. (2019). beta Cell dysfunction during progression of metabolic syndrome to type 2 diabetes. J Clin Invest. 129, 4001–4008. doi: 10.1172/jci129188
Yang, Y., Yao, S., Ding, J. M., Chen, W., and Guo, Y. (2020). Enhancer-Gene Interaction Analyses Identified the Epidermal Growth Factor Receptor as a Susceptibility Gene for Type 2 Diabetes Mellitus. Diabetes Metab J 45, 241–250. doi: 10.4093/dmj.2019.0204
Taniguchi, C. M., Kondo, T., Sajan, M., Luo, J., Bronson, R., Asano, T., et al. (2006). Divergent regulation of hepatic glucose and lipid metabolism by phosphoinositide 3-kinase via Akt and PKClambda/zeta. Cell Metab. 3, 343–353. doi: 10.1016/j.cmet.2006.04.005
Briaud, I., Lingohr, M. K., Dickson, L. M., Wrede, C. E., and Rhodes, C. J. (2003). Differential activation mechanisms of Erk-1/2 and p70(S6K) by glucose in pancreatic beta-cells. Diabetes. 52, 974–983. doi: 10.2337/diabetes.52.4.974
Kanda, Y., Shimoda, M., Tawaramoto, K., Hamamoto, S., Tatsumi, F., Kawasaki, F., et al. (2009). Molecular analysis of db gene-related pancreatic beta cell dysfunction; evidence for a compensatory mechanism inhibiting development of diabetes in the db gene heterozygote. Endocr J. 56, 997–1008. doi: 10.1507/endocrj.k09e-028
Jager, J., Corcelle, V., Gremeaux, T., Laurent, K., Waget, A., Pages, G., et al. (2011). Deficiency in the extracellular signal-regulated kinase 1 (ERK1) protects leptin-deficient mice from insulin resistance without affecting obesity. Diabetologia. 54, 180–189. doi: 10.1007/s00125-010-1944-0
Wang, T., Huang, T., Li, Y., Zheng, Y., Manson, J. E., Hu, F. B., et al. (2016). Low birthweight and risk of type 2 diabetes: a Mendelian randomisation study. Diabetologia. 59, 1920–1927. doi: 10.1007/s00125-016-4019-z
Grau-Perez, M., Navas-Acien, A., Galan-Chilet, I., Briongos-Figuero, L. S., Morchon-Simon, D., Bermudez, J. D., et al. (2018). Arsenic exposure, diabetes-related genes and diabetes prevalence in a general population from Spain. Environ Pollut. 235, 948–955. doi: 10.1016/j.envpol.2018.01.008
Cheng, C., Kobayashi, M., Martinez, J. A., Ng, H., Moser, J. J., Wang, X., et al. (2015). Evidence for Epigenetic Regulation of Gene Expression and Function in Chronic Experimental Diabetic Neuropathy. J Neuropathol Exp Neurol. 74, 804–817. doi: 10.1097/nen.0000000000000219
Kawabata, Y., Nishida, N., Awata, T., Kawasaki, E., Imagawa, A., Shimada, A., et al. (2019). Genome-Wide Association Study Confirming a Strong Effect of HLA and Identifying Variants in CSAD/lnc-ITGB7-1 on Chromosome 12q13.13 Associated With Susceptibility to Fulminant Type 1 Diabetes. Diabetes. 68, 665–675. doi: 10.2337/db18-0314
Kono, T., Tong, X., Taleb, S., Bone, R. N., Iida, H., Lee, C. C., et al. (2018). Impaired Store-Operated Calcium Entry and STIM1 Loss Lead to Reduced Insulin Secretion and Increased Endoplasmic Reticulum Stress in the Diabetic beta-Cell. Diabetes. 67, 2293–2304. doi: 10.2337/db17-1351
Yu, R., Li, Q., Feng, Z., Cai, L., and Xu, Q. (2019). m6A Reader YTHDF2 Regulates LPS-Induced Inflammatory Response. Int J Mol Sci. 20, 1323. doi: 10.3390/ijms20061323
Prasun, P. (2020). Mitochondrial dysfunction in metabolic syndrome. Biochim Biophys Acta Mol Basis Dis. 1866, 165838.
Lim, J. M., Sherling, D., Teo, C. F., Hausman, D. B., Lin, D., and Wells, L. (2008). Defining the regulated secreted proteome of rodent adipocytes upon the induction of insulin resistance. J Proteome Res. 7, 1251–1263. doi: 10.1021/pr7006945
de Toledo, M., Lopez-Mejia, I. C., Cavelier, P., Pratlong, M., Barrachina, C., Gromada, X., et al. (2020). Lamin C Counteracts Glucose Intolerance in Aging, Obesity, and Diabetes Through beta-Cell Adaptation. Diabetes. 69, 647–660. doi: 10.2337/db19-0377
Keywords: RNA m6A methylation, type 2 diabetes mellitus, co-expression network, RNA m6A methyltransferase, insulin
Citation: Chen C, Xiang Q, Liu W, Liang S, Yang M and Tao J (2021) Co-expression Network Revealed Roles of RNA m6A Methylation in Human β-Cell of Type 2 Diabetes Mellitus. Front. Cell Dev. Biol. 9:651142. doi: 10.3389/fcell.2021.651142
Received: 08 January 2021; Accepted: 07 April 2021;
Published: 18 May 2021.
Edited by:
Giovanni Nigita, The Ohio State University, United StatesReviewed by:
Yuanhu Xuan, Shenyang Agricultural University, ChinaXiaofeng Gu, Institute of Biotechnology (CAAS), China
Copyright © 2021 Chen, Xiang, Liu, Liang, Yang and Tao. This is an open-access article distributed under the terms of the Creative Commons Attribution License (CC BY). The use, distribution or reproduction in other forums is permitted, provided the original author(s) and the copyright owner(s) are credited and that the original publication in this journal is cited, in accordance with accepted academic practice. No use, distribution or reproduction is permitted which does not comply with these terms.
*Correspondence: Jing Tao, dGFvamluZzAxQGZqdGNtLmVkdS5jbg==