
95% of researchers rate our articles as excellent or good
Learn more about the work of our research integrity team to safeguard the quality of each article we publish.
Find out more
ORIGINAL RESEARCH article
Front. Cell Dev. Biol. , 27 May 2021
Sec. Stem Cell Research
Volume 9 - 2021 | https://doi.org/10.3389/fcell.2021.650599
This article is part of the Research Topic Hematopoiesis: Learning from in vitro and in vivo Models View all 10 articles
 Juan Gao1,2†
 Shuaibing Hou1†Shengnan Yuan1Yuxia Wang1Yanan Gao1,3Xiaolu Sun1Weili Wang1Yajing Chu1Yuan Zhou1
 Xiaoming Feng1
 Hongbo R. Luo4Tao Cheng1Jun Shi1
 Weiping Yuan1*Xiaomin Wang1,5*
Myeloid cells have been identified as hematopoietic stem cell (HSC)-regulating cells. However, the mechanisms by which myeloid cells regulate the function of HSCs are not fully defined. Our previous study indicated that the HSCs are over-expanded in Vav1-Cre;Rheb1fl/fl mice. Here, using in vivo and in vitro models, we found that Rheb1-deficient neutrophils remodeled the bone marrow environment and induced expansion of HSCs in vivo. Further studies showed that loss of Rheb1 impaired neutrophils’ ability to secrete IL-6, led mesenchymal stem cells (MSCs) to produce more SCF, and promote HSC proliferation. We further found that IL-6 suppressed SCF mRNA expression in human MSCs. Interesting, the high level of IL-6 was also related with poor survival of chronic myeloid leukemia (CML) patients, and higher expression of IL-6 in CML cells is associated with the lower expression of SCF in MSCs in patients. Our studies suggested that blocking IL-6 signaling pathway might stimulate MSCs to secrete more SCF, and to support hematopoietic stem/progenitor cells proliferation.
Hematopoietic stem cells (HSCs) play an important role in the regulation of hematopoietic homeostasis. They can self-renew and differentiate into all cell types of the hematopoietic system according to proliferative or stress cues throughout life (Feng et al., 2008; Rathinam and Flavell, 2008). This process requires fine regulation by intra- and extracellular signaling in the bone marrow microenvironment. HSCs primarily reside in the bone marrow cavity (or niche), where they interact with a variety of cell types, including perivascular cells, osteoblast cells (OBCs) and mesenchymal stem cells (MSCs). HSCs directly adhere to mesenchymal cells and possibly to osteoblasts in the bone marrow stroma that express important regulatory molecules including stem cell factor (SCF) and C-X-C motif chemokine 12 (CXCL-12) (Frenette et al., 2013; Greenbaum et al., 2013). In addition, differentiated hematopoietic cells have been proposed to regulate HSCs. For example, macrophages have been shown to indirectly promote the retention of HSCs by regulating mesenchymal cells and osteoblasts (Chow et al., 2011). Megakaryocytes (MK) are physically associated with HSCs in the bone marrow. MK ablation leads to the activation of quiescent HSCs and increases proliferation of HSCs (Meng et al., 2014). Neutrophils can produce ROS to stimulate the proliferation of myeloid progenitors (Kwak et al., 2015). These studies suggested that the hematopoietic cells and niche cells interact with HSCs, regulate HSCs division and proliferation, and maintain hematopoietic system balance in vivo.
It has been known that the change of normal hematopoietic niche to a hostile HSC growth environment is the tipping point for the development of myelodysplastic syndromes (MDS) and leukemia (Raaijmakers, 2012). For example, study has shown that leukemia cells could secrete more proinflammatory cytokines and establish a feedback loop that drive over-expansion of immature myeloid cells and chronic myeloid leukemia (CML) development (Reynaud et al., 2011). Additionally, leukemia cells could also stimulate MSCs to differentiate into OBCs to support LSC proliferation (Schepers et al., 2013), while MSCs may accelerate abnormal HSCs over-proliferation through secreting more SDF-1 in myeloproliferative neoplasm (MPN) patients (Arranz et al., 2014).
mTOR is a serine/threonine protein kinase that responds to multiple signals and maintains homeostasis. Increased or decreased mTORC1 activity can alter HSC function and cause hematological disorders (Wang et al., 2016a). Rheb1 acts as a key activator of mTOR to play vital roles in maintaining proper hematopoiesis and myeloid differentiation (Aspuria and Tamanoi, 2004). Previously, we reported that Rheb1-deficient mice showed increased phenotypic HSCs, immature neutrophils in bone marrow, and splenomegaly, which are reminiscent of the hematopoiesis seen in MPNs (Wang et al., 2018). Meanwhile, Rheb1 deficiency inhibits the development of macrophages and neutrophils, thus impairing their phagocytic ability (Wang et al., 2016b). Rheb1 cooperated with MLL-AF9 to promote acute myeloid leukemia progression, and deletion of Rheb1 in the MLL-AF9 acute myeloid leukemia mouse model prolonged the survival of mice by inhibiting the mTORC1 signaling pathway (Gao et al., 2016).
Interestingly, our study found that the absolute number of HSCs were increased in Vav1-Cre;Rheb1fl/fl mice, while HSCs were not over expanded under in vitro culture conditions (Wang et al., 2018). This suggested that the expansion of these HSPCs in the bone marrow of Vav1-Cre;Rheb1fl/fl mice might be caused by additional extrinsic factors rather than intrinsic factors. Here in this study, we found that loss of Rheb1 impaired neutrophils ability to secrete IL-6, and this in turn stimulated MSCs to produce more SCF, leading to HSPCs over proliferation.
Vav1-Cre mice (JAX stock #008610, background CD45.2) were purchased from Jackson Lab. Rheb1fl/fl mice (background CD45.2) were kindly provided by Dr. Bo Xiao (Zou et al., 2011). The mice were crossed with B6.SJL mice (background CD45.1) and were backcrossed, respectively, to generate CD45.1 congenital Vav1-Cre mice and Rheb1fl/fl mice (Supplementary Figure 1A). Then the Vav1-Cre mice and Rheb1fl/fl mice were crossed to generated mice in which Rheb1 was specifically deleted in the hematopoietic system (Vav1-Cre;Rheb1fl/fl or Rheb1Δ/Δ, CD45.1). C57BL/6 mice (6–8 weeks old, CD45.2) were the recipient mice in transplantation experiments. Mice were maintained at the specific pathogen-free (SPF) animal facility of the State Key Laboratory of Experimental Hematology (SKLEH). All animal surgeries were approved by the Institutional Animal Care and Use Committee (IACUC), Institute of Hematology and Blood Diseases Hospital, CAMS/PUMC. All efforts were made to minimize mouse suffering.
A 15 μl peripheral blood (PB) sample was obtained from either the tail vein or retroorbital bleeding and diluted with PBE (PBS with 2% fetal bovine serum and 2 mM EDTA). Before staining, ammonium chloride-potassium bicarbonate was used to lyse the red blood cells (RBCs). Bone marrow (BM) cells were flushed out from tibias, femurs and ilia with PBE. The cells were stained with the following antibodies: anti-mouse CD3 biotin, anti-mouse CD4 biotin, anti-mouse CD8a biotin, anti-mouse TER-119 biotin, anti-human/mouse CD45R (B220) biotin, anti-mouse CD11b BIOTIN, STREPTAVIDIN APC-Cy7, anti-mouse CD34 FITC, anti-mouse CD117 (c-Kit) APC, anti-mouse Ly-6A/E (Sca-1) PE-Cyanine7, anti-mouse CD45.2 PE, and anti-mouse CD45.1 Percp-Cy5.5 for HSPCs or anti-mouse CD45.1 FITC, anti-mouse CD45.2 PE, anti-mouse CD11b APC, and anti-mouse Ly-6G (Gr-1) PE-Cyanine7 for neutrophils. All antibodies were purchased from either eBioscience or Invitrogen (United States). The detail information for the antibodies was listed in the Supplementary Table 1. The samples were analyzed with a BD Canto II flow cytometer, more than 10,000 cells were collected and the results were analyzed with FlowJo software.
Percoll-based (GE Healthcare, 17144003, Little Chalfont, United Kingdom) density gradient centrifugation was used for the purification of neutrophils from bone marrow cells (Swamydas et al., 2015). A “100% Percoll” solution is generated by adding 5 ml of 10X HBSS (Gibco, 14065056, United States) to 45 ml of Percoll. Percoll dilutions of 52, 62, and 76% were generated from the “100% Percoll” solution using 1X HBSS-EDTA (Thermo Fisher Scientific, 14025092, United States). The 76, 62, and 52% Percoll separation solutions were successively added to a 15 ml centrifuge tube (avoiding mixing of the three concentrations of Percoll separation solutions). The bone marrow cell suspension was overlaid on the Percoll separation layer, followed by centrifugation for 30 min at 2,800 rpm (1,420 g) at room temperature without braking. Cells were harvested from the 76 and 62% Percoll interface and washed twice with 1X HBSS buffer. 3 ml of Histopaque-1119 (Sigma-Aldrich, 11191, United States) was added to a 15-ml conical centrifuge tube, which was then overlaid with the cell suspension, followed by centrifugation for 30 min at 2,000 rpm (724 g) at room temperature without braking. The neutrophils were then collected at the Histopaque-1119 interface. The surface markers of neutrophils (Ly-6G+CD11b+) were analyzed by flow cytometry.
Mesenchymal stem cells (MSCs) from the compact bones of mice were obtained as previously described (Zhu et al., 2010). To deplete hematopoietic cells from the tibiae and femurs, the bone cavities were washed thoroughly at three times using a syringe until the bones become pale. Hold the humeri, tibiae and femurs with forceps and excise the compact bones carefully into chips of approximately 1–3 mm3 with scissors. The bone chips were transferred into a 25-cm2 plastic culture flask with forceps, then suspend the chips in 3 ml of α-MEM (Hyclone, SH30265.01, United States) containing 10% (vol/vol) FBS (Gibco, 16000-044, United States) in the presence of 1 mg/ml (wt/vol) of collagenase II (Gibco, 17101015, United States). The chips were digested for 1–2 h in a shaking incubator at 37°C with a shaking speed of 200 rpm. The collagenase digestion was stopped when the bone chips become loosely attached to each other. The digestion medium and released cells were aspirated and discarded. Enzyme-treated bone chips were placed in a 10-cm2 dish containing 6 ml of α-MEM supplemented with 10% FBS. Each replanting was considered a passage. Passage 3 MSCs were used for all experiments. The surfaces marker of MSCs (Lin–CD45–CD31–CD51+Sca-1+) were analyzed by Flow cytometry.
BM cells were isolated from the tibias, femurs and ilia of 8-week-old B6.SJL mice. wt LK+ cells were sorted with a c-Kit (CD117) Microbead Kit (MACS, 130-091-224, German) and a Lineage Cell Depletion Kit (MACS, 130-090-858, German) according to the manufacturer’s protocol. 1 × 10⁶ LK+ cells cultured with 6 × 10⁴ MSCs from Rheb1Δ/Δ or Rheb1fl/fl mice for 24 h and counted the number of LK+ cells. For the SCF/c-kit blocking experiment, 1 × 10⁵ LK+ cells cultured with 6 × 10⁴ MSCs from Rheb1Δ/Δ or Rheb1fl/fl mice. SCF inhibitor (MCE, HY-101443, China) was added to the coculture system at 0.5 μM. After 24 h of coculture, counted the number of LK+ cells.
Rheb1fl/fl or RhebΔ/Δ BM cells were isolated from the tibias, femurs and ilia of 8-week-old mice. LKS+ cells were stained with the antibodies indicated above and sorted with a BD FACS Aria III flow cytometer (BD Bioscience, United States). Lin– cells and Lin–c-kit+ (LK+) cells were sorted with a c-Kit (CD117) Microbead Kit (MACS, 130-091-224, Germany) and a Lineage Cell Depletion Kit (MACS, 130-090-858, Germany) according to the manufacturer’s protocol. 2 × 10⁵ wt Lin– cells were co-cultured with 2 × 10⁷ Rheb1fl/fl or Rheb1Δ/Δ BMCs. The total cells were analyzed for the percentage of CD45.2+/CD45.1+ cells by flow cytometry.
For the neutrophils and MSCs coculture assay, 1 × 10⁵ MSCs were cultured in 24-well plate in a volume of 500 μl α-MEM with 15% FBS. After 24h of culture, the MSCs were cultured with 1 × 10⁶ Rheb1fl/fl or Rheb1Δ/Δ neutrophils using cell culture inserts (FALCON, 353095, United States). After 24 h of coculture, the MSCs were harvested, and the relative expression of stem cell factor (SCF) was measured. For the IL-6 neutralization experiment, IL-6 antibody (R&D, MAB406-SP, United States) was added to the coculture system at 10 ng/ml. After 24 h of coculture, MSCs were harvested, and the relative expression of SCF was measured. All cells were incubated at 37°C in a 5% CO2 incubator.
For wt BMC transplantation, BMCs (CD45.2+) were obtained from C57BL/6 mice, and 1 × 10⁶ BMCs were intravenously injected into lethally irradiated 6–8-week-old Rheb1fl/fl or Rheb1Δ/Δ recipient mice (CD45.1+). For wt BMC and Rheb1Δ/Δ or Rheb1fl/fl BMC co-transplantation, 5 × 10⁵ wt BMCs (CD45.2+), 1 × 10⁶ Rheb1Δ/Δ or Rheb1fl/fl BMCs (CD45.1+) and 7.5 × 10⁵ wt MSCs were intravenously injected into lethally irradiated mice (CD45.2+) (Figure 1).
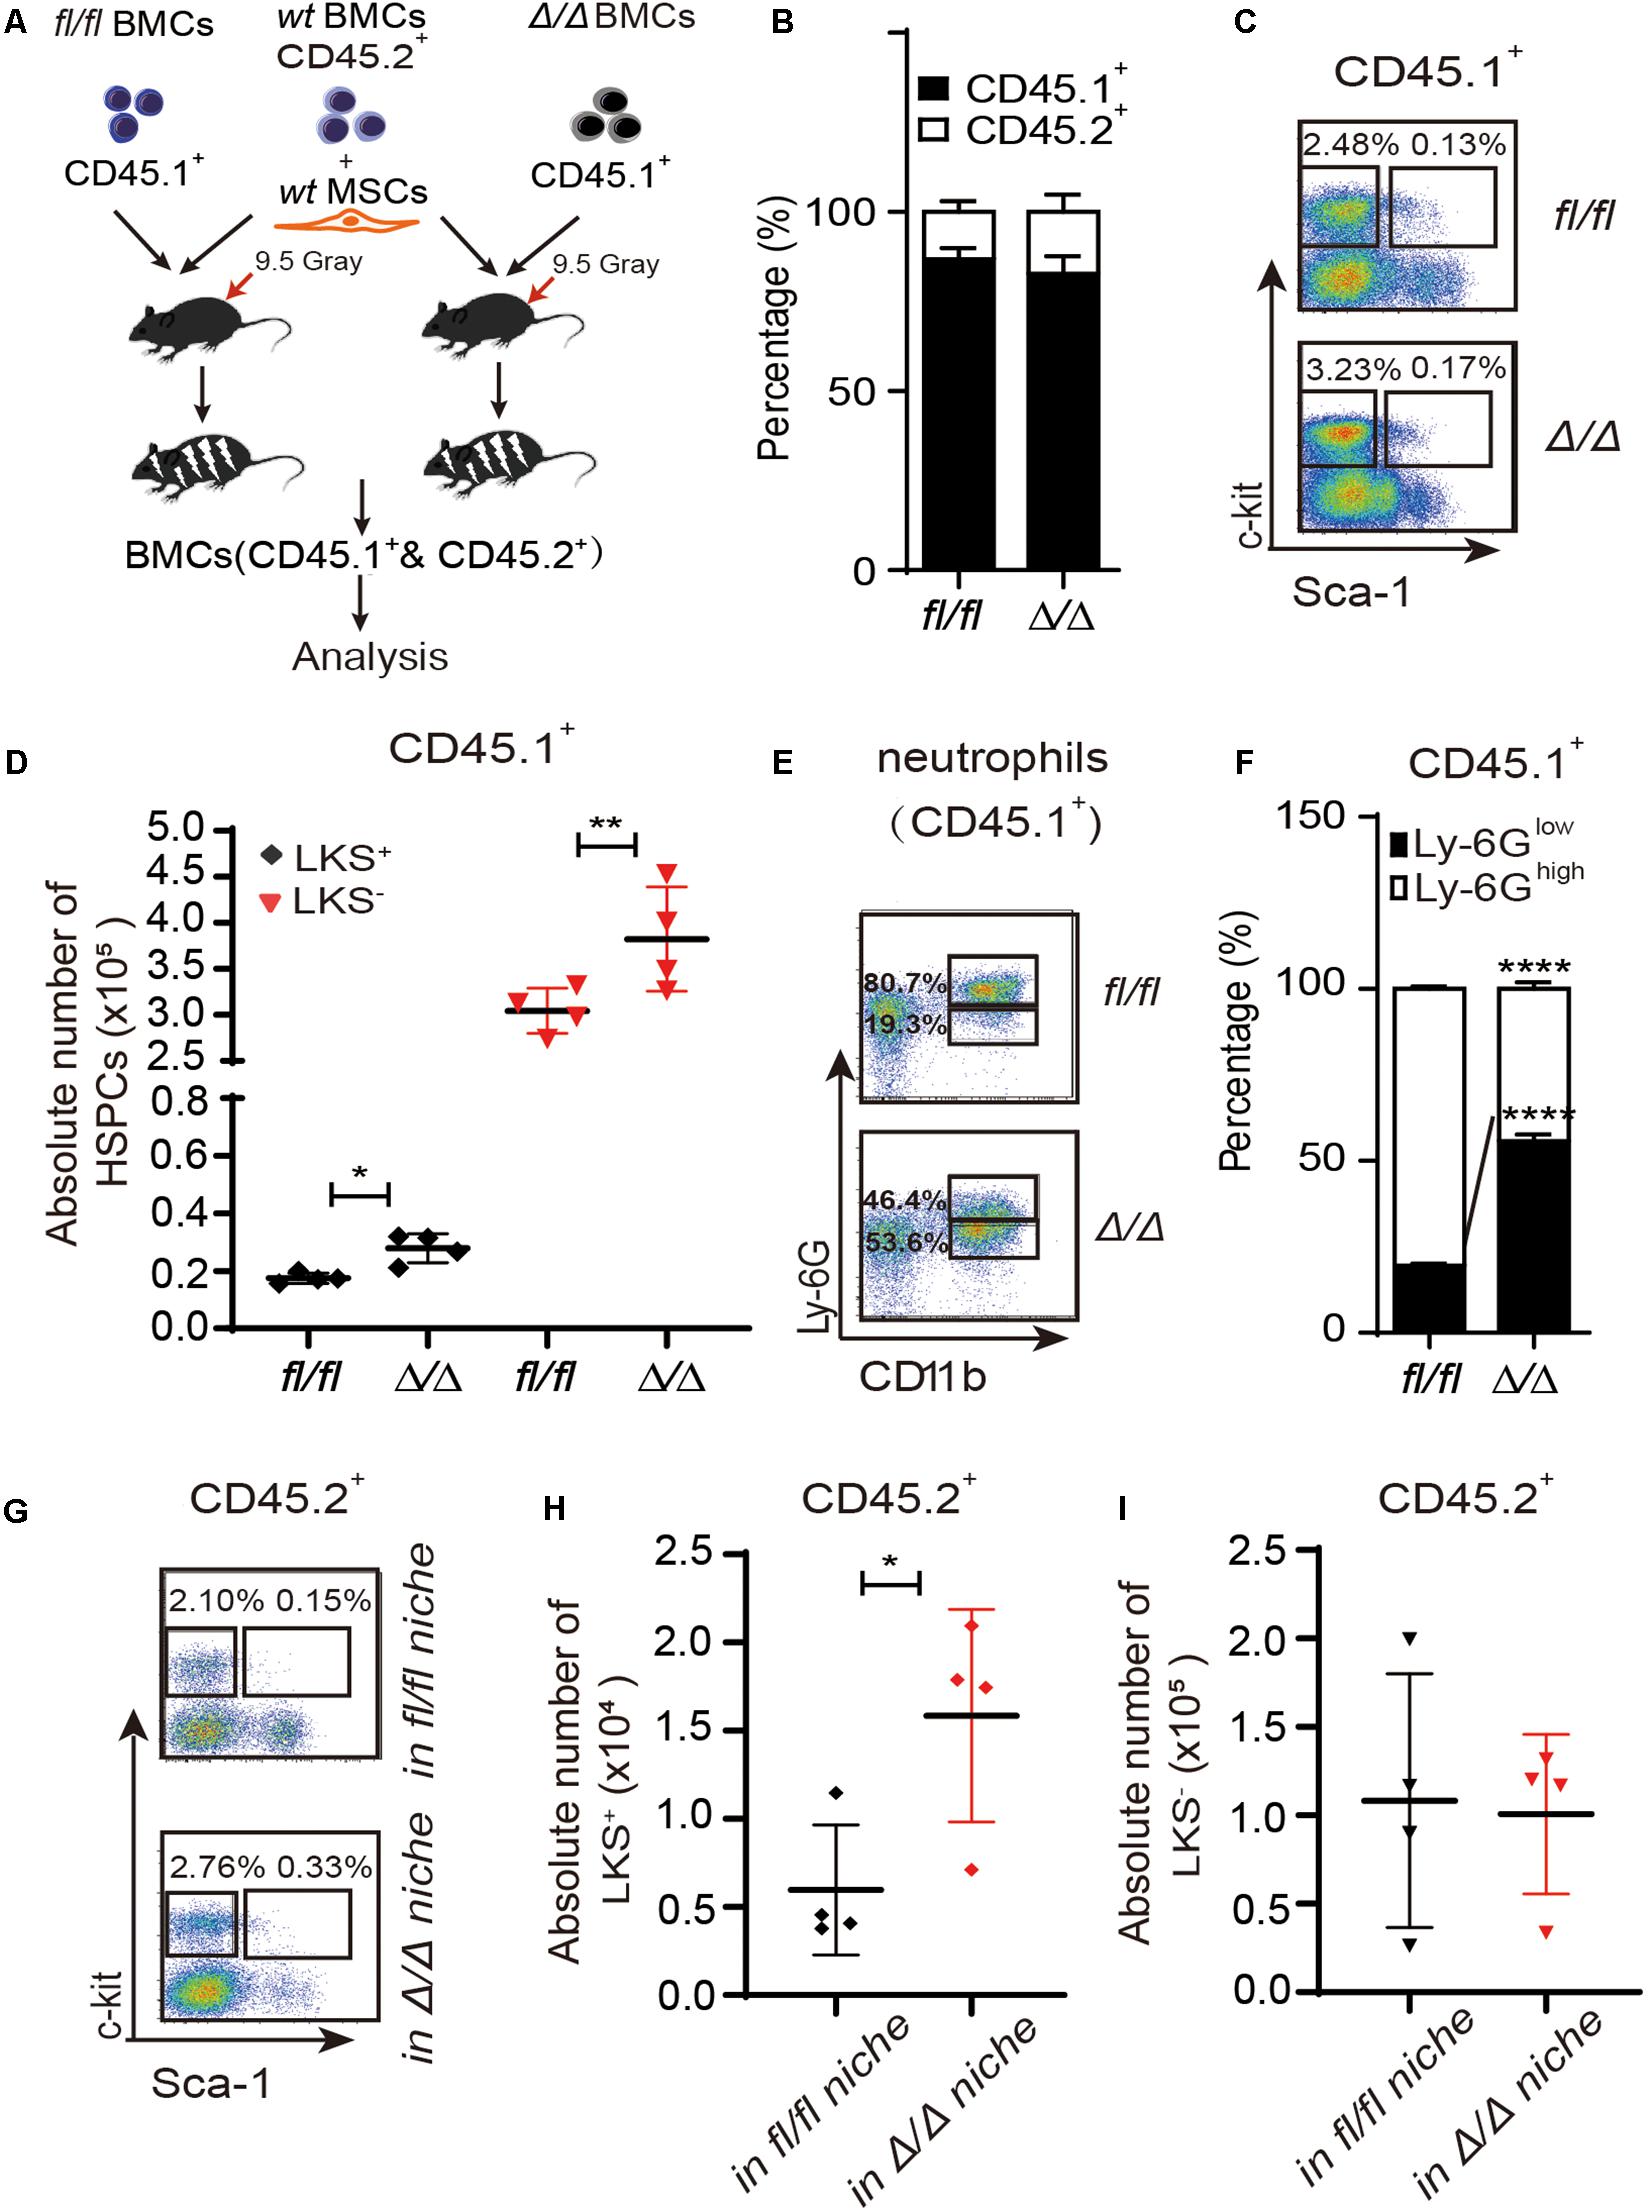
Figure 1. HSPCs are expanded in the Rheb1Δ/Δ blood cell-remodeled bone marrow environment. (A) WT BMCs (CD45.2+) together with wt MSCs and Rheb1Δ/Δ or Rheb1fl/fl BMCs (CD45.1+) were transplanted into lethally irradiated recipient wt mice. (B) The percentages of CD45.1+ cells and CD45.2+ cells in BM 4 months after transplantation. (C,D) The absolute number of CD45.1+LKS+ cells and CD45.1+LKS– cells in BM 4 months after transplantation. (E,F) The percentages of CD45.1+CD11b+Ly-6Ghigh/low neutrophils in BM 4 months after transplantation. (G–I) The absolute number of CD45.2+LKS+ cells and CD45.2+LKS– cells in BM 4 months after transplantation. The data are presented as the mean ± SD, n = 4. *P < 0.05; **P < 0.01; ***P < 0.001.
200 wt LKS+ cells (from B6.SJL mice, CD45.1+) were cocultured with MSCs from Rheb1fl/fl mice or Rheb1Δ/Δ mice for 24 h. The cultured LKS+ cells (CD45.1+) were harvested and intravenously injected into lethally irradiated recipient mice (CD45.2+) with 5 × 10⁵ BMCs (CD45.2+). The reconstitution of PB cells was analyzed every 4 weeks after transplantation for 4 months, and the reconstitution of BM cells was analyzed at 4 months after transplantation (Figure 4).
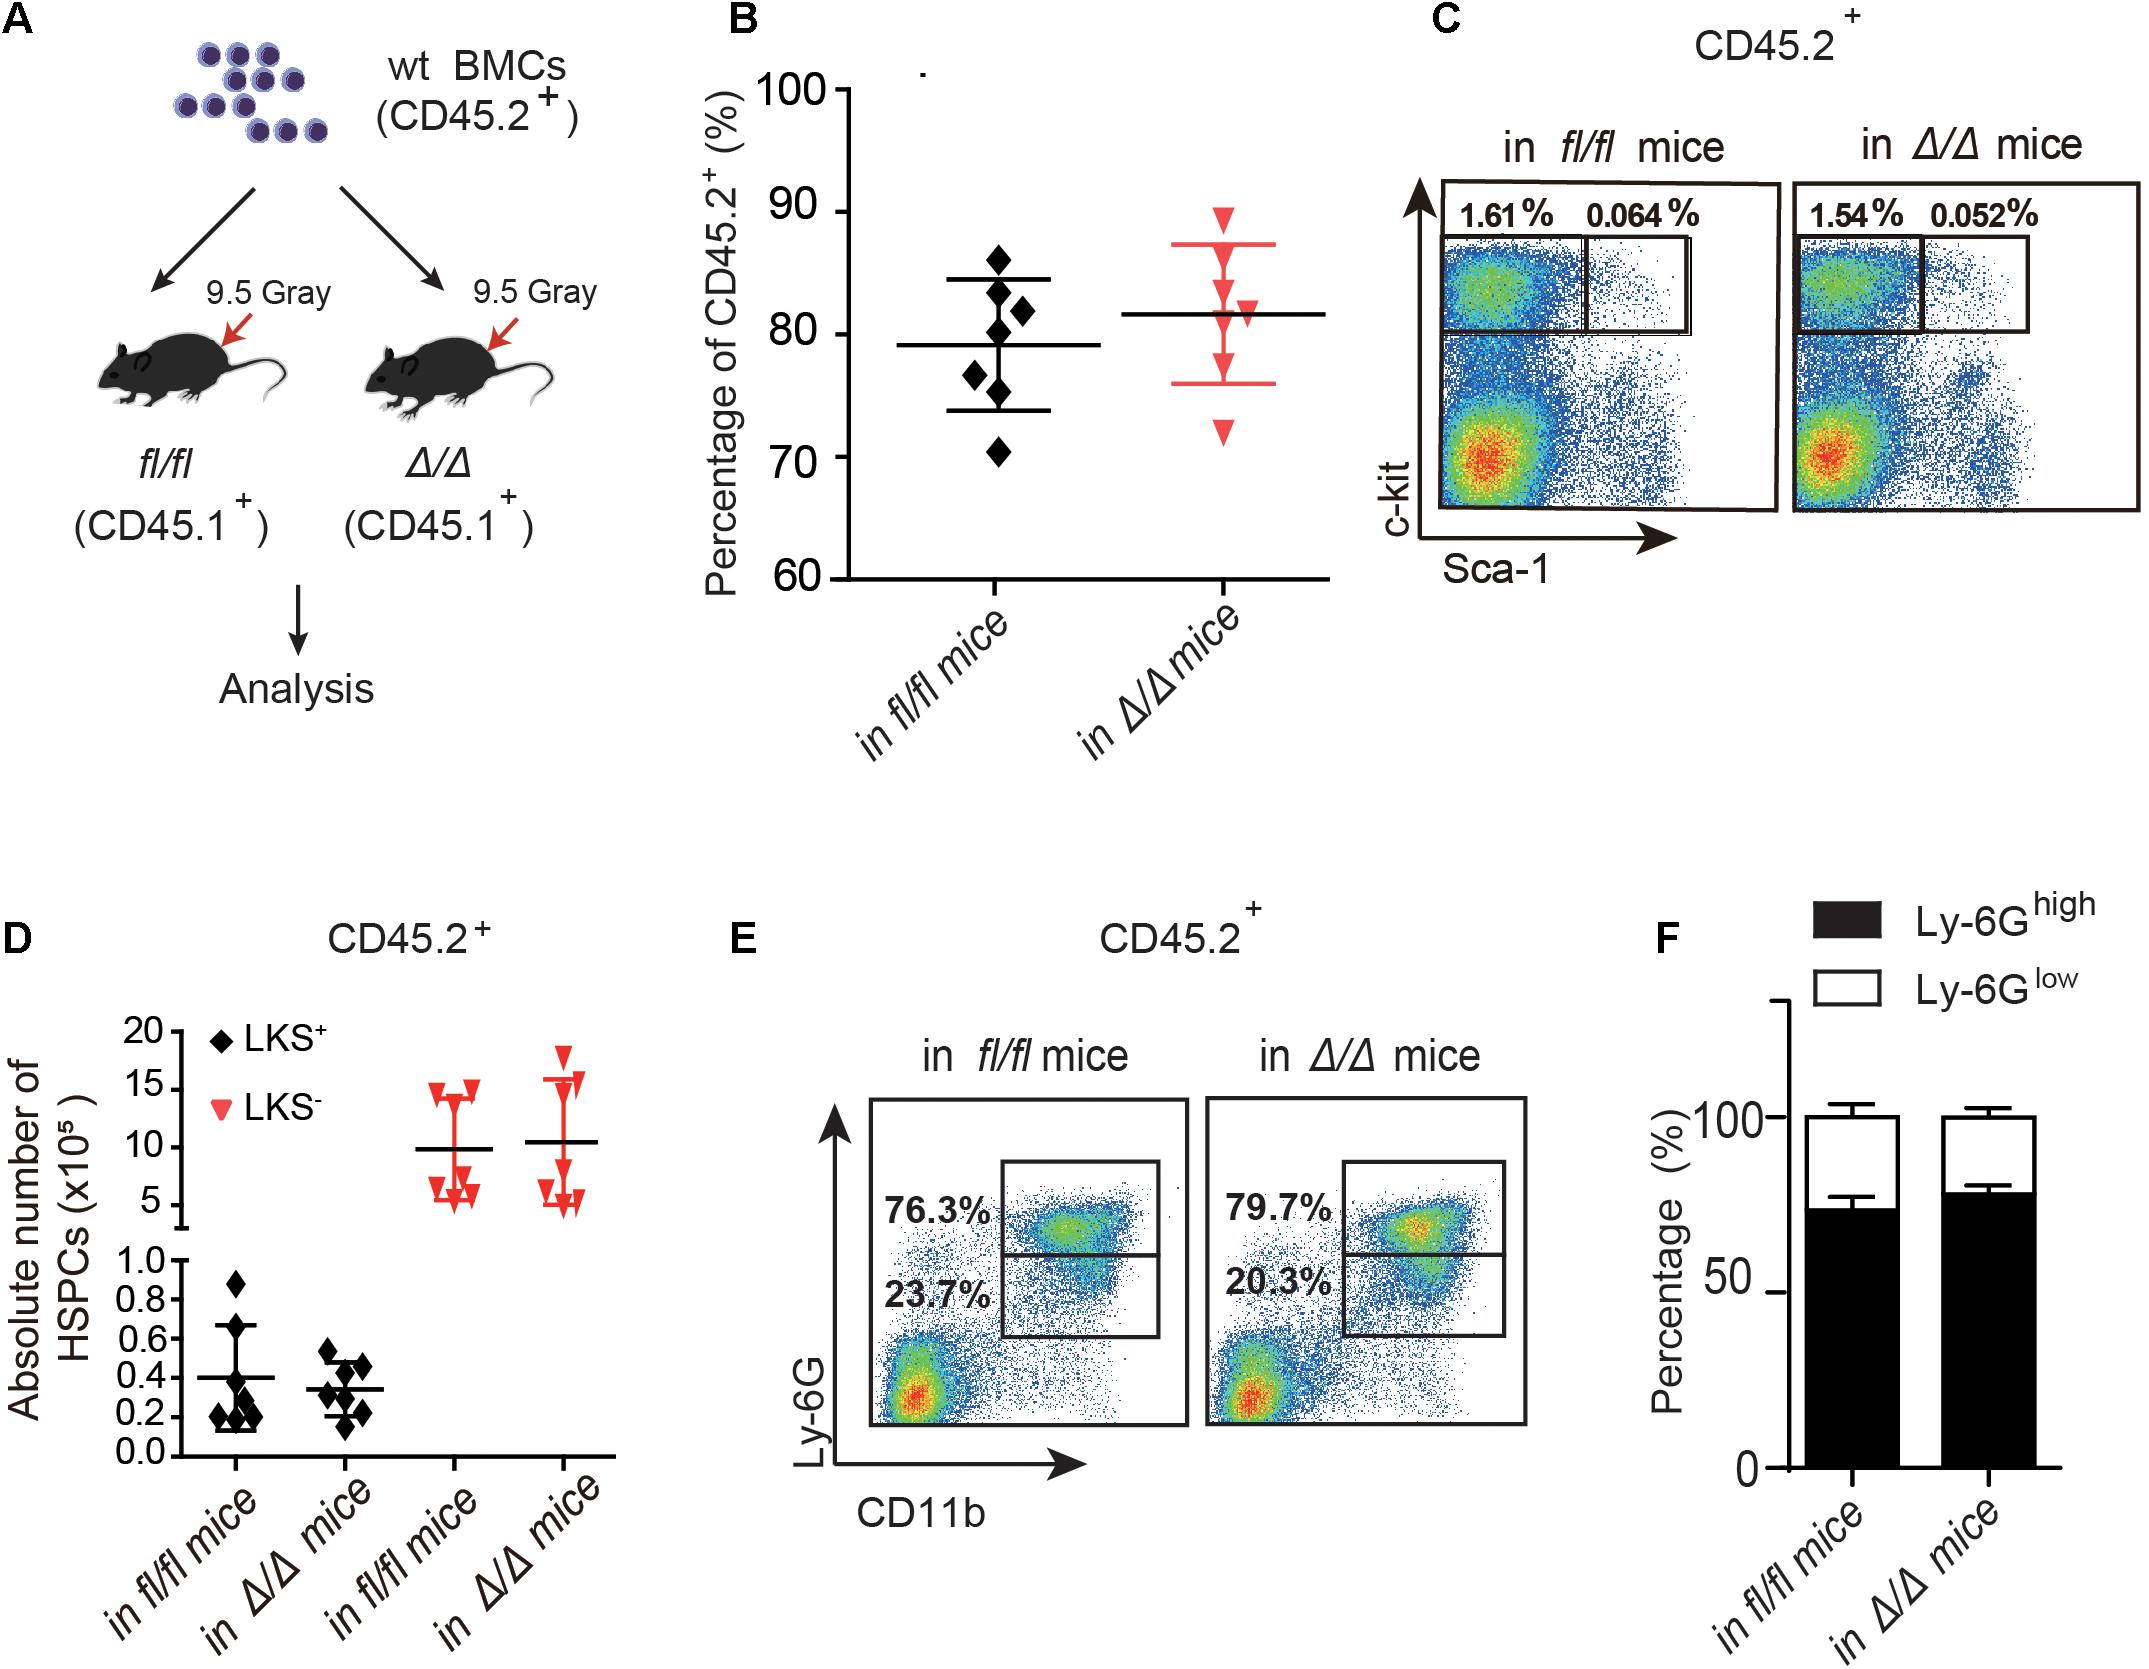
Figure 2. The number of wt HSPCs showed no change in Rheb1Δ/Δ and Rheb1fl/fl mice at 4 months after transplantation. (A) Wild-type (wt) whole bone marrow cells (CD45.2+) were transplantation into lethally irradiated Rheb1Δ/Δ or Rheb1fl/fl mice. (B) The percentage of donor-derived cells (CD45.2+) in PB 4 months after transplantation. (C,D) The absolute number of donor-derived LKS+ and LKS+ cells (CD45.2+) in BM 4 months after transplantation. (E,F) The percentage of donor-derived CD11b+Ly-6Ghigh/low cells (CD45.2+) in BM 4 months after transplantation. The data are presented as the mean ± SD, n = 7.
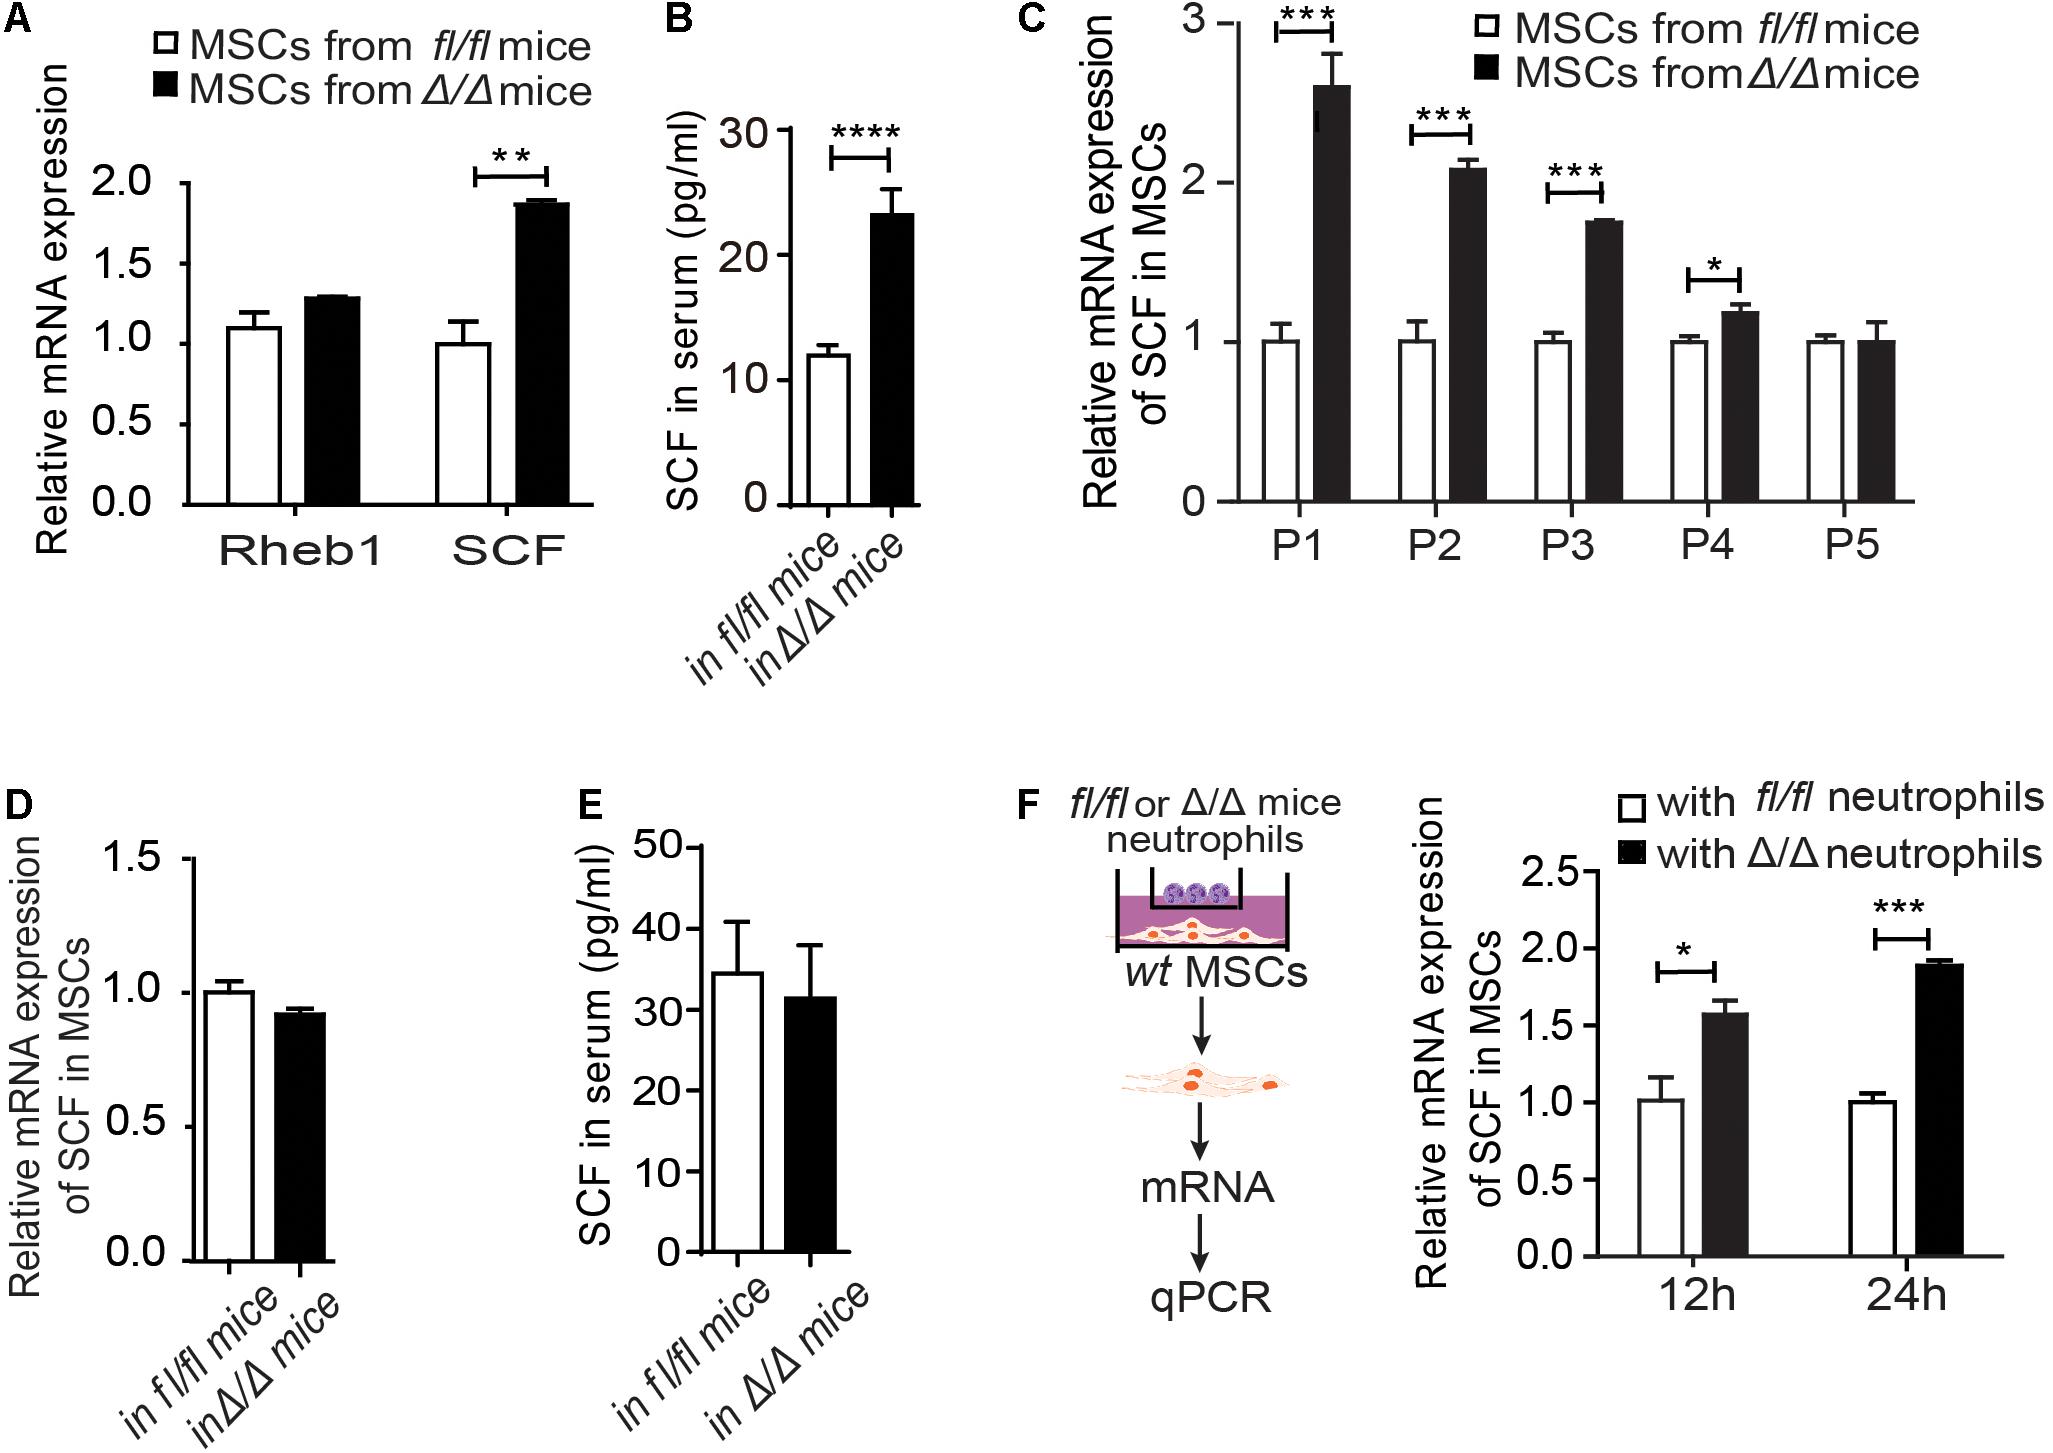
Figure 3. Rheb1-deficient neutrophils stimulate MSCs to secrete more SCF. (A) The relative mRNA expression of Rheb1 and SCF in primary MSCs from Rheb1fl/fl and Rheb1Δ/Δ mice (n = 3). (B) The serum levels of SCF in Rheb1fl/fl and Rheb1Δ/Δ mice (n = 4). (C) The relative mRNA expression of SCF in passage 1 (P1) to P5 cultured MSCs from Rheb1fl/fl and Rheb1Δ/Δ mice (n = 3). (D) The relative mRNA expression of SCF in MSCs from Rheb1fl/fl and Rheb1Δ/Δ mice 4 months after wt BMC transplantation (n = 3). (E) The serum level of SCF in Rheb1fl/fl or Rheb1Δ/Δ mice 4 months after wt BMC transplantation (n = 3). (F) The relative mRNA expression of SCF in wt MSCs cocultured with Rheb1fl/fl or Rheb1Δ/Δ neutrophils after 12 h and 24 h (n = 3). The data are presented as the mean ± SD. *P < 0.05; **P < 0.01; ***P < 0.001; ****P < 0.0001.
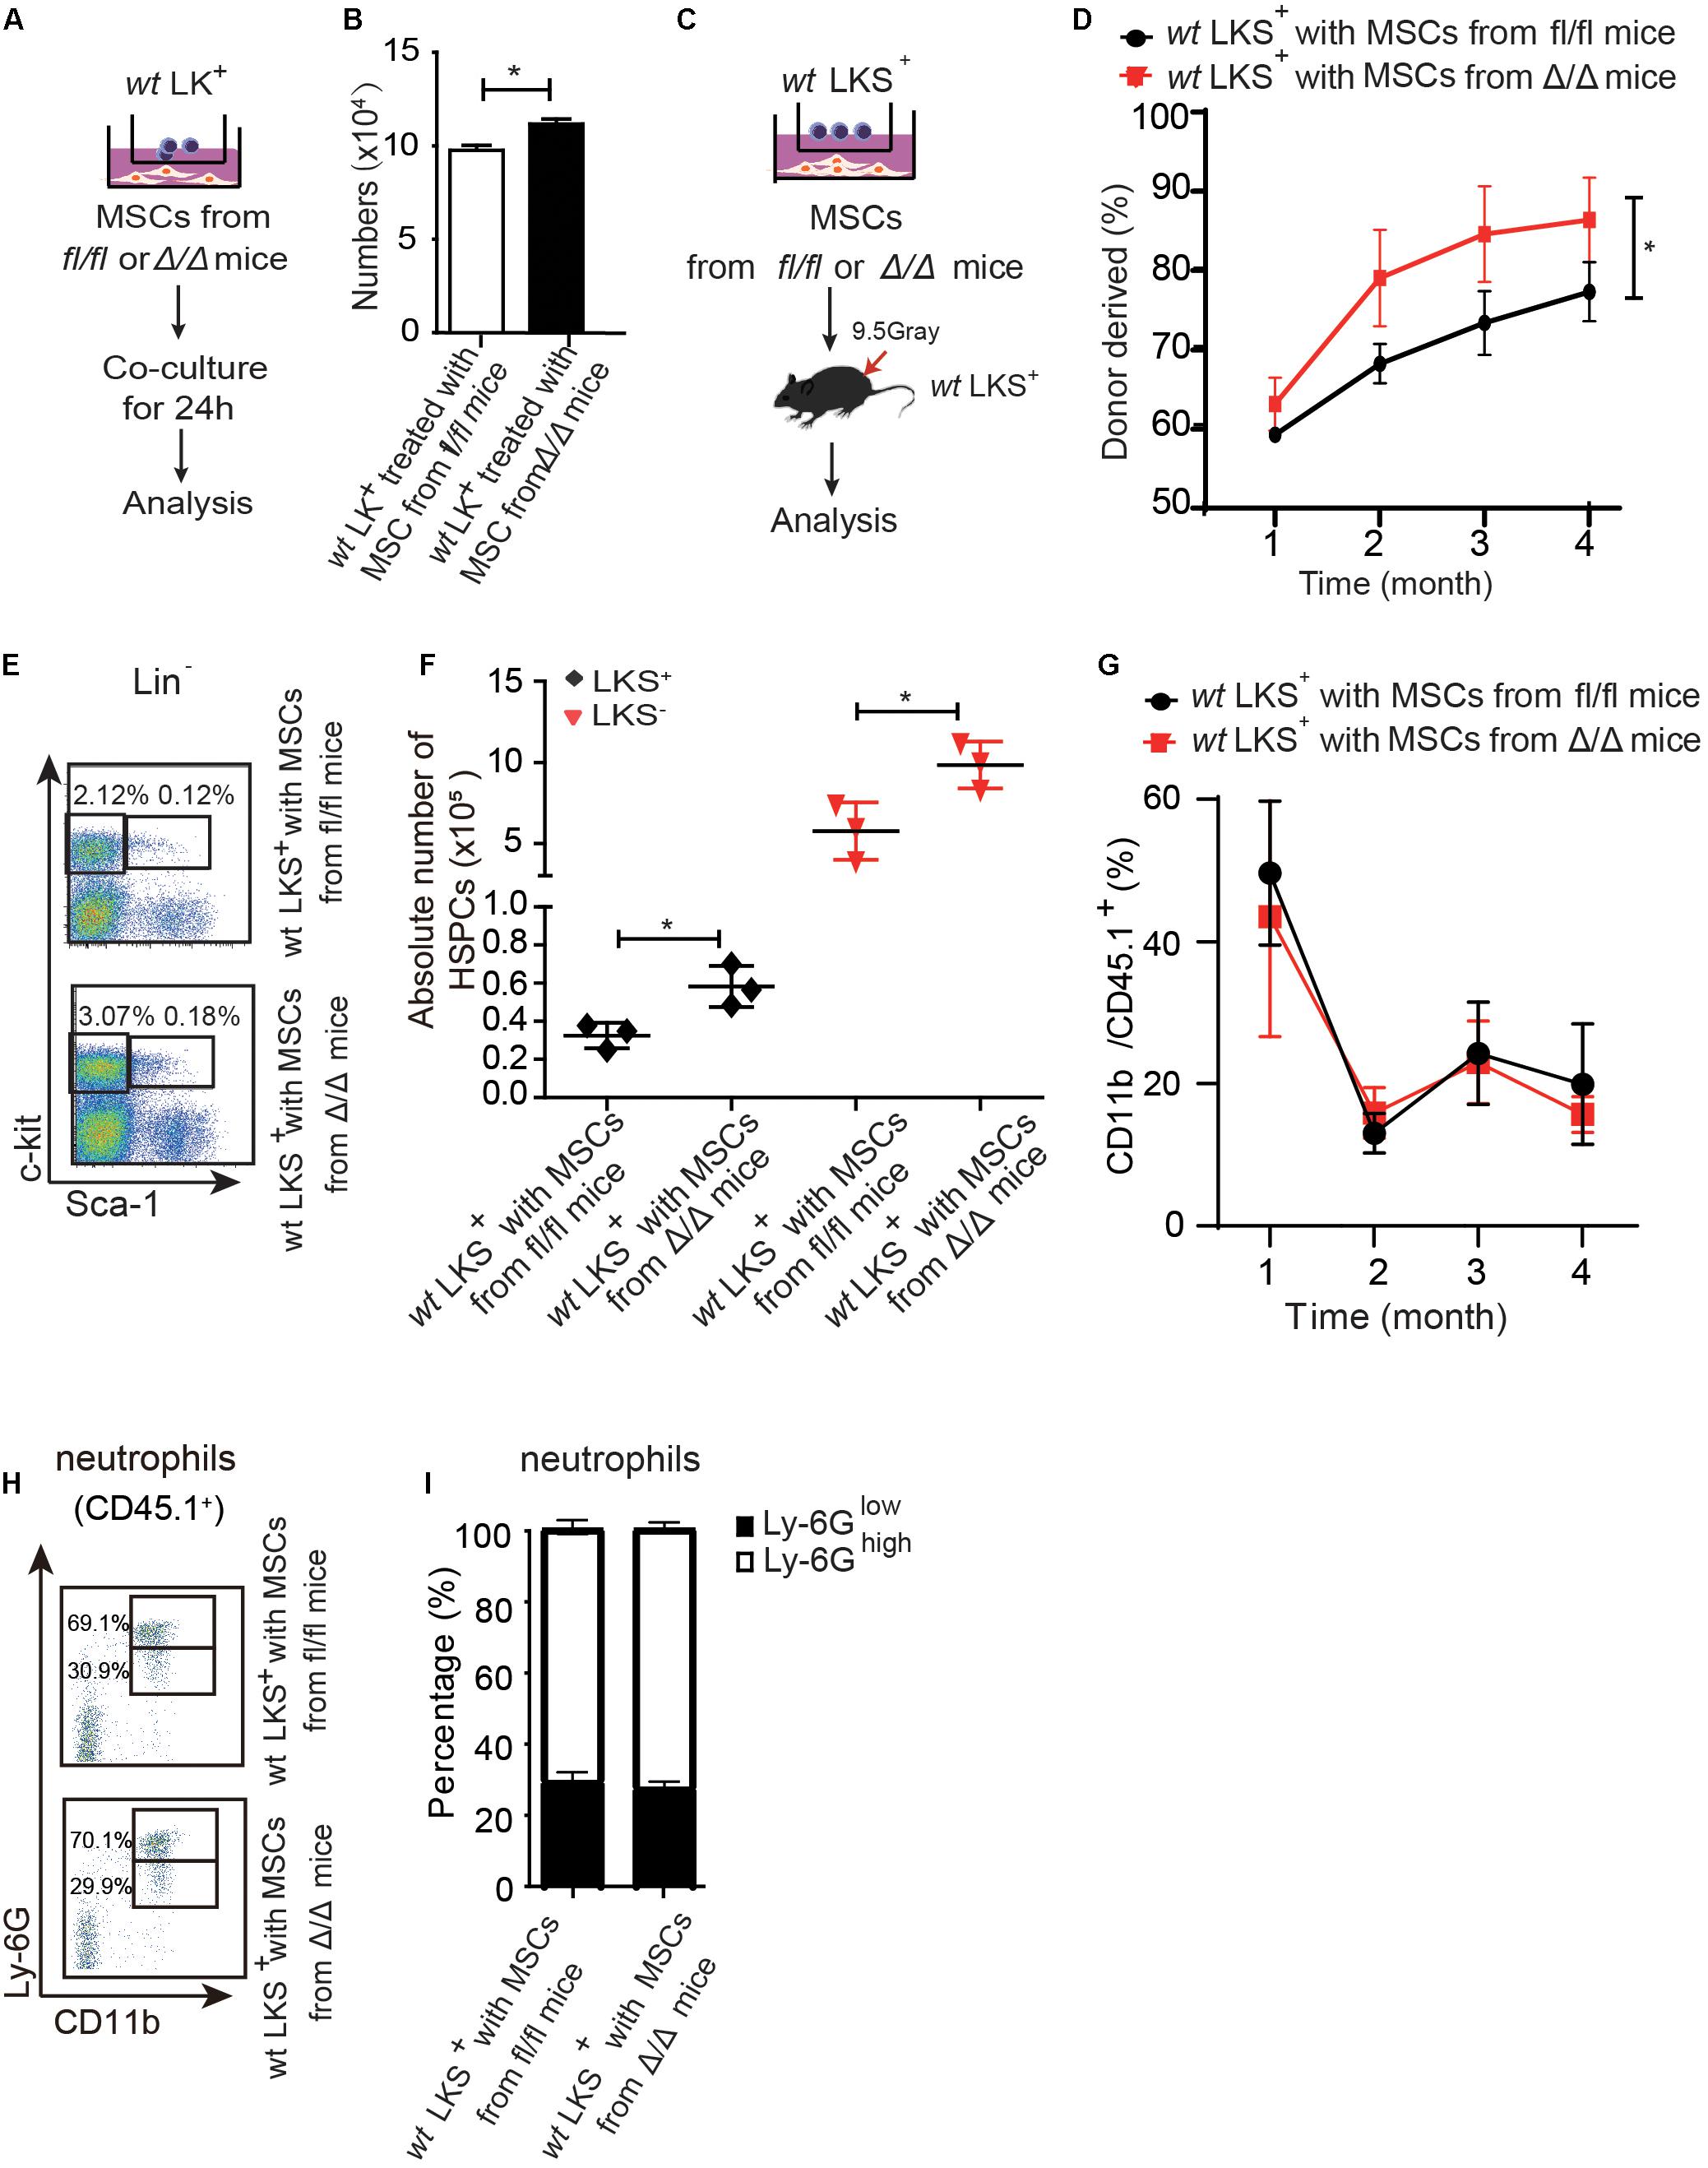
Figure 4. Rheb1-deficient neutrophil trained-MSCs promote wt HSPCs expansion. (A,B) The number of LK+ cells after coculturing with MSCs from Rheb1fl/fl and Rheb1Δ/Δ mice for 24 h. (C) wt LKS+ (CD45.1+) were cultured with MSCs from Rheb1Δ/Δ or Rheb1fl/fl mice for 24 h, and the cultured LKS+ (CD45.1+) cells and newly isolated wt WBMCs (CD45.2+) were transplanted into lethally irradiated recipient mice by intravenously injection. (D) The percentage of donor-derived LKS+ cells (CD45.1+) in PB 4 months after transplantation. The data are presented as the mean ± SD, n = 5. (E,F) The absolute number of donor-derived LKS+ cells (CD45.1+) in BM (n = 3). (G) The percentage of donor-derived CD11b+ cells (CD45.1+) in PB. The data are presented as the mean ± SD, n = 5. (H,I) The percentage of donor-derived CD11b+Ly-6G high/low neutrophils (CD45.1+) in BM 4 months after transplantation. The data are presented as the mean ± SD. *P < 0.05.
CML patients’ BM cells were obtained from the Blood Bank of the State Key Laboratory of Experimental Hematology, Institute of Hematology and Blood Diseases Hospital, CAMS/PUMC. Specimen acquisition was approved by the Ethics Committee of Blood Diseases Hospital, Chinese Academy of Medical Sciences. All donors signed informed consent forms. One-fifth the volume of hydroxyethyl starch was added to the patient samples, and let stand for 1 h at room temperature to allow the red blood cells to fully sediment. Gently suck the supernatant and divide it into two according to the volume of 3:1. A large volume of supernatant fluid was selected to culture MSC in containing 6 ml of α-MEM supplemented with 10% (vol/vol) FBS. The other was separated using a Ficoll (GE, United States) gradient to generated mononuclear cells (MNCs).
RNA was extracted using the RNeasy Mini Kit (QIAGEN, 74106, Germany) according to the manufacturer’s protocol. cDNA synthesis was performed using a cDNA reverse transcription kit (Takara, RR047A, Japan) according to the manufacturer’s protocol. Quantitative PCR assays were performed in 96-well Micro Amp Fast Optical Reaction Plates (Applied Biosystems, 4344904, United States) using SYBR Green Mix (Roche, 04913914001, Switzerland). The signal was detected using the Step-One Plus Real-Time PCR System (QuantStudio5). GAPDH was used as an endogenous control for gene expression assays.
500 μl PB was obtained from the retro-orbital bleeding of mice and clotted for 1 h at room temperature, then centrifuged at 5,915 rpm (3,000 g) for 10 min, and the serum was collected for determination. Then ELISA was performed using the Mouse SCF ELISA Kit (Quantikine, MCK00, United States) and the Mouse IL-6 ELISA Kit (NRC, TAE-385, Canada) according to the manufacturer’s protocols. A total of 5 × 10⁶ Rheb1fl/fl or Rheb1Δ/Δ neutrophils in 200 μl of PBS were frozen and thawed three times and centrifuged at 5,915 rpm (3,000 g) for 10 min, and the liquid supernatants were collected for IL-6 determination. The cell culture medium was concentrated with an ultra-gentrification device (Merck, UFC900308, Germany). The ELISA tests were read on a SynergyH4 Hybrid Reader at 450 nm.
GraphPad Prism 6.0 was used for statistical analyses. Every experiment was compared as two groups. The data are presented as the mean ± standard deviation (SD). The unpaired two-tailed Student’s t-test was used to compute the P-values. P < 0.05 was considered significant. Significant differences are indicated with asterisks (∗P < 0.05; ∗∗P < 0.01; ∗∗∗P < 0.001).
We have shown that Vav1-Cre;Rheb1fl/fl mice present HSCs and immature myeloid cells expansion in BM, which resemble the phenotype of MPN patients (Wang et al., 2018). To investigate whether Rheb1-deficient cells regulate the proliferation of HSPCs, we established a chimeric mouse model with wt HSPCs and a Rheb1Δ/Δ blood cell-remodeled bone marrow environment. We isolated MSCs from bone of wt mice (wt MSCs, Supplementary Figure 1B), and transplanted 5 × 10⁵ wt BMCs (CD45.2+) together with 7.5 × 10⁵ wt MSCs and 1 × 10⁶ Rheb1Δ/Δ or Rheb1fl/fl BMCs (CD45.1+) into lethally irradiated recipient wt mice (CD45.2) (Figure 1A). The percentage of Rheb1Δ/Δ and Rheb1fl/fl BMC-derived cells (CD45.1+) in PB was approximately 80%, 4 months after the transplantation, and the percentage of wt BMC-derived cells (CD45.2+) in PB was close to 20% in mice after the transplantation (Figure 1B and Supplementary Figure 1C). The absolute number of Rheb1Δ/Δ -derived LKS+ and LKS– cells (CD45.1+) were significantly increased when compared with those of Rheb1fl/fl-derived LKS+ and LKS– cells (CD45.1+), respectively (Figures 1C,D). Rheb1Δ/Δ BMC-derived myeloid cells were also increased in the PB of mice (Supplementary Figure 1D). Moreover, the percentage of Rheb1Δ/Δ Ly-6GlowCD11b+ immature neutrophils (CD45.1+) was increased in mice when compared with that of Rheb1fl/fl Ly-6GlowCD11b+ immature neutrophils (Figures 1E,F). These phenotypes were similar with Rheb1Δ/Δ mouse (Wang et al., 2018). Then we analyzed the absolute number of wt HSPCs (CD45.2+) in the Rheb1Δ/Δ blood cell-remodeled bone marrow environment in the chimeric mouse model, and found that the absolute number of wt LKS+ cells (CD45.2+) transplanted with Rheb1Δ/Δ BMCs were higher than those of the cells transplanted with Rheb1fl/fl BMCs (Figures 1G–I). The percentage of wt BMC-derived myeloid cells (CD45.2+) was increased in PB, while the ratio of wt BMC-derived Ly-6GhighCD11b+ and Ly-6GlowCD11b+ neutrophils (CD45.2+) was not changed in the BM of mice co-transplanted with Rheb1Δ/Δ BMCs (Supplementary Figures 1E,F). It indicated that Rheb1Δ/Δ blood cell remodeled bone marrow environment and promoted HSPC proliferation. To explore whether Rheb1Δ/Δ BM cells directly promoted phenotypic HSPCs over proliferation, we cocultured wt Lin– cells (CD45.2+) with BMCs from Rheb1fl/fl and Rheb1Δ/Δ mice (CD45.1+) (Supplementary Figure 2A). Interestingly, the number of wt Lin– cells cocultured with BMCs from Rheb1Δ/Δ mice was similar with that in the control group at 24 h (Supplementary Figure 2B). These data suggested that Rheb1Δ/Δ BM cells indirectly promoted HSPCs over-proliferation.
To investigate whether the niche cells affect the expansion of HSPCs in Rheb1Δ/Δ mice, we transplanted wt whole bone marrow cells (CD45.2+) into lethally irradiated Rheb1Δ/Δ or Rheb1fl/fl recipient mice (CD45.1+) and analyzed the donor-derived HSPCs (CD45.2+) at 4 months after transplantation (Figure 2A). The rate of donor chimerism was approximately 80% in both Rheb1Δ/Δ and control mice (Figure 2B). The absolute number of donor-derived LKS+ cells and LKS– cells (CD45.2+) in Rheb1Δ/Δ mice were similar when compared with those in the control mice (Figures 2C,D). Since Rheb1 deletion caused increased number and immaturity of neutrophils in steady condition (Wang et al., 2018), we also analyzed neutrophils by flow cytometry (FACS) with CD11b and Ly-6G antibodies, that have been used as neutrophil subpopulation markers for the identification of myelocytes or promyelocytes, as well as immature or mature neutrophils. The CD11b+Ly-6G+ subpopulation of donor-derived cells (wt) in Rheb1Δ/Δ mice was similar to that in the control mice (Figure 2E,F). These data indicated that niche cells in Rheb1Δ/Δ mice contributed little to HSCs proliferation in vivo, while Rheb1Δ/Δ BM cells cooperated with niche cells to promote HSCs proliferation.
To investigate whether Rheb1-deficient BM cells interacted with MSCs and stimulated HSCs expansion, we evaluated the expression of Rheb1 and SCF in MSCs from Rheb1Δ/Δ mice. We found that the mRNA expression of SCF was higher in primary MSCs from Rheb1Δ/Δ mice than that from Rheb1fl/fl mice, while Rheb1 expression was equal in these two cell types (Figure 3A). The SCF level in serum was also increased in Rheb1Δ/Δ mice when compared with that in Rheb1fl/fl mice (Figure 3B), while the expression of EPO, G-CSF, TPO IL-3 and IL-6 showed no difference between two groups (Supplementary Figure 3A). Furthermore, we cultured MSCs derived from Rheb1fl/fl and Rheb1Δ/Δ mice in vitro and analyzed the expression of SCF in MSCs after serial passages. We found that in comparison with the MSCs from Rheb1fl/fl mice, the expression of SCF remained at a higher level in MSCs from Rheb1Δ/Δ mice at passage 3 and then decreased to about the same level as in MSCs from that of Rheb1fl/fl mice at passage 5 (Figure 3C). Interestingly, when wt BMCs were transplanted into lethally irradiated Rheb1fl/fl and Rheb1Δ/Δ mice (Figure 2A), SCF mRNA expression in MSCs and SCF serum levels were restored to normal levels (Figures 3D–E). These results demonstrated that the higher expression of SCF in MSCs from Rheb1Δ/Δ mice was caused by extrinsic factors from the bone marrow cells of Rheb1Δ/Δ mice and was reversible under native conditions.
To evaluate the specific role(s) of Rheb1Δ/Δ BMCs in influencing MSCs, we cocultured wt MSCs with Rheb1Δ/Δ or Rheb1fl/f T cells, B cells and myeloid cells for 12 h and then analyzed the expression of SCF in MSCs under each condition. Interestingly, the expression of SCF was higher in MSCs in the presence of Rheb1Δ/Δ myeloid cells than in the presence of Rheb1Δ/Δ T cells or B cells (Supplementary Figure 3B). In our previous study, we showed that the differentiation of neutrophils was abnormal in the BM of Rheb1Δ/Δ mice. Hence, we isolated neutrophils (Supplementary Figure 3C) from bone marrow cells and cocultured wt MSCs with Rheb1fl/fl and Rheb1Δ/Δ neutrophils for 24 h. We found that the expression of SCF was significantly increased in MSCs in the presence of Rheb1Δ/Δ neutrophils after cultured for 24 h when compared with the control (Figure 3F). Taken together, our results suggested that Rheb1Δ/Δ neutrophils stimulated MSCs to produce more SCF.
We then cocultured 1 × 10⁶ LK+ cells with 6 × 10⁴ MSCs from Rheb1Δ/Δ or Rheb1fl/fl mice for 24 h and found that the number of LK+ cells cocultured with MSCs from Rheb1Δ/Δ mice was more than the number of LK+ cells cocultured with MSCs from Rheb1fl/fl mice (Figures 4A,B). Next, we blocked SCF/c-kit signaling by adding a SCF inhibitor in the culture medium. We found that the number of LK+ cells was equally decreased in coculturing with MSCs from Rheb1Δ/Δ or Rheb1fl/fl mice in medium with SCF inhibitor (Supplementary Figures 3D,E). These results indicated that Rheb1-deficient neutrophil-trained MSCs could promote wt HSPCs expansion through SCF signaling pathway.
We further cocultured 200 wt LKS+ (CD45.1+) with 2 × 10⁴ MSCs from Rheb1Δ/Δ or Rheb1fl/fl mice for 24 h, then transplanted the cultured LKS+ (CD45.1+) cells with 5 × 10⁵ newly isolated wt WBMCs (CD45.2+) into lethally irradiated recipient mice by intravenously injection respectively (Figure 4C). We found that the percentage of chimerism was higher in mice transplanted with LKS+ cells cocultured with MSCs from Rheb1Δ/Δ mice when compared with those from Rheb1fl/fl mice (Figure 4D). Accordingly, the absolute number of LKS+ (CD45.1+) cells treated with MSCs from Rheb1Δ/Δ mice was significantly increased in comparison with the controls at 4 months after transplantation (Figures 4E,F). However, the percentage of CD11b+ (CD45.1+) myeloid cells was similar in the PB of the two groups (Figure 4G). The ratio of Ly-6GhighCD11b+ and Ly-6GlowCD11b+ neutrophils was also not changed between the two groups (Figures 4H,I). These data indicated that HSPCs cocultured with MSCs from Rheb1Δ/Δ mice exhibited a higher expansion capacity while their ability to differentiate into myeloid cells was not changed. MSCs educated by Rheb1-deficient neutrophils induced LKS+ over proliferation but not myeloid differentiation.
To investigate the underlying mechanisms by which Rheb1-deficient neutrophils stimulate MSCs to increase SCF production, we measured the mRNA expression of several potential interleukin and chemokine candidates secreted by neutrophils (Supplementary Figure 3F). We found that the mRNA and protein expression levels of IL-6 were decreased in Rheb1Δ/Δ neutrophils when compared with those from the control (Figures 5A,B, 0 h). We confirmed that IL-6 is mainly expressed in myeloid cells (Supplementary Figure 3G), and found that IL-6 mRNA and protein expression levels in Rheb1Δ/Δ neutrophils remained lower after cultured with wt MSCs for 24 h in vitro (Figures 5A,B, 24 h). In addition, the level of IL-6 in the Rheb1Δ/Δ neutrophil coculture medium was also lower than that in the control (Figure 5C). These data indicated that Rheb1Δ/Δ neutrophils expressed and secreted less IL-6 than Rheb1fl/fl neutrophils. Since MSCs are immunomodulatory cells and secrete a variety of cytokines, including IL-6, we measured the mRNA expression of IL-6 in MSCs and found that its expression in MSCs from Rheb1Δ/Δ mice was similar to that in MSCs isolated from Rheb1fl/fl mice (Supplementary Figure 3H). To determine the role of IL-6 in MSCs, we cultured wt MSCs with different concentrations of IL-6 and analyzed the relative SCF mRNA expression in MSCs at 24 h. We found that higher IL-6 treatment suppressed SCF mRNA expression in MSCs (Figure 5D). We then blocked IL-6 signaling by adding an IL-6 neutralizing antibody in the media in which Rheb1Δ/Δ or Rheb1fl/fl neutrophils were cocultured with wt MSCs, and measured the expression of SCF mRNA in MSCs (Figure 5E, left panel). We found that the mRNA expression of SCF was significantly increased in MSCs after treatment with the IL-6-neutralizing antibody in coculture with either Rheb1fl/fl or Rheb1Δ/Δ neutrophils (Figure 5E, right panel). These data suggested that the lower expression of IL-6 in Rheb1Δ/Δ neutrophils stimulated the expression of SCF in MSCs.
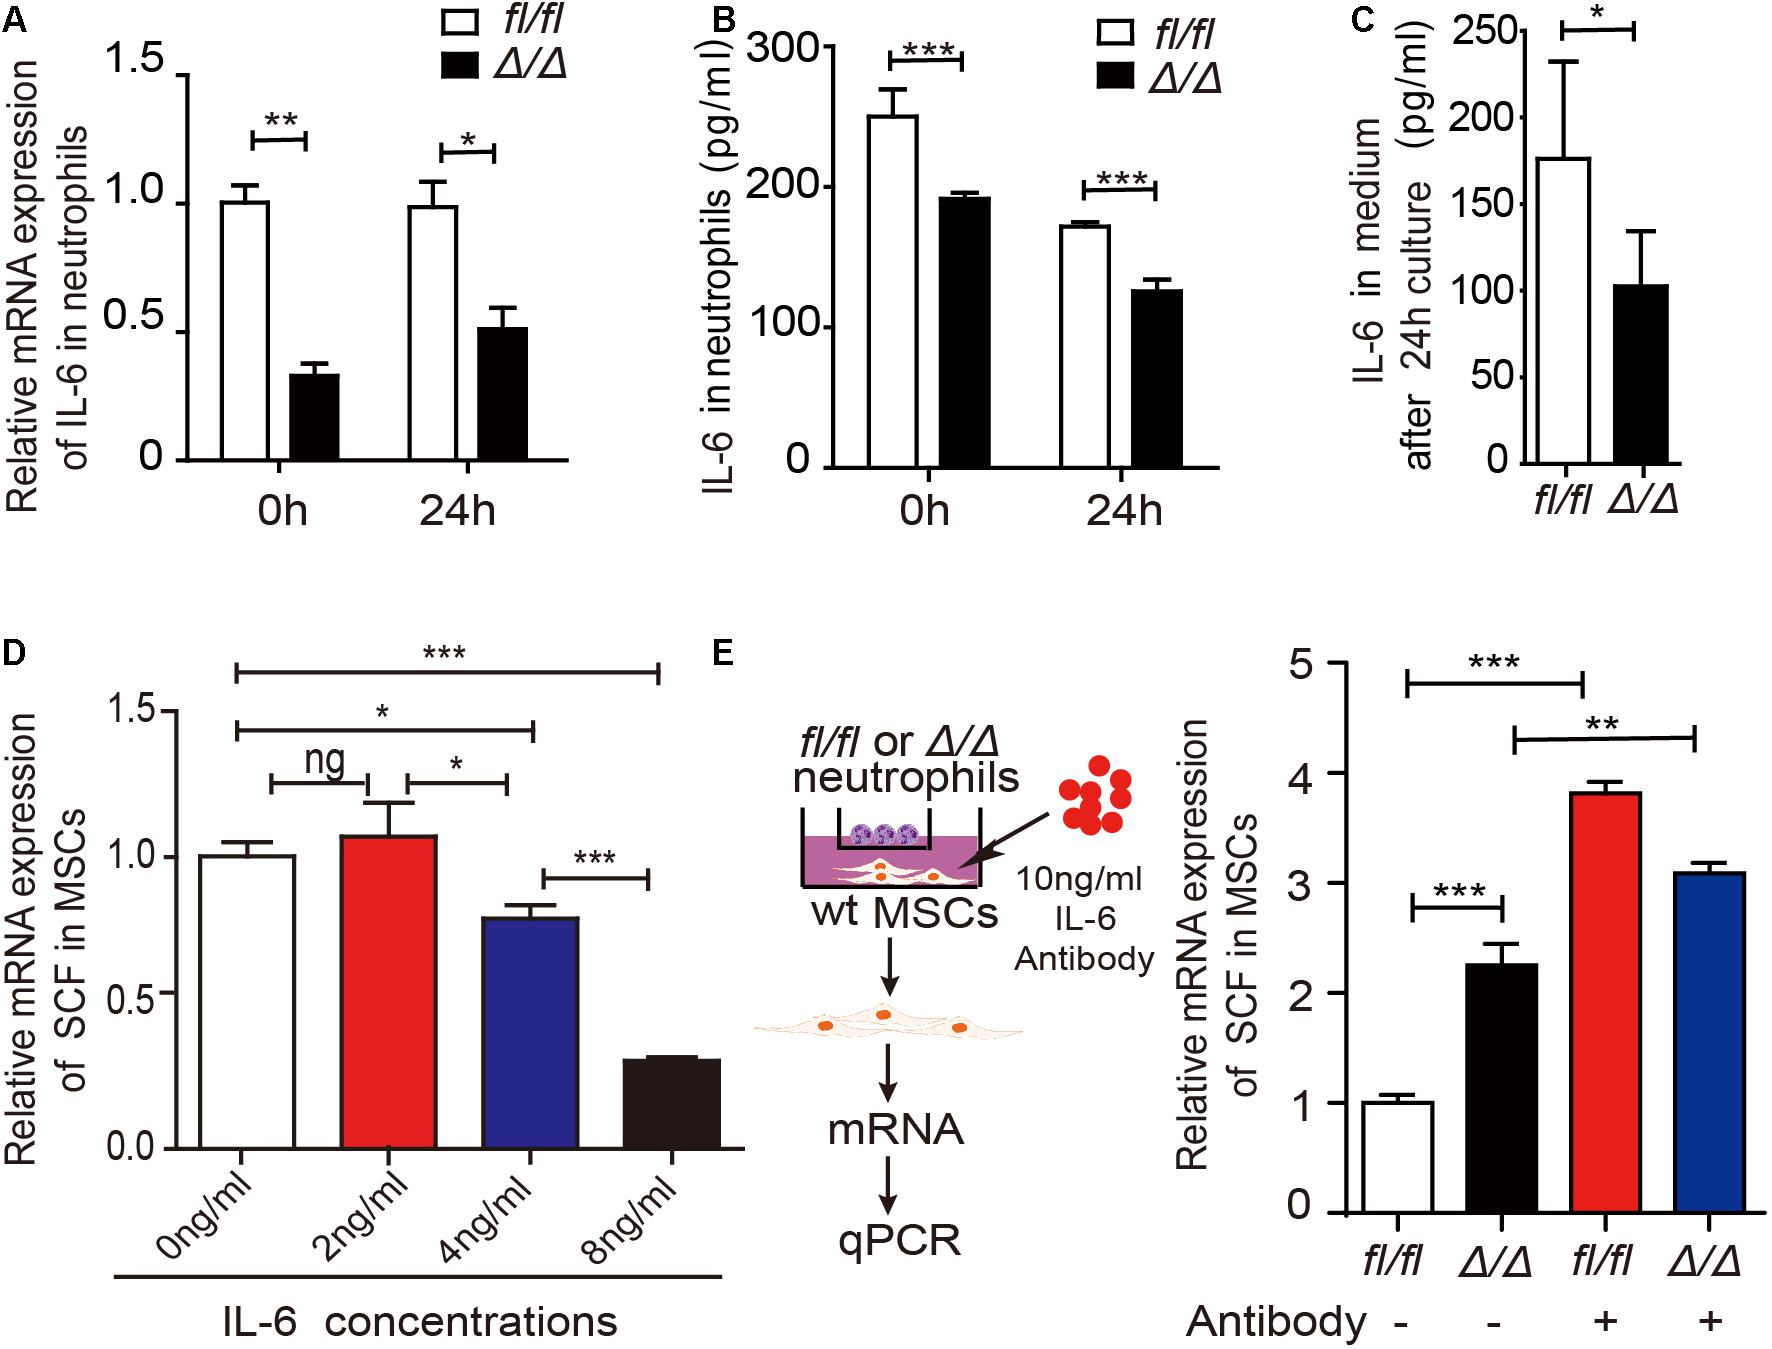
Figure 5. Rheb1-deficient neutrophils stimulate MSCs to produce more SCF by decreasing IL-6 expression. (A) The relative mRNA expression of IL-6 in Rheb1fl/fl or Rheb1Δ/Δ neutrophils when separated from BM (0 h) or after 24 h of coculture with MSCs (n = 3). (B) The protein levels of IL-6 in the cell lysates of Rheb1fl/fl and Rheb1Δ/Δ neutrophils when separated from BM (0 h) or after 24 h of coculture with MSCs (n = 3). (C) The IL-6 levels in the media of Rheb1fl/fl or Rheb1Δ/Δ neutrophils cocultured with MSCs (n = 4). (D) The relative mRNA expression of SCF in wt MSCs after exposure to different concentrations IL-6 for 24 h (n = 3). (E) The relative mRNA expression of SCF in wt MSCs cocultured with Rheb1fl/fl or Rheb1Δ/Δ neutrophils after being exposed to an IL-6 antibody at 10 ng/ml for 24 h (n = 3). *P < 0.05; **P < 0.01; ***P < 0.001.
It has been reported that IL-6 was higher in CML patients (Panteli et al., 2005) and higher level of IL-6 is associated with poor prognosis in CML patients (Nievergall et al., 2016). To evaluate the relationship of IL-6 and SCF expression level in human cells, we first investigated whether IL-6 regulates SCF expression in human MSCs. We cultured MSCs from human umbilical cord blood with different concentrations of IL-6 and analyzed the relative SCF mRNA expression in MSCs at 24 h. The result showed that higher IL-6 treatment suppressed SCF mRNA expression in human MSCs (Figure 6A). Next we isolated MNCs and MSCs from the BM of 39 CML patients, and measured the expression of IL-6 in mononuclear cells and the expression of SCF in MSCs in patients (Figure 6B, left panel). We found a negative correlation of SCF and IL-6 by analyzing the relationship of IL-6 and SCF expression in CML patients (n = 39) (Figure 6B, right panel). The data indicated that higher expression of IL-6 in myeloid cells is associated with the lower expression of SCF in MSCs in CML patients.
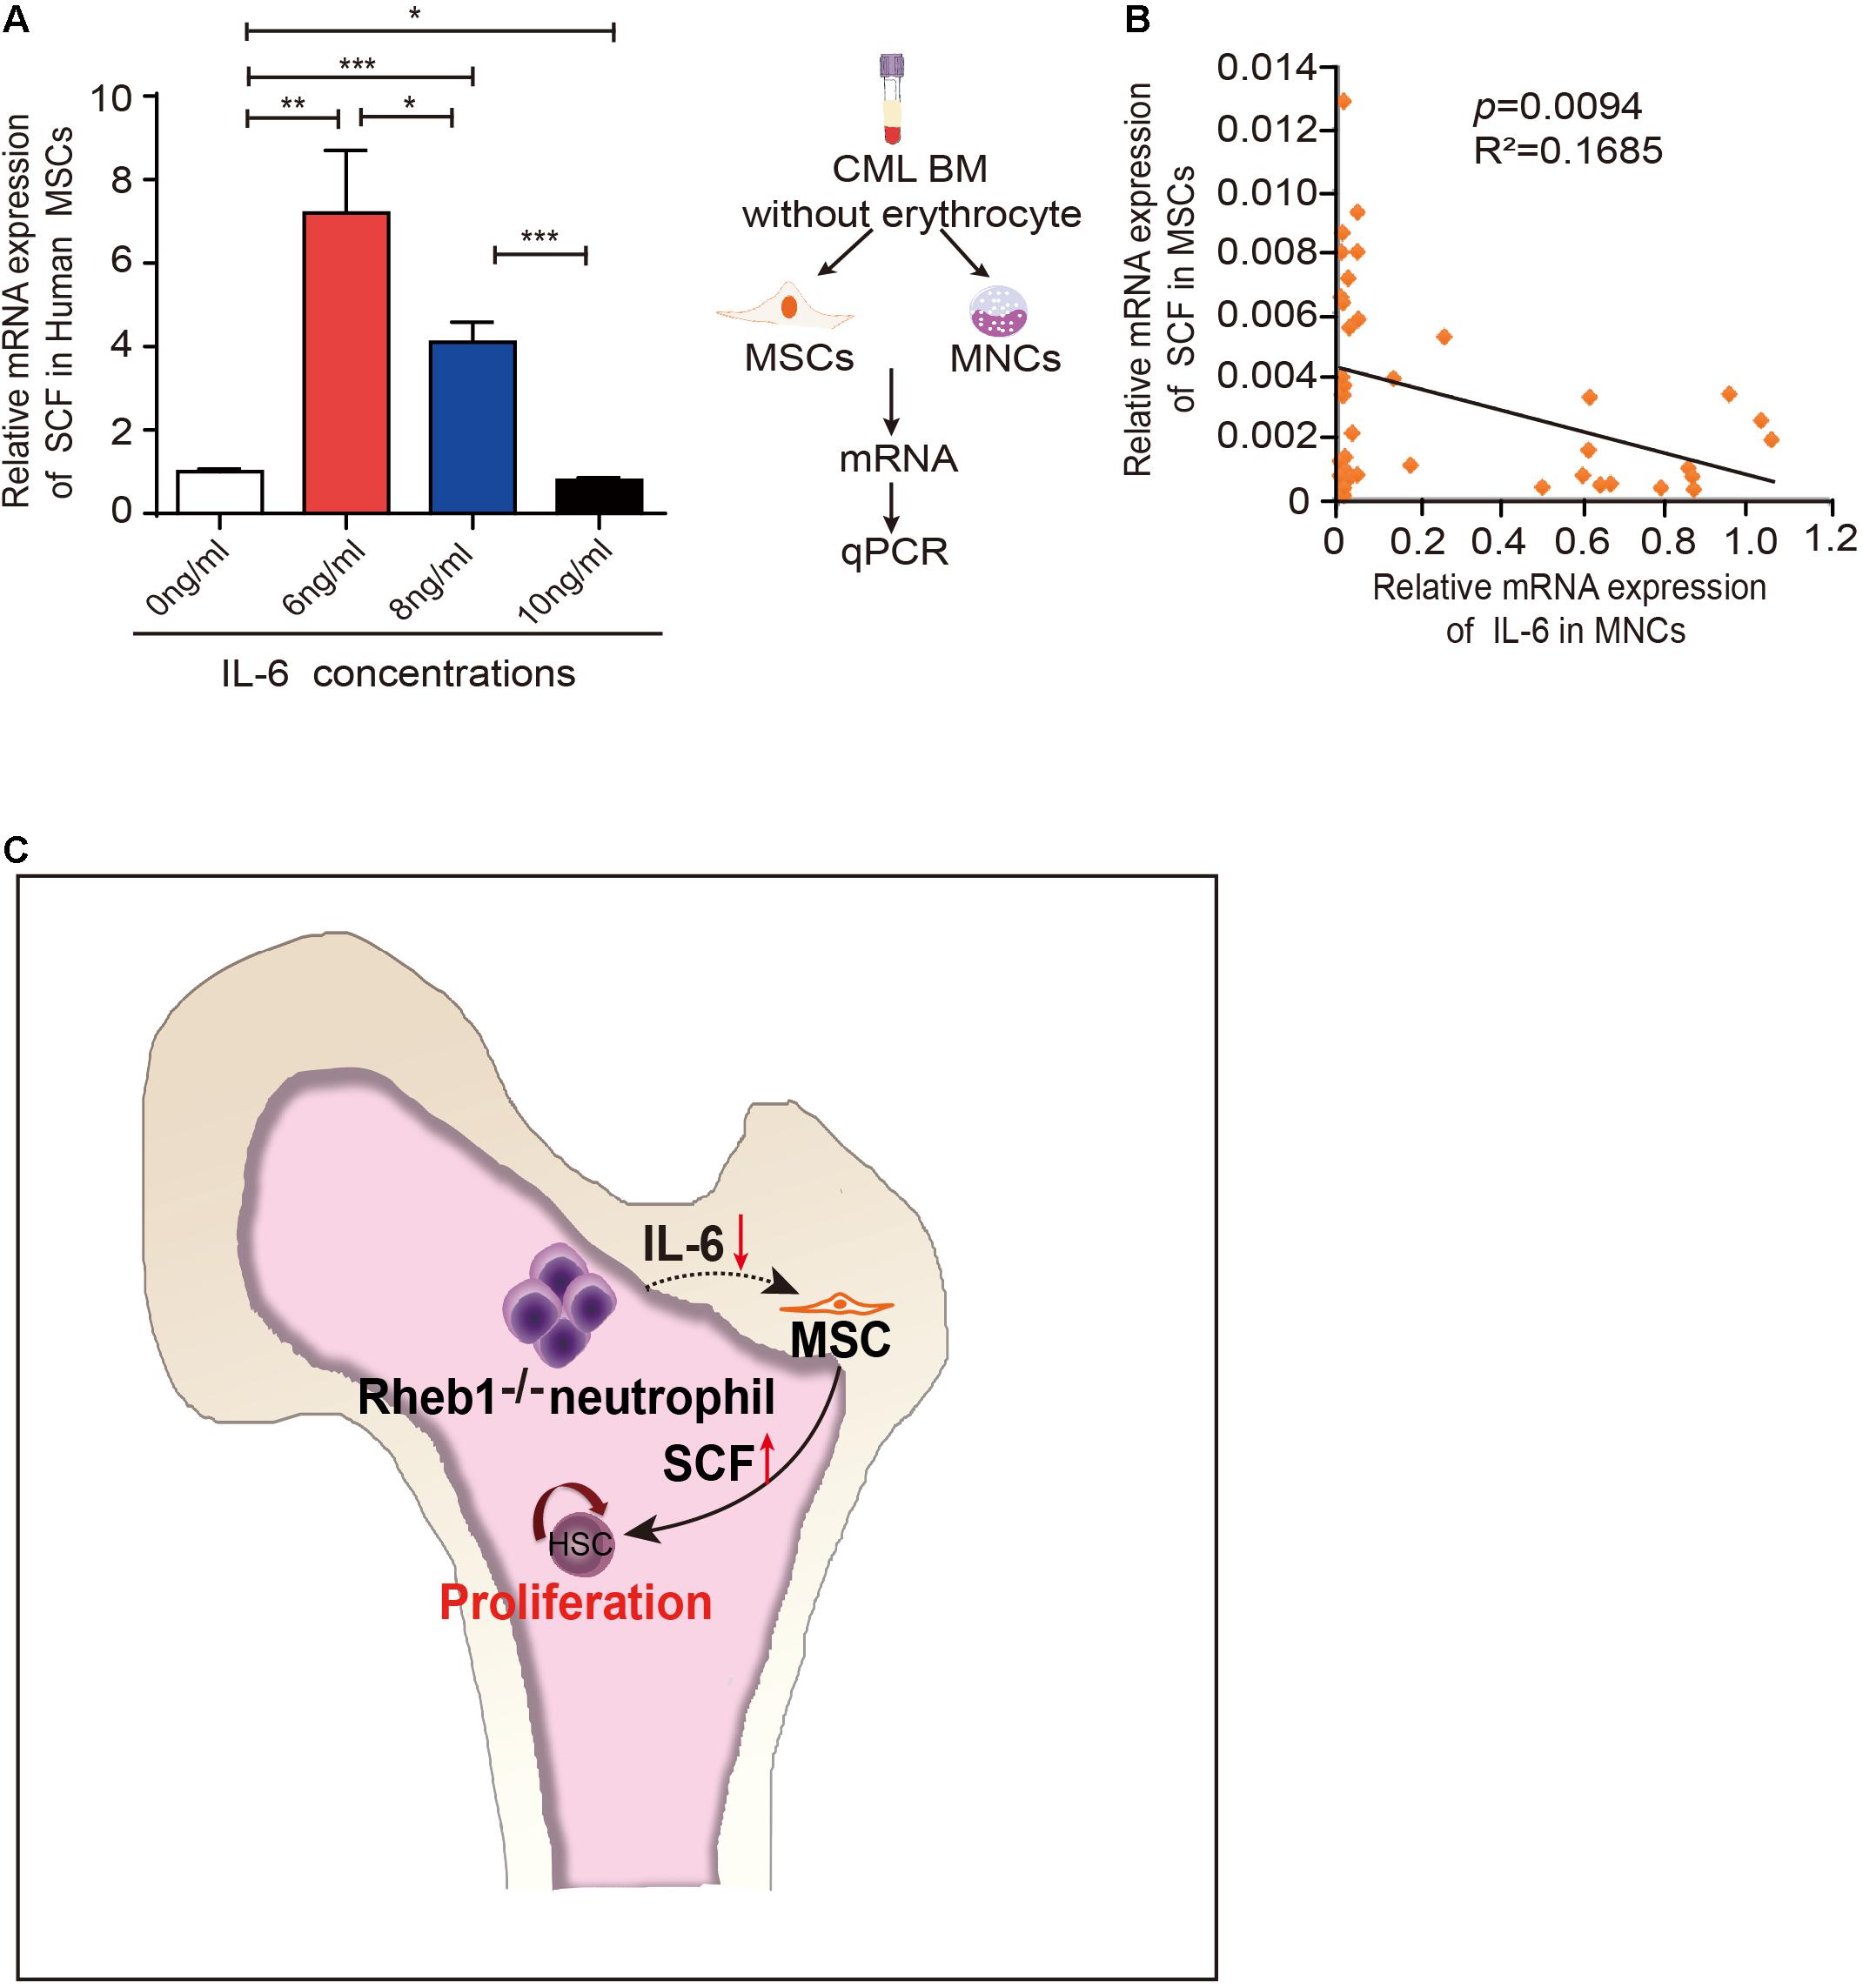
Figure 6. IL-6 regulates SCF expression in human MSCs. (A) The relative mRNA expression of SCF in H-MSCs after exposure to different concentrations IL-6 for 24 h (n = 3). The data are presented as the mean ± SD. (B) Correlation analysis for SCF and IL-6 mRNA expression in CML patients (n = 39) (p = 0.0094). R: Pearson correlation coefficients; R2: indicates “the goodness of fit.” Statistical significance was calculated by Pearson correlation coefficients. (C) Model depicting hematopoietic regulation in the absence of Rheb1. *P < 0.05; **P < 0.01; ***P < 0.001.
We previously found that the HSPCs were over-expanded in Vav1-Cre;Rheb1fl/fl mice (Wang et al., 2018). Here, using in vivo and in vitro models, we found that loss of Rheb1 impaired neutrophils’ ability to secrete IL-6, which stimulated MSCs to secrete more SCF and in turn stimulated HSPCs to proliferate (Figure 6C).
The microenvironment in BM comprises multipotent stromal cells (MSCs), osteoblasts, endothelial cells, mature blood cells and the cytokines that they produced (Gao et al., 2018). We previously showed that the differentiation and maturation of neutrophils in BM were abnormal in Rheb1Δ/Δ HSCs, leading aged Rheb1Δ/Δ mice to show MPN-like symptoms (Wang et al., 2018). Neutrophils and their progenitors have been shown to secrete a variety of cytokines to influence the development and proliferation of HSCs either directly or indirectly. For example, apoptotic neutrophils can stimulate macrophages to secrete G-CSF and regulate HSCs indirectly in zebrafish (Hall et al., 2016). Gr-1+ neutrophils in mouse bone marrow produce ROS during acute infection, which contributes to the proliferation of HSPCs via a paracrine mechanism (Kwak et al., 2015). Senescent neutrophils are markedly increased in aged mice and promote an increase in platelet-biased HSCs via IL-1β (Frisch et al., 2019). Our results demonstrated that Rheb1Δ/Δ neutrophils remodeled the BM niche, and induced HSPCs to undergo overexpansion in BM (Figure 3) probably via a feedback in MSC through the proinflammatory factor IL-6 (Figures 4, 5). This partially supported that the abnormal myeloid cells could regulate the proliferation of HSCs in MPN patients (Schepers et al., 2013).
IL-6 was higher in CML patients and was elevated during the transformation phase of CML (Panteli et al., 2005), while blocking IL-6 signaling could delay CML development in mouse model (Reynaud et al., 2011). More importantly, higher level of IL-6 is shown to be associated with poor prognosis in CML patients (Nievergall et al., 2016). We found there is a negative correlation of SCF with IL-6 in CML patients (Figure 6B), indicating that higher IL-6 could inhibit MSCs to secrete SCF and impair normal HSPC proliferation, thus promote CML progression. It suggested that blocking IL-6 signaling might be benefit for the restoration of HSC proliferation in CML patients.
Rheb1 has been implicated in many metabolic processes via the canonical TSC/Rheb/mTOR signaling pathway and/or non-canonical signaling pathways. We previously reported that Rheb1 deficiency inhibited neutrophil maturation through the mTOR signaling pathway (Wang et al., 2018). We found mTORC1 inhibitor Rapamycin could reduce p-S6 level and IL-6 RNA expression level in neutrophils (data not shown), which was consistent with blocking Rheb1-mTORC1 signaling pathway decreased IL-6 expression in IL-33 stimulated type 2 innate lymphoid cells (ILC2) (Petrova et al., 2020). Since IL-6 is a pleiotropic cytokine and a strong activator of Mammalian Target of Rapamycin (mTOR) (Pinno et al., 2016), it is possible that Rheb1 regulates IL-6 expression through a negative feedback loop affecting mTORC1. Several studies revealed that the inhibition of B-Raf and Dyneinor activation of the Notch signaling pathway by Rheb1 is independent of the mTORC1 pathway (Neuman and Henske, 2011), and increased Notch signaling increases IL-6 expression, leading to the activation of IL-6/JAK/STAT signaling (Jin et al., 2013). The specific role and mechanism of Rheb1 in the IL-6 signaling pathway in neutrophils need to be further investigated.
The original contributions presented in the study are included in the article/Supplementary Material, further inquiries can be directed to the corresponding author/s.
The studies involving human participants were reviewed and approved by the Ethics Committee of Blood Diseases Hospital, Chinese Academy of Medical Sciences. The patients/participants provided their written informed consent to participate in this study. The animal study was reviewed and approved by Institutional Animal Care and Use Committee (IACUC), Institute of Hematology and Blood Diseases Hospital (CAMS/PUMC).
JG, SH, and XW performed the experiments, analyzed the data, and wrote the manuscript. SY, YW, YG, and XS helped with the in vivo experiments and data collection. WW, YC, YZ, XF, HL, TC, and JS contributed to the data analyses and manuscript discussion. XW and WY conceived and directed the research project and revised the manuscript. All authors contributed to the article and approved the submitted version.
This work was supported by funds from the Ministry of Science and Technology of China (2018YFA0107801 and 2017YFA0103402), the Chinese Academy of Medical Sciences Innovation Fund for Medical Sciences, CIFMS (2017-I2M-3-015, 2016-I2M-1-017, and 2017-I2M-3-018), and the National Natural Science Foundation of China (81870088, 81700103, 81770105, 81670120, 81629001, and 81421002).
The authors declare that the research was conducted in the absence of any commercial or financial relationships that could be construed as a potential conflict of interest.
The Supplementary Material for this article can be found online at: https://www.frontiersin.org/articles/10.3389/fcell.2021.650599/full#supplementary-material
BMCs, whole bone marrow cells; BM, bone marrow; MNCs, mononuclear cells; PB, peripheral blood; HSC, hematopoietic stem cell; HPC, hematopoietic progenitor cell; LKS±, Lin–c-kit+Sca-1±; LK+, Lin–c-kit+; MSC, mesenchymal stem cell; OBC, osteoblast cell; wt, wild-type; SCF, stem cell factor; CML, chronic myeloid leukemia; PBS, Phosphate Buffer Solution; FBS, fetal bovine serum; HBSS, Hanks’ Balanced Salt Solution.
Arranz, L., Sanchez-Aguilera, A., Martin-Perez, D., Isern, J., Langa, X., Tzankov, A., et al. (2014). Neuropathy of haematopoietic stem cell niche is essential for myeloproliferative neoplasms. Nature 512, 78–81. doi: 10.1038/nature13383
Aspuria, P. J., and Tamanoi, F. (2004). The Rheb family of GTP-binding proteins. Cell. Signal. 16, 1105. doi: 10.1016/j.cellsig.2004.03.019
Chow, A., Lucas, D., Hidalgo, A., Mendez-Ferrer, S., Hashimoto, D., Scheiermann, C., et al. (2011). Bone marrow CD169+ macrophages promote the retention of hematopoietic stem and progenitor cells in the mesenchymal stem cell niche. J. Exp. Med. 208, 261–271. doi: 10.1084/jem.20101688
Feng, C. G., Weksberg, D. C., Taylor, G. A., Sher, A., and Goodell, M. A. (2008). The p47 GTPase Lrg-47 (Irgm1) links host defense and hematopoietic stem cell proliferation. Cell Stem Cell 2, 83–89. doi: 10.1016/j.stem.2007.10.007
Frenette, P. S., Pinho, S., Lucas, D., and Scheiermann, C. (2013). Mesenchymal stem cell: keystone of the hematopoietic stem cell niche and a stepping-stone for regenerative medicine. Annu. Rev. Immunol. 31, 285–316. doi: 10.1146/annurev-immunol-032712-095919
Frisch, B. J., Hoffman, C. M., Latchney, S. E., LaMere, M. W., Myers, J., Ashton, J., et al. (2019). Aged marrow macrophages expand platelet-biased hematopoietic stem cells via Interleukin1. JCI Insight 5:e124213.
Gao, X., Xu, C., Asada, N., and Frenette, P. S. (2018). The hematopoietic stem cell niche: from embryo to adult. Development 145:dev139691. doi: 10.1242/dev.139691
Gao, Y., Gao, J., Li, M., Zheng, Y., Wang, Y., Zhang, H., et al. (2016). Rheb1 promotes tumor progression through mTORC1 in MLL-AF9-initiated murine acute myeloid leukemia. J. Hematol. Oncol. 9:36.
Greenbaum, A., Hsu, Y. M., Day, R. B., Schuettpelz, L. G., Christopher, M. J., Borgerding, J. N., et al. (2013). CXCL12 in early mesenchymal progenitors is required for haematopoietic stem-cell maintenance. Nature 495, 227–230. doi: 10.1038/nature11926
Hall, C., Crosier, P., and Crosier, K. (2016). Inflammatory cytokines provide both infection-responsive and developmental signals for blood development: lessons from the zebrafish. Mol. Immunol. 69, 113–122. doi: 10.1016/j.molimm.2015.10.020
Jin, S., Mutvei, A. P., Chivukula, I. V., Andersson, E. R., Ramskold, D., Sandberg, R., et al. (2013). Non-canonical Notch signaling activates IL-6/JAK/STAT signaling in breast tumor cells and is controlled by p53 and IKKalpha/IKKbeta. Oncogene 32, 4892–4902. doi: 10.1038/onc.2012.517
Kwak, H. J., Liu, P., Bajrami, B., Xu, Y., Park, S. Y., Nombela-Arrieta, C., et al. (2015). Myeloid cell-derived reactive oxygen species externally regulate the proliferation of myeloid progenitors in emergency granulopoiesis. Immunity 42, 159–171. doi: 10.1016/j.immuni.2014.12.017
Meng, Z., Perry, J. M., Heather, M., Aparna, V., Pengxu, Q., He, X. C., et al. (2014). Megakaryocytes maintain homeostatic quiescence and promote post-injury regeneration of hematopoietic stem cells. Nat. Med. 20, 1321–1326. doi: 10.1038/nm.3706
Neuman, N. A., and Henske, E. P. (2011). Non-canonical functions of the tuberous sclerosis complex-Rheb signalling axis. EMBO Mol. Med. 3, 189–200. doi: 10.1002/emmm.201100131
Nievergall, E., Reynolds, J., Kok, C. H., Watkins, D. B., Biondo, M., Busfield, S. J., et al. (2016). TGF-α and IL-6 plasma levels selectively identify CML patients who fail to achieve an early molecular response or progress in the first year of therapy. Leukemia 301263–1272. doi: 10.1038/leu.2016.34
Panteli, K. E., Hatzimichael, E. C., Bouranta, P. K., Katsaraki, A., Seferiadis, K., Stebbing, J., et al. (2005). Serum interleukin (IL)-1, IL-2, sIL-2Ra, IL-6 and thrombopoietin levels in patients with chronic myeloproliferative diseases. Br. J. Haematol. 130, 709–715. doi: 10.1111/j.1365-2141.2005.05674.x
Petrova, T., Pesic, J., Pardali, K., Gaestel, M., and Arthur, J. S. C. (2020). p38 MAPK signalling regulates cytokine production in IL-33 stimulated Type 2 Innate Lymphoid cells. Sci. Rep. 10:3479.
Pinno, J., Bongartz, H., Klepsch, O., Wundrack, N., Poli, V., Schaper, F., et al. (2016). Interleukin-6 influences stress-signalling by reducing the expression of the mTOR-inhibitor REDD1 in a STAT3-dependent manner. Cell. Signal. 28, 907–916. doi: 10.1016/j.cellsig.2016.04.004
Raaijmakers, M. H. (2012). Myelodysplastic syndromes: revisiting the role of the bone marrow microenvironment in disease pathogenesis. Int. J. Hematol. 95, 17–25. doi: 10.1007/s12185-011-1001-x
Rathinam, C., and Flavell, R. A. (2008). The hematopoiesis paradigm: Clarity or ambiguity? Blood 112, 3534–3535. doi: 10.1182/blood-2008-07-167759
Reynaud, D., Pietras, E., Barry-Holson, K., Mir, A., Binnewies, M., Jeanne, M., et al. (2011). IL-6 controls leukemic multipotent progenitor cell fate and contributes to chronic myelogenous leukemia development. Cancer Cell 20, 661–673. doi: 10.1016/j.ccr.2011.10.012
Schepers, K., Pietras, E. M., Reynaud, D., Flach, J., Binnewies, M., Garg, T., et al. (2013). Myeloproliferative neoplasia remodels the endosteal bone marrow niche into a self-reinforcing leukemic niche. Cell Stem Cell 13, 285–299. doi: 10.1016/j.stem.2013.06.009
Swamydas, M., Luo, Y., Dorf, M. E., and Lionakis, M. S. (2015). Isolation of mouse neutrophils. Curr. Protoc. Immunol. 110, 3.20.1–3.20.15.
Wang, X., Chu, Y., Wang, W., and Yuan, W. (2016a). mTORC signaling in hematopoiesis. Int. J. Hematol. 103, 510–518.
Wang, X., Gao, Y., Gao, J., Li, M., Zhou, M., Wang, J., et al. (2018). Rheb1 loss leads to increased hematopoietic stem cell proliferation and myeloid-biased differentiation in vivo. Haematologica 104, 245–255. doi: 10.3324/haematol.2018.194811
Wang, X., Li, M., Gao, Y., Gao, J., Yang, W., Liang, H., et al. (2016b). Rheb1-mTORC1 maintains macrophage differentiation and phagocytosis in mice. Exp. Cell Res. 344, 219–228. doi: 10.1016/j.yexcr.2016.04.017
Zhu, H., Guo, Z. K., Jiang, X. X., Li, H., Wang, X. Y., Yao, H. Y., et al. (2010). A protocol for isolation and culture of mesenchymal stem cells from mouse compact bone. Nat. Protoc. 5, 550–560. doi: 10.1038/nprot.2009.238
Keywords: Rheb1-deficient neutrophils, hematopoietic stem/progenitor cell, proliferation, mesenchymal stem cells, IL-6
Citation: Gao J, Hou S, Yuan S, Wang Y, Gao Y, Sun X, Wang W, Chu Y, Zhou Y, Feng X, Luo HR, Cheng T, Shi J, Yuan W and Wang X (2021) Rheb1-Deficient Neutrophils Promote Hematopoietic Stem/Progenitor Cell Proliferation via Mesenchymal Stem Cells. Front. Cell Dev. Biol. 9:650599. doi: 10.3389/fcell.2021.650599
Received: 07 January 2021; Accepted: 19 April 2021;
Published: 27 May 2021.
Edited by:
Jon Frampton, University of Birmingham, United KingdomCopyright © 2021 Gao, Hou, Yuan, Wang, Gao, Sun, Wang, Chu, Zhou, Feng, Luo, Cheng, Shi, Yuan and Wang. This is an open-access article distributed under the terms of the Creative Commons Attribution License (CC BY). The use, distribution or reproduction in other forums is permitted, provided the original author(s) and the copyright owner(s) are credited and that the original publication in this journal is cited, in accordance with accepted academic practice. No use, distribution or reproduction is permitted which does not comply with these terms.
*Correspondence: Xiaomin Wang, d2FuZ3hpYW9taW5AaWhjYW1zLmFjLmNu; Weiping Yuan, d3B5dWFuQGloY2Ftcy5hYy5jbg==
†These authors have contributed equally to this work
Disclaimer: All claims expressed in this article are solely those of the authors and do not necessarily represent those of their affiliated organizations, or those of the publisher, the editors and the reviewers. Any product that may be evaluated in this article or claim that may be made by its manufacturer is not guaranteed or endorsed by the publisher.
Research integrity at Frontiers
Learn more about the work of our research integrity team to safeguard the quality of each article we publish.