 Xubin Dong
 Jingjing Song
 Jing Hu3†
 Haiguang Liu
94% of researchers rate our articles as excellent or good
Learn more about the work of our research integrity team to safeguard the quality of each article we publish.
Find out more
ORIGINAL RESEARCH article
Front. Cell Dev. Biol., 17 December 2020
Sec. Molecular and Cellular Oncology
Volume 8 - 2020 | https://doi.org/10.3389/fcell.2020.590898
Papillary thyroid cancer (PTC) is the most common malignant disease in endocrine systems. T-box transcription factor 22 (TBX22) is a phylogenetically conserved family member that has not been widely characterized in cancers. In this study, we explored the potential clinical significance and biological functions of TBX22 in PTC. Comprehensive analyses of TBX22 were based on the public databases and our local qRT-PCR cohort. We observed that TBX22 was significantly downregulated in PTC compared with normal tissues. TBX22 was associated with several clinicopathological factors in PTC. Low TBX22 expression correlated with BRAFV600E and TERT mutation. Functional enrichment analysis revealed that cancer-related pathways and immune progress were closely associated with TBX22 in PTC. In TBX22-low PTC, high immune infiltration levels with increased CD8+ T cells, natural killer, M1 macrophages, and T-regulatory cells were observed. TBX22 was negatively correlated with the activity of different steps of the anticancer immunity cycle. Functionally, overexpression of TBX22 inhibited the proliferation, invasion, and migration in PTC cells, while knocking down of TBX22 showed the opposite effects. The present findings disclose that TBX22, as an immune microenvironment-related biomarker, could be an important tumor suppresser gene and might inform the management of PTC patients better.
According to the origin of cells, thyroid cancers are classified into follicular-derived and C-cell-derived. Follicular-derived thyroid cancers are subdivided into anaplastic, papillary (PTC), and follicular thyroid cancers (Landa et al., 2016). Over the past several decades, the rising incidence of PTC has been reported, making it an increasingly important health tissue in most populations of the world (James et al., 2018). Clinical and pathologic factors associated with a somewhat higher risk for PTC recurrence and cancer-related mortality include older age at diagnosis, size of the primary tumor, and the presence of soft-tissue invasion or distant metastases (Johnson et al., 1988; Asioli et al., 2010; Randolph et al., 2012). The prognosis is poorer in patients with specific subtypes of PTC, including tall cell and hobnail variants (Yoo et al., 2016). PTC patients had a favorable overall prognosis, and cancer-specific mortality in non-metastatic PTC patients was only 6% (Ghossein and Livolsi, 2008). However, existing treatments do not sufficiently improve the prognosis of more aggressive and lethal dedifferentiated PTCs.
Papillary thyroid cancer is MAPK-driven cancer with two mutually exclusive drivers, BRAFV600E and mutated RAS, leading to distinct signaling consequences. Based on this, BRAFV600E-like (BVL) and RAS-like (RL) are two major PTC molecular subtypes that represent differential regulation of MAPK signaling pathways and thyroid differentiation (Agrawal et al., 2014). RL-PTCs enriched for follicular variant histology result in predominantly well-differentiated tumors, while BVL-PTCs enriched for classical and tall cell histology result in the less differentiated tumor (Ghossein et al., 2007).
The thyroid is the largest endocrine organ in the body and a common target of autoimmune disease. Immune checkpoint blockade like CTLA-4 and PD-1/PD-L1 inhibitors has fueled the field of tumor immunology in thyroid cancer, highlighting both the ability of tumor–immune system treatment and the uniqueness of tumor immunotherapy (Emens et al., 2017). The initiation and progression of the tumor depend on the interaction between the immune system, the TME, and individual tumor cells (Dong et al., 2020a,b). TME is a complex dynamic cell community composed of tumor epithelial cells and a variety of tumor-supporting cells, which represents an important contributor to immortal proliferation, cell invasion, and evasion of immune surveillance (Cheng et al., 2019). Previous studies uncovered that TIICs affect the response rate of immunotherapy, the efficacy of chemotherapy, and the prognosis of patients (Deschoolmeester et al., 2010). There are cancer-promoting and anticancer immune cells within the TIME. The predominance of procancer over anticancer immune cells may be related to cancer progression (Wu et al., 2017). Chen and Mellman (2013) demonstrated the seven steps of the cancer immunity cycle, which have become the basic framework of cancer immunotherapy research. Therefore, it is necessary to evaluate the immune properties of TME to identify the characteristics of novel predictive biomarkers and immune-related molecular in PTC.
T-box is named because this family shares a common DNA-binding domain (Sebé-Pedrós et al., 2013). The T-box genes constitute an ancient family of evolutionarily conserved transcription factors that are crucial to embryonic development by regulating gene expression (Papaioannou, 2014). The T-box gene family was widely studied in the field of developmental biology. Previous studies had demonstrated that mutations in different members of the T-box family result in developmental syndromes, characterized by organ deformity and body structure defects (Miller et al., 2010). In recent years, increasing studies reported that the T-box genes might also function in tumorigenesis and progression in certain cancers (Crawford et al., 2019; Krstic et al., 2019). As a member of the T-box gene family, T-box transcription factor 22 (TBX22) mutations caused a high risk of incidence in several diseases, including non-syndromic cleft palate, hypodontia, and ankyloglossia (Braybrook et al., 2001; Kantaputra et al., 2011). However, TBX22 has so far received little attention in PTC studies.
Recent computational analyses of the RNA-seq profile of bulk tumors allow us to investigate TME in large cohorts. Here, in our study, we comprehensively investigated the expression pattern of TBX22 and its association with the clinical and pathological parameters of PTC patients. Of note, we evaluated the clinical utility of TBX22 by correlative analyses with PTC key molecular features, such as BRAFV600E, RAS, and TERT mutation. Based on functional enrichment analysis, we explored the link between TBX22 and tumor immunity-associated molecular features. Therefore, we performed a series of experiments to demonstrate the effect of overexpression and knocking down TBX22 on PTC cell lines. Our findings were largely consistent in public cohorts and our local PTC profile.
This study applied multiple public PTC cohorts. For The Cancer Genome Atlas (TCGA) dataset, RNA-seq and clinical profiles of human thyroid cancer patients were obtained from the TCGA data portal (Agrawal et al., 2014). TCGA RNA-seq profile contained 568 samples, comprising 59 matched normal samples, 501 PTC samples, and eight metastatic thyroid carcinoma samples. Whole-transcriptome sequencing data were aligned using RSEM expression level in transcripts per million. The definition and outcome of DFI and PFI were extracted from the TCGA-Clinical Data Resource (Liu et al., 2018). Mutation status was obtained from Mutation Annotation Format files (derived from VarScan2) from the Genomic Data Commons portal. TMB was calculated by the sum of the number of non-silent mutations in the TCGA samples. MSI status (MANTIS score) for the TCGA cohort was obtained from a previous publication (Bonneville et al., 2017). Expressional data and corresponding clinical profiles of GSE33630 (Dom et al., 2012), GSE60542 (Tarabichi et al., 2015), and GSE35570 (Yu et al., 2008; Handkiewicz-Junak et al., 2016) datasets were obtained from the GEO database.
Correlation analysis was assessed by the function “cor.test” in R. Genes which had Spearman correlation value >0.4 or <−0.4, p < 0.001 with TBX22 were selected. GO and KEGG analyses were performed using “enrichGo” and “enrichKEGG” functions in the “clusterprofiler” package, respectively. “ggplot2” and “pheatmap” packages were used for visualization. The GSEA was performed using the hallmark collections from the Molecular Signature Database (Subramanian et al., 2005). FDR-adjusted q–value <0.25 was set as the cutoff to identify significantly enriched terms.
The ESTIMATE algorithm was used to quantify the immune and stromal proportions in the PTC microenvironment (Yoshihara et al., 2013). For specific TIIC infiltration analyses, quanTIseq and ImmuCellAI algorithms were used to estimate the relative proportions of immune cell types in TME. ImmuCellAI is a gene-expression-based pipeline for the quantification of the tumor immune contexture from human RNA-seq profiles (Miao et al., 2020). quanTIseq is a deconvolution-based algorithm, providing “absolute score” representing cell fractions in TME (Finotello et al., 2019). The TIP pipeline was applied for cancer immunity cycle profiling (Xu et al., 2018). This method used an algorithm based on ssGSEA to evaluate the relative activity of the seven steps of the immune cycle, which is a process by which the immune system recognizes and kills cancer cells in a large number of tumor samples.
Seventy-nine pairs of PTC and corresponding normal thyroid tissues were obtained from the Department of Thyroid and Breast Surgery, The First Affiliated Hospital of Wenzhou Medical University. Furthermore, all surgical specimens were independently confirmed by two experienced pathologists, and the results showed that 79 pairs of surgical specimens all met the diagnosis of PTC and normal thyroid tissues, respectively. The collected fresh tissues were immediately snap-frozen in liquid nitrogen and stored at −80°C until further RNA was detected. BRAFV600E mutation detection was performed on the extracted DNA from preoperative fine-needle aspiration cells after cytologic evaluation. Briefly, each real-time PCR mixture contained 5 μl of extracted DNA and other reagents available in the detection kit ADx-Amplification Refractory Mutation System (AmoyDx, China). Clinical and pathological features of patients in the TCGA and WMU-THCA cohorts are presented in Tables 1, 2, respectively.
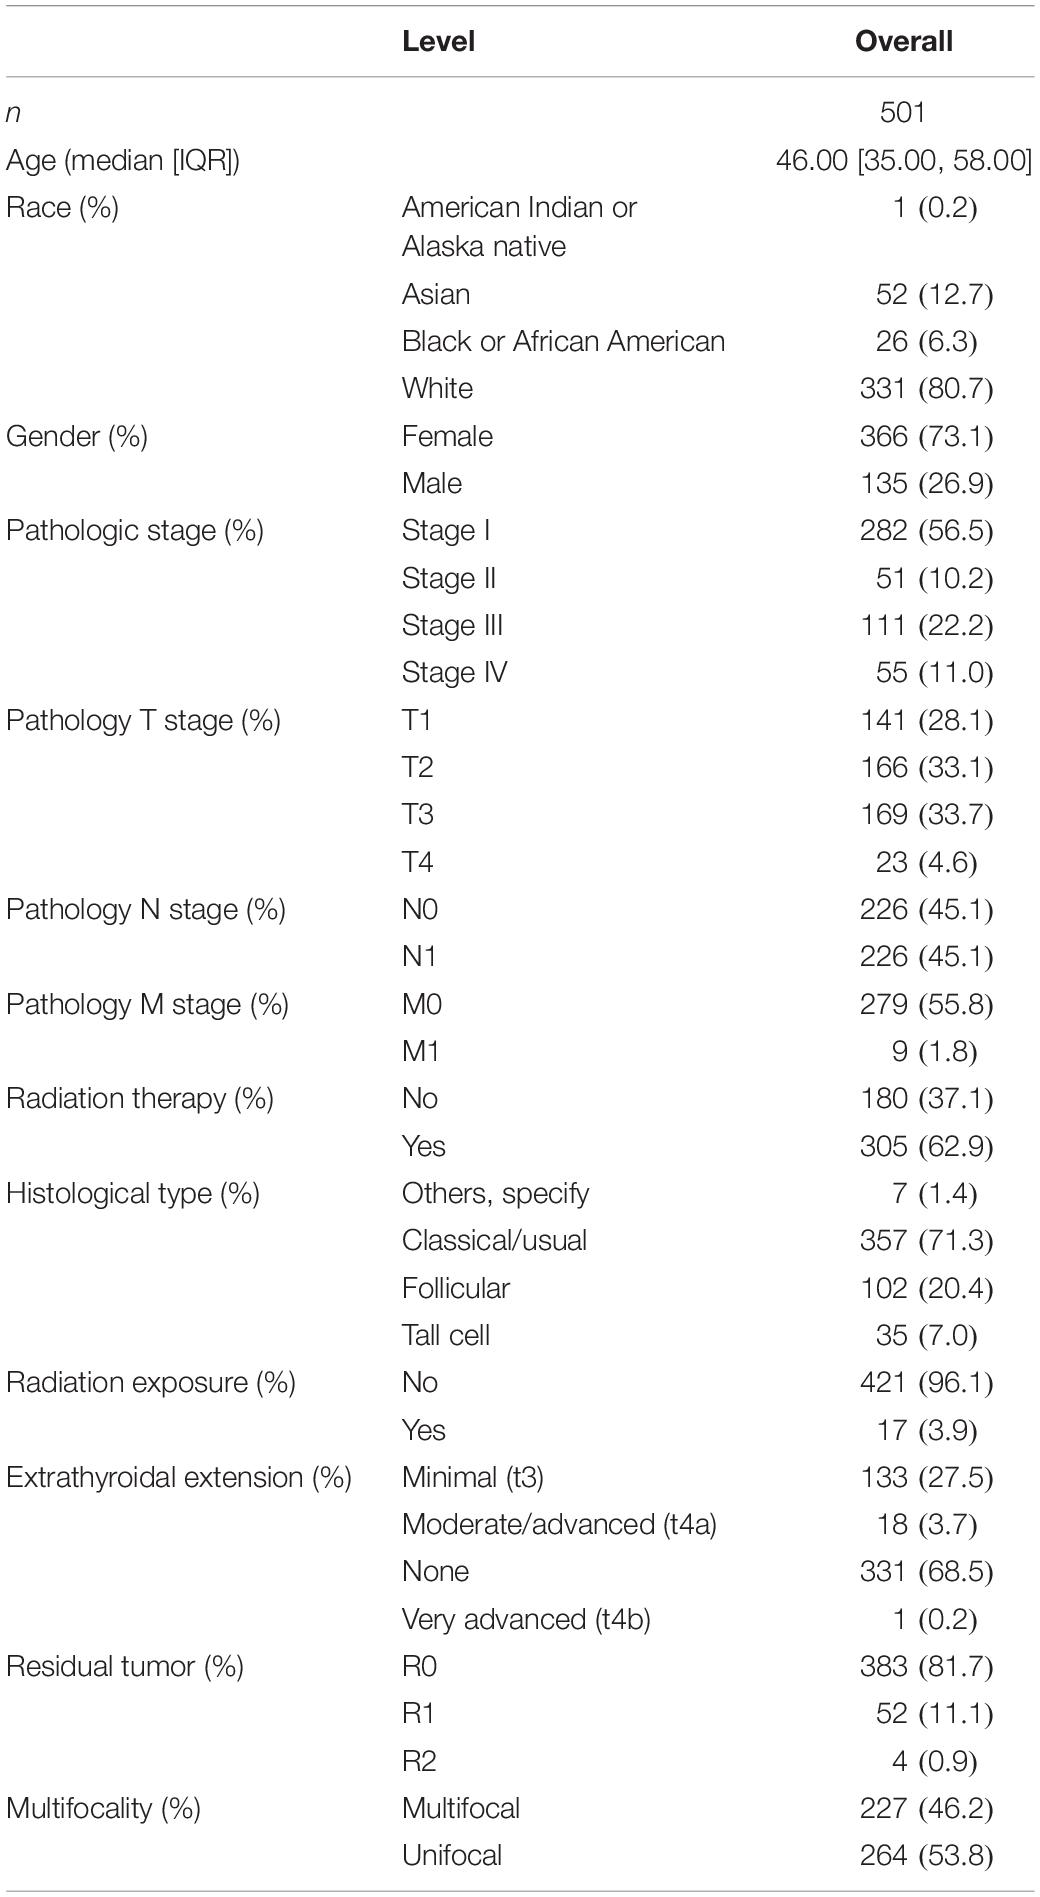
Table 1. Baseline of patients in the TCGA cohort.
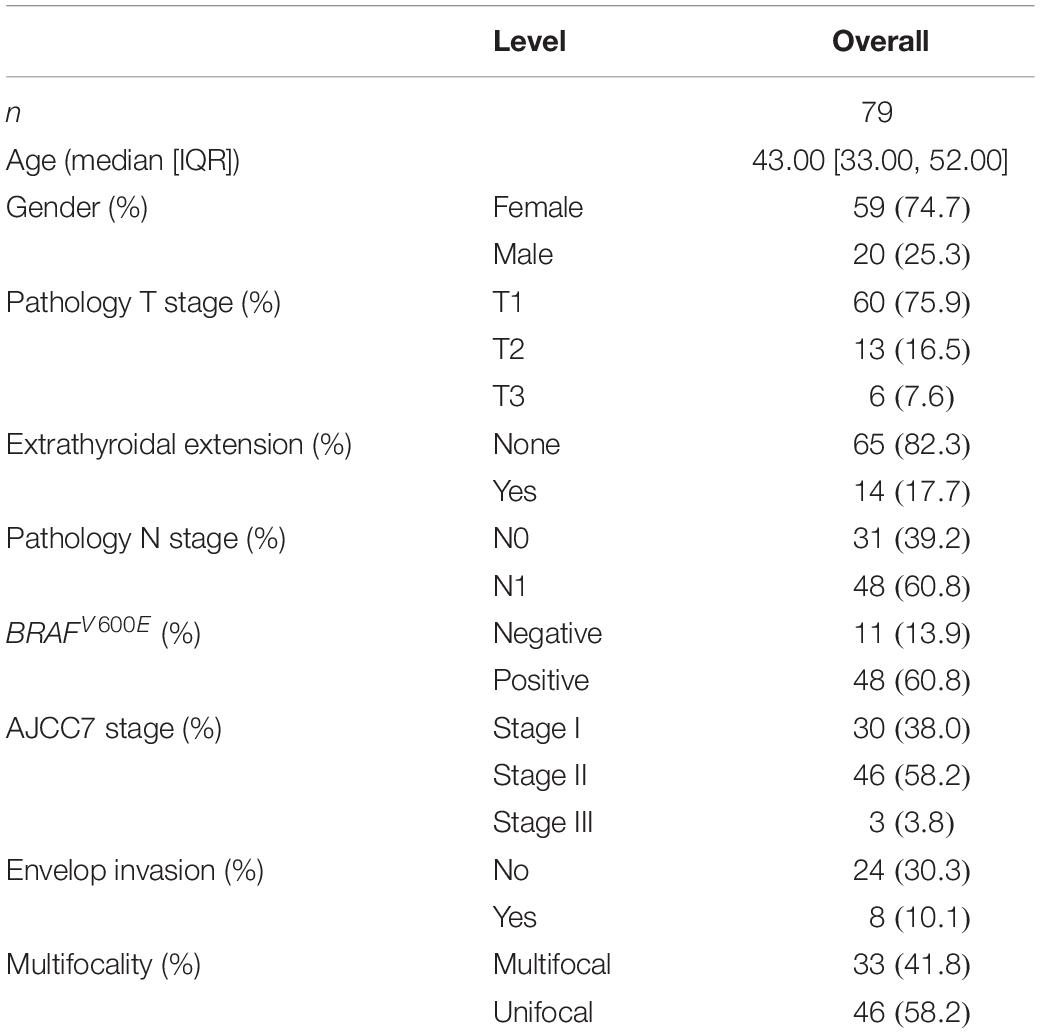
Table 2. Baseline of patients in the WMU-THCA cohort.
Total RNA was isolated from patient tissue and thyroid cancer cell lines by TRIzol reagent (Invitrogen, United States). All RNA samples were temporarily stored at −80°C. The isolated RNA was measured at 260/280 nm to ensure the reliability of RNA quality and quantity. The range of 260/280 nm is between 1.72 and 1.95. The ReverTra Ace qPCR RT Kit (Toyobo, Japan) was used for RNA reverse transcription. Real-time PCR was run and analyzed using the 7500 Fast quantitative PCR System (Applied Biosystems, United States). The relative expression of TBX22 mRNA was presented using the method of 2–ΔΔCT with the endogenous control GAPDH to normalize the data. The primer sequences used were as follows: TBX22 forward primer, 5′-CCUUUGAACUCCUUACUUUTT-3′; TBX22 reverse primer, 5′-AAAGUAAGGAGUUCAAAGGTT-3′; GAPDH forward primer, 5′-GTCTCCTCTGACTTCAACAGCG-3′; GAPDH reverse primer, 5′-ACCACCCTGTTGCTGTAGCCAA-3′.
BCPAP, TPC-1, and KTC-1 cells were cultured in Roswell Park Memorial Institute 1640 medium (Gibco, United States) supplemented with 10% FBS (PAN Biotech, Germany). DMEM (Gibco, United States) supplemented with 10% FBS was used for growing FTC and HTori-3 cells. These cells were incubated in a humidified incubator at 37°C with 5% CO2. Cells used in the present study were all obtained from Shanghai Cell Biology, Institute of the Chinese Academy of Sciences (Shanghai, China). Employed cell lines have different genotypes, as shown in Table 3.
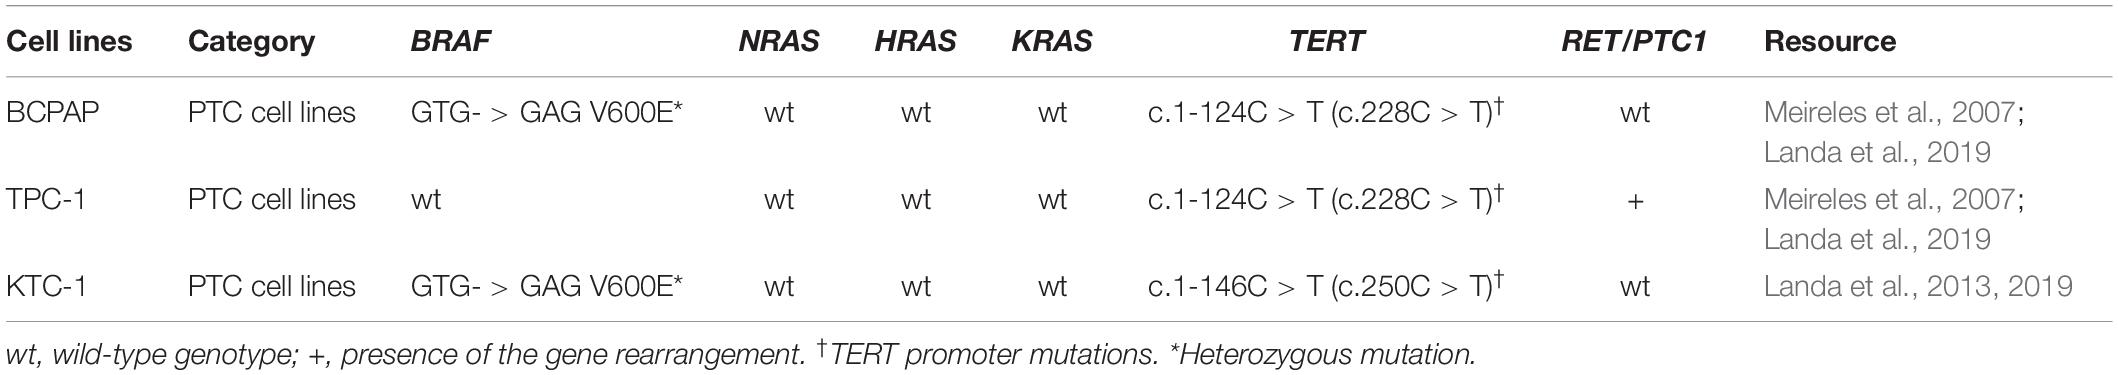
Table 3. Genotype of the employed PTC cell lines.
For TBX22 overexpression, the structure of vectors contained the full length of TBX22 and was constructed into CMV-MCS-EGFP-SV40-Neomycin. pcDNA3.1-TBX22 and its empty vector were purchased from GeneChem (Shanghai, China) according to the manufacturer’s recommendations. Transient siRNA transfection for TBX22 was obtained from RiboBio (Guangzhou, China) for cell interference. Based on the manufacturer’s protocol, Lipofectamine RNAiMAX transfection reagent (Thermo Fisher Scientific, United States) was mixed with siRNA to transfect cancer cell lines. The negative control (si-NC) was not homologous to any human genomic sequence tracks. The siRNA sequences are listed as follows: si-TBX22: sense: 5′-CCUUUGAACUCCUUACUUUTT-3′, antisense: 5′-AAAGUAAGGAGUUCAAAGGTT-3′.
To determine the ability of cell proliferation, the Cell Counting Kit-8 (CCK-8, Beyotime, China) was employed in this study. Forty-eight hours after siRNA transfection, 1,500 cells were seeded into each well of a 96-well plate with 100 μl medium supplemented with 10% FBS. At every indicated time point, the medium was exchanged by 100 μl medium with CCK-8 (91 μl medium and 9 μl CCK-8), and the cells were incubated in 5% CO2, 37°C for 3 h. The OD at a wavelength of 450 nm in each well was recorded on a microplate reader (SpectraMax Plus 384, Molecular Devices Corporation, CA, United States). For the colony formation assay, about 1,000 transfected cancer cells were added to each well in a six-well plate and incubated for 10–14 days until colonies were formed. The plates were then gently washed with PBS and stained with crystal violet. Colony areas were determined by the ColonyArea plugin (Guzman et al., 2014) in ImageJ software. Transwell plates (Corning, NY, United States) were used for the migration assay. Cells (4 × 10⁴ cells/chamber) were seeded onto the upper chamber, and the growth medium containing 10% FBS was added to the bottom chamber. After 24 h and 37°C incubation, non-migrated cells on the upper chamber were carefully removed with a cotton swab. Cells migrating through the filter chamber were fixed with methanol and stained with 0.1% crystal violet. For the invasion assay, an identical protocol was followed, except that the chamber is Matrigel invasion chamber (Corning Incorporated). Migrated or invaded cells were imaged in a 10× magnification microscope in five random fields for each well and quantified by ImageJ software.
Mann–Whitney test or Wilcoxon signed-rank test was used in the two-group analysis. Comparisons between different groups were conducted by Kruskal–Wallis one-way ANOVA. Correlation analyses between two variables were calculated using Spearman Rho. These variables included gene expression levels, TME signature scores, TMB, and MSI scores. The ROC curve analysis estimated the biomarker value of TBX22. and the Kaplan–Meier curves and log-rank tests were used to evaluate differences in prognosis. The optimal TBX22 cutpoints for Kaplan–Meier curves were calculated using the “res.cut” function. Patients with full clinical information were selected for the Cox regression analysis, and we removed patients with a follow-up period of fewer than 30 days. Uni- and multivariable Cox regression models were built using the clinical and pathological parameters along with the respective TBX22 expression data by the “coxph” function in the “survival” package. R 3.5.2 and GraphPad Prism 8.2.0 were utilized in this study.
For PTC patients (TCGA cohort), TBX22 was significantly lower in PTC than in the corresponding normal thyroid tissue (Figure 1A, p < 0.0001), which was also compatible in the GSE33630, GSE60542, and GSE5364 cohorts (Figures 1B–D, all p < 0.0001). To validate the transcription level of TBX22 in our local PTC patients, we performed qRT-PCR of 79 pairs of tumor samples and adjacent normal thyroid tissues, and TBX22 was downregulated in PTC tissues compared with that in adjacent normal tissues (Figure 1E, p < 0.0001). These results demonstrated that TBX22 was downregulated in PTC.
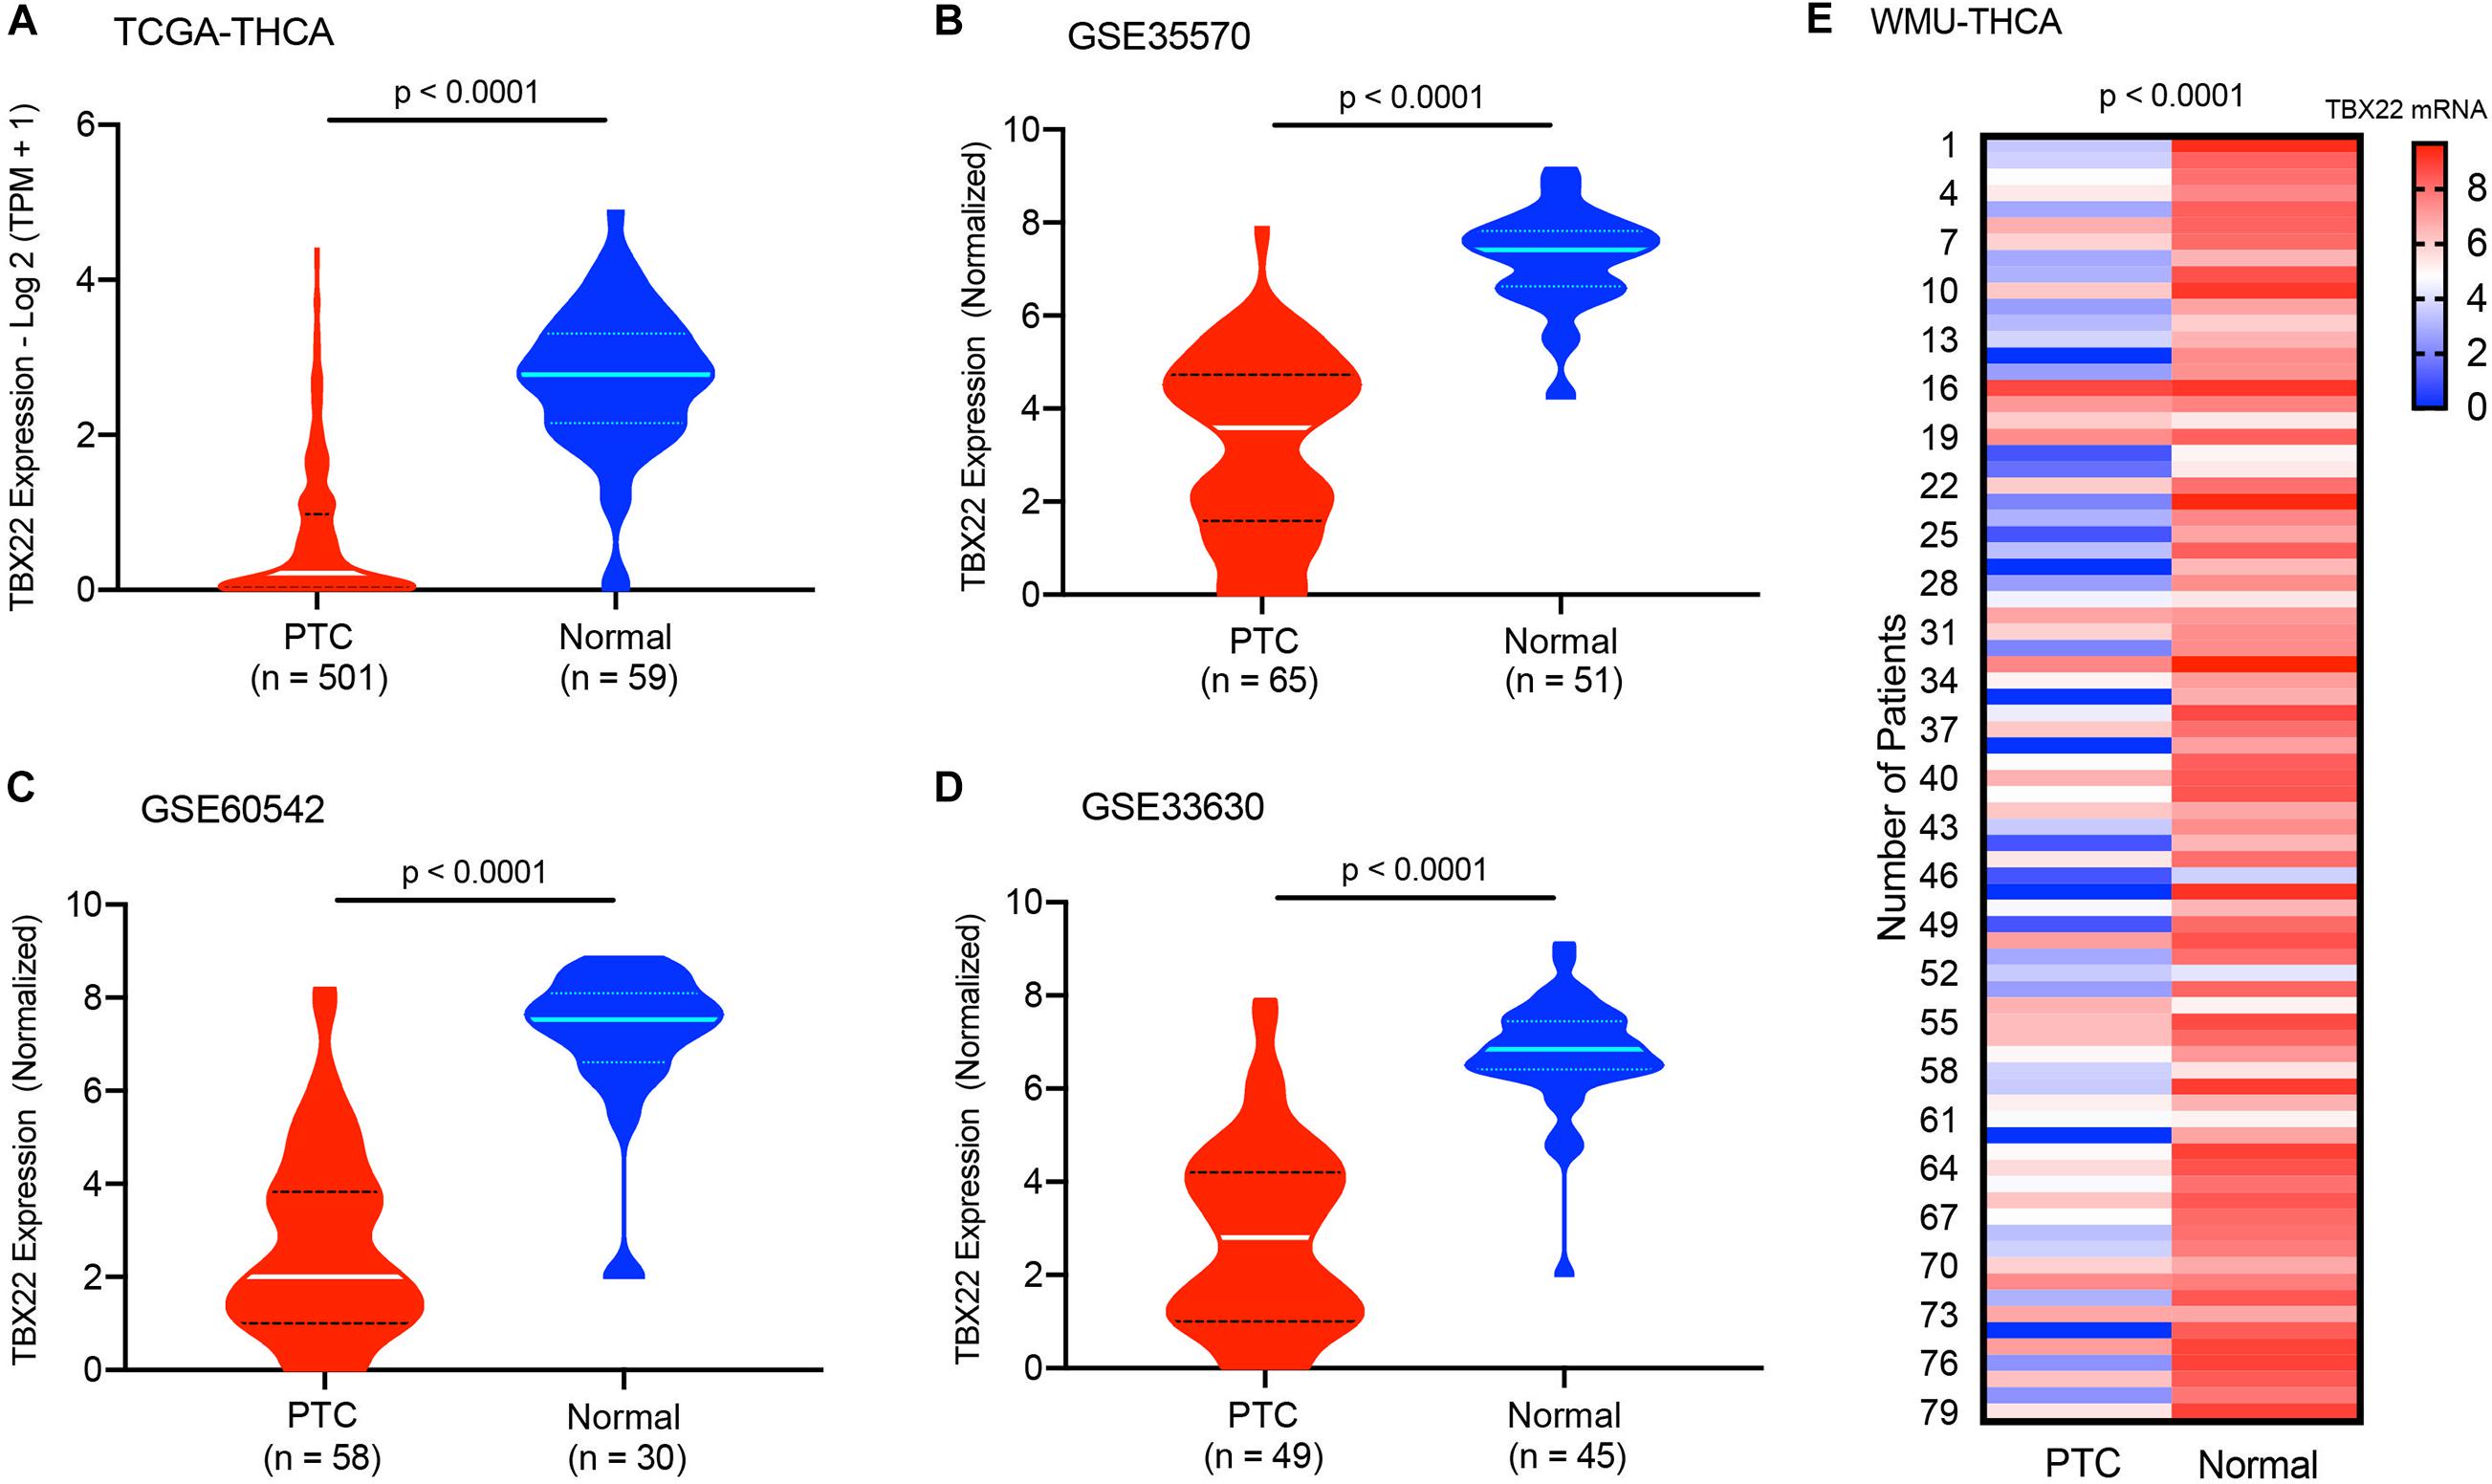
Figure 1. T-box transcription factor 22 (TBX22) levels in normal and malignant thyroid tissues. The TBX22 transcript levels in papillary thyroid cancer (PTC) and adjacent normal thyroid tissues from the (A) TCGA-THCA, (B) GSE35570, (C) GSE60542, and (D) GSE33630 datasets are presented as violin plots. (E) TBX22 expression in local THCA tissues compared with the paired normal thyroid samples by qRT-PCR. Statistical methods were as follows: (A–D) Wilcoxon rank-sum test; (E) Wilcoxon signed-rank test.
Next, we analyzed the relationship between mRNA expression of TBX22 and the PTC clinicopathological parameters in the TCGA database and the local WMU cohort. In the TCGA cohort, the mRNA level of TBX22 in PTC patients was significantly associated with tumor size (Figure 2A, p = 1.6e-05), nodal metastasis (Figure 2B, p = 1.9e-06), extrathyroidal extension (Figure 2C, p = 7.1e-08), and disease stage (Figure 2D, p = 0.003). In addition, TBX22 level was significantly higher in the follicular variant subtype compared with the tall cell variant (Figure 2E, p = 1.6e-05) and classical subtypes (Figure 2E, p = 1.3e-09). Our further analysis of PTC profiles of the local cohort validated that the expression of TBX22 was significantly associated with tumor size (Figure 2F, p = 0.012) and LNM (Figure 2G, p = 0.0051). We also observed that TBX22 had a trend in distinguishing between PTC patients with and without extrathyroidal extension (Figure 2H, p = 0.11).
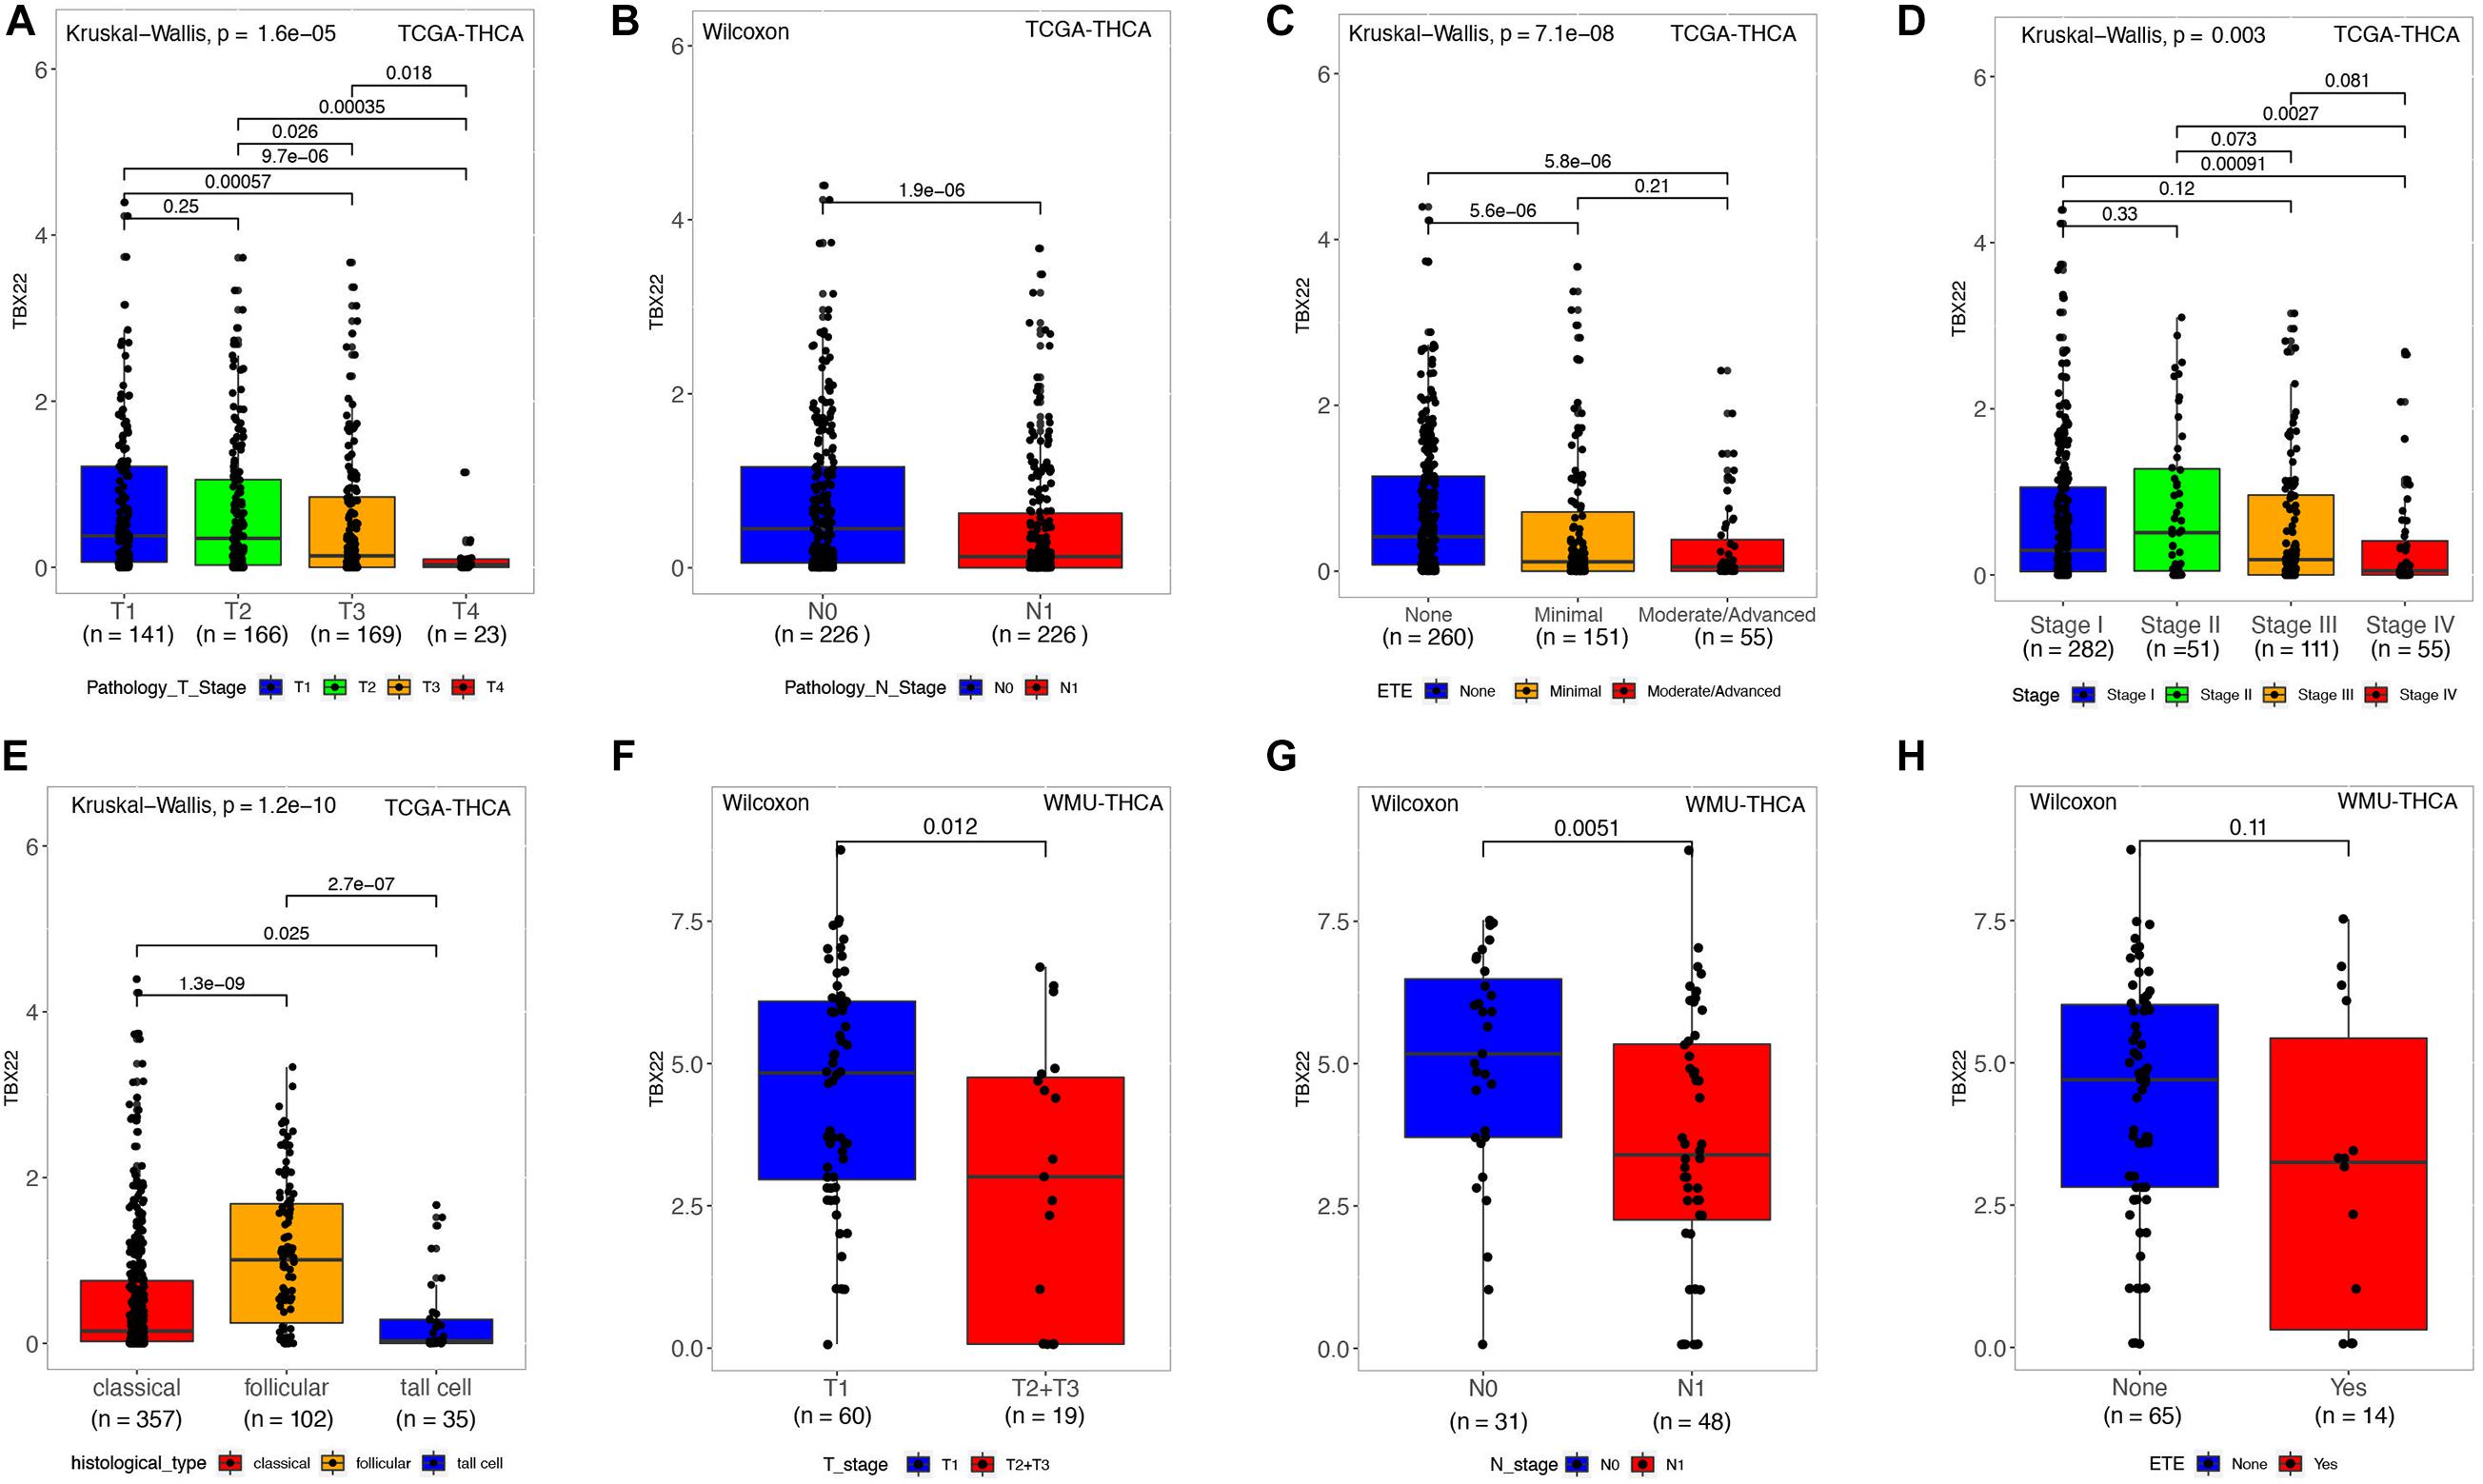
Figure 2. TBX22 expression and correlation with clinicopathological characteristics in PTC patients. (A–E) In the TCGA-THCA dataset, TBX22 expression in the different status of tumor size, lymph node metastasis, extrathyroidal extension, disease stages, and histological types. (F–H) In the local cohort, TBX22 expression in the different status of tumor size, lymph node metastasis, and extrathyroidal extension. (A,C–E) Kruskal–Wallis test; (B,F–H) Wilcoxon rank-sum test.
Papillary thyroid cancer can be classified according to 71 gene expression signatures as BVL and RL (Cancer Genome Atlas Research Network, 2014). Thus, we divided patients according to their driver mutation status and found that TBX22 expression was significantly lower in the BRAFV600E (Figure 3A, p < 0.0001) and TERT mutation groups (Figure 3C, p = 0.045). However, the expression of TBX22 was higher in the RAS wild-type group (Figure 3B, p < 0.0001) than in their respective counterpart groups. Besides, TBX22 showed a trend in distinguishing between the RET fusion group and the RET wild-type group (Figure 3D, p = 0.059). TBX22 expression was significantly lower in the BVL group than in the RL group (Figure 3E, p < 0.0001). In addition, TBX22 showed a strong positive correlation with VEGFA (Figure 3F, R = 0.66, p < 0.0001). However, TBX22 was weakly correlated with scores of TMB (Figure 3G, R = -0.11, p = 0.016) and MSI (Figure 3H, R = −0.1, p = 0.028).
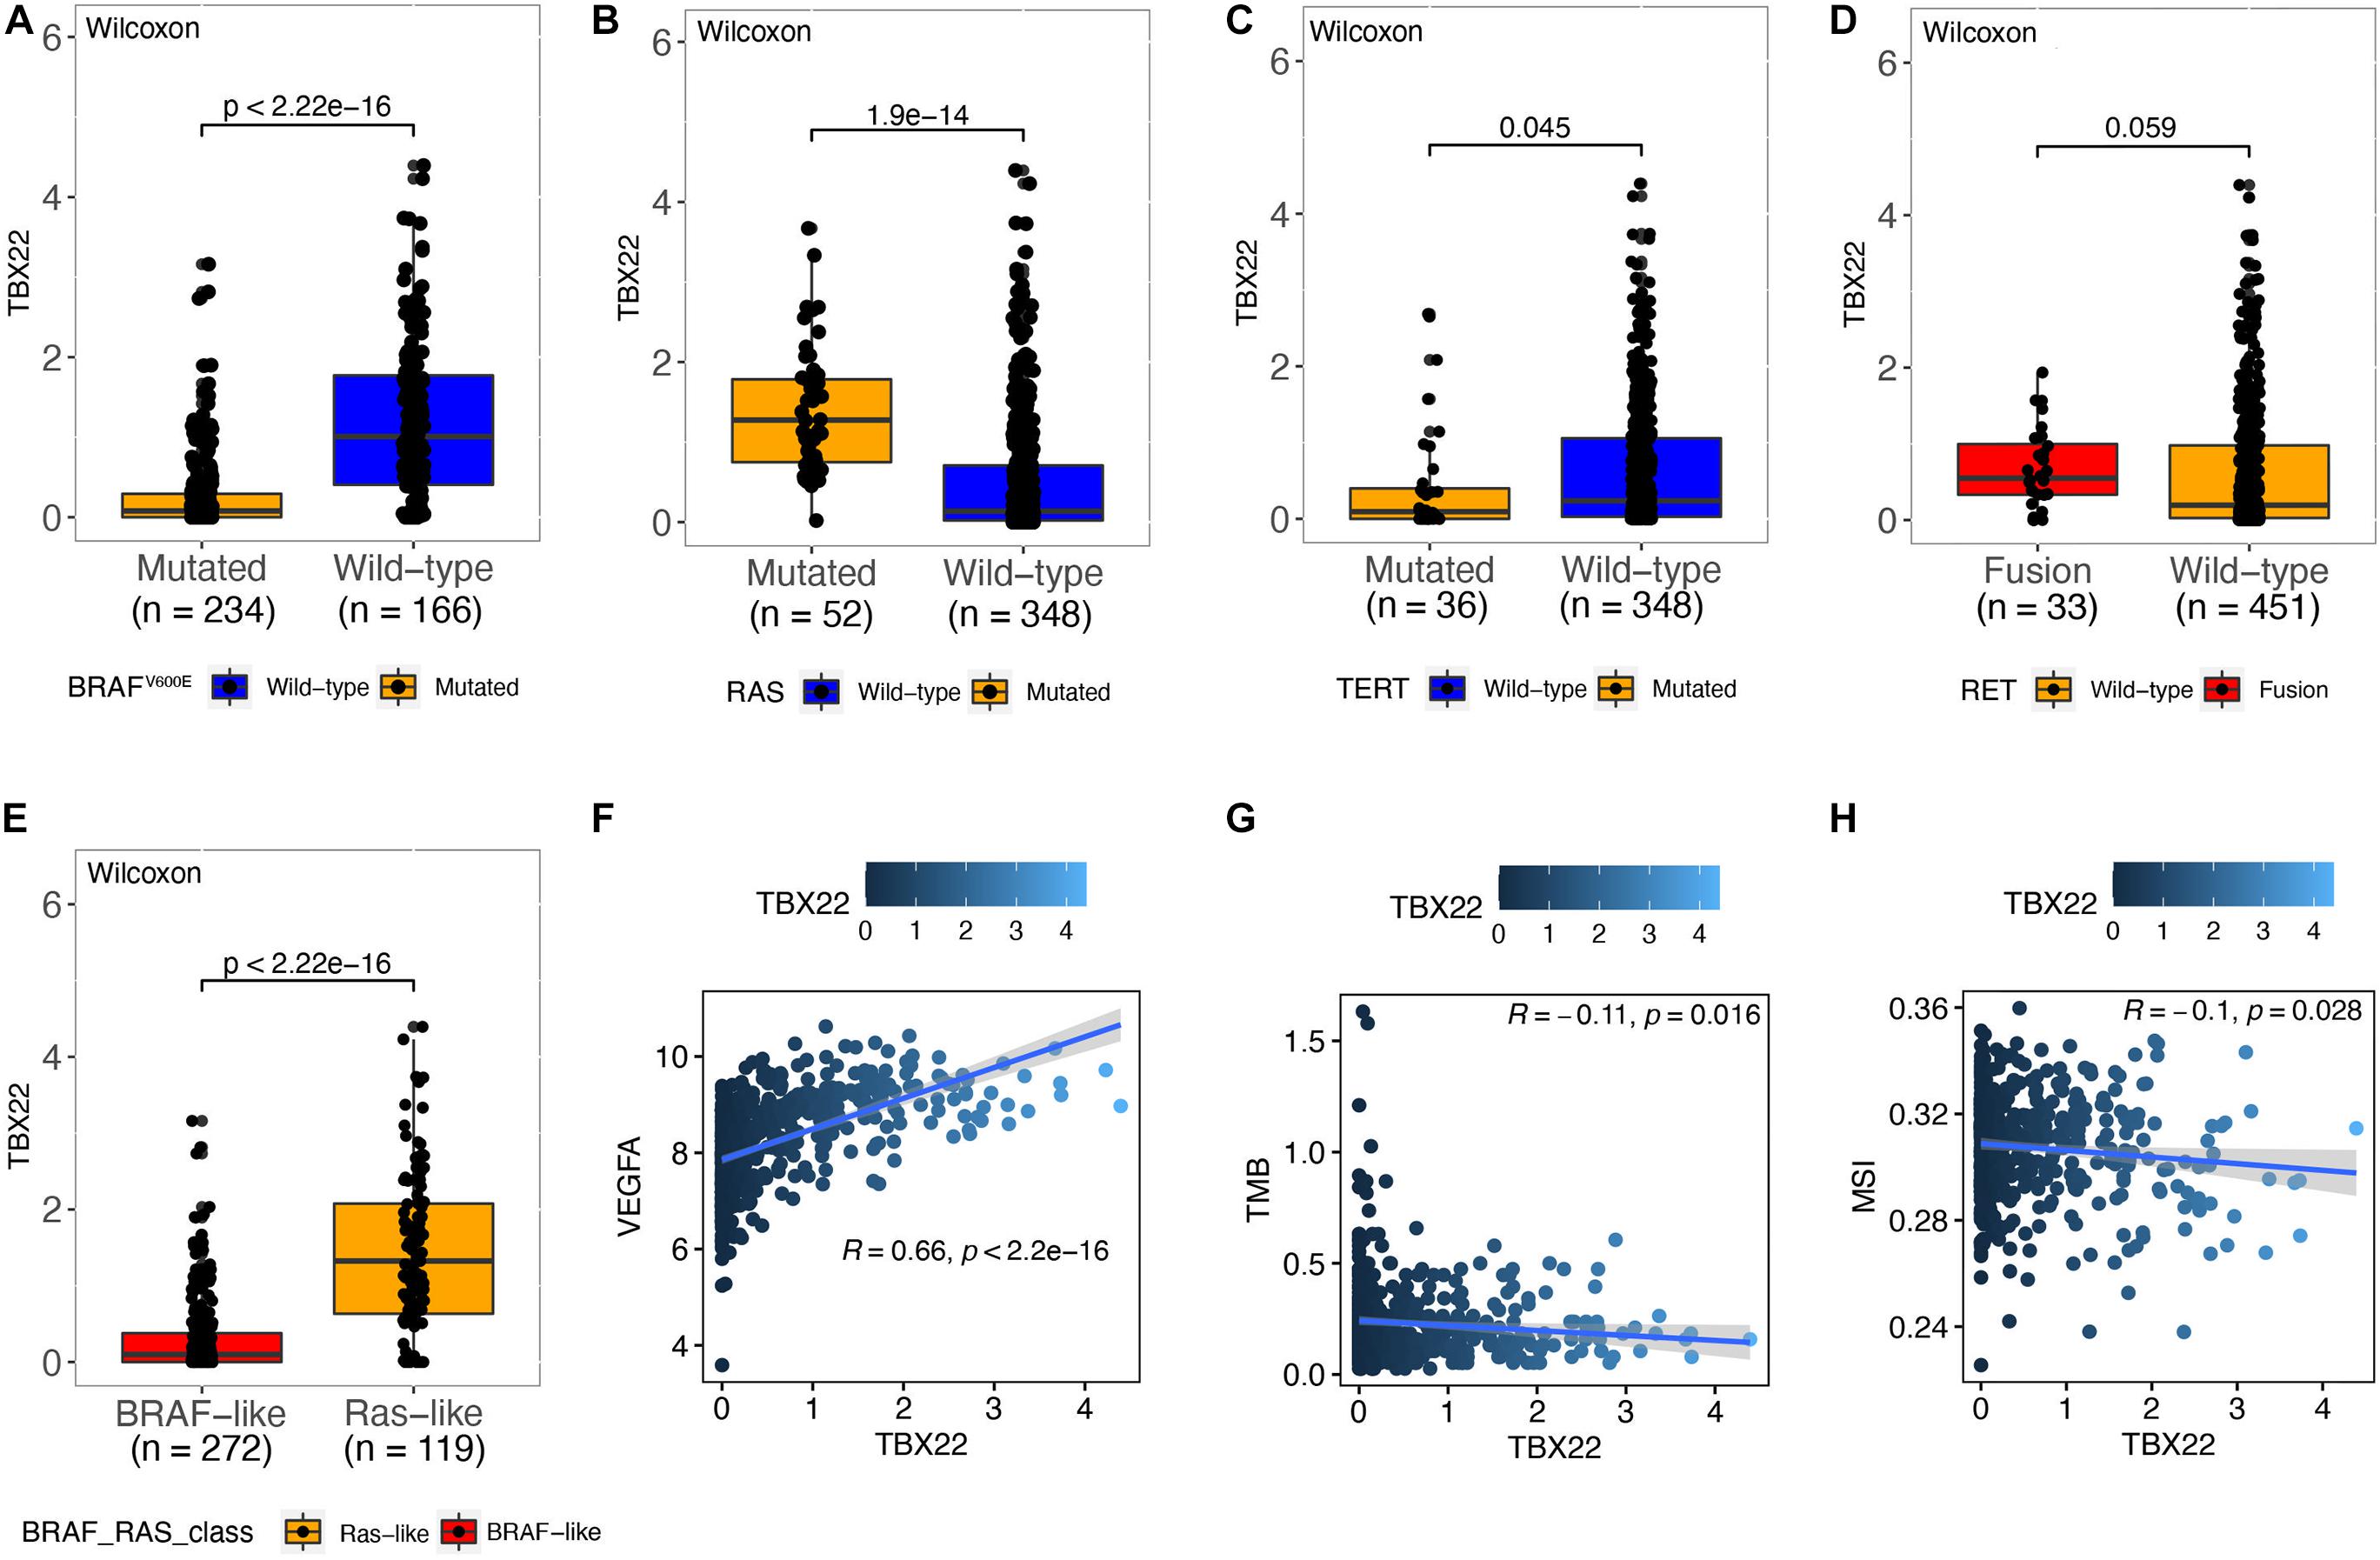
Figure 3. The relationship between TBX22 expression and molecular features of PTC. (A–E) Distribution of the TBX22 expression in PTC patients stratified by (A) BRAFV600E status, (B) RAS status, (C) TERT status, (D) RET status, and (E) BRAF-RAS-class. (F–H) Spearman correlations between TBX22 and (F) VEGFA expression, (G) TMB, and (H) MSI score in PTC patients.
Based on these results, we hypothesized that TBX22 could serve as a biomarker for PTC and ROC curve analysis demonstrated that TBX22 was diagnostically significant with an AUC value of 0.9343, 0.9504, 0.9704, 0.9407, and 0.9189 in the TCGA, GSE33630, GSE35570, GSE60542, and our validated local cohorts, respectively (Figure 4A). TBX22 also had predicted value for the T stage in TCGA cohort (AUC = 0.6195) and our local cohort (AUC = 0.6873, Figure 4B). For LNM, the AUC was 0.6289 in TCGA and 0.6683 in our validated cohort (Figure 4C). Importantly, the AUC for distinguishing BRAFV600E (mutated vs. wild type) was 0.7135 in TCGA and 0.7536 in our local validated cohort (Figure 4D). Our results suggested that TBX22 could be exploited as a reliable predictive biomarker for PTC patients.
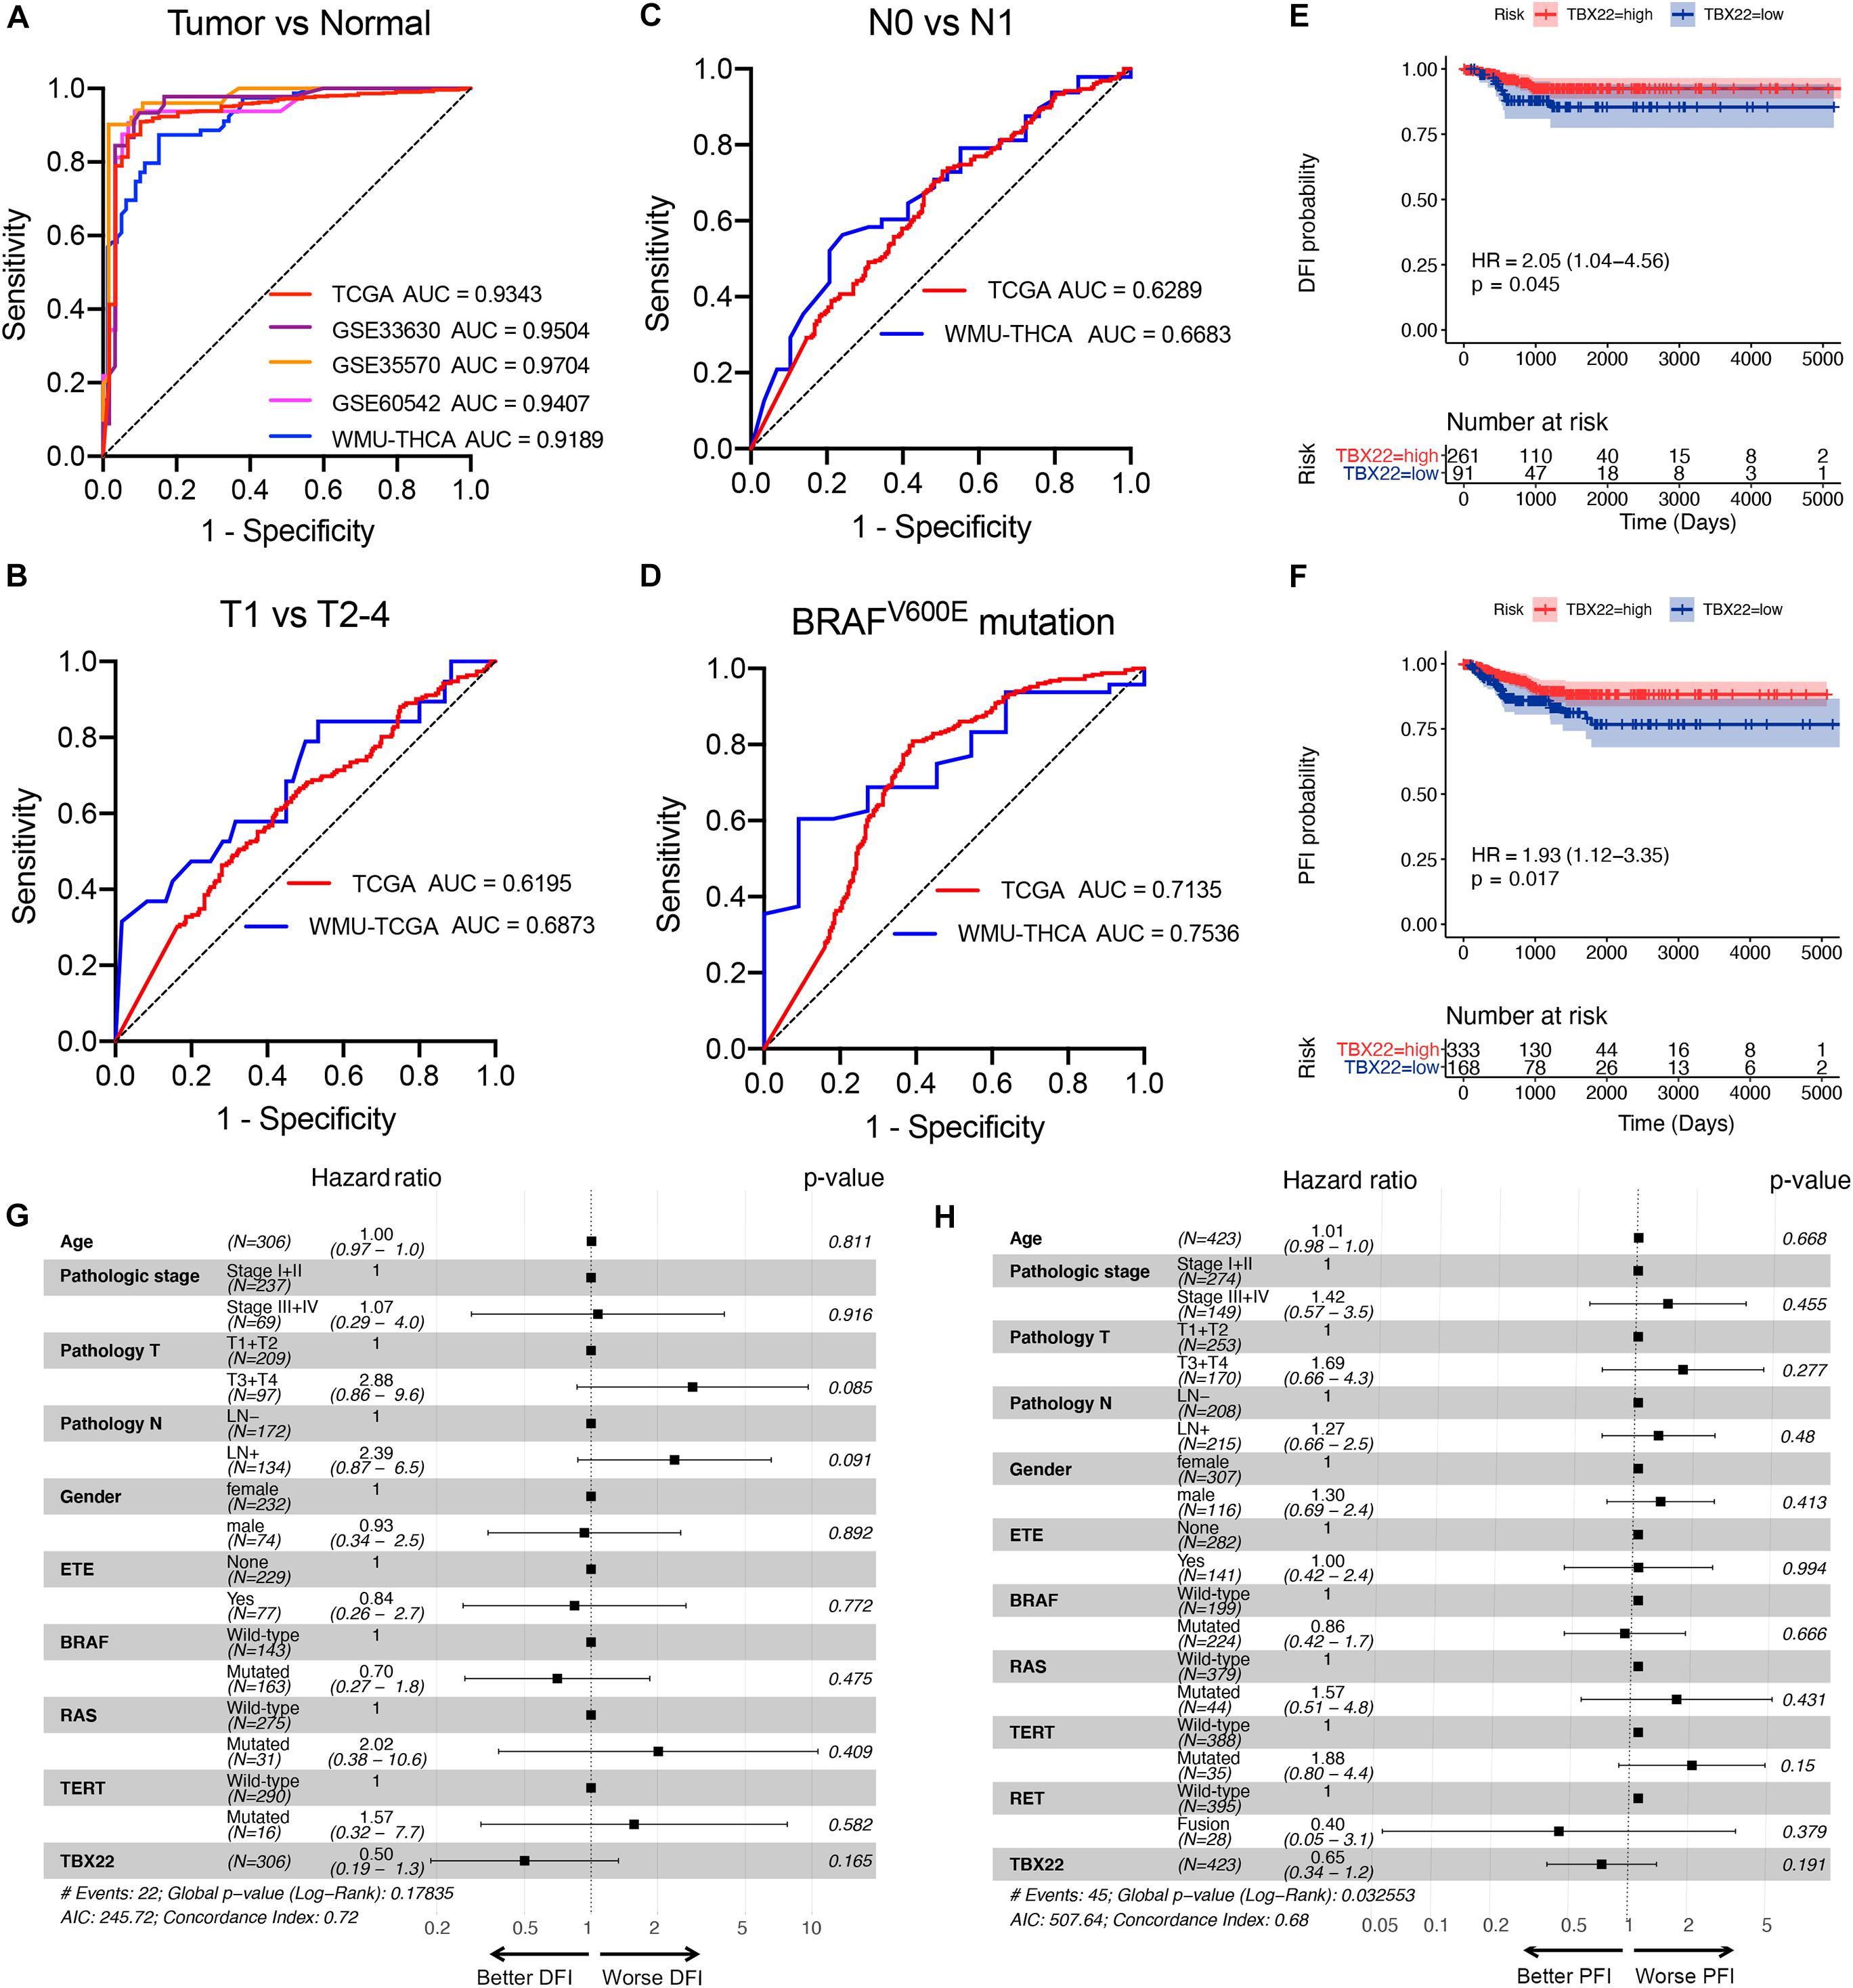
Figure 4. TBX22 is a potential predictive biomarker in PTC. (A) ROC curves showed the diagnostic values of TBX22 in public PTC datasets and our local cohort. (B–D) ROC curve analysis shows predictive efficiency of TBX22 in (B) T stage, (C) LNM status, and (D) BRAFV600E status. (E,F) Comparison of Kaplan–Meier curves of patients with high and low TBX22 expression along with log-rank test p-values and hazard ratios (HR) with confidence intervals is shown for (E) DFI and (F) PFI in the TCGA cohort. DFI, disease-free interval. PFI, progression-free interval. (G,H) Multivariable Cox regression analyses of DFI (G) and PFI (H) in PTC patients.
We hypothesized that TBX22 could be a prognostic biomarker for PTC patients. In the survival analysis, TBX22 expression alone is significantly associated with better DFI (Figure 4E, HR: 2.05; 95% CI: 1.04–4.56; p = 0.045) and PFI (Figure 4F, HR: 1.93; 95% CI: 1.12–3.35; p = 0.017) in PTC patients. Using univariate Cox regression analyses, we identified disease stage, T stage, extrathyroidal extension, LNM, and TBX22 were significantly associated with DFI and PFI (Supplementary Table 1). However, we did not find independent prognostic factors in multivariate Cox regression analyses (Figures 4G,H).
In a specific biological environment, genes interact with each other and drive the underlying pathway and molecular function (Jia et al., 2016). Based on this, we utilized the TCGA dataset to perform co-expression analysis to elucidate the most relevant genes with TBX22. We further selected the genes with strong co-expression correlation with TBX22 (Spearman correlation value >0.4 or <−0.4, p < 0.0001) for GO and KEGG analyses (Figures 5A,B and Supplementary Tables 2–4). GO enrichment and KEGG enrichment analyses unanimously suggested that TBX22 is prevailingly correlated with thyroid hormone metabolism, immune activation, and MAPK signaling pathways. Consistently, GSEA via the hallmarks database revealed that the low TBX22 subset was prevailingly enriched in various tumorigenesis pathways and immune-activating processes (Figure 5C and Supplementary Table 5). These well-reproductive results revealed that TBX22 might have intrinsic roles in tumor immunity and PTC progression.
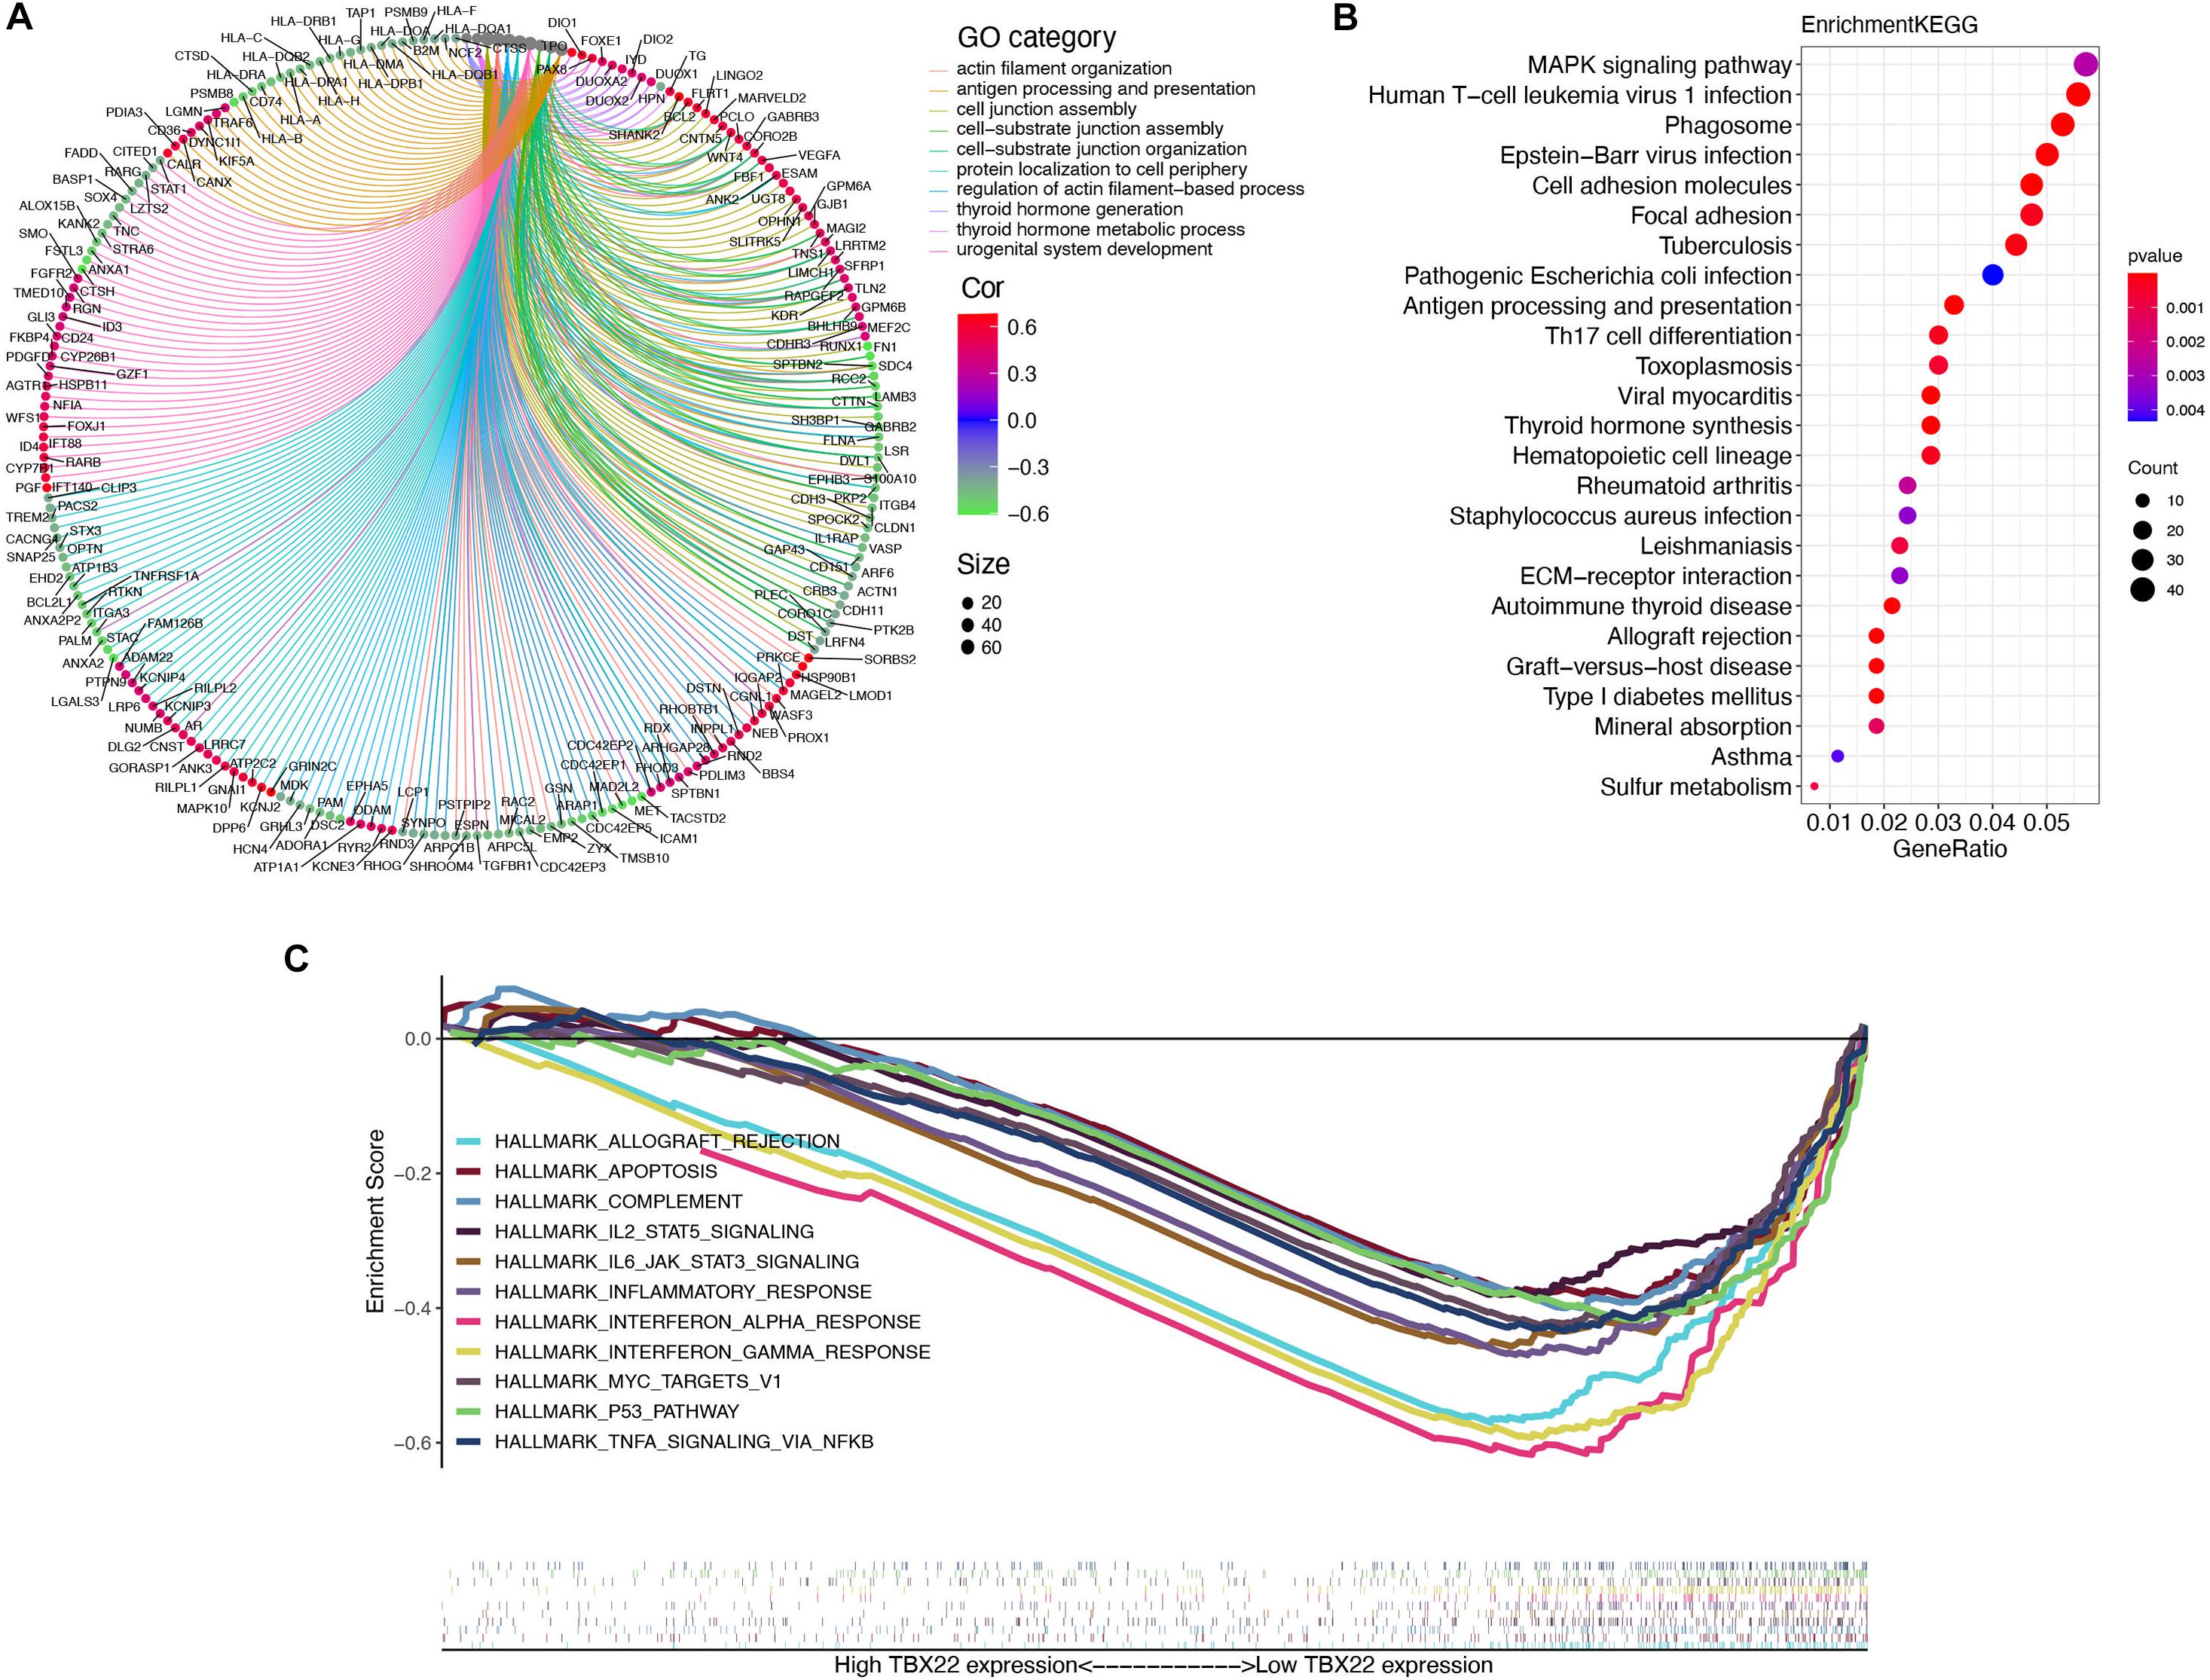
Figure 5. Organization of TBX22 co-expressed genes and functional enrichment analysis. (A,B) Gene ontology (A) and KEGG pathways (B) were significantly correlated with TBX22 expression of thyroid hormone metabolism, immune activation, and MAPK signaling pathways. The top TBX22 co-expressed genes are shown (ranked by Spearman correlation value). (C) GSEA analyses displayed key pathways enriched in low (down) TBX22 expression subset. The complete lists are given in Supplementary Tables 2–5.
Previous studies have revealed that TIICs are extensively distributed in TME of PTC and influence the different stages of tumorigenesis and development. Stromal score and immune score represent the percentage of stromal cells and immune cells in the TME, respectively (Mao et al., 2013). TBX22high and TBX22low groups were divided based on the median value of the TBX22 expression in the TCGA profiles. We adopted the ESTIMATE algorithm to evaluate the immune microenvironment and stromal microenvironment in the PTC samples. In the TBX22low group, the immune score and TME score were higher, whereas tumor purity was lower compared with that in the TBX22high group (Figure 6A). However, no significant association between stromal scores and TBX22 expression was found (Figure 6B). In general, these analyses revealed that the expression of TBX22 was negatively correlated with the immune scores in PTC. To explore the correlation of TBX22 expression with the immune microenvironment, we inferred the abundance of TIICs by establishing two different algorithms, quanTIseq and ImmuCellAI. The landscapes of TIICs and clinical–pathological features are shown in Figures 6C,D. The hierarchical clustering of the whole-sample RNA-seq profile classified immune cells into four subgroups. Moreover, the proportions of TIICs were weakly to highly correlated (Figures 6E,F).
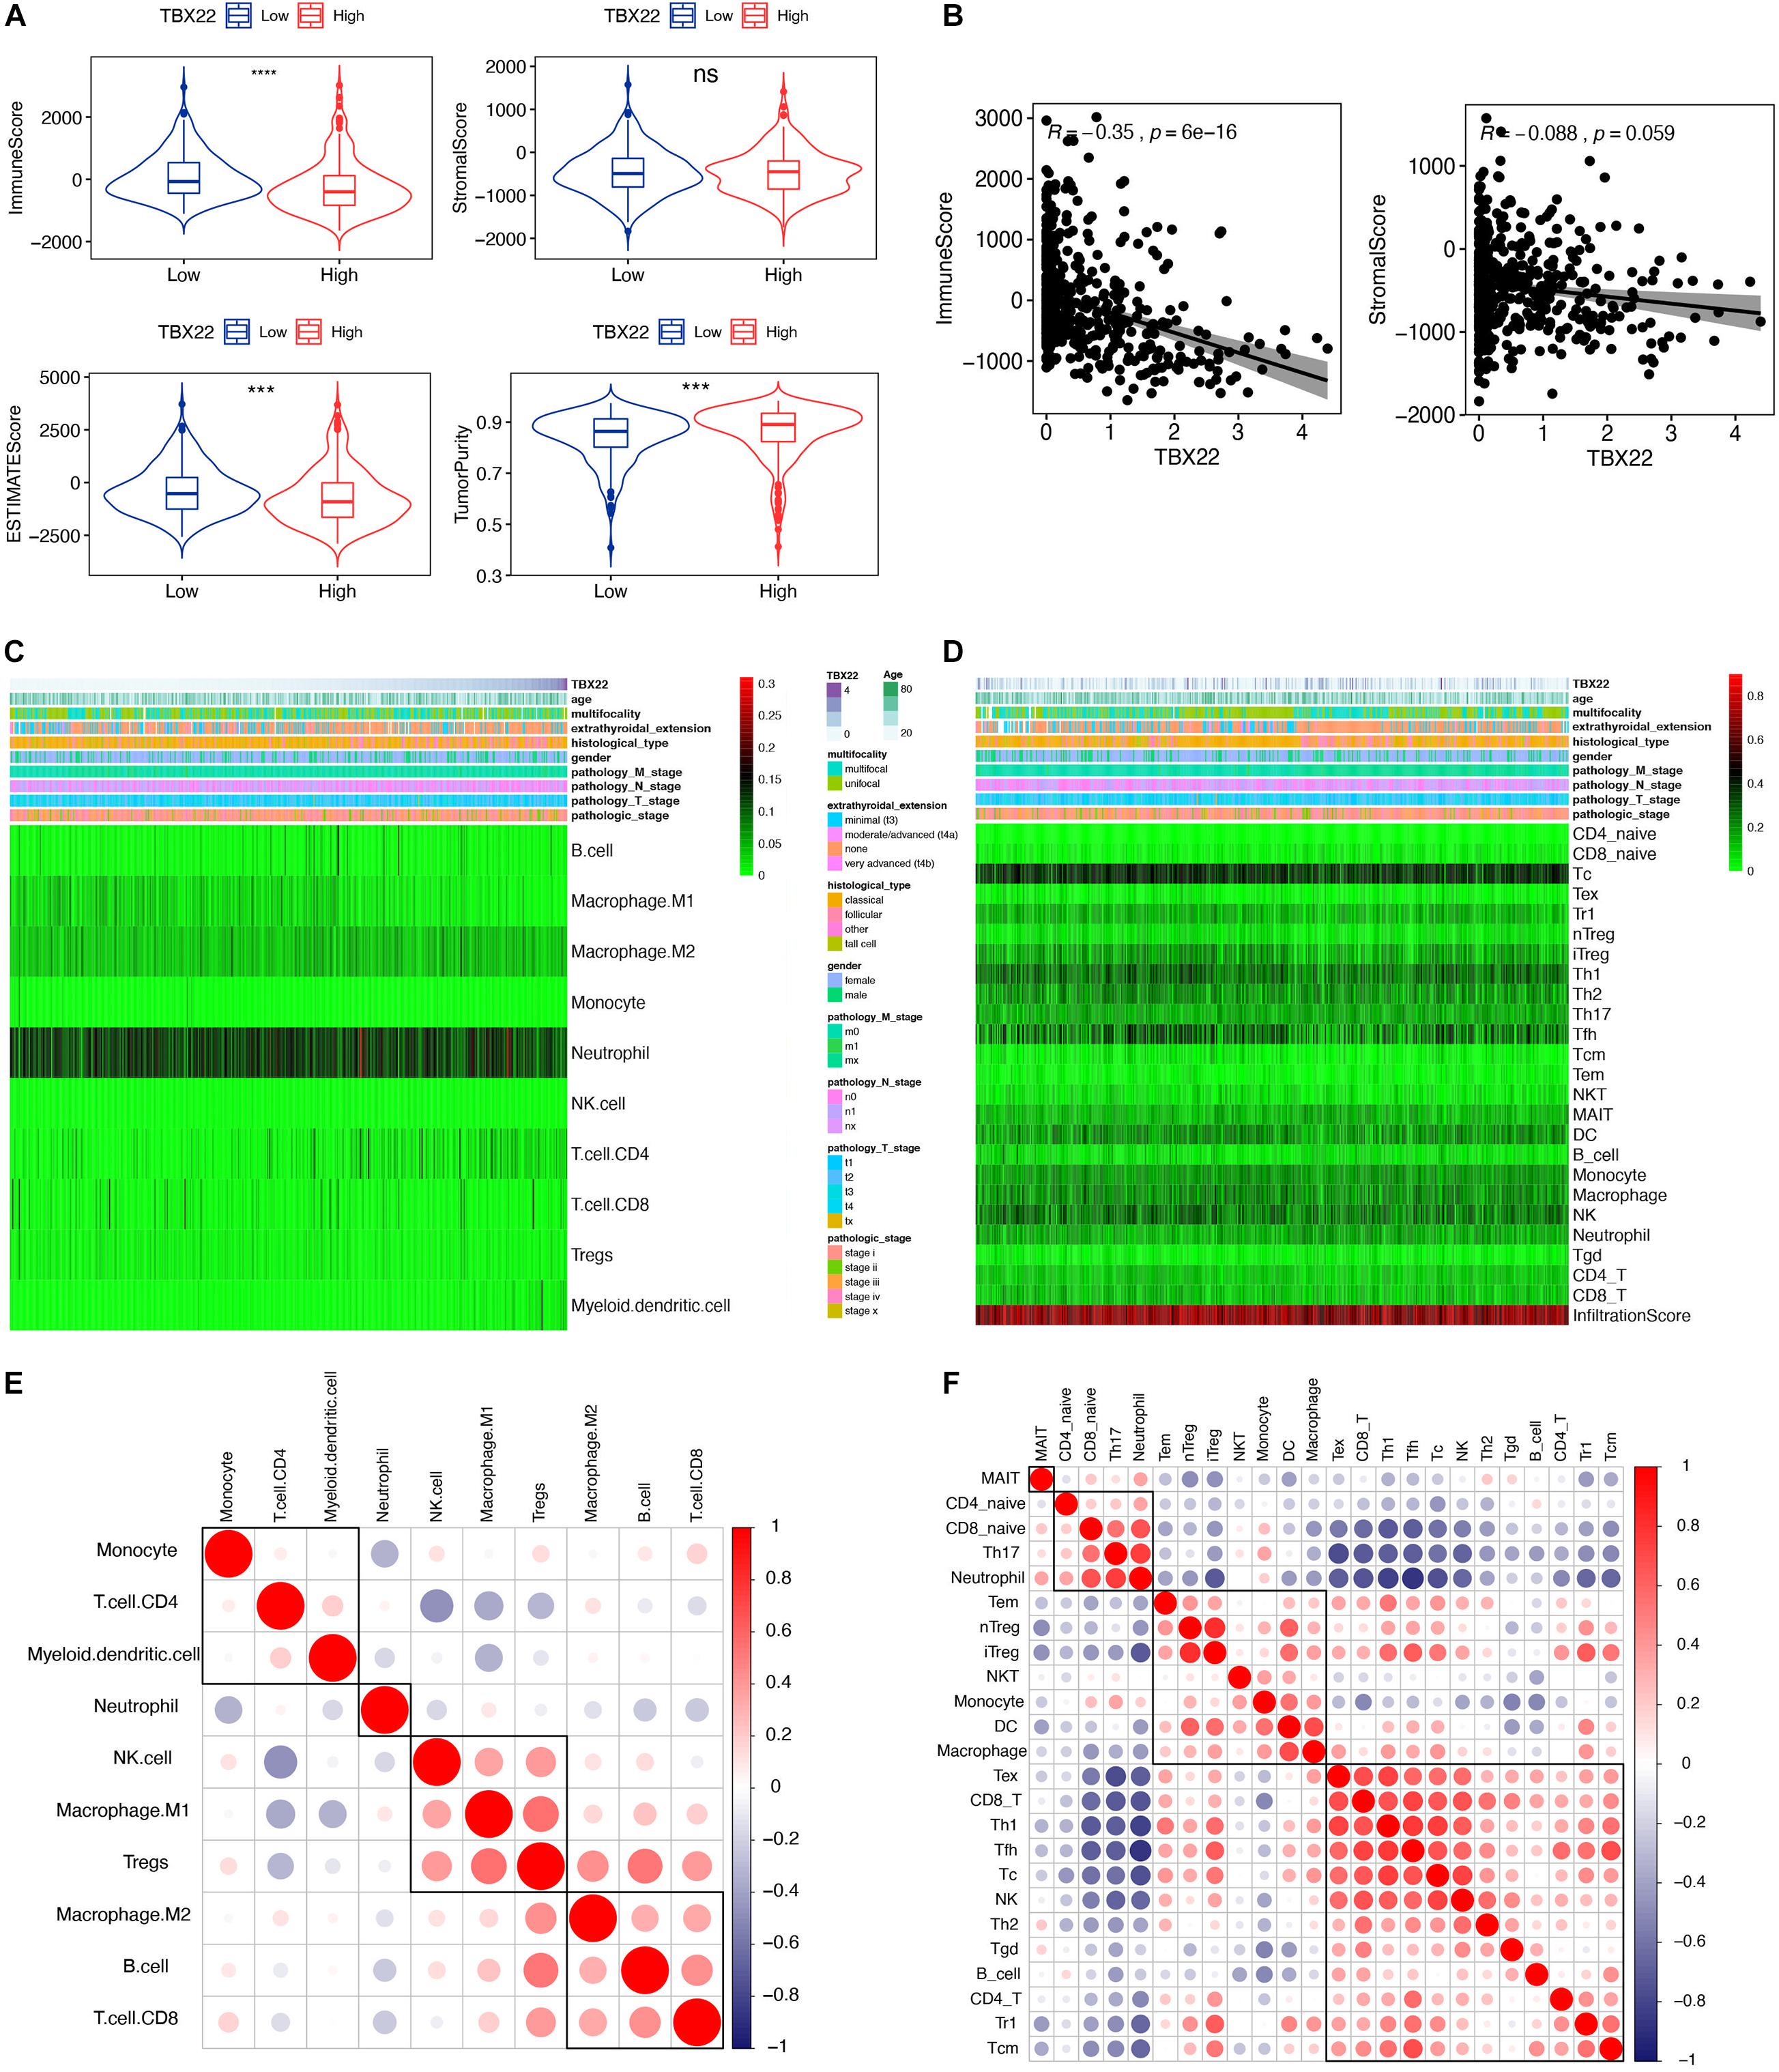
Figure 6. TBX22 is related to tumor immune microenvironment phenotype. (A) Comparison of the immune score, stromal score, microenvironment score, and tumor purity between the TBX22high and TBX22low groups. The p-value, testing the group difference, was calculated with the two-sided Wilcoxon rank-sum test. (B) Spearman correlations between TBX22 expression and immune and stromal scores. (C,D) Heatmap of the TIIC proportions in the PTC microenvironment quantified by (C) quanTIseq and (D) ImmuCellAI. (E,F) Spearman correlation matrix of the different TIIC proportions in the PTC microenvironment quantified by (E) quanTIseq and (F) ImmuCellAI. ***p < 0.001, ****p < 0.0001.
We tried to determine whether the TIME was altered among patients with different levels of TBX22 (Figures 7A,B). TBX22low PTC was associated with significantly higher anticancer M1 macrophages and significantly lower procancer M2 macrophages; anticancer Th1 cells were higher in TBX22low PTC, while procancer Th2 cells did not have a significant difference between different TBX22 states. The levels of anticancer CD8+ T cells and procancer regulatory T cells were both elevated in TBX22low PTC. At the same time, TBX22low PTC had a higher number of anticancer T-follicular helper cells. NK cells did not have a significant difference between different TBX22 states. Strikingly, CD4+ T cells were also lower in the TBX22low PTC. ImmuCellAI infiltration score, an assessment of universal immune cytolytic activity, was also higher in the TBX22low group (Figure 7B).
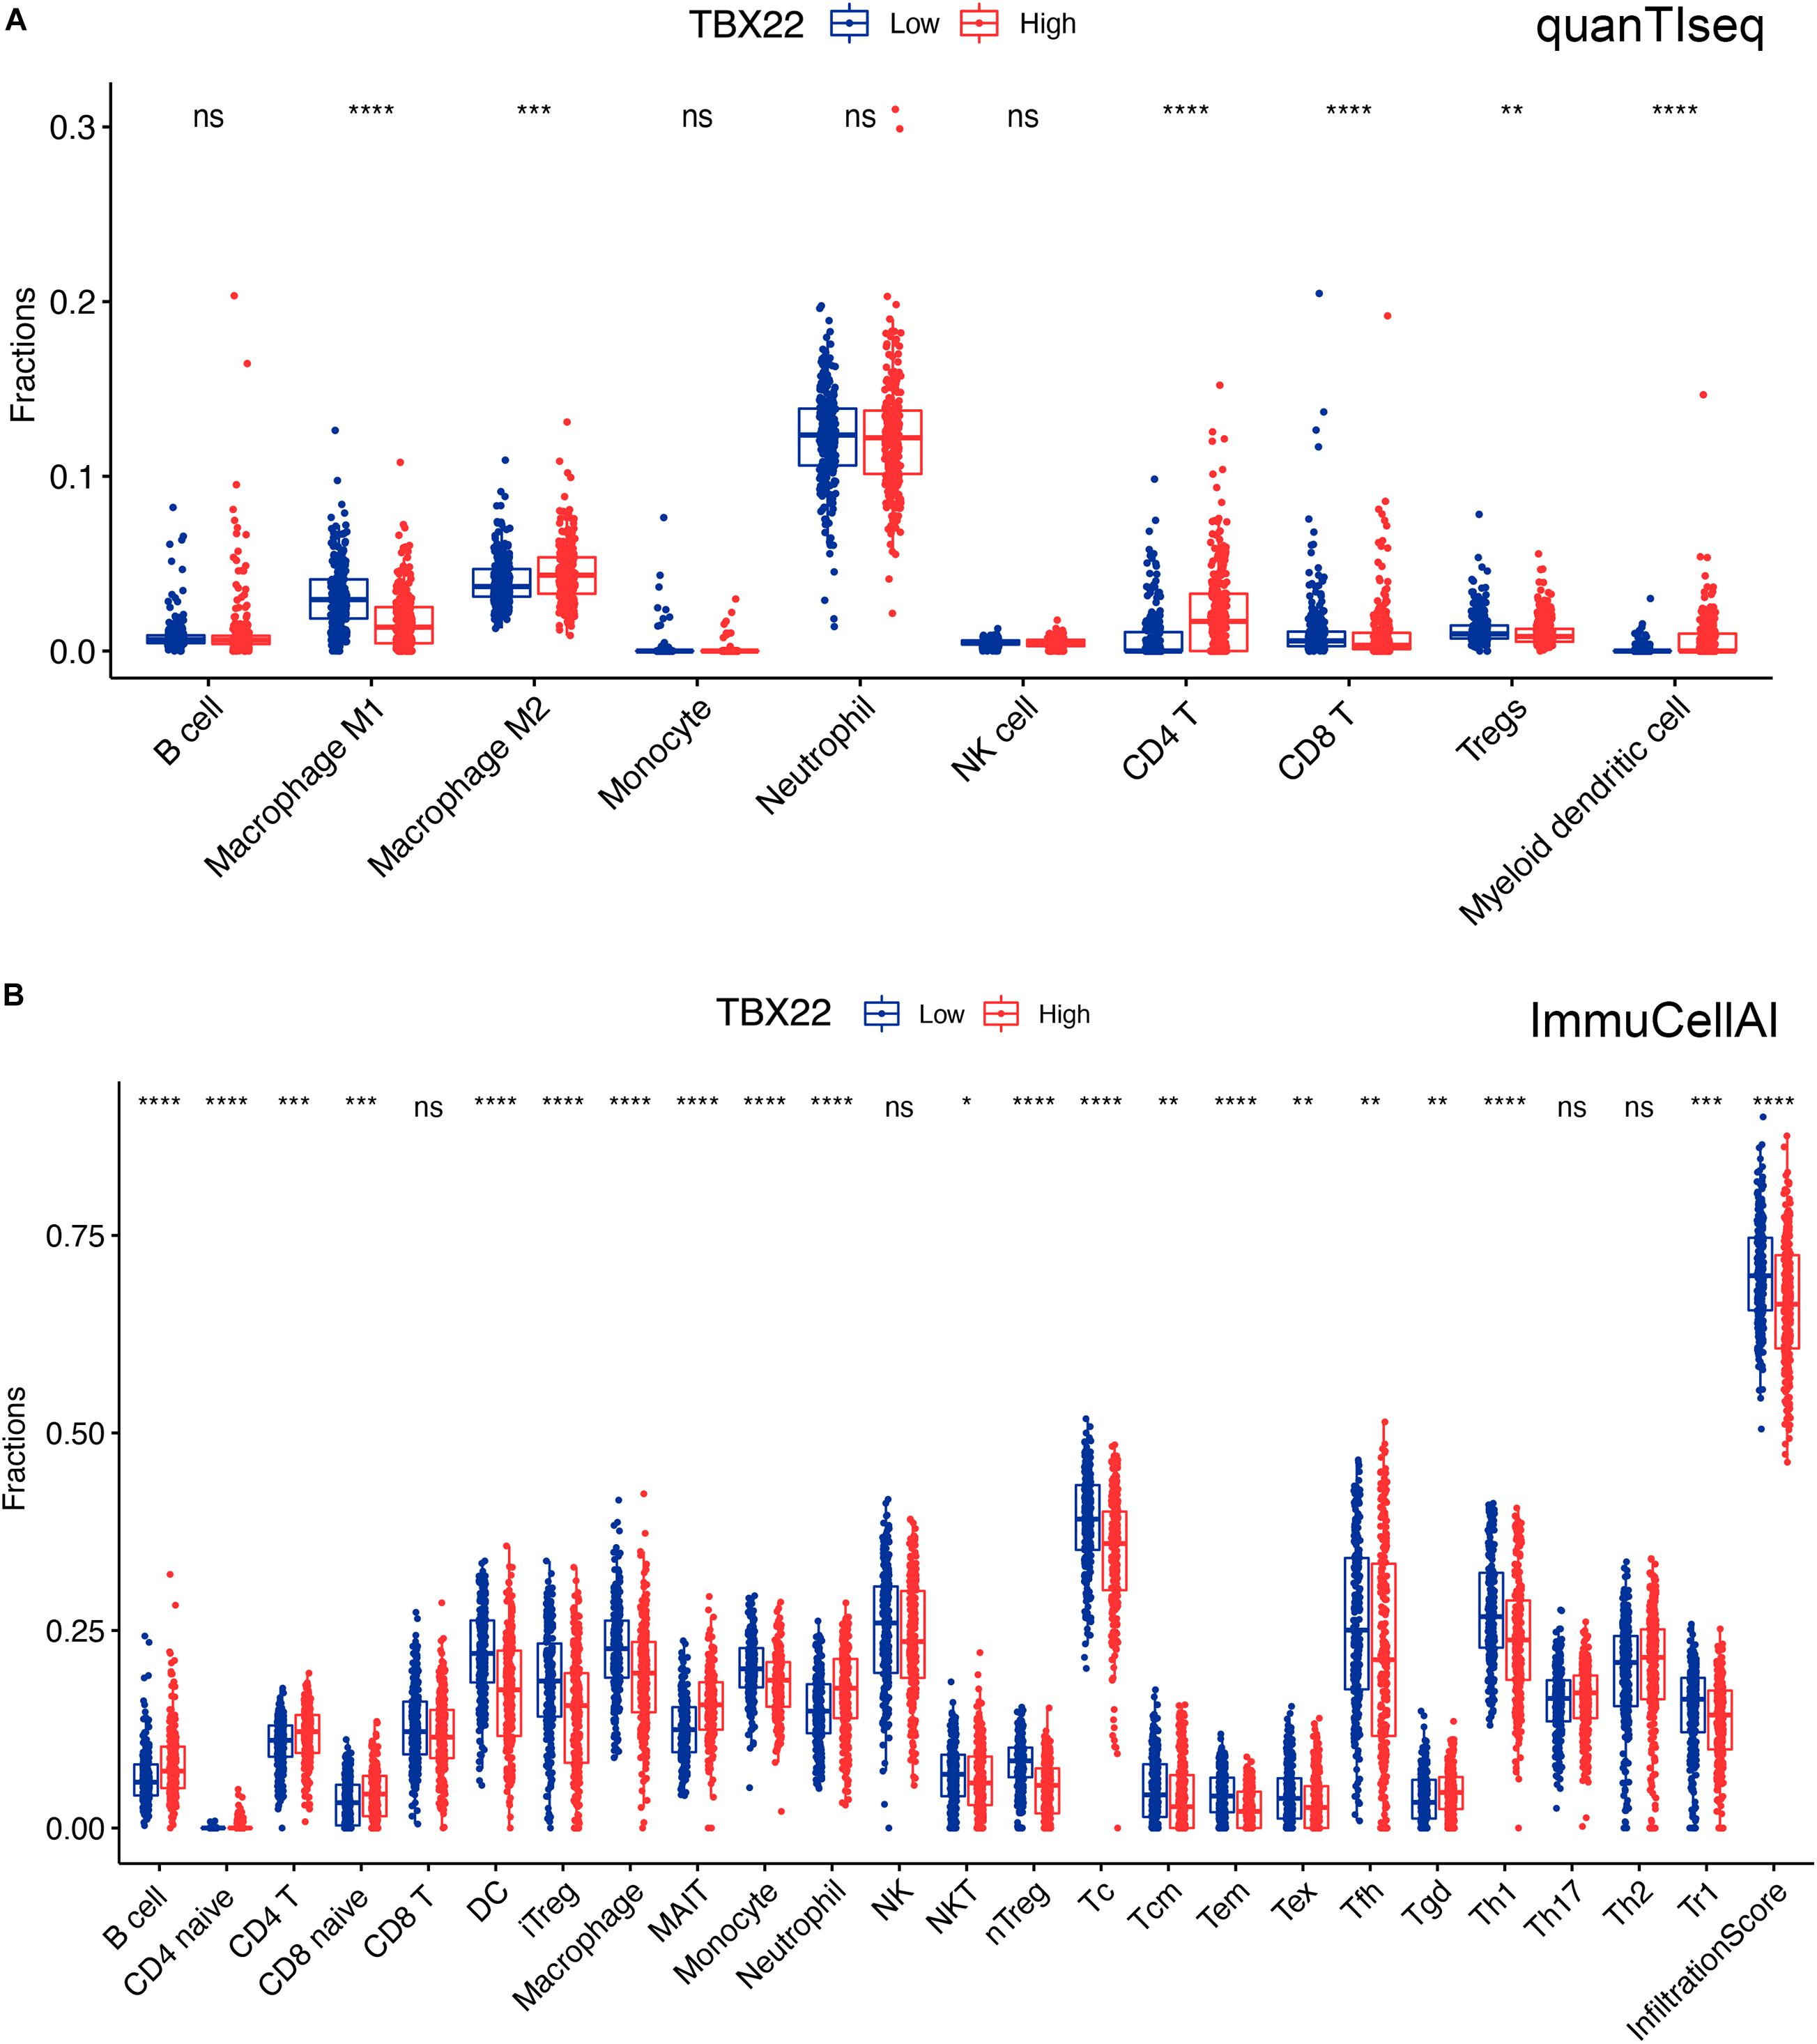
Figure 7. Boxplots of immune cells in TBX22high and TBX22low PTC in TCGA cohorts. Comparison of the immune infiltrated cell components quantified by (A) quanTIseq and (B) ImmuCellAI in the TBX22high and TBX22low groups. *p < 0.05, **p < 0.01, ***p < 0.001, ****p < 0.0001. The scattered dots represent all score values, and the thick line represents the median value within each group. The bottom and top of the boxes are the 25th and 75th percentiles (interquartile range). The difference between TBX22high and TBX22low groups was compared through the two-sided Wilcoxon rank-sum test.
The cancer immunity cycle triggers a series of gradual events and enables the anticancer immune response to effectively kill cancer cells (Chen and Mellman, 2013). As shown in Figure 8, after releasing cancer cell antigen and presenting cancer antigen, effector T-cell responses against the cancer-specific antigens were primed and activated (step 1 to step 3). TBX22low PTC had higher immune activity in step 3 compared with TBX22low. We observed that the TBX22low PTC had higher anticancer immunity scores in the trafficking of T cells to tumors (step 4) and infiltration of T cells into tumors (step 5). TBX22low PTC had a significantly higher level of recruiting CD8+ T cells, Th1, Th22, neutrophil, natural killer, eosinophil, basophil, B cells, Th2, and MDSCs. Interestingly, an elevated level of recognition of cancer cells by T cells (step 6) was observed in TBX22high PTC. In summary, TBX22low state may be associated with active anticancer immune response, and TBX22 had a negative role in the cancer immunity cycle.
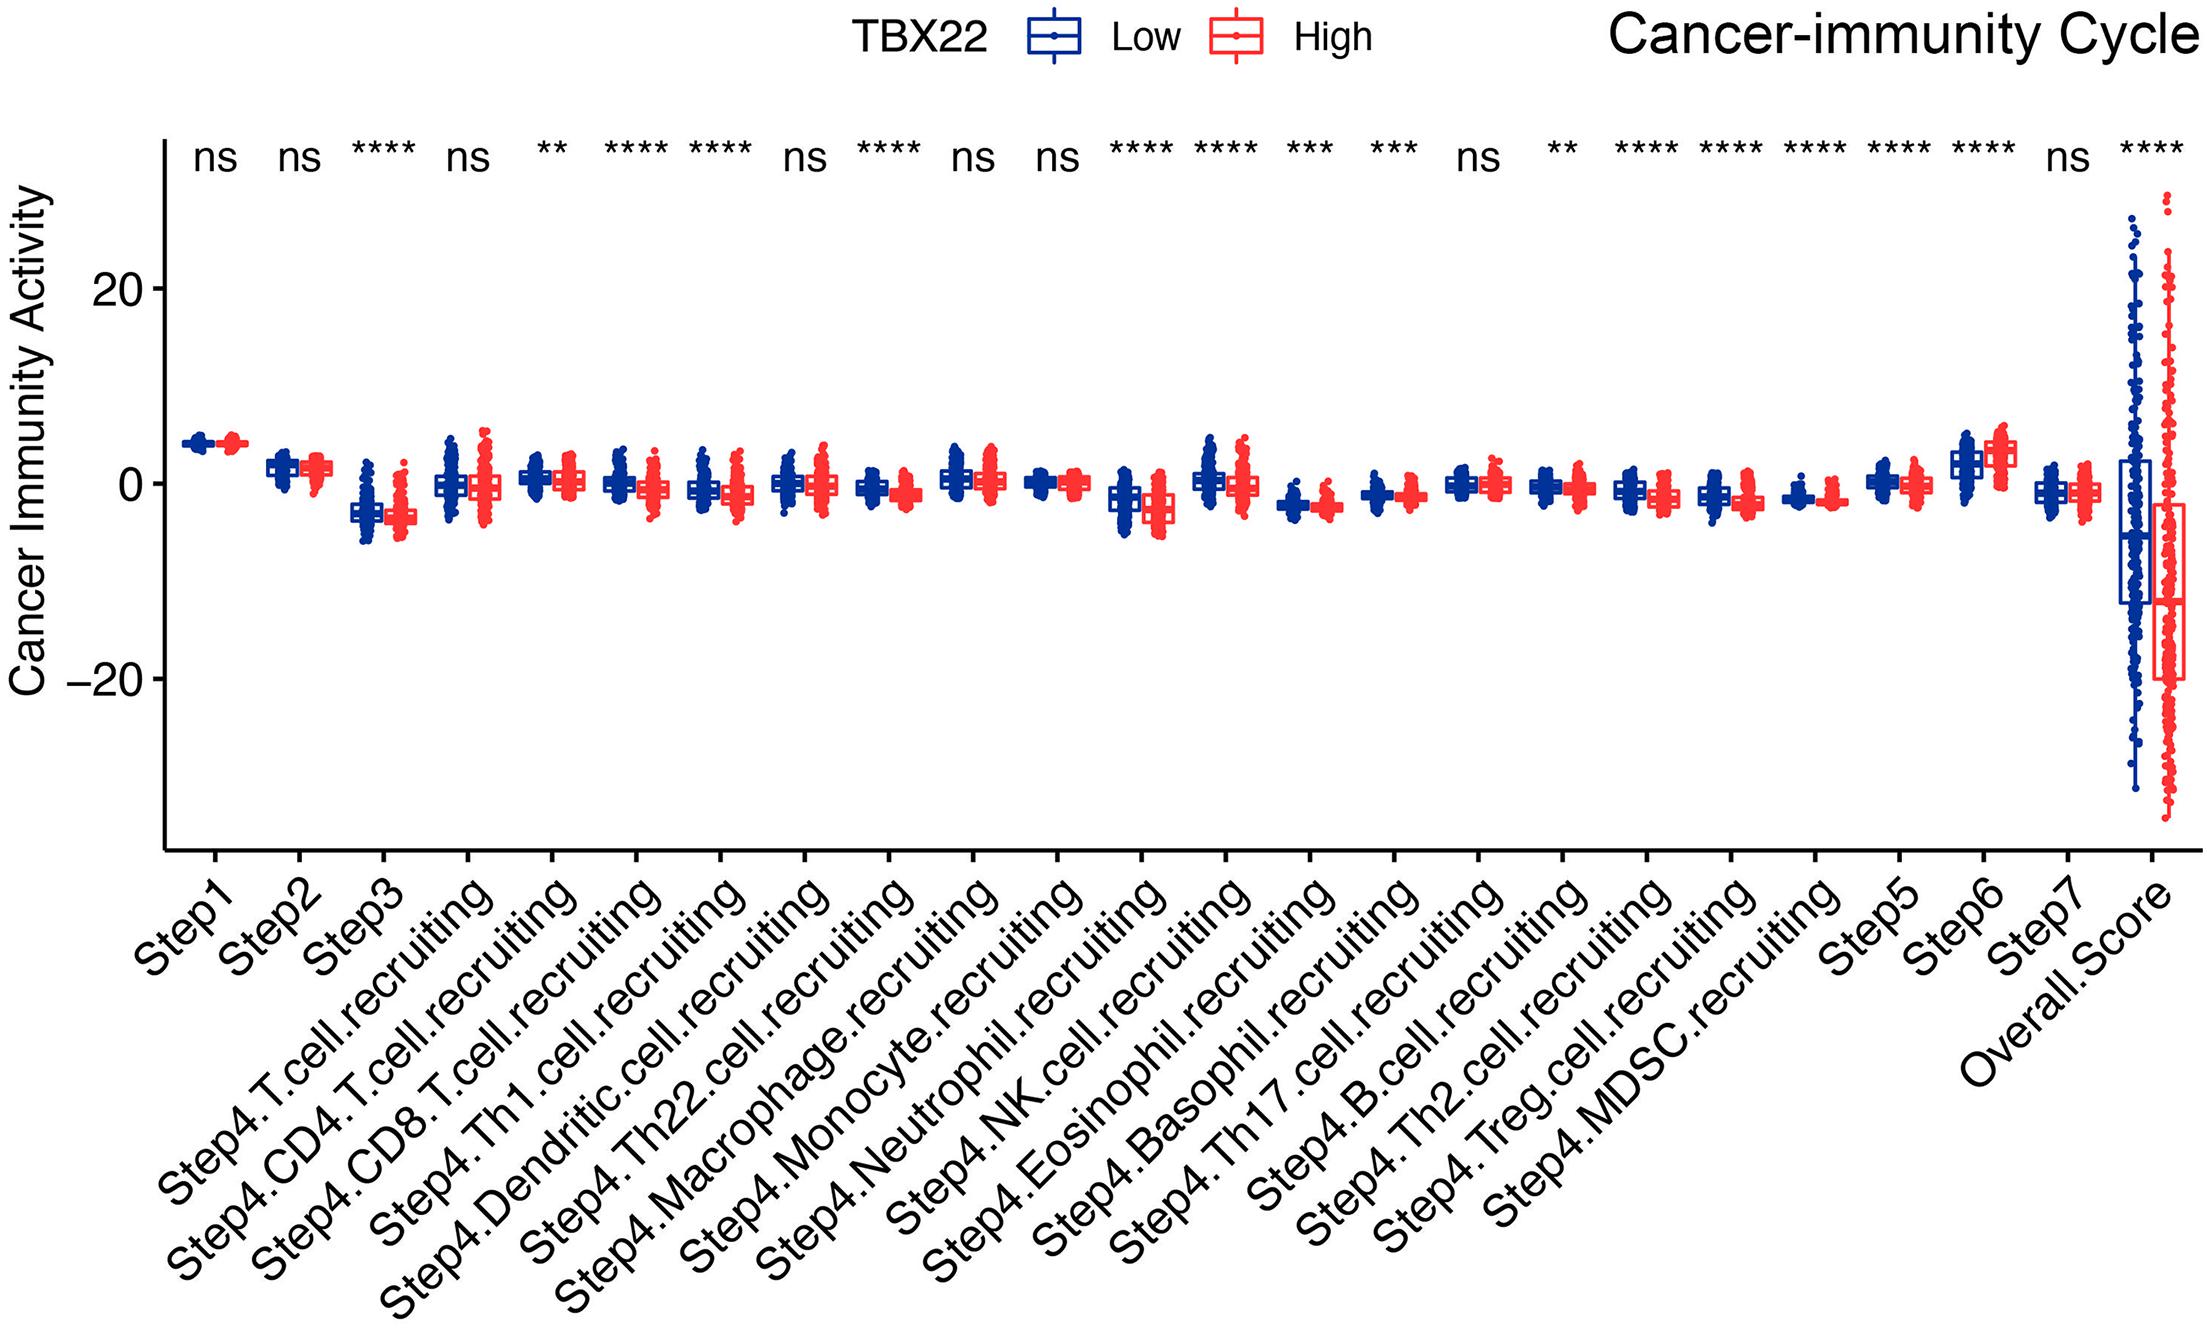
Figure 8. Comparison of the activity of the cancer immunity cycle between the TBX22high and TBX22low groups. **p < 0.01, ***p < 0.001, ****p < 0.0001. The scattered dots represent all score values, and the thick line represents the median value within each group. The bottom and top of the boxes are the 25th and 75th percentiles (interquartile range). The difference between TBX22high and TBX22low groups was compared through the two-sided Wilcoxon rank-sum test.
To complement the above bioinformatic analyses, we verified the expression of TBX22 in PTC cell lines. Compared with the normal thyroid cell lines (HTori-3), the TBX22 level was significantly lower in PTC cell lines (BCPAP, TPC-1, and KTC-1) (Figure 9A). Next, we sought to elucidate the functional effects of TBX22 dysregulation through studies in vitro on PTC cell lines.
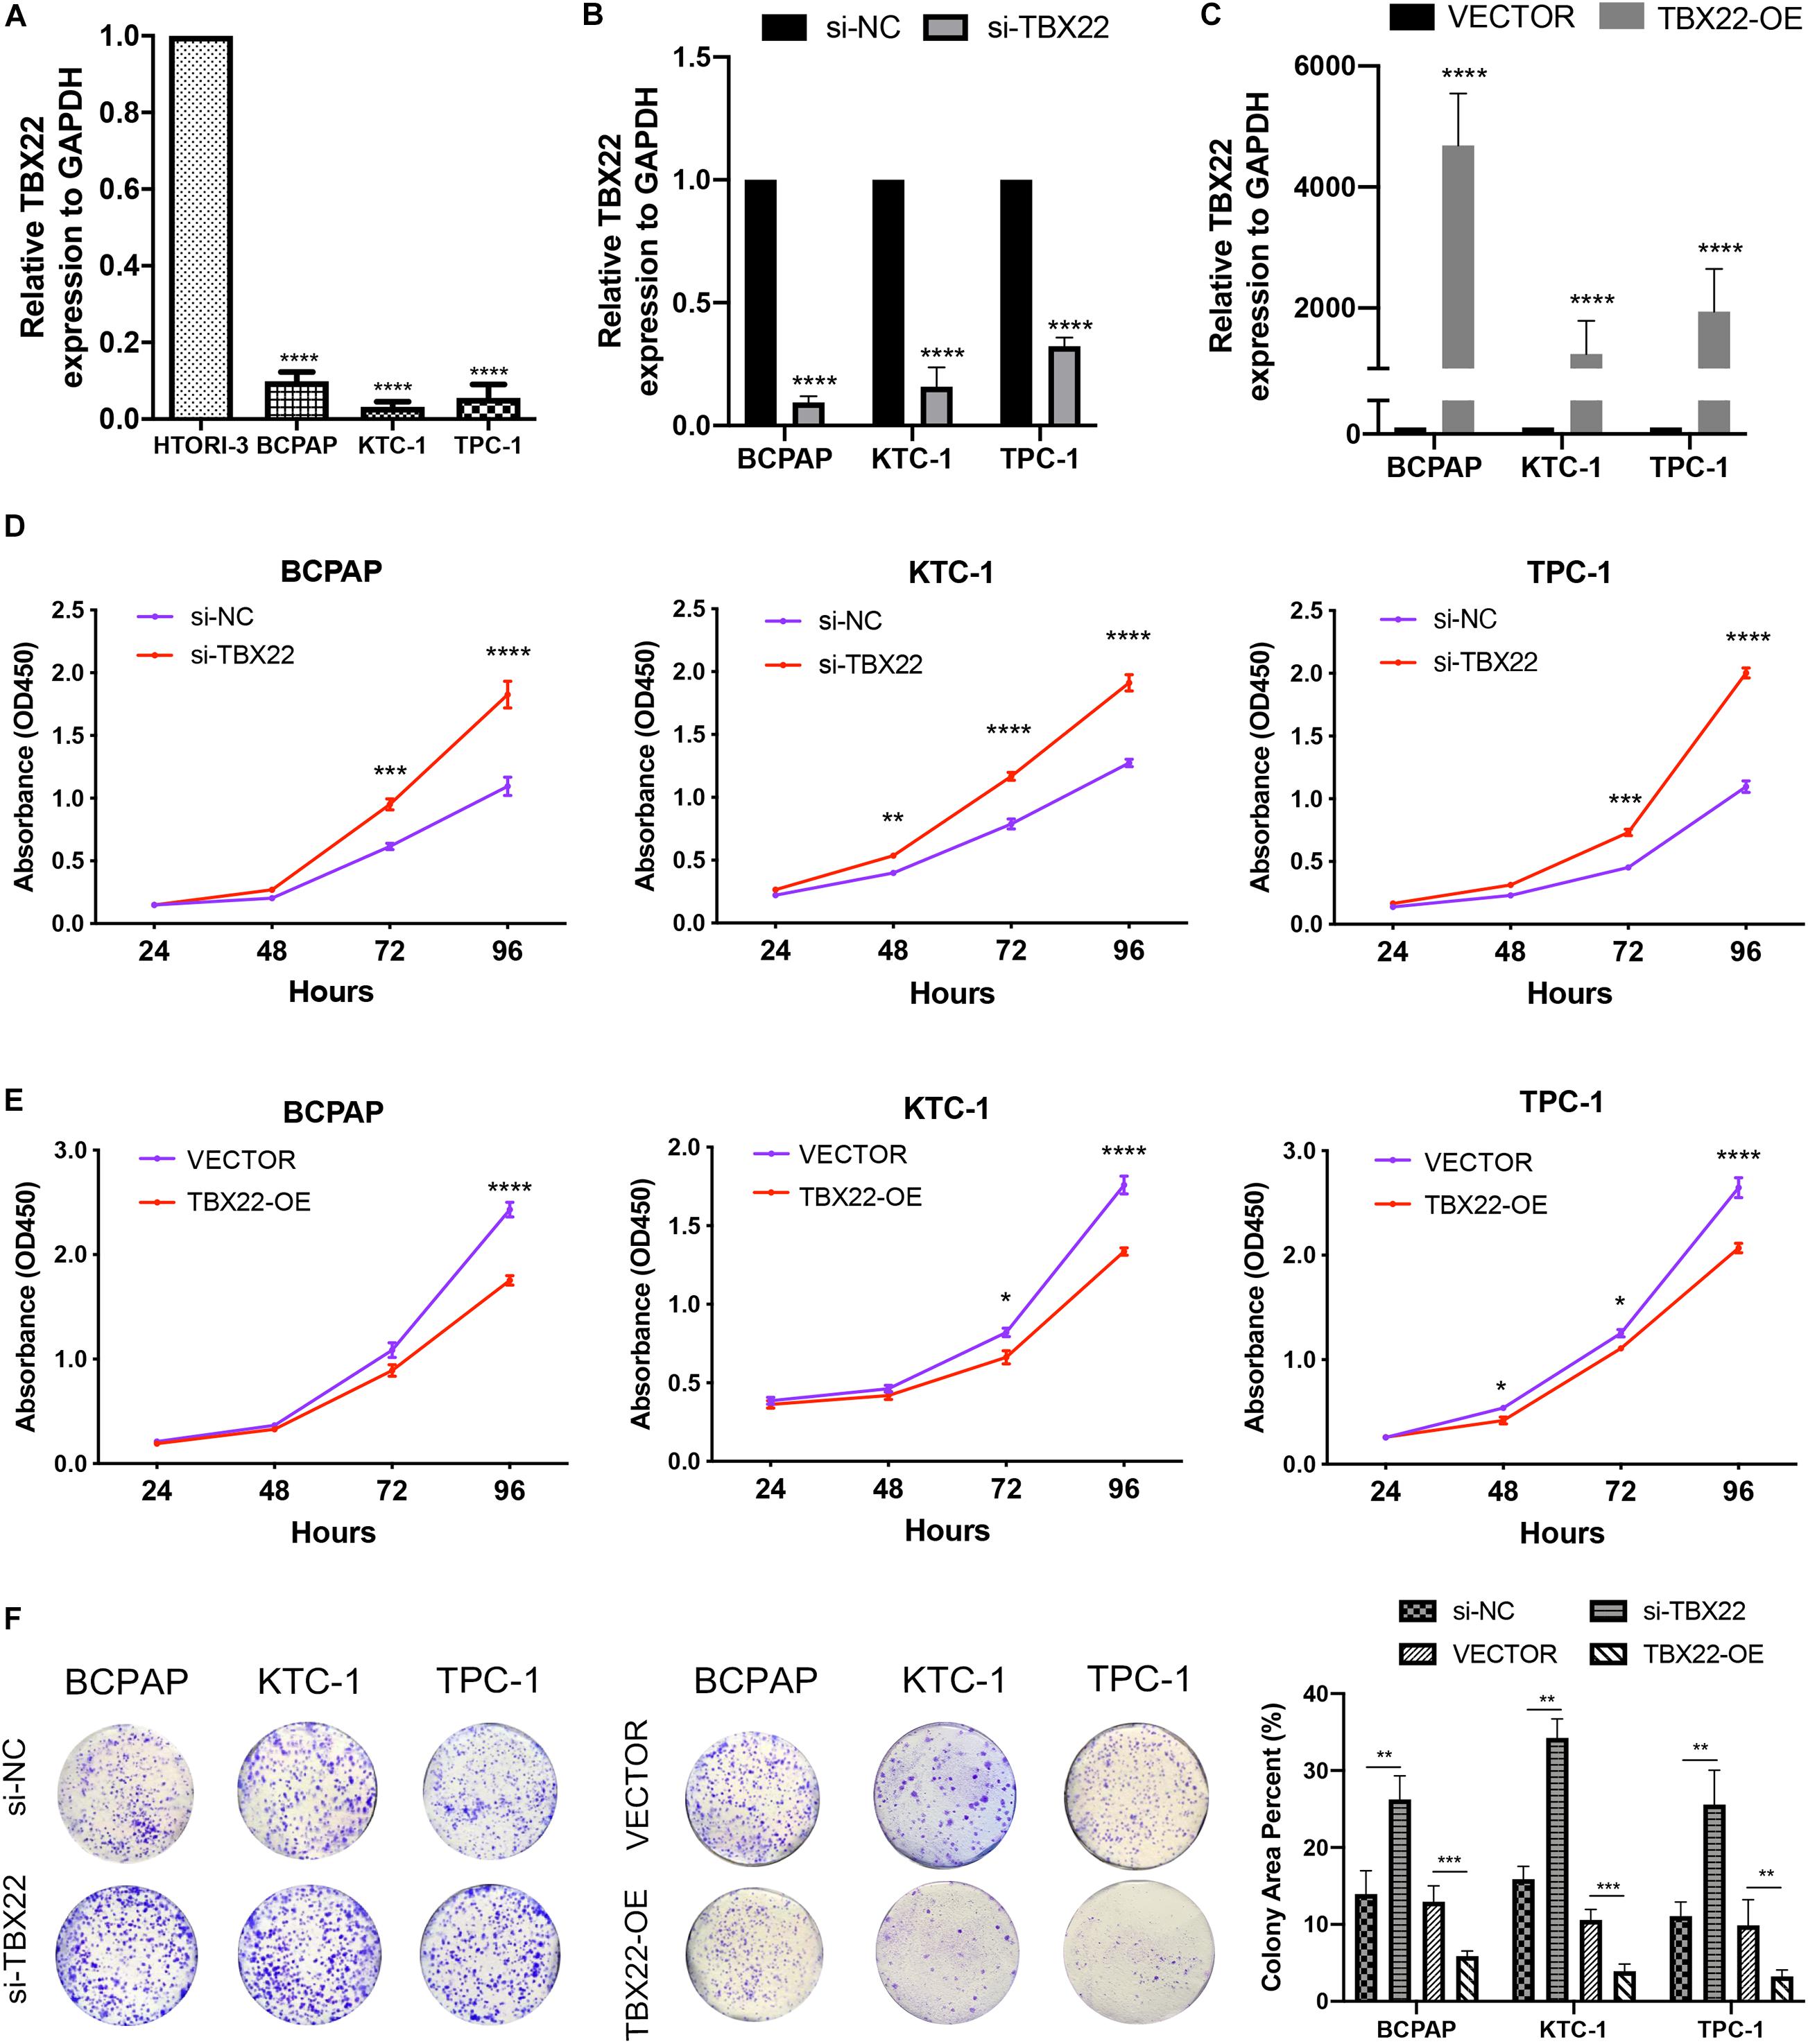
Figure 9. TBX22 was downregulated in PTC cell lines and attenuated the capability of proliferation. (A) Relative TBX22 mRNA expression levels were significantly lower in thyroid cancer cell lines (BCPAP, TPC-1, and KTC-1) compared with the normal thyroid epithelial cell line HTori-3. (B) Transcriptional level of TBX22 in si-NC and si-TBX22 transfected PTC cells via qRT-PCR. (C) Transcriptional level of TBX22 in VECTOR and TBX22-OE group via qRT-PCR. (D,E) CCK-8 assays determined the cell viability of (D) loss-of-TBX22 and (E) gain-of-TBX22 PTC cells. (F) Colony formation assays were used to determine the cell colony formation ability of loss-of-TBX22 and gain-of-TBX22 PTC cells. Student’s t-test was used in comparison with the si-NC or VECTOR groups. *p < 0.05, **p < 0.01, ***p < 0.001, ****p < 0.0001 in data analysis, and all assays were repeated at least three times.
We had found that TBX22 was associated with T stage and disease stage in PTC patients (Figures 2A,D,F). To determine the function of TBX22 in PTC tumorigenesis and progression, we knocked down TBX22 in PTC cell lines using TBX22-targeting siRNA (si-TBX22). In contrast, we performed gain-of-function studies and generated control (VECTOR) and TBX22-overexpressing (TBX22-OE) PTC cell lines. The silenced (Figure 9B) and overexpressed (Figure 9C) efficiency of TBX22 were highly effective at the mRNA level evaluated by qRT-PCR. Remarkably, si-TBX22 cells showed increased cell proliferation in vitro compared with si-NC cells (Figure 9D). On the other hand, TBX22-OE cells showed decreased cell proliferation in vitro compared with VECTOR cells (Figure 9E). In further colony formation assays, the si-TBX22 cells also showed increased colonies compared with si-NC cells, whereas TBX22-OE had decreased colonies compared with VECTOR cells (Figure 9F).
We also had found that the expression of TBX22 was associated with LNM and ETE in PTC patients (Figures 2B,C,G). To evaluate the impact of dysregulated TBX22 on metastasis, we performed the assays of cell migration and invasion. si-TBX22 cells effectively increased migratory ability compared with those in the si-NC group, whereas TBX22-OE cells attenuated migratory ability compared with those in the VECTOR group (Figure 10A). Similar results were observed in invasion assays (Figure 10B). These data showed that TBX22 might regulate the proliferation, migration, and invasion capacities of the PTC cells.
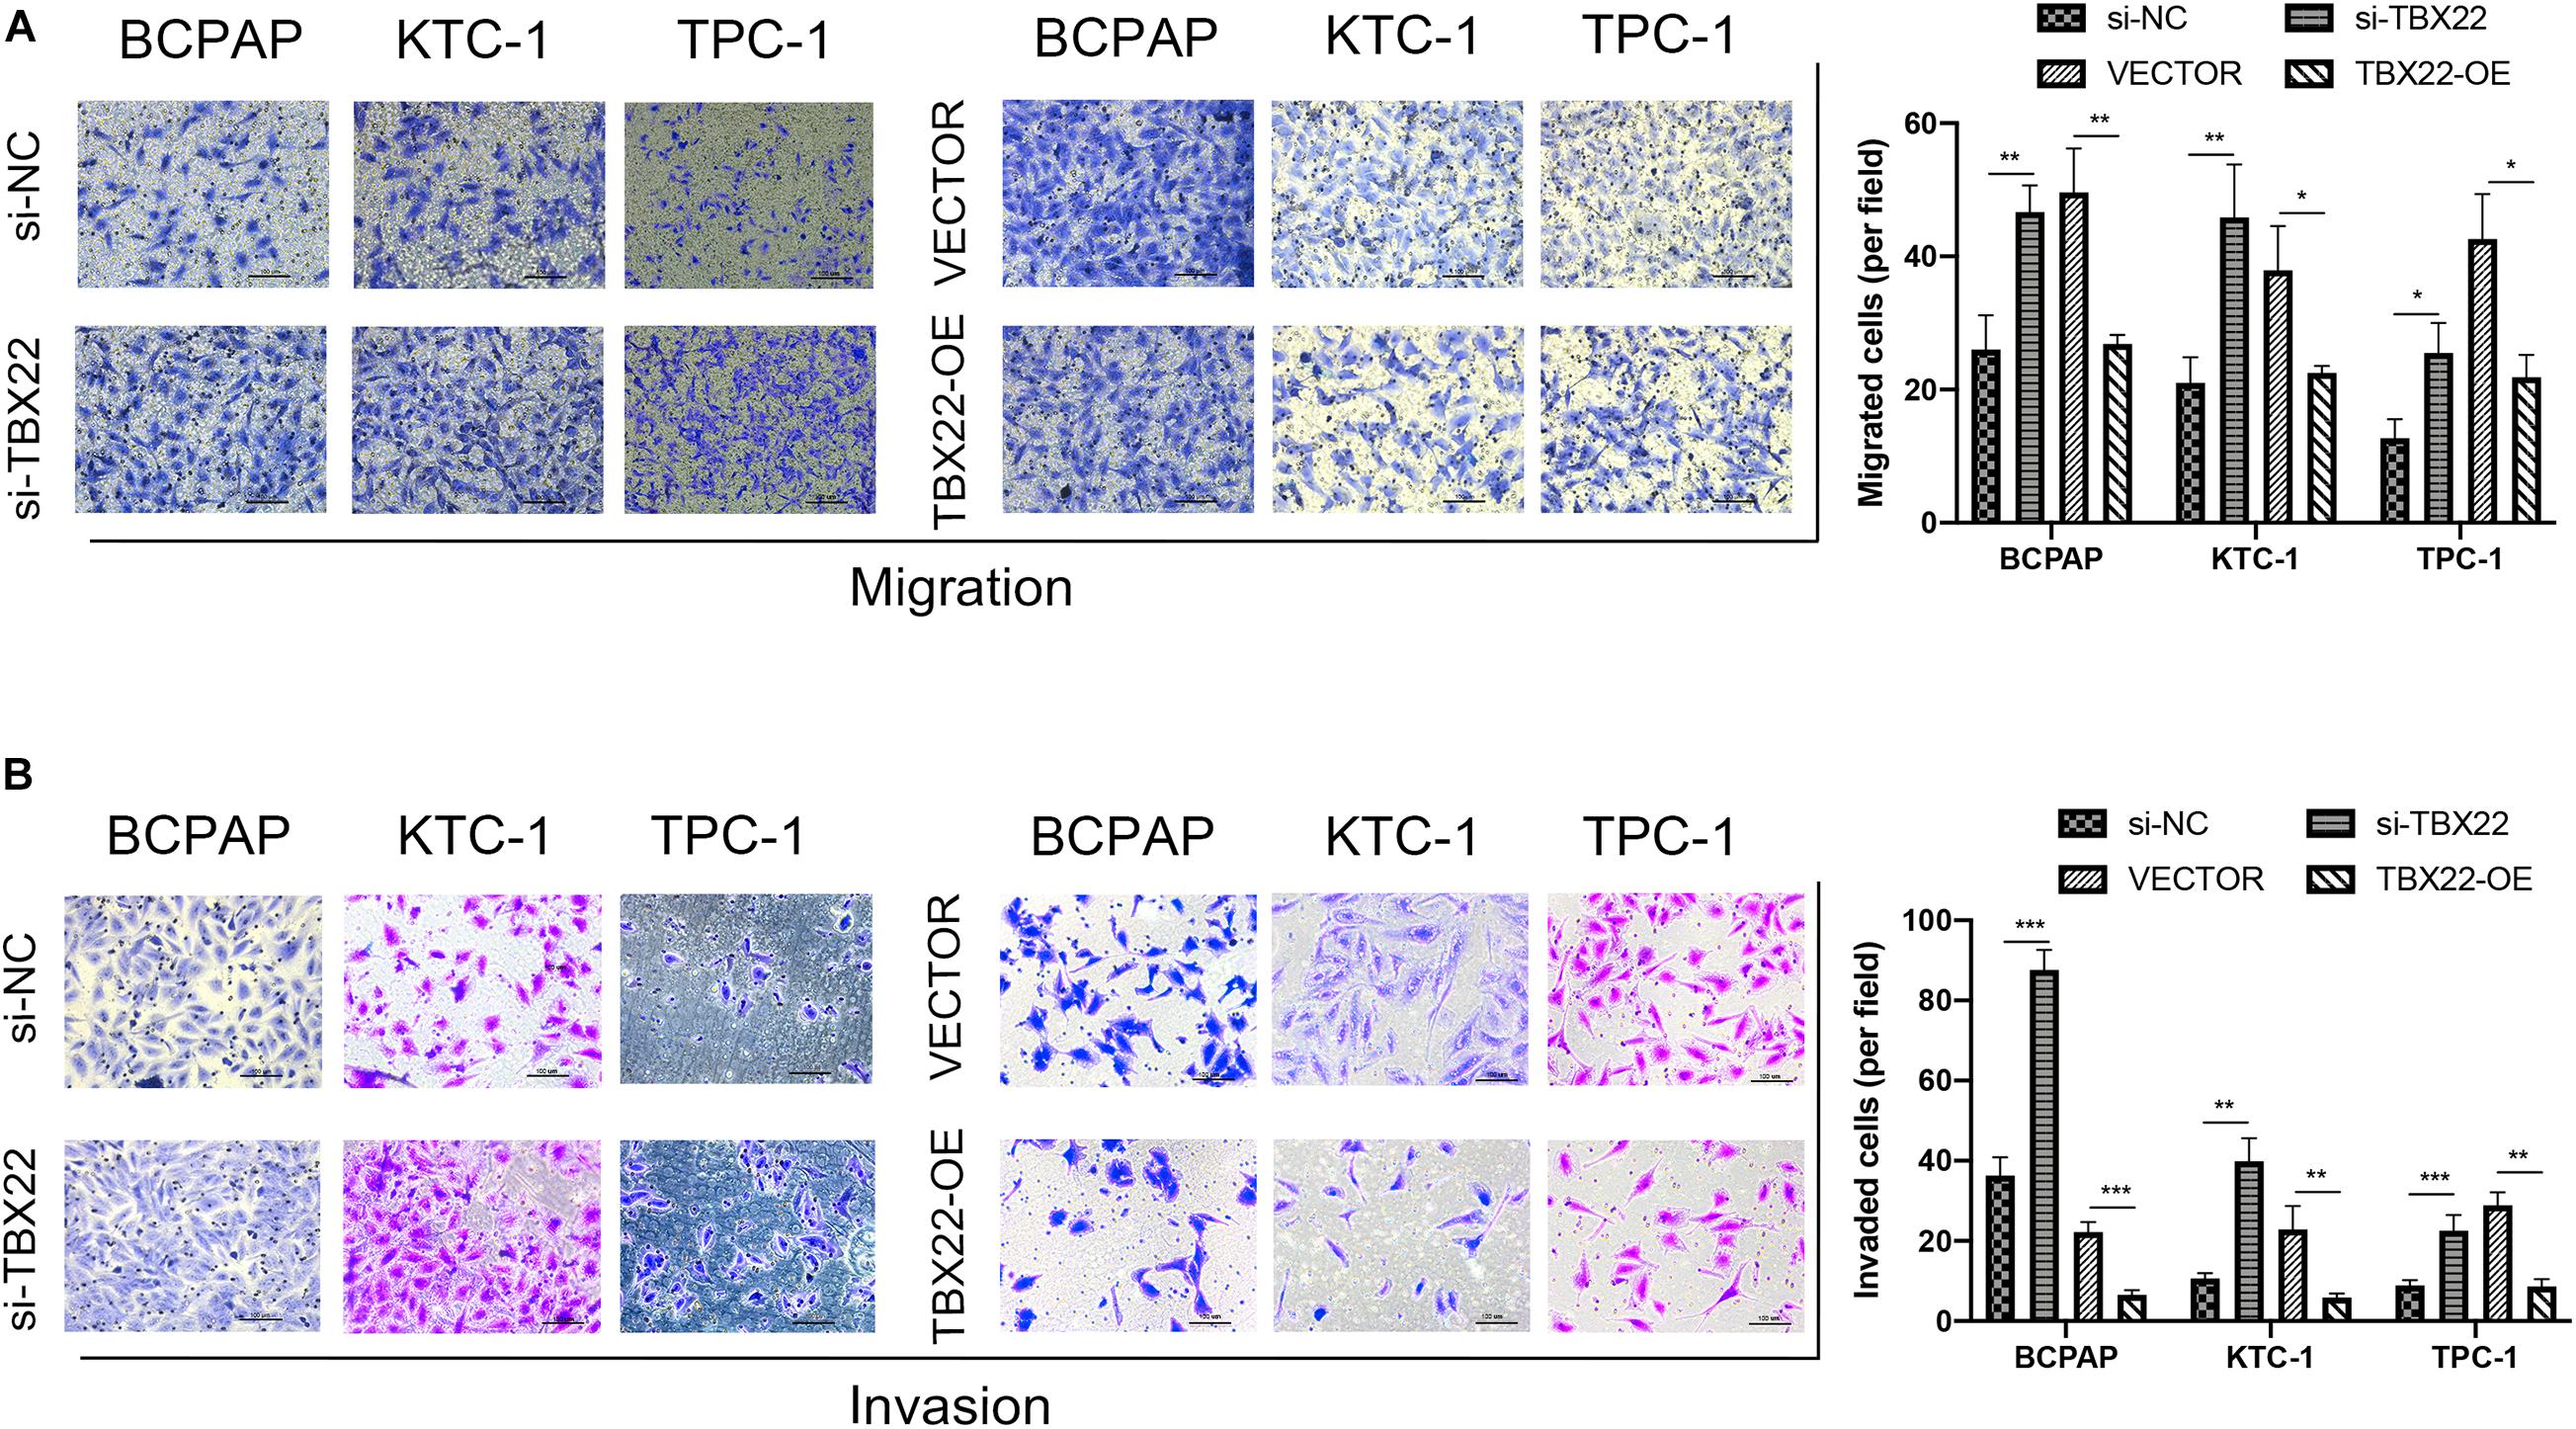
Figure 10. TBX22 inhibited the migration and invasion of PTC cell lines. (A,B) Loss-of-function and gain-of-function assays indicated that TBX22 reduced the (A) migration and (B) invasion abilities of PTC cell lines. *p < 0.05, **p < 0.01, ***p < 0.001 in comparison with the si-NC or VECTOR groups using Student’s t-test, and all assays were repeated at least three times.
With the treatment of surgery and hormone replacement treatment, most PTC patients have a favorable prognosis. However, radiotherapy and chemotherapy are the only options for the treatment of undifferentiated, recurrent, and metastatic disease, with a median survival of less than 6 months (Mould et al., 2017; Tirrò et al., 2019). Na and Choi (2018) illustrated the close association between immune TME and immunotherapeutic implications in PTC. Thus, it is necessary to reveal the effective molecular mechanism and identify immune-related biomarkers of PTC to guide a more optimized treatment strategy. Recently, accumulating studies show that certain T-box genes also play an important role in cancer progression. Upregulated TBX2 and TBX3 promoted tumorigenesis and progression of different types of cancer (Durbin et al., 2018; Crawford et al., 2019; Krstic et al., 2019). In contrast, a recent study revealed that TBX1 functions as a tumor suppressor in PTC (Wang et al., 2019). As a member of the T-box transcription factor gene family, TBX22 participated in the development of non-syndromic cleft palate and was reported to be associated with the risk of hypodontia (Braybrook et al., 2001; Kantaputra et al., 2011). To the best of our knowledge, this is the first research to provide new insights into dissecting the clinical value and potential biological roles of TBX22 in PTC.
In the present study, we demonstrated that TBX22 was significantly downregulated in PTC tissues compared with normal thyroid tissues in four public datasets, which contained more than 650 PTC patients. We then examined the TBX22 mRNA level by our own RT-qPCR profiles as a validated cohort, including 79 matched PTC and adjacent normal tissues. PTC patients with high tumor stage or poor differentiation still have a certain rate of metastasis and mortality with the worse outcomes (Farahati et al., 2004). We also found that TBX22 expression was negatively associated with advanced clinicopathological characteristics, including larger tumor size, LNM, higher disease stage, and extrathyroidal extension. It reflected that TBX22 might be associated with the progression of PTC through TCGA analysis. As a validation, we found that TBX22 was also associated with tumor size and LNM in our local cohort. Using the ROC analysis, TBX22 level can perfectly predict PTC and normal thyroid tissue types in the four publicly available datasets and our local cohort (all AUC > 0.91). Besides, TBX22 can also predict T stage and LNM status in the TCGA and local cohorts. All these results indicate that TBX22 is a potential biomarker in PTC.
In addition to the traditional clinicopathological risk factors, specific molecular profiles (e.g., BRAF, TERT, and RET) may be used to predict the risk of extrathyroidal extension and lymph node metastases (Xing et al., 2005; Lee et al., 2007; Kim et al., 2012). The relative simplicity of the PTC genome with dominant mutually exclusive driving events enabled previous researches to clearly dissect the fundamental difference in genomic, epigenomic, and proteomic profiles between BVL and RL. In a previous multivariate analysis, the only clinicopathologically significant predictor of persistent disease after 5 years of follow-up was the presence of mutated BRAFV600E (Elisei et al., 2012). We observed that the TBX22 expression is much lower in BRAFV600E mutated, RAS wild-type, and BVL phenotypes. TBX22 can predict BRAFV600E mutated status in the TCGA and local cohorts using ROC curves. TERT mutation had a significantly higher prevalence in aggressive thyroid cancer and served as an independent predictor of persistent disease and mortality for differentiated thyroid cancer. RET fusions commonly had BVL phenotype and upregulated MAPK activity. In this study, we found that TBX22 expression was significantly lower in TERT mutation and RET wild-type groups. VEGF is a potent stimulator of endothelial cell proliferation, which may help predict the presence of metastases. In a retrospective study of 19 patients with PTC, Klein et al. (2001) had shown that a high level of VEGF correlated with a high risk of metastatic disease. RNA-seq profile from the database showed that TBX22 had a strong positive correlation to VEGF expression. TMB is a novel emerging indicator of immunotherapy and reflects the total mutation index of tumor samples (Chalmers et al., 2017). Tumors with a higher mutation burden are hypothesized to have more opportunities to produce neoantigens that can be recognized by the immune system (Chan et al., 2019). MSI has been found in many diverse cancer types, including colorectal, endometrial, gastric, prostate, and thyroid cancer (Hause et al., 2016; Genutis et al., 2019). Previous studies showed that MSI-high tumors tend to be poorly differentiated and have an expansile growth pattern, histological heterogeneity, and increased tumor-infiltrating lymphocytes (Zheng et al., 2020). Interestingly, we observed a weak correlation between TBX22 and the status of TMB and MSI in PTC samples. These features are well-known molecular characteristics that affect the prognosis of patients. However, although a number of molecular characteristics were identified to be associated with TBX22 expression, we found that TBX22 is not an independent prognostic biomarker in PTC. This may be due to the good prognosis of most PTC patients, leading to a small incidence of DFI and PFI events. These lines of evidence imply that TBX22 may participate in the regulation of PTC tumorigenesis and progression.
To functionally interpret TBX22 in the PTC, we investigated possible mechanisms by which TBX22 affects PTC outcomes from transcriptomic aspects. Co-expressed genes usually act synergistically in biological processes under strict regulatory control, thus having an advantage in adaptive evolution (Niehrs and Pollet, 1999). TBX22low status was associated with advanced clinical, pathological, and molecular features. TBX22 expression was also associated with the enrichment of gene sets related to the MAPK pathway and thyroid hormone metabolism. More importantly, other than cancer signaling pathways, immune processes such as IL-2 and IL-6 signaling pathways, INF-α and INF-γ response, and complement activity were dominantly associated with TBX22low status (14 terms were significant GSEA results, 13 were immune- or cancer-related processes). A deeper analysis of the complexity within TME may promote identifying patient populations for neoadjuvant treatment targets (Lin et al., 2019). Here, we explored the relationship between TME score with TBX22 expression based on two different computational algorithms. Our study identified that TBX22 expression was negatively associated with immune scores but not significant with stromal scores. Based on the functional enrichment analysis of TBX22 and its correlation with TIME above, we hypothesized that TBX22 was associated with immune cell component in the PTC microenvironment.
The deconvolution technique has been proven to be useful in the decomposition of heterogeneous cellular admixture of TME (Gentles et al., 2015; Orhan et al., 2020). As there is no gold standard for inferring immune infiltrate from the RNA-seq profile, we chose ssGSEA-based ImmuCellAI and deconvolution-based quanTIseq algorithms in inferring the composition of TIICs. Cunha et al. (2012, 2015) demonstrated that a higher CD8+ T-cell infiltration level was related to better disease-free survival rate and increased risk of relapse of PTC. A previous study indicated that tumors with high CD8+ T cells are more likely to respond to immunotherapy than the low CD8+ T-cell tumors (Farhood et al., 2019). Furthermore, an increase in anticancer CD8+ T, Tfh, and Th1 cells and M1 macrophages and a decrease in procancer M2 macrophages were associated with TBX22low in PTC. In addition, we also found that the distribution of CD4+ T cells was accordantly lower in the TBX22low group. We noticed that the infiltration levels of procancerous CD4+ T and Tregs cells in TBX22low samples were higher, and procancerous Th2 cells had an elevated activity score in cancer immune cycle in TBX22low samples, which may lead to the cancer-promoting phenotype corresponding to TBX22low status (Hadrup et al., 2013; Tanaka and Sakaguchi, 2017; Wu et al., 2017).
The main goal of immunotherapy is to trigger the cancer immunity cycle without damaging normal cells. Based on this consideration, many current immunotherapeutic agents like CTLA-4 and PD-L1 inhibitors target steps in the cancer immunity cycle (Chen and Mellman, 2017). Patients who have lower TBX22 expression showed higher anticancer immunity scores in different steps of the cancer immunity cycle. We found that lower TBX22 expression led to more recruitment of anticancer CD8+ T cells, Th1, Tregs, and NK cells, which conform to the results of TIME alteration. Besides, we found that TBX22low did appear to be associated with a favorable TIME in PTC. These results support that TBX22 may manipulate the activity of the cancer immunity cycle.
TIICs in the TME may affect tumor cell proliferation, metastasis, and therapy resistance (Gocheva et al., 2010; Joyce and Fearon, 2015). However, there has been no experimental study to elucidate the functional effects of TBX22 dysregulation in PTC models. Transfection efficiency and background expression of the TBX22 in different PTC cell lines were considered. The significance of TBX22 is demonstrated through loss-of-function, which increased the proliferation, migration, and invasion ability of PTC cells. Conversely, the gain-of-function addition of TBX22 to PTC cells demonstrated attenuated proliferation, migration, and invasion. Together, these findings suggest that TBX22 exerts a considerable tumor-suppressor effect in PTC.
The current study has several limitations. Firstly, more local tumor samples are needed to verify the relationship between TBX22 and the clinical characteristics and confirm its predictive performance as a biomarker in PTC. Secondly, most of the existing TME computational methods are limited to only a single omics layer, which may not be enough to detect particular biological processes. It is necessary to quantify the particular biological processes and TME heterogeneity by multidimensional omics data. Thirdly, our research revealed a markedly close interaction between TBX22 and anticancer immunity, as well as tumorigenesis and progression in PTC. However, the underlying TBX22-related mechanisms in PTC are yet to be fully elucidated. Constructing in vivo models to explore the potential biological mechanisms of TBX22 is the direction of future research. Lastly, the potential cross talk between the BRAFV600E mutation and TIME alteration in TBX22-induced PTC progression requires further exploration.
The involvement of TBX22 in PTC appears to be highly complex. Our study is the first to identify the expression level and the relationship with the clinicopathological and molecular features, tumor-infiltrating, cancer immunity cycle, and functional effects of TBX22 in PTC. The present study sheds light to conduct further TBX22-associated research to assess its efficacy and receptiveness in PTC treatment.
The original contributions generated for this study are included in the article/Supplementary Material, further inquiries can be directed to the corresponding auth or/s.
All research protocols have been approved and implemented through the ethical standards of the institutional review board of the First Affiliated Hospital of Wenzhou Medical University (Approval No. 2012-57). The patients/participants provided their written informed consent to participate in this study.
XD and JS contributed to study design, bioinformatic analysis, and manuscript draft. JH and CZ contributed to sample preparation and molecular biology experiments. XZ and HL contributed to the revision of the manuscript. All authors read and approved the final manuscript.
This study was supported by the Major Science and Technology Projects of Zhejiang Province (2015C03052).
The authors declare that the research was conducted in the absence of any commercial or financial relationships that could be construed as a potential conflict of interest.
The authors would like to thank the investigators and staff who contributed to this study.
The Supplementary Material for this article can be found online at: https://www.frontiersin.org/articles/10.3389/fcell.2020.590898/full#supplementary-material
Supplementary Table 1 | Univariate Cox regression of clinical and pathological factors in PTC patients.
Supplementary Table 2 | TBX22 co-expressed genes detailed results.
Supplementary Table 3 | GO enrichment detailed results.
Supplementary Table 4 | KEGG enrichment detailed results.
Supplementary Table 5 | GSEA enrichment detailed results.
PTC, papillary thyroid cancer; TBX22, T-box transcription factor 22; BVL, BRAFV600E-like; RL, RAS-like; CTLA-4, cytotoxic T lymphocyte-associated antigen 4; TME, tumor microenvironment; TIICs, tumor-infiltrating immune cells; TIME, tumor immune microenvironment; DFI, disease-free interval; PFI, progression-free interval; TMB, tumor mutation burden; MSI, microsatellite instability; GO, Gene Ontology; KEGG, Kyoto Encyclopedia of Genes and Genomes; GSEA, gene set enrichment analysis; TIP, tumor immunophenotype; MAPK, mitogen-activated protein kinase; ssGSEA, single-sample gene set enrichment analysis; PCR, polymerase chain reaction; NC, negative control; CCK-8, Cell Counting Kit-8; OD, optical density; ANOVA, analysis of variance; ROC, receiver-operating characteristic; LNM, lymph node metastasis; VEGFA, vascular endothelial growth factor A; AUC, area under the curve; RSEM, RNA-seq by expectation-maximization; Tc, cytotoxic T cells; Tem, central memory T cells; Tex, exhausted T cells; Tfh, follicular helper T cells; MAIT, mucosal-associated invariant T cells; NK, natural killer cells; MDSC, myeloid-derived suppressor cells.
Agrawal, N., Akbani, R., Aksoy, B. A., Ally, A., Arachchi, H., Asa, S. L., et al. (2014). Integrated genomic characterization of papillary thyroid carcinoma. Cell 159, 676–690.
Asioli, S., Erickson, L. A., Sebo, T. J., Zhang, J., Jin, L., Thompson, G. B., et al. (2010). Papillary thyroid carcinoma with prominent hobnail features: a new aggressive variant of moderately differentiated papillary carcinoma. A clinicopathologic, immunohistochemical, and molecular study of eight cases. Am. J. Surg. Pathol. 34, 44–52. doi: 10.1097/pas.0b013e3181c46677
Bonneville, R., Krook, M. A., Kautto, E. A., Miya, J., Wing, M. R., Chen, H.-Z., et al. (2017). Landscape of microsatellite instability across 39 cancer types. JCO Precis Oncol. 2017:PO.17.00073. doi: 10.1200/PO.17.00073
Braybrook, C., Doudney, K., Marçano, A. C. B., Arnason, A., Bjornsson, A., Patton, M. A., et al. (2001). The T-box transcription factor gene TBX22 is mutated in X-linked cleft palate and ankyloglossia. Nat. Genet. 29, 179–183. doi: 10.1038/ng730
Cancer Genome Atlas Research Network (2014). Integrated genomic characterization of papillary thyroid carcinoma. Cell 159, 676–690. doi: 10.1016/j.cell.2014.09.050
Chalmers, Z. R., Connelly, C. F., Fabrizio, D., Gay, L., Ali, S. M., Ennis, R., et al. (2017). Analysis of 100,000 human cancer genomes reveals the landscape of tumor mutational burden. Genome Med. 9:34.
Chan, T. A., Yarchoan, M., Jaffee, E., Swanton, C., Quezada, S. A., Stenzinger, A., et al. (2019). Development of tumor mutation burden as an immunotherapy biomarker: utility for the oncology clinic. Ann. Oncol. 30, 44–56. doi: 10.1093/annonc/mdy495
Chen, D. S., and Mellman, I. (2013). Oncology meets immunology: the cancer-immunity cycle. Immunity 39, 1–10. doi: 10.1016/j.immuni.2013.07.012
Chen, D. S., and Mellman, I. (2017). Elements of cancer immunity and the cancer–immune set point. Nature 541, 321–330. doi: 10.1038/nature21349
Cheng, H. S., Lee, J. X. T., Wahli, W., and Tan, N. S. (2019). Exploiting vulnerabilities of cancer by targeting nuclear receptors of stromal cells in tumor microenvironment. Mol. Cancer 18:51.
Crawford, N., McIntyre, A., McCormick, A., D’Costa, Z., Buckley, N., and Mullan, P. (2019). TBX2 interacts with heterochromatin protein 1 to recruit a novel repression complex to EGR1-targeted promoters to drive the proliferation of breast cancer cells. Oncogene 38, 5971–5986. doi: 10.1038/s41388-019-0853-z
Cunha, L. L., Marcello, M. A., Nonogaki, S., Morari, E. C., Soares, F. A., Vassallo, J., et al. (2015). CD 8+ tumour-infiltrating lymphocytes and COX2 expression may predict relapse in differentiated thyroid cancer. Clin. Endocrinol. 83, 246–253. doi: 10.1111/cen.12586
Cunha, L. L., Morari, E. C., Guihen, A. C., Razolli, D., Gerhard, R., Nonogaki, S., et al. (2012). Infiltration of a mixture of immune cells may be related to good prognosis in patients with differentiated thyroid carcinoma. Clin. Endocrinol. 77, 918–925. doi: 10.1111/j.1365-2265.2012.04482.x
Deschoolmeester, V., Baay, M., Van Marck, E., Weyler, J., Vermeulen, P., Lardon, F., et al. (2010). Tumor infiltrating lymphocytes: an intriguing player in the survival of colorectal cancer patients. BMC Immunol. 11:19. doi: 10.1186/1471-2172-11-19
Dom, G., Tarabichi, M., Unger, K., Thomas, G., Oczko-Wojciechowska, M., Bogdanova, T., et al. (2012). A gene expression signature distinguishes normal tissues of sporadic and radiation-induced papillary thyroid carcinomas. Br. J. Cancer 107, 994–1000. doi: 10.1038/bjc.2012.302
Dong, X., Gu, D.-N., Wang, O., and Ye, Z. (2020a). LAGE3 correlates with tumorigenic immune infiltrates in the clear cell renal cell carcinoma microenvironment. Int. Immunopharmacol. 87:106793. doi: 10.1016/j.intimp.2020.106793
Dong, X., Lv, S., Zhang, X., and Hao, R. (2020b). Upregulation of LAGE3 correlates with prognosis and immune infiltrates in colorectal cancer: a bioinformatic analysis. Int. Immunopharmacol. 85:106599. doi: 10.1016/j.intimp.2020.106599
Durbin, A. D., Zimmerman, M. W., Dharia, N. V., Abraham, B. J., Iniguez, A. B., Weichert-Leahey, N., et al. (2018). Selective gene dependencies in MYCN-amplified neuroblastoma include the core transcriptional regulatory circuitry. Nat. Genet. 50, 1240–1246. doi: 10.1038/s41588-018-0191-z
Elisei, R., Viola, D., Torregrossa, L., Giannini, R., Romei, C., Ugolini, C., et al. (2012). The BRAF V600E mutation is an independent, poor prognostic factor for the outcome of patients with low-risk intrathyroid papillary thyroid carcinoma: single-institution results from a large cohort study. J. Clin. Endocrinol. Metabol. 97, 4390–4398. doi: 10.1210/jc.2012-1775
Emens, L. A., Ascierto, P. A., Darcy, P. K., Demaria, S., Eggermont, A. M., Redmond, W. L., et al. (2017). Cancer immunotherapy: opportunities and challenges in the rapidly evolving clinical landscape. Eur. J. Cancer 81, 116–129. doi: 10.1016/j.ejca.2017.01.035
Farahati, J., Geling, M., Mäder, U., Mörtl, M., Luster, M., Müller, J. G., et al. (2004). Changing trends of incidence and prognosis of thyroid carcinoma in lower Franconia, Germany, from 1981–1995. Thyroid 14, 141–147.
Farhood, B., Najafi, M., and Mortezaee, K. (2019). CD8+ cytotoxic T lymphocytes in cancer immunotherapy: a review. J Cell. Physiol. 234, 8509–8521. doi: 10.1002/jcp.27782
Finotello, F., Mayer, C., Plattner, C., Laschober, G., Rieder, D., Hackl, H., et al. (2019). Molecular and pharmacological modulators of the tumor immune contexture revealed by deconvolution of RNA-seq data. Genome Med. 11:34.
Gentles, A. J., Newman, A. M., Liu, C. L., Bratman, S. V., Feng, W., Kim, D., et al. (2015). The prognostic landscape of genes and infiltrating immune cells across human cancers. Nat. Med. 21, 938–945. doi: 10.1038/nm.3909
Genutis, L. K., Tomsic, J., Bundschuh, R. A., Brock, P. L., Williams, M. D., Roychowdhury, S., et al. (2019). Microsatellite instability occurs in a subset of follicular thyroid cancers. Thyroid 29, 523–529. doi: 10.1089/thy.2018.0655
Ghossein, R., and Livolsi, V. A. (2008). Papillary thyroid carcinoma tall cell variant. Thyroid 18, 1179–1181. doi: 10.1089/thy.2008.0164
Ghossein, R. A., Leboeuf, R., Patel, K. N., Rivera, M., Katabi, N., Carlson, D. L., et al. (2007). Tall cell variant of papillary thyroid carcinoma without extrathyroid extension: biologic behavior and clinical implications. Thyroid 17, 655–661. doi: 10.1089/thy.2007.0061
Gocheva, V., Wang, H.-W., Gadea, B. B., Shree, T., Hunter, K. E., Garfall, A. L., et al. (2010). IL-4 induces cathepsin protease activity in tumor-associated macrophages to promote cancer growth and invasion. Genes Dev. 24, 241–255. doi: 10.1101/gad.1874010
Guzman, C., Bagga, M., Kaur, A., Westermarck, J., and Abankwa, D. (2014). ColonyArea: an ImageJ plugin to automatically quantify colony formation in clonogenic assays. PLoS One 9:e92444. doi: 10.1371/journal.pone.0092444
Hadrup, S., Donia, M., and Thor Straten, P. (2013). Effector CD4 and CD8 T cells and their role in the tumor microenvironment. Cancer Microenviron. 6, 123–133. doi: 10.1007/s12307-012-0127-6
Handkiewicz-Junak, D., Swierniak, M., Rusinek, D., Oczko-Wojciechowska, M., Dom, G., Maenhaut, C., et al. (2016). Gene signature of the post-Chernobyl papillary thyroid cancer. Eur. J. Nucl. Med. Mol. Imaging 43, 1267–1277.
Hause, R. J., Pritchard, C. C., Shendure, J., and Salipante, S. J. (2016). Classification and characterization of microsatellite instability across 18 cancer types. Nat. Med. 22, 1342–1350. doi: 10.1038/nm.4191
James, B. C., Mitchell, J. M., Jeon, H. D., Vasilottos, N., Grogan, R. H., and Aschebrook-Kilfoy, B. (2018). An update in international trends in incidence rates of thyroid cancer, 1973–2007. Cancer Causes Control 29, 465–473. doi: 10.1007/s10552-018-1023-2
Jia, Z., Liu, Y., Guan, N., Bo, X., Luo, Z., and Barnes, M. R. (2016). Cogena, a novel tool for co-expressed gene-set enrichment analysis, applied to drug repositioning and drug mode of action discovery. BMC Genomics 17:414. doi: 10.1186/s12864-016-2737-8
Johnson, T. L., Lloyd, R. V., Thompson, N. W., Beierwaltes, W. H., and Sisson, J. C. (1988). Prognostic implications of the tall cell variant of papillary thyroid carcinoma. Am. J. Surg. Pathol. 12, 22–27.
Joyce, J. A., and Fearon, D. T. (2015). T cell exclusion, immune privilege, and the tumor microenvironment. Science 348, 74–80. doi: 10.1126/science.aaa6204
Kantaputra, P., Paramee, M., Kaewkhampa, A., Hoshino, A., Lees, M., McEntagart, M., et al. (2011). Cleft lip with cleft palate, ankyloglossia, and hypodontia are associated with TBX22 mutations. J. Dent. Res. 90, 450–455. doi: 10.1177/0022034510391052
Kim, T. H., Park, Y. J., Lim, J. A., Ahn, H. Y., Lee, E. K., Lee, Y. J., et al. (2012). The association of the BRAFV600E mutation with prognostic factors and poor clinical outcome in papillary thyroid cancer: a meta-analysis. Cancer 118, 1764–1773. doi: 10.1002/cncr.26500
Klein, M., Vignaud, J.-M., Hennequin, V., Toussaint, B., Bresler, L., Plenat, F., et al. (2001). Increased expression of the vascular endothelial growth factor is a pejorative prognosis marker in papillary thyroid carcinoma. J. Clin. Endocrinol. Metab. 86, 656–658. doi: 10.1210/jcem.86.2.7226
Krstic, M., Kolendowski, B., Cecchini, M. J., Postenka, C. O., Hassan, H. M., Andrews, J., et al. (2019). TBX3 promotes progression of pre-invasive breast cancer cells by inducing EMT and directly up-regulating SLUG. J. Pathol. 248, 191–203. doi: 10.1002/path.5245
Landa, I., Ganly, I., Chan, T. A., Mitsutake, N., Matsuse, M., Ibrahimpasic, T., et al. (2013). Frequent somatic TERT promoter mutations in thyroid cancer: higher prevalence in advanced forms of the disease. J. Clin. Endocrinol. Metab. 98, E1562–E1566.
Landa, I., Ibrahimpasic, T., Boucai, L., Sinha, R., Knauf, J. A., Shah, R. H., et al. (2016). Genomic and transcriptomic hallmarks of poorly differentiated and anaplastic thyroid cancers. J. Clin. Invest. 126, 1052–1066. doi: 10.1172/jci85271
Landa, I., Pozdeyev, N., Korch, C., Marlow, L. A., Smallridge, R. C., Copland, J. A., et al. (2019). Comprehensive genetic characterization of human thyroid cancer cell lines: a validated panel for preclinical studies. Clin. Cancer Res. 25, 3141–3151. doi: 10.1158/1078-0432.ccr-18-2953
Lee, J. H., Lee, E. S., and Kim, Y. S. (2007). Clinicopathologic significance of BRAF V600E mutation in papillary carcinomas of the thyroid: a meta-analysis. Cancer 110, 38–46. doi: 10.1002/cncr.22754
Lin, P., Guo Y-n, Shi, L., Li, X.-J., Yang, H., He, Y., et al. (2019). Development of a prognostic index based on an immunogenomic landscape analysis of papillary thyroid cancer. Aging 11:480. doi: 10.18632/aging.101754
Liu, J., Lichtenberg, T., Hoadley, K. A., Poisson, L. M., Lazar, A. J., Cherniack, A. D., et al. (2018). An integrated TCGA pan-cancer clinical data resource to drive high-quality survival outcome analytics. Cell 173, 400.e11–416.e11.
Mao, Y., Keller, E. T., Garfield, D. H., Shen, K., and Wang, J. (2013). Stromal cells in tumor microenvironment and breast cancer. Cancer Metastasis Rev. 32, 303–315.
Meireles, A. M., Preto, A., Rocha, A. S., Rebocho, A. P., Máximo, V., Pereira-Castro, I., et al. (2007). Molecular and genotypic characterization of human thyroid follicular cell carcinoma–derived cell lines. Thyroid 17, 707–715. doi: 10.1089/thy.2007.0097
Miao, Y. R., Zhang, Q., Lei, Q., Luo, M., Xie, G. Y., Wang, H., et al. (2020). ImmuCellAI: a unique method for comprehensive T-cell subsets abundance prediction and its application in cancer immunotherapy. Adv. Sci. 7:19 02880.
Miller, S. A., Mohn, S. E., and Weinmann, A. S. (2010). Jmjd3 and UTX play a demethylase-independent role in chromatin remodeling to regulate T-box family member-dependent gene expression. Mol. Cell 40, 594–605.
Mould, R. C., van Vloten, J. P., AuYeung, A. W., Karimi, K., and Bridle, B. W. (2017). Immune responses in the thyroid cancer microenvironment: making immunotherapy a possible mission. Endocr. Relat. Cancer 24, T311–T329.
Na, K. J., and Choi, H. (2018). Immune landscape of papillary thyroid cancer and immunotherapeutic implications. Endocr. Relat. Cancer 25, 523–531.
Orhan, A., Vogelsang, R. P., Andersen, M. B., Madsen, M. T., Hölmich, E. R., Raskov, H., et al. (2020). The prognostic value of tumour-infiltrating lymphocytes in pancreatic cancer: a systematic review and meta-analysis. Eur. J. Cancer 132, 71–84. doi: 10.1016/j.ejca.2020.03.013
Papaioannou, V. E. (2014). The T-box gene family: emerging roles in development, stem cells and cancer. Development 141, 3819–3833.
Randolph, G. W., Duh, Q.-Y., Heller, K. S., LiVolsi, V. A., Mandel, S. J., Steward, D. L., et al. (2012). The prognostic significance of nodal metastases from papillary thyroid carcinoma can be stratified based on the size and number of metastatic lymph nodes, as well as the presence of extranodal extension. Thyroid 22, 1144–1152.
Sebé-Pedrós, A., Ariza-Cosano, A., Weirauch, M. T., Leininger, S., Yang, A., Torruella, G., et al. (2013). Early evolution of the T-box transcription factor family. Proc. Natl. Acad. Sci. U.S.A. 110, 16050–16055.
Subramanian, A., Tamayo, P., Mootha, V. K., Mukherjee, S., Ebert, B. L., Gillette, M. A., et al. (2005). Gene set enrichment analysis: a knowledge-based approach for interpreting genome-wide expression profiles. Proc. Natl. Acad. Sci. U.S.A. 102, 15545–15550.
Tanaka, A., and Sakaguchi, S. (2017). Regulatory T cells in cancer immunotherapy. Cell Res. 27, 109–118.
Tarabichi, M., Saiselet, M., Trésallet, C., Hoang, C., Larsimont, D., Andry, G., et al. (2015). Revisiting the transcriptional analysis of primary tumours and associated nodal metastases with enhanced biological and statistical controls: application to thyroid cancer. Br. J. Cancer 112, 1665–1674. doi: 10.1038/bjc.2014.665
Tirrò, E., Martorana, F., Romano, C., Vitale, S. R., Motta, G., Di Gregorio, S., et al. (2019). Molecular alterations in thyroid cancer: from bench to clinical practice. Genes 10:709.
Wang, N., Li, Y., Wei, J., Pu, J., Liu, R., Yang, Q., et al. (2019). TBX1 functions as a tumor suppressor in thyroid cancer through inhibiting the activities of the PI3K/AKT and MAPK/ERK pathways. Thyroid 29, 378–394.
Wu, Y., Yan, Y., Su, Z., Bie, Q., Chen, X., Barnie, P. A., et al. (2017). Enhanced circulating ILC2s and MDSCs may contribute to ensure maintenance of Th2 predominant in patients with lung cancer. Mol. Med. Rep. 15, 4374– 4381.
Xing, M., Westra, W. H., Tufano, R. P., Cohen, Y., Rosenbaum, E., Rhoden, K. J., et al. (2005). BRAF mutation predicts a poorer clinical prognosis for papillary thyroid cancer. J. Clin. Endocrinol. Metab. 90, 6373–6379.
Xu, L., Deng, C., Pang, B., Zhang, X., Liu, W., Liao, G., et al. (2018). TIP: a web server for resolving tumor immunophenotype profiling. Cancer Res. 78, 6575–6580. doi: 10.1158/0008-5472.Can-18-0689
Yoo, S.-K., Lee, S., Kim, S.-J., Jee, H.-G., Kim, B.-A., Cho, H., et al. (2016). Comprehensive analysis of the transcriptional and mutational landscape of follicular and papillary thyroid cancers. PLoS Genet. 12:e1006239. doi: 10.1371/journal.pgen.1006239
Yoshihara, K., Shahmoradgoli, M., Martínez, E., Vegesna, R., Kim, H., Torres-Garcia, W., et al. (2013). Inferring tumour purity and stromal and immune cell admixture from expression data. Nat. Commun. 4:2612.
Yu, K., Ganesan, K., Tan, L. K., Laban, M., Wu, J., Zhao, X. D., et al. (2008). A precisely regulated gene expression cassette potently modulates metastasis and survival in multiple solid cancers. PLoS Genet. 4:e1000129. doi: 10.1371/journal.pgen.1000129
Keywords: TBX22, papillary thyroid cancer, biomarker, tumor microenvironment, BRAFV600E, RAS
Citation: Dong X, Song J, Hu J, Zheng C, Zhang X and Liu H (2020) T-Box Transcription Factor 22 Is an Immune Microenvironment-Related Biomarker Associated With the BRAFV600E Mutation in Papillary Thyroid Carcinoma. Front. Cell Dev. Biol. 8:590898. doi: 10.3389/fcell.2020.590898
Received: 03 August 2020; Accepted: 24 November 2020;
Published: 17 December 2020.
Edited by:
Sergio Giannattasio, Consiglio Nazionale delle Ricerche, Istituto di Biomembrane, Bioenergetica e Biotecnologie Molecolari (IBIOM), ItalyReviewed by:
Monica Fedele, Consiglio Nazionale delle Ricerche (CNR), ItalyCopyright © 2020 Dong, Song, Hu, Zheng, Zhang and Liu. This is an open-access article distributed under the terms of the Creative Commons Attribution License (CC BY). The use, distribution or reproduction in other forums is permitted, provided the original author(s) and the copyright owner(s) are credited and that the original publication in this journal is cited, in accordance with accepted academic practice. No use, distribution or reproduction is permitted which does not comply with these terms.
*Correspondence: Xiaohua Zhang, cHJvZi56aGFuZy5vbmNvbG9neUBnbWFpbC5jb20=; Haiguang Liu, bGl1aGd3bXVAZ21haWwuY29t
†These authors have contributed equally to this work and share first authorship
Disclaimer: All claims expressed in this article are solely those of the authors and do not necessarily represent those of their affiliated organizations, or those of the publisher, the editors and the reviewers. Any product that may be evaluated in this article or claim that may be made by its manufacturer is not guaranteed or endorsed by the publisher.
Research integrity at Frontiers
Learn more about the work of our research integrity team to safeguard the quality of each article we publish.