
95% of researchers rate our articles as excellent or good
Learn more about the work of our research integrity team to safeguard the quality of each article we publish.
Find out more
ORIGINAL RESEARCH article
Front. Cell Dev. Biol. , 15 October 2020
Sec. Cell Death and Survival
Volume 8 - 2020 | https://doi.org/10.3389/fcell.2020.580848
This article is part of the Research Topic Deciphering Phagocyte Functions across Different Species View all 12 articles
Our knowledge of the intestinal immune system of fish is rather limited compared to mammals. Very little is known about the immune cells including the phagocytic cells in fish intestine. Hence, employing imaging flow cytometry and RNA sequencing, we studied adherent cells isolated from healthy Atlantic salmon. Phagocytic activity and selected gene expression of adherent cells from the distal intestine (adherent intestinal cells, or AIC) were compared with those from head kidney (adherent kidney cells, or AKC). Phagocytic activity of the two cell types was assessed based on the uptake of Escherichia coli BioParticlesTM. AIC showed phagocytic ability but the phagocytes were of different morphology compared to AKC. Transcriptomic analysis revealed that AIC expressed genes associated with macrophages, T cells, and endothelial cells. Heatmap analysis of selected genes indicated that the adherent cells from the two organs had apparently higher expression of macrophage-related genes. We believe that the adherent intestinal cells have phagocytic characteristics and high expression of genes commonly associated with macrophages. We envisage the possibilities for future studies on enriched populations of adherent intestinal cells.
Teleost fishes have both organized and diffuse lymphoid tissues. However, these tissues differ from those of mammals morphologically and functionally. Fish lack bone marrow and lymph nodes found in mammals. Therefore, they rely on thymus, (head) kidney and spleen as their key lymphoid organs. The head kidney (or anterior kidney), is the main source of cytokine-producing lymphoid cells (Geven and Klaren, 2017), macrophages, and plasma cells, which find their way to specific sites, including those in the intestine, to replenish tissue-resident cell populations (Kratofil et al., 2017). Furthermore, the head kidney recruits specific cell types during disease conditions like inflammation (Parra et al., 2015). The head kidney is also a well-known primary B cell organ in fishes (Li et al., 2006; Parra et al., 2015). This makes the head kidney the main hematopoietic organ in teleost fish. In addition, fish possess mucosa-associated lymphoid tissues (MALTs), but these tissues are more diffuse compared to those in mammals (Parra et al., 2015). Among these MALTs, gut-associated lymphoid tissues (GALTs) contain two main populations of immune cells: (1) intraepithelial lymphocytes, which include mainly T cells located between the epithelial cells; and (2) lamina propria leukocytes, which are comprised of lymphocytes, macrophages, granulocytes and plasma cells (Rombout et al., 2011). In-depth knowledge of these immune cells present in GALT is necessary to understand the crosstalk between antigens and the epithelium as well as the immunological functions of both the key lymphoid organs and GALT. However, the lack of appropriate cell markers and complexity of isolation protocols are still hampering the progress of research on leukocyte cell populations in the fish intestine.
The most common practice is to collect adherent cells from specific organs in order to characterize them through further analysis. Cell adhesion refers to the ability of cells to adhere to other cells or extracellular matrix (Khalili and Ahmad, 2015). This process not only stimulates communication between cells but also helps to retain the tissue structure and functions (Khalili and Ahmad, 2015). The cells isolated from tissues or organs are mostly adherent types, and the known mammalian adherent cells are macrophages (Selvarajan et al., 2011), T cells (Bierer and Burakoff, 1988; Shimizu et al., 1991), endothelial cells (Braniste et al., 2016), epithelial cells (Kihara et al., 2018) and dendritic cells (DC, only upon antigen exposure) (Yi and Lu, 2012). Mammalian cell culture methods are frequently adopted to culture and study monocyte-derived macrophage-like cells from fish immunological tissues such as spleen (Iliev et al., 2013) and head kidney (Joerink et al., 2006; Iliev et al., 2019). However, our knowledge of the cell types including phagocytic cells that are involved in the fish intestinal immune response is rather limited compared to mammals.
As for the intestinal cells of fish, McMillan and Secombes (1997) were the first researchers to describe protocols to isolate them from rainbow trout, Oncorhynchus mykiss. After a decade, several research groups put in effort to effectively isolate and characterize intestinal immune cells from different fish species such as rainbow trout (Bernard et al., 2006), gilthead seabream, Sparus aurata (Salinas et al., 2007) and Atlantic salmon, Salmo salar (Attaya et al., 2018). Although there is ample information about the adherent cells from the head kidney in teleost fishes, knowledge about the intestinal cells has to be gathered by employing next generation techniques.
Therefore, this study investigated the adherent cells isolated from the distal intestine by employing the cells from the head kidney of Atlantic salmon as reference. We adopted two high-throughput techniques, imaging flow cytometry (IFC) and RNA sequencing. First, using IFC we explored the adherent cells from the aforementioned organs to decipher the characteristics of the populations and their phagocytic activity. Subsequently, a transcriptomic study was carried out to profile the expression of (1) cell type (macrophage, dendritic cell, endothelial cell, T and B cells)-related genes and (2) other immune genes (cytokines, chemokines, mucins and toll-like receptors) to delineate if the adherent cells expressed genes associated with phagocytes.
Atlantic salmon post smolts of about 70 g were purchased from a commercial producer (Sundsfjord Smolt, Nygårdsjøen, Norway) and maintained at the Research Station of Nord University, Bodø, Norway. Fish were fed a commercial feed (Ewos Micro, Ewos AS, Bergen, Norway) to satiation, and reared in a flow-through sea water system (temperature: 7–8°C, dissolved oxygen saturation: 87–92%, 24-h light cycle). Fish (of the weight range 510–590 g) was used in this study. The fish were starved for 24 h and were killed with an over dose of MS-222 (Tricaine methane sulfonate; Argent Chemical Laboratories, Redmond, United States; 80 mg/L). Head kidney (HK) and distal intestine (DI) samples were then collected.
Immune cells from the head kidney (HK) and distal intestine (DI) were isolated and grown at 12°C in Leibovitz’s L-15 Medium (L-15; Sigma-Aldrich, Oslo, Norway) as described previously by Park et al. (2020) and Salinas et al. (2007), respectively. The osmolality of cell culture media was adjusted to 380 mOsm by adding a solution consisting of 5% (v/v) 0.41 M NaCl, 0.33 M NaHCO3 and 0.66 (w/v) D-glucose (Sigma).
Briefly, HK from salmon (n = 6) were sampled and transferred to 15 mL centrifuge tubes to make a total volume of 4 mL in ice-cold L-15 + [L-15 medium with 50 U/mL penicillin (Sigma), 50 μg/mL streptomycin (Sigma), 2% fetal bovine serum (FBS; Sigma) and 10 U/mL heparin (Sigma)]. The tissues were passed through a sterile 100-μM cell strainer (Falcon, New York, United States) with ice-cold L-15 +. Thereafter, the cell suspensions were layered on 40%/60% Percoll (Sigma) to separate HK leukocytes and centrifuged at 500 × g for 30 min, at 4°C. Cells at the interface were collected and washed twice with ice-cold L-15-FBS free (L-15 medium with 50 U/mL penicillin, 50 μg/mL streptomycin) by centrifugation (500 × g, 5 min, 4°C).
For intestinal cell isolation, DI samples from salmon (n = 6) were transferred to a cell culture dish (Nunc EasyDish, Thermo Fisher Scientific, Oslo, Norway) with 2 mL ice-cold PBS. The tissues were cut open longitudinally and washed with ice-cold PBS to remove gut contents. After washing they were cut into small pieces (1–2 cm fragments) and transferred to 15 mL centrifuge tubes to make a total volume of 4 mL in DTT solution (0.145 mg/mL dithiothreitol + 0.37 mg/mL EDTA in Ca2+ and Mg2+ free HBSS, Sigma) at room temperature for 20 min to break disulfide bonds in the mucus. Next, the tissue fragments were washed with L-15 + supplemented with DNAse (0.05 mg/ml; Sigma) to prevent cell clumping and wash out excess DTT. Thereafter, the washed fragments were transferred to 15 mL centrifuge tubes to make a total volume of 6 mL in the digestive solution (0.37 mg/mL collagenase IV, Thermo Fisher Scientific). The centrifuge tubes were incubated in a shaking incubator (200 rpm) at RT for 60 min. The tissue fragments and supernatants were then passed through a sterile 100-μM cell strainer with ice-cold L-15 +, and the cell suspensions were layered on 25%/75% Percoll. The tubes containing the cells and Percoll were centrifuged at 500 × g for 30 min, at 4°C to separate DI leukocytes. Cells at the interface were collected and washed twice with ice-cold L-15-FBS free by centrifugation (500 × g, 5 min, 4°C).
Both HK and DI leukocytes (mentioned under flow cytometry studies) were allowed to adhere on a cell culture dish with 2 mL L-15 + for 2 days at 12°C. After collecting the supernatant containing non-adherent cells, the dish with the adherent cells was placed on ice for 10 min, and the cells were detached by washing three times with 1.5 mL ice-cold PBS supplemented with 5 mM EDTA. The cells obtained were centrifuged (500 × g, 5 min, 4°C) and re-suspended in 1 mL L-15 +. Then, the cells were counted using a portable cell counter (Scepter 2.0 cell counter, EMD Millipore, Darmstadt, Germany). To confirm the quality of the harvested cells, we observed the cells using a live cell imager (ZOE Fluorescent Cell imager, Bio-Rad, Oslo, Norway). With our improved protocols, we were able to harvest many cells with high viability. We checked the quality of the isolated cells by observing them through microscope and with the help of live/dead cell assays using propidium iodide.
To understand the cell populations and their functions we isolated and cultured cells from HK and DI. These cells were studied employing the ImageStream®X Mk II Imaging Flow Cytometer (Luminex Corporation, Austin, TX, United States) equipped with two argon-ion lasers (488 and 642 nm) and a side scatter laser (785 nm). The acquired cell data were analyzed using IDEAS 6.1.822.0 software (Luminex). All flow cytometry assays were performed as described previously (Park et al., 2020).
To study the cell populations − (i) whole leukocytes, (ii) supernatants and (iii) adherent cells − from three cell suspensions from HK or DI, aliquots containing > 5 × 10⁵ cells were washed with 500 μL PBS by centrifugation (500 × g, 5 min, 4°C) and resuspended in 50 μL PBS. Prior to loading the tubes containing the cells in the flow cytometer, 1 μL of propidium iodide (PI, 1 mg/mL, Sigma) was added to differentiate between the dead and live cells as well as to estimate the cell types based on the morphology of their nucleus. From each sample, more than 10,000 cell images were acquired using two lasers with optimized voltage levels, 488 nm (1 mW) and 785 nm (0.47 mW). Thereafter, using IDEAS software, dead cells were excluded based on PI positivity; both are shown in a brightfield (BF) area (cell size) vs. side scatter (SSC) intensity (cell granularity) plot.
To compare the phagocytic activity of whole leukocytes and adherent cells (i and iii mentioned under flow cytometry studies), aliquots containing 0.5 × 10⁵ cells in 100 μL L-15 + were incubated with fluorescent bio-particles (pHrodoTM Red Escherichia coli Bioparticles, Thermo Fisher Scientific), at a cell and particle ratio of 1:5 for 2 h at 12°C. After incubation, the cells were washed once with 500 μL PBS by centrifugation (500 × g, 5 min, 4°C) and resuspended in 50 μL PBS. Thereafter, the tubes containing cells were loaded in the flow cytometer and more than 10,000 cell images were acquired using two lasers with optimized voltage levels, 488 nm (50 mW) and 785 nm (0.47 mW). Data analyses were performed following our previous protocol (Park et al., 2020). Phagocytic ability was measured as the percent of phagocytic cells in total cells while phagocytic capacity was calculated as the mean number of particles in each phagocyte as described previously (Park et al., 2020).
The main aim of the RNA-Seq analysis was to obtain a snapshot of the expression profiles of selected genes. To compare the expression of genes linked to the adherent cells from HK and DI, 12 libraries were prepared (n = 6). The list of selected genes used in this study is comprised of (1) 34 cell type (macrophage, dendritic cell, endothelial cell, T and B cells)-related genes and (2) 42 other immune-related (cytokines, chemokines, mucins and toll-like receptors) genes, as shown in Tables 1 and 2, respectively.
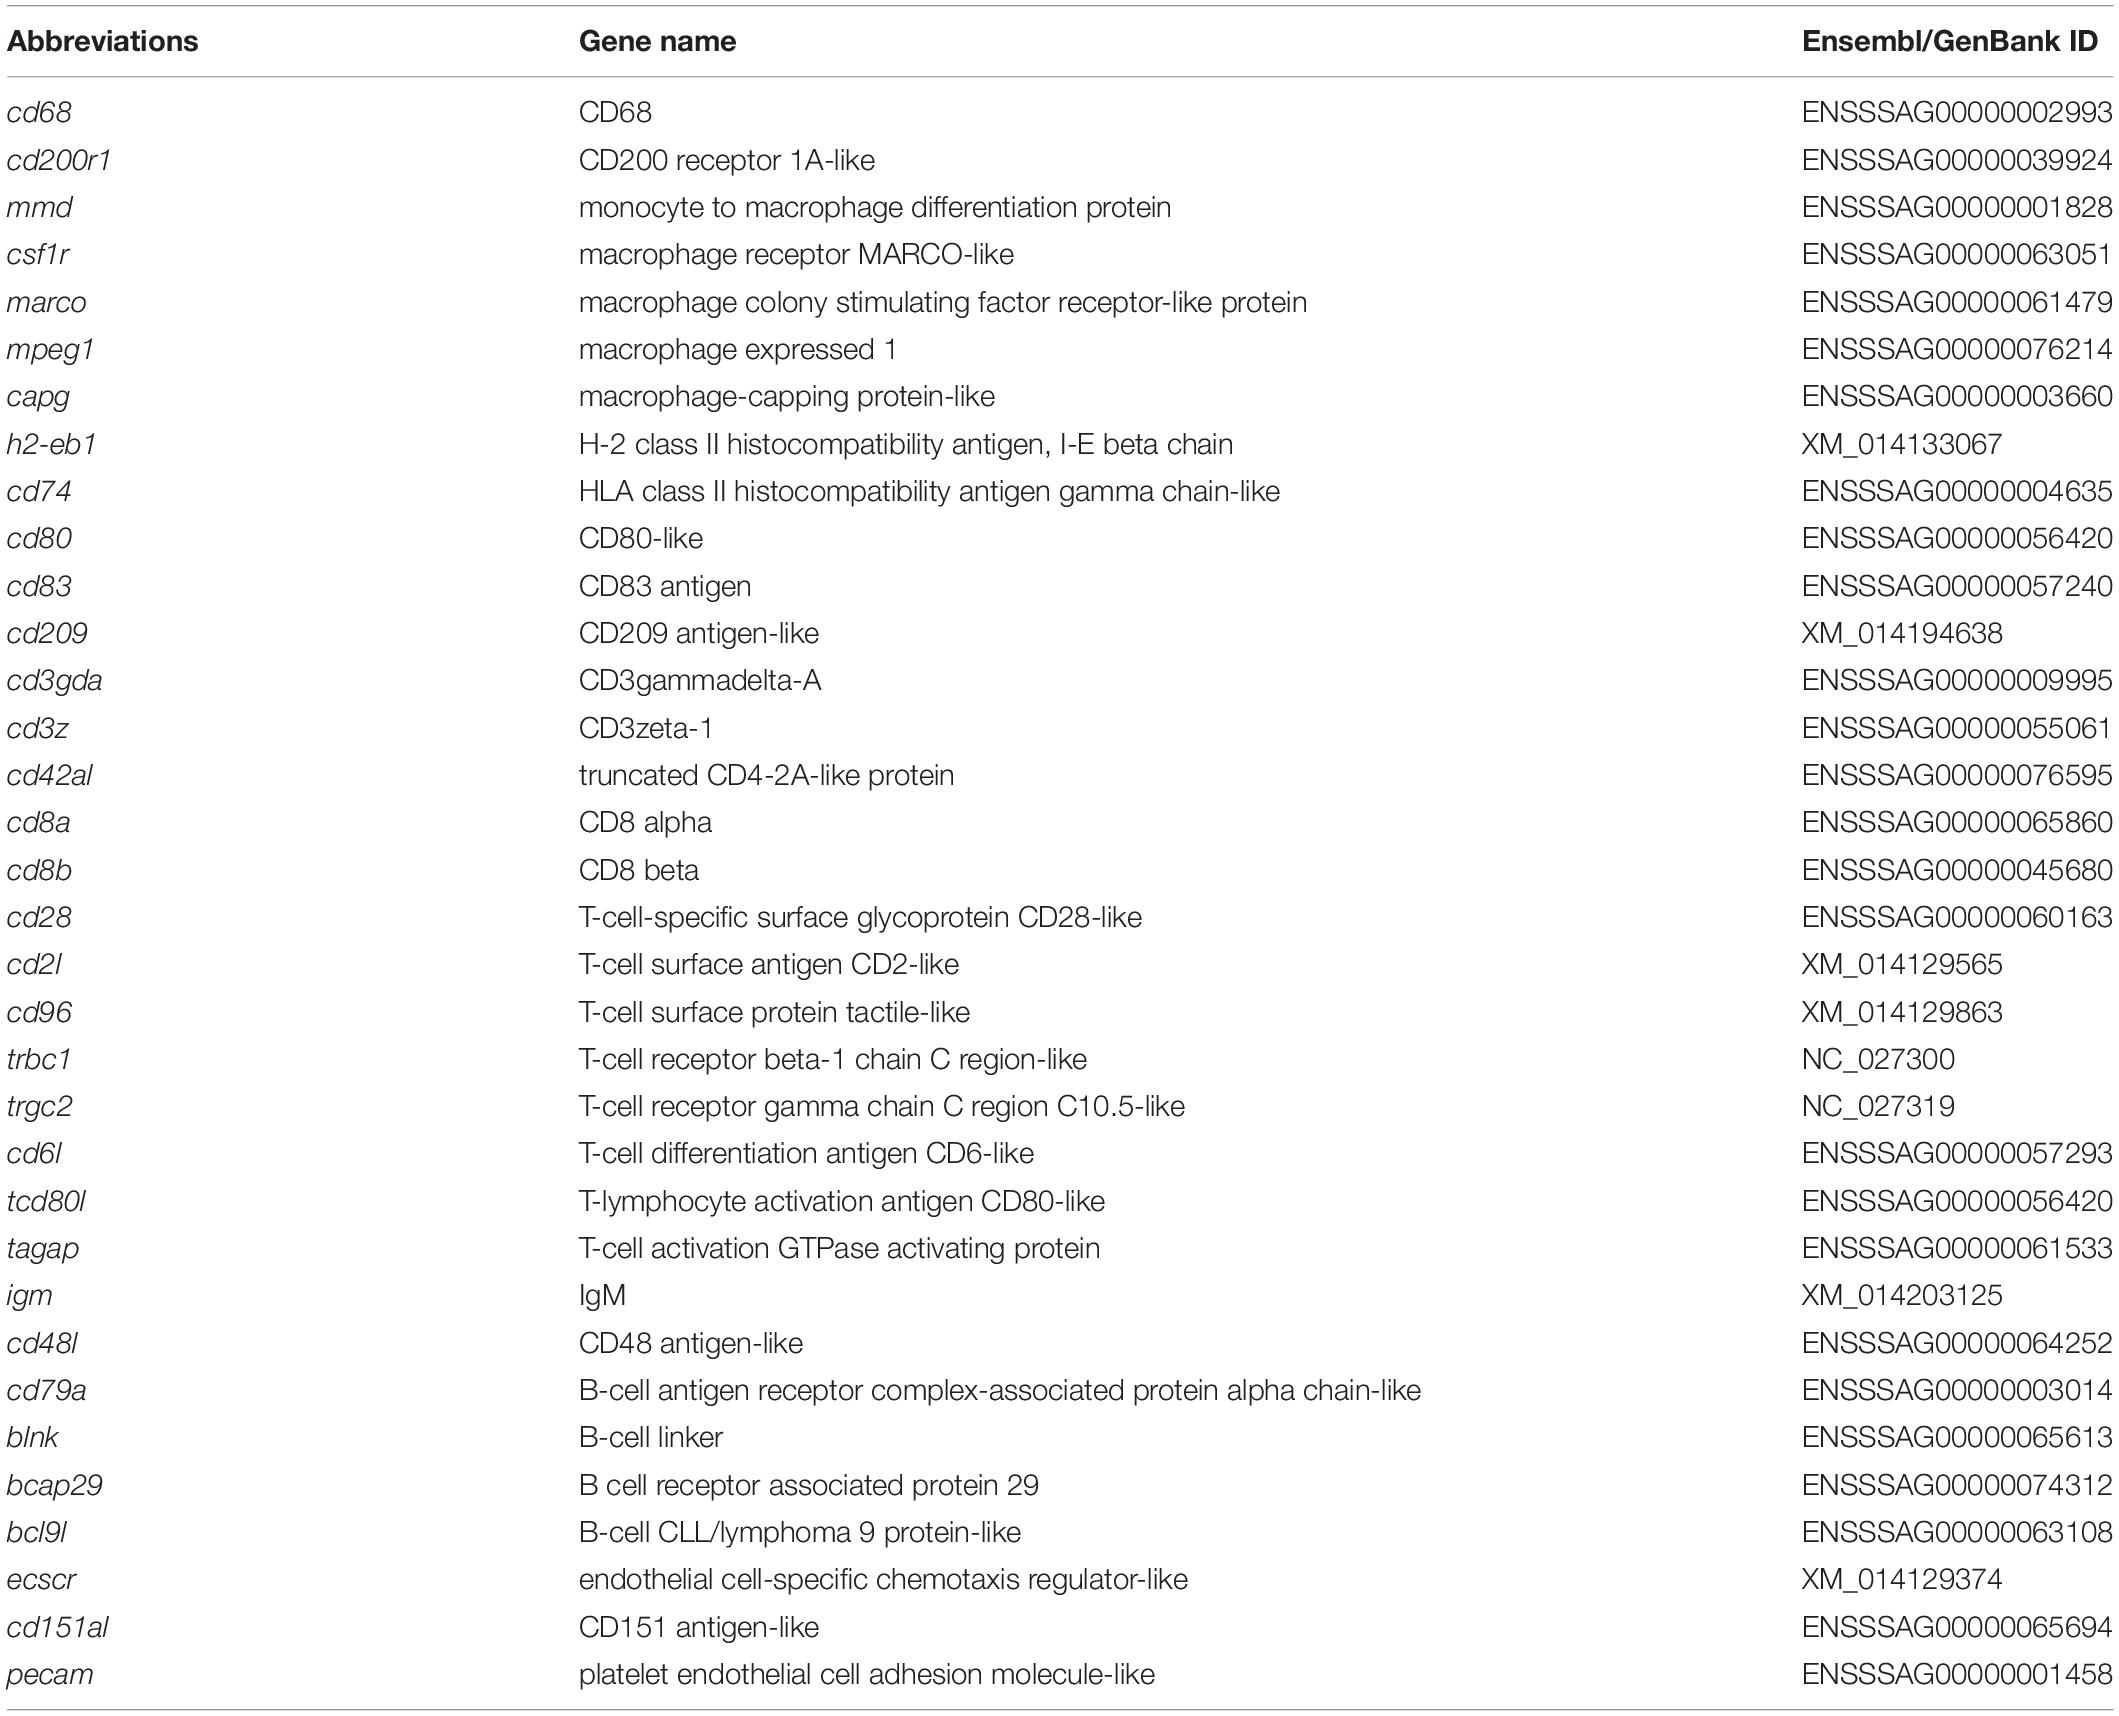
Table 1. List of abbreviations and details of genes expressed in macrophages, dendritic cells, endothelial cells, T and B cells.
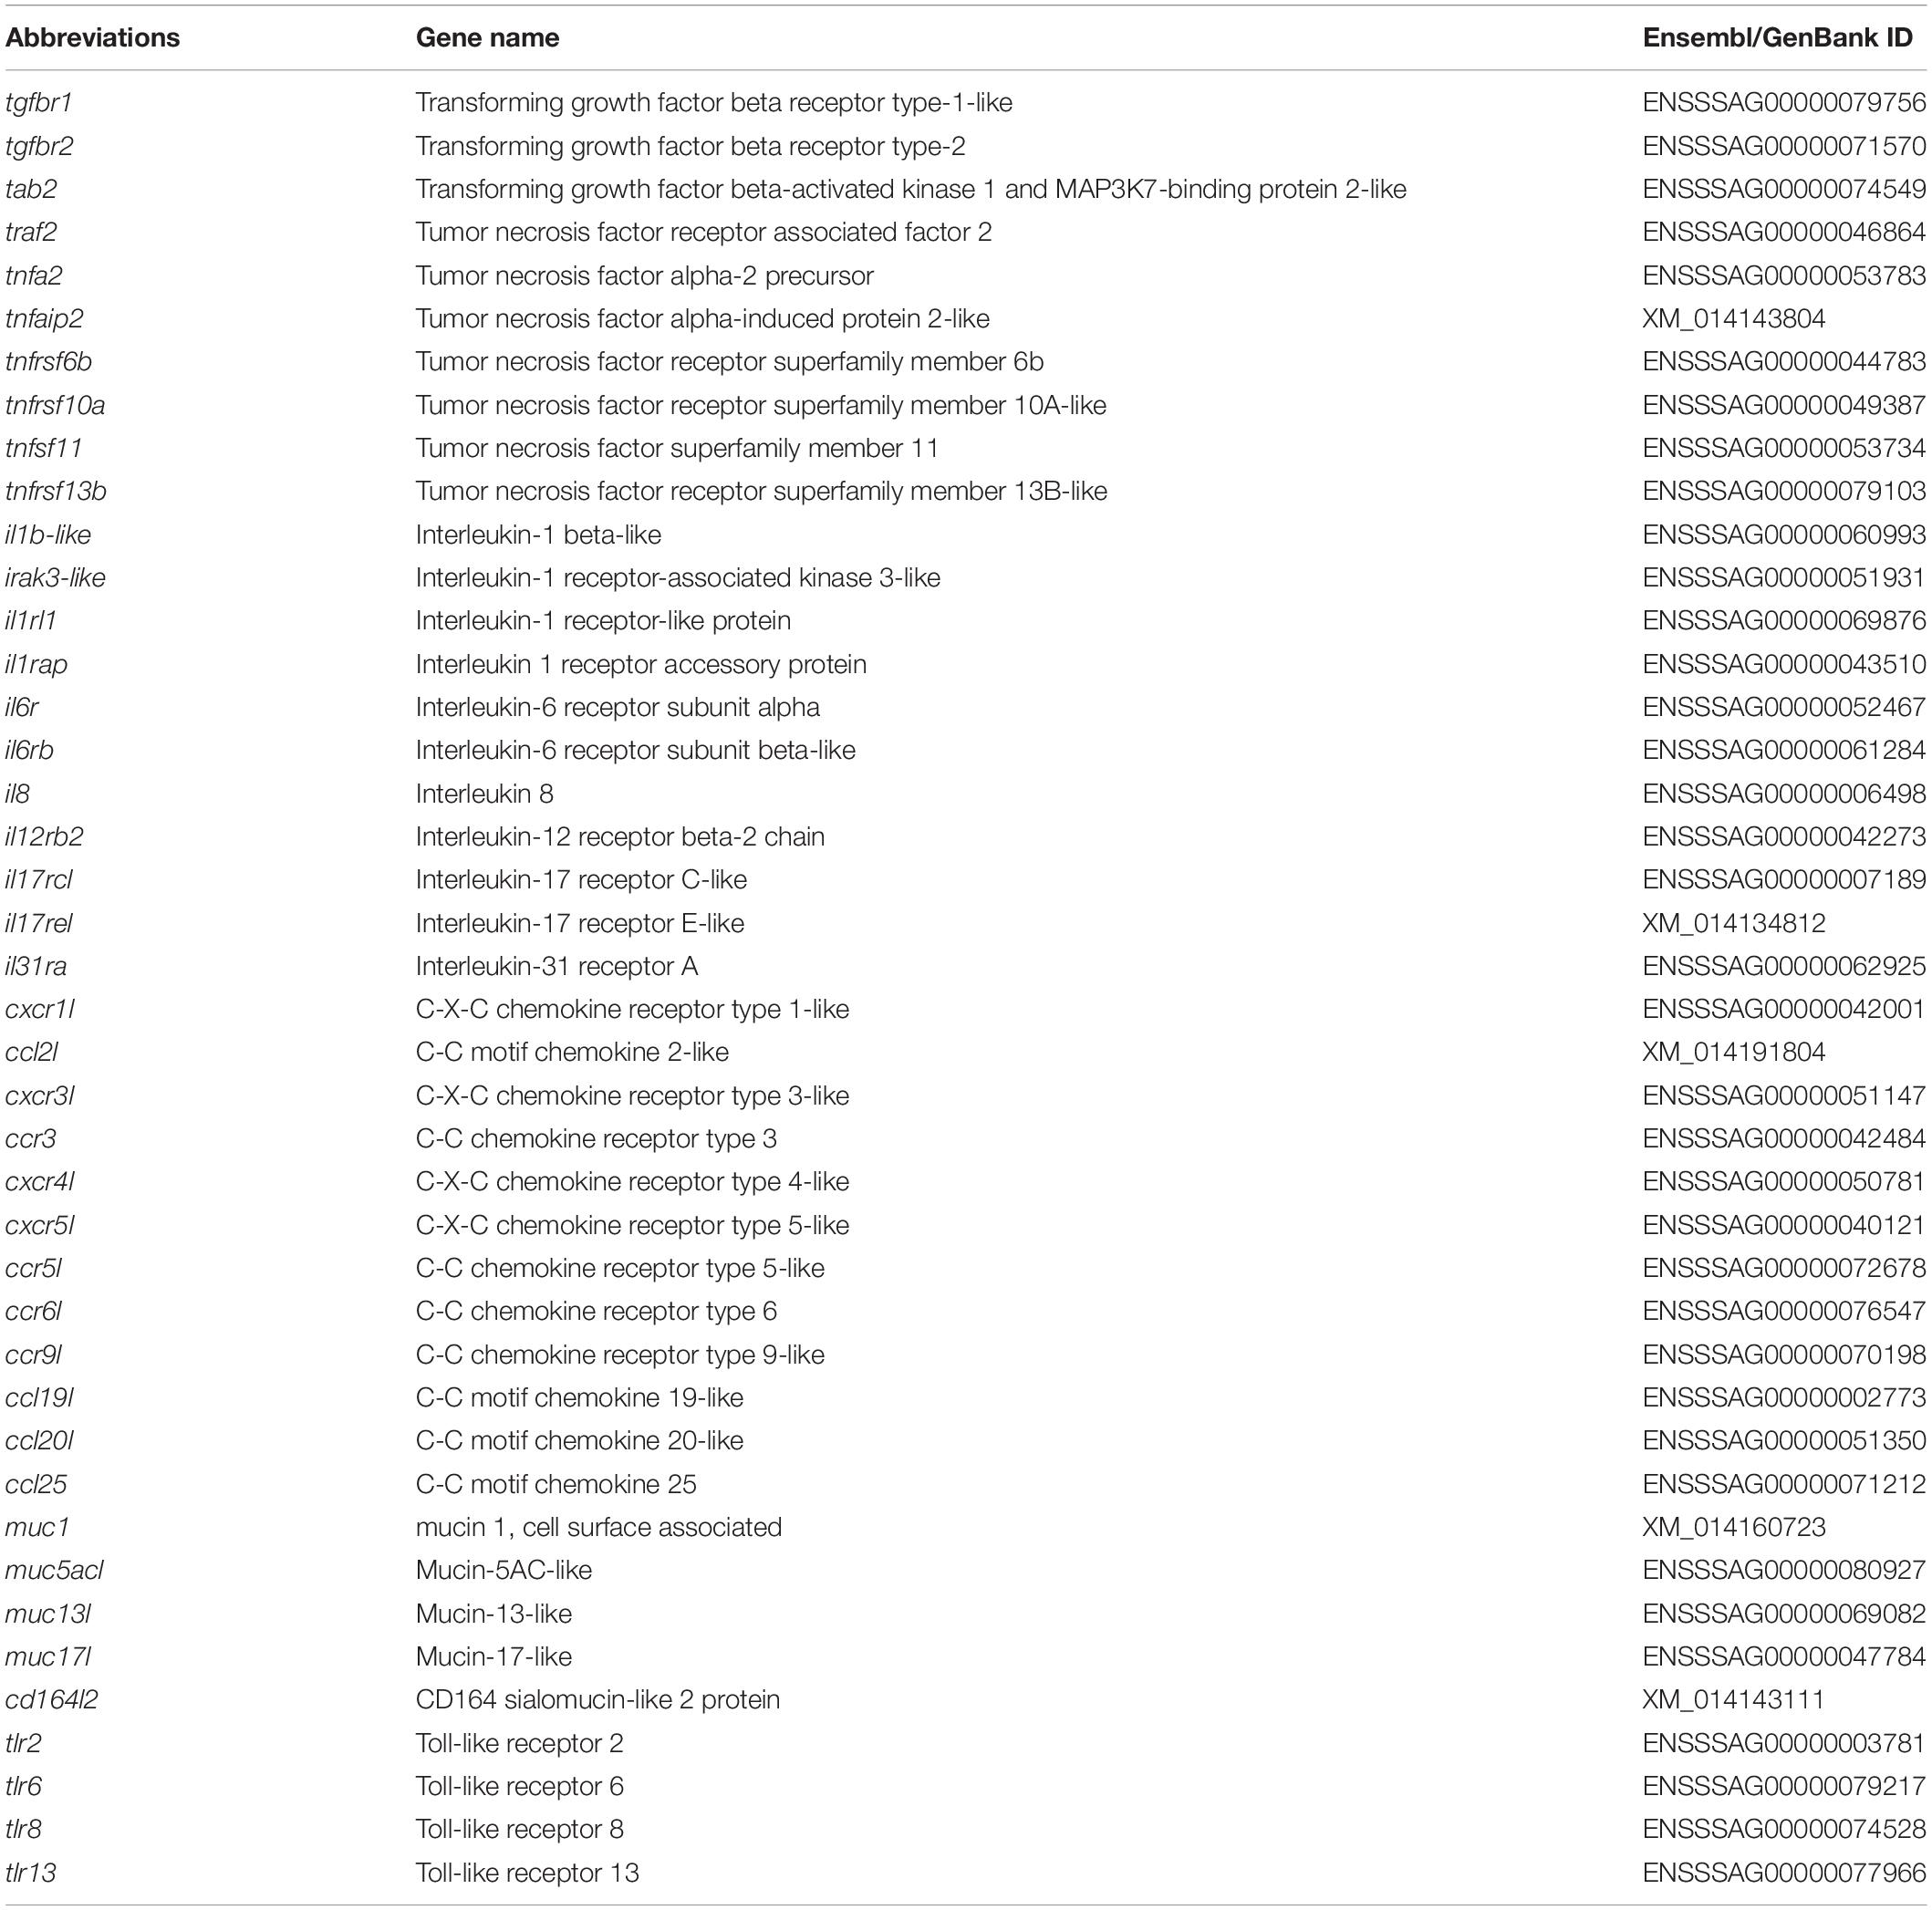
Table 2. List of abbreviations and details of genes coding for selected cytokines, chemokines, mucins, and toll-like receptors.
Total RNA was extracted from the adherent cells that were isolated from HK and DI (<500,000 cells) using the PicoPure RNA isolation kit (Thermo Fisher Scientific) according to the manufacturer’s protocol. The quality and quantity of total RNA were assessed using Agilent RNA high sensitivity screen tape kits and Bioanalyzer 2200 TapeStation system (Agilent Technologies, Santa Clara, CA, United States). RNA sequencing libraries were prepared using the NEBNext Ultra II Directional RNA library preparation kit with poly (A) mRNA magnetic isolation module (NEB #E7490; New England BioLabs®, Herts, United Kingdom), according to the manufacturer’s protocol. For the first and second strand cDNA synthesis, 50 ng of total RNA having high RNA integrity number (RIN > 8) was enriched with Oligo(dT)-conjugated magnetic beads and fragmented to ∼200 nt. Thereafter, the resulting cDNA were end-repaired for adaptor ligation. The ligated cDNAs were amplified with barcoded primers on a thermal cycler for 14 cycles. The PCR products were purified using AMPure XP beads (Beckman Coulter Inc., Brea, CA, United States) to avoid contamination from residual adapter dimers and unwanted (smaller) fragments. After library preparation, the quality and quantity of individual libraries were assessed using Agilent DNA high sensitivity screen tape kits and Bioanalyzer 2200 TapeStation system. These barcoded individual libraries were pooled at equimolar ratios and sequenced as single−end reads (75 bp) on an Illumina NextSeq 500 sequencer (Illumina, San Diego, CA, United States) with NextSeq 500/550 high output v2 reagents kit (Illumina) at the sequencing facility of Nord University, Bodø, Norway.
All bioinformatics analyses of RNA-Seq data were performed as described previously by Zhang et al. (2018). The obtained raw sequencing data was deposited in the Gene Expression Omnibus (GEO, NCBI); the accession number is GSE154142. Briefly, raw sequence data were converted to FASTQ format with bcl2fastq2 (v2.17, Illumina). The adapter sequences were removed using cutadapt (version 1.12) with the following the parameters: -q 20 –quality-base = 33 -m 20 –trim-n. The quality of the trimmed fastq files (clean reads) was then assessed using FastQC (Andrews, 2010), and the reads with quality > Q30 were mapped to the Atlantic salmon genome ICSASG_v2 from RefSeq1. The mapped reads were quantified and then annotated using gff3 annotation file. The generated data was normalized using DESeq2 (Love et al., 2014), and the normalized data was used for statistical comparisons, i.e., to determine the differences in the expression of selected immune-related genes in AIC and AKC. The package, DESeq2 employs shrinkage estimation for dispersions and fold changes. The R packages ggplot2 version 3.1.1 (Wickham, 2016) were employed to prepare and format the graphs. A heatmap was prepared using the functions from the package ComplexHeatmap (Gu, 2015).
Statistical analysis was performed using RStudio version 1.1.463. Normality of the flow cytometry and gene expression data was tested by Shapiro-Wilk Test, and the assumption of equal variance was checked by Bartlett’s Test. Comparisons between groups were performed using unpaired Student’s t-test. The differences were considered significant at p < 0.05.
We explored the cell populations from salmon DI by employing IFC. After dead cell exclusion, approximately 90% of viable cells (negative for PI) were obtained; shown in a BF area (cell size) vs. SSC intensity (cell granularity) plot (Figure 1A). Because we have already revealed the identity of the HK cell population in our previous study (Park et al., 2020) here we show only the DI cell population in Figure 1. The gating strategy that was developed previously by Park et al. (2020) was employed for DI cell populations (Figure 1A: LYM, lymphocyte; MON, monocyte/macrophage; R1, macrophage-like cells). Nucleus morphologies were revealed through PI staining (Figures 1B,C). Only PI negative live cells (Figure 1B) were considered for the gating shown in Figure 1A; cells in the gates LYM, MON, and R1 had spherical and fairly rigid nuclei while those in the gate R2 had relatively smaller and different shaped nuclei. We found that there are diverse cells in the isolated salmon DI cell population. A representative image of the DI cell images from among 6 images captured (to confirm the quality of the harvested DI cells) by the fluorescent imager is shown in Figure 1D.
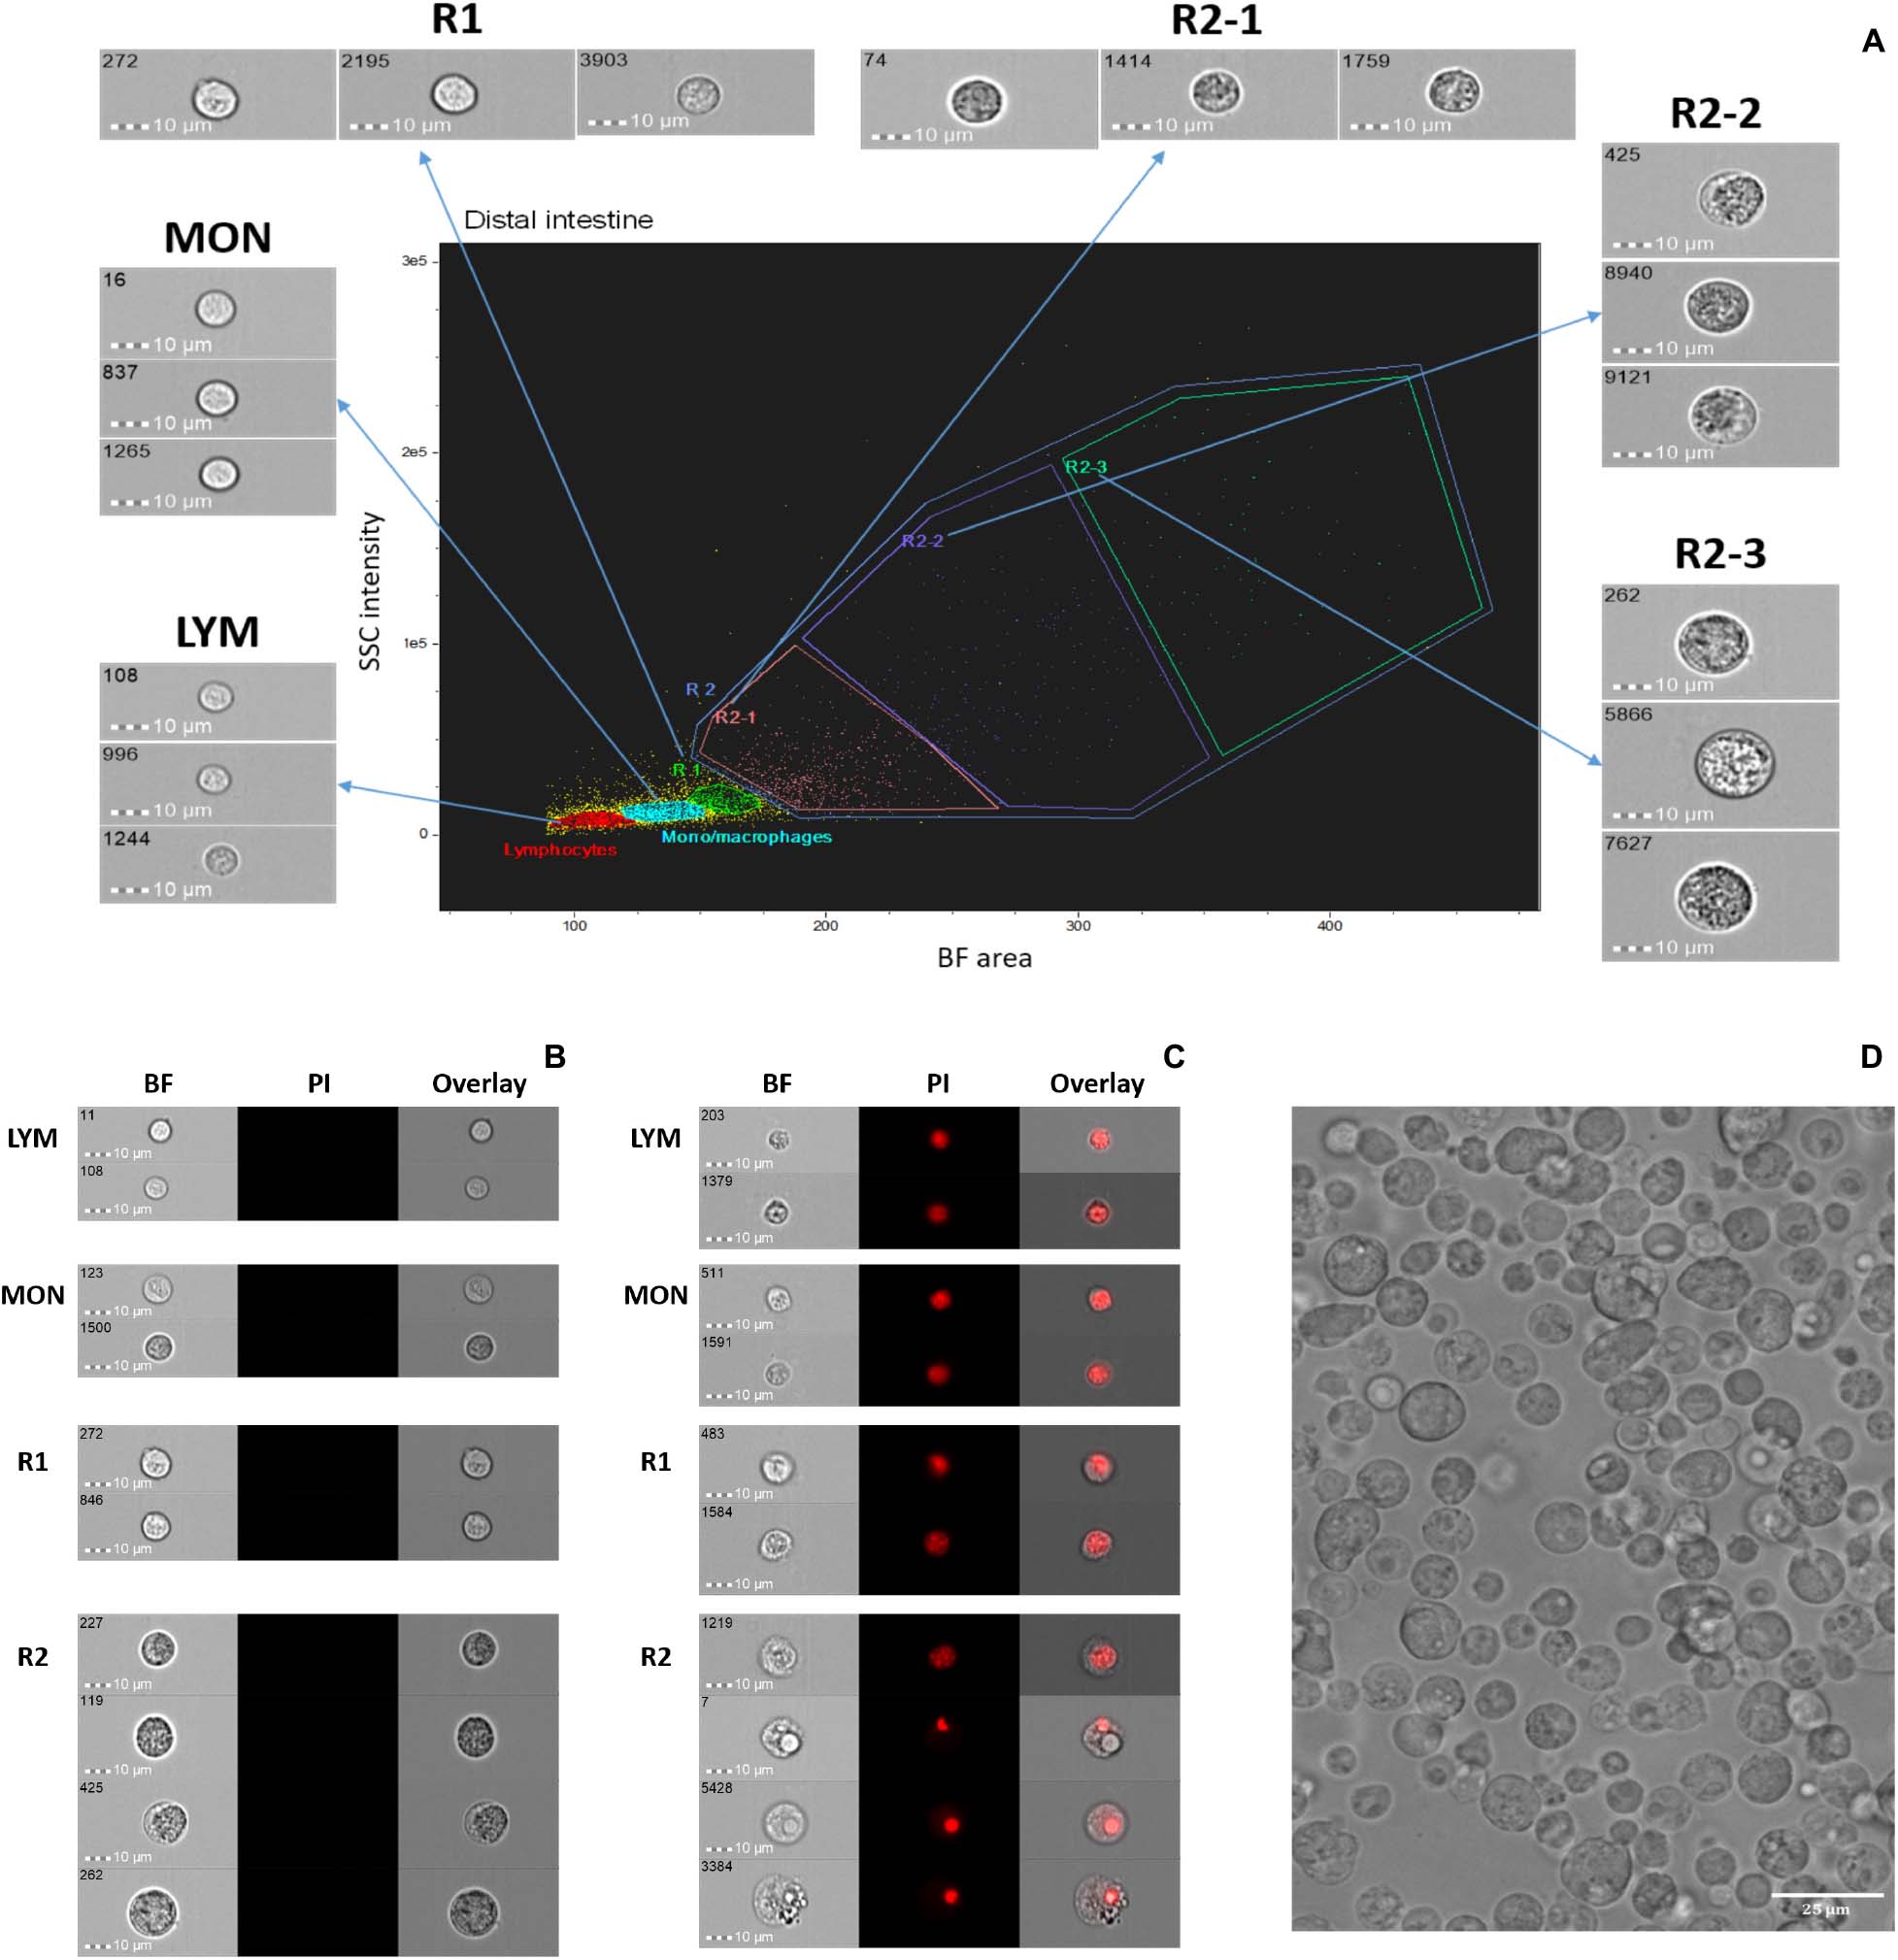
Figure 1. Cell populations from Atlantic salmon distal intestine. (A) Live cells are shown in a brightfield (BF) area (cell size) vs. side scatter (SSC) intensity plot (cell granularity). Representative images (40 × objective, scale bar = 10 μm) from each gate are shown separately. Intestinal cells were identified based on nucleus morphologies. Using propidium iodide, live or no-stained cells (B) and dead or nucleus-stained cells (C) are shown. (D) A representative image captured by fluorescent imager (20 × objective, scale bar = 25 μm) shows salmon intestinal cell population. LYM, lymphocytes; MON, monocytes/macrophages; R, region: R1, macrophage-like cells; R2, unknown cells; R2-1, R2-2, presumptive granulocytes; R2-3, presumptive vacuolated cells.
The cell populations − whole leukocytes (HKL and DIL, respectively), supernatants (HS and DS, respectively) and adherent cells (AKC and AIC, respectively) − from three cell suspensions from HK or DI are shown in Figures 2A–C and Figures 2E–G, respectively. The reference AKC had macrophage population, located in higher BF area and higher SSC intensity compared to those of head kidney supernatant-derived cells (HS, red gates; Figures 2B–D). In the DI cells, the cell populations were more scattered, as evident in the dotplot (considering the BF area values). However, AIC apparently had a lower percentage of the cells in the gated area compared to those of distal intestine supernatant-derived cells (DS, red gates; Figures 2F–H).
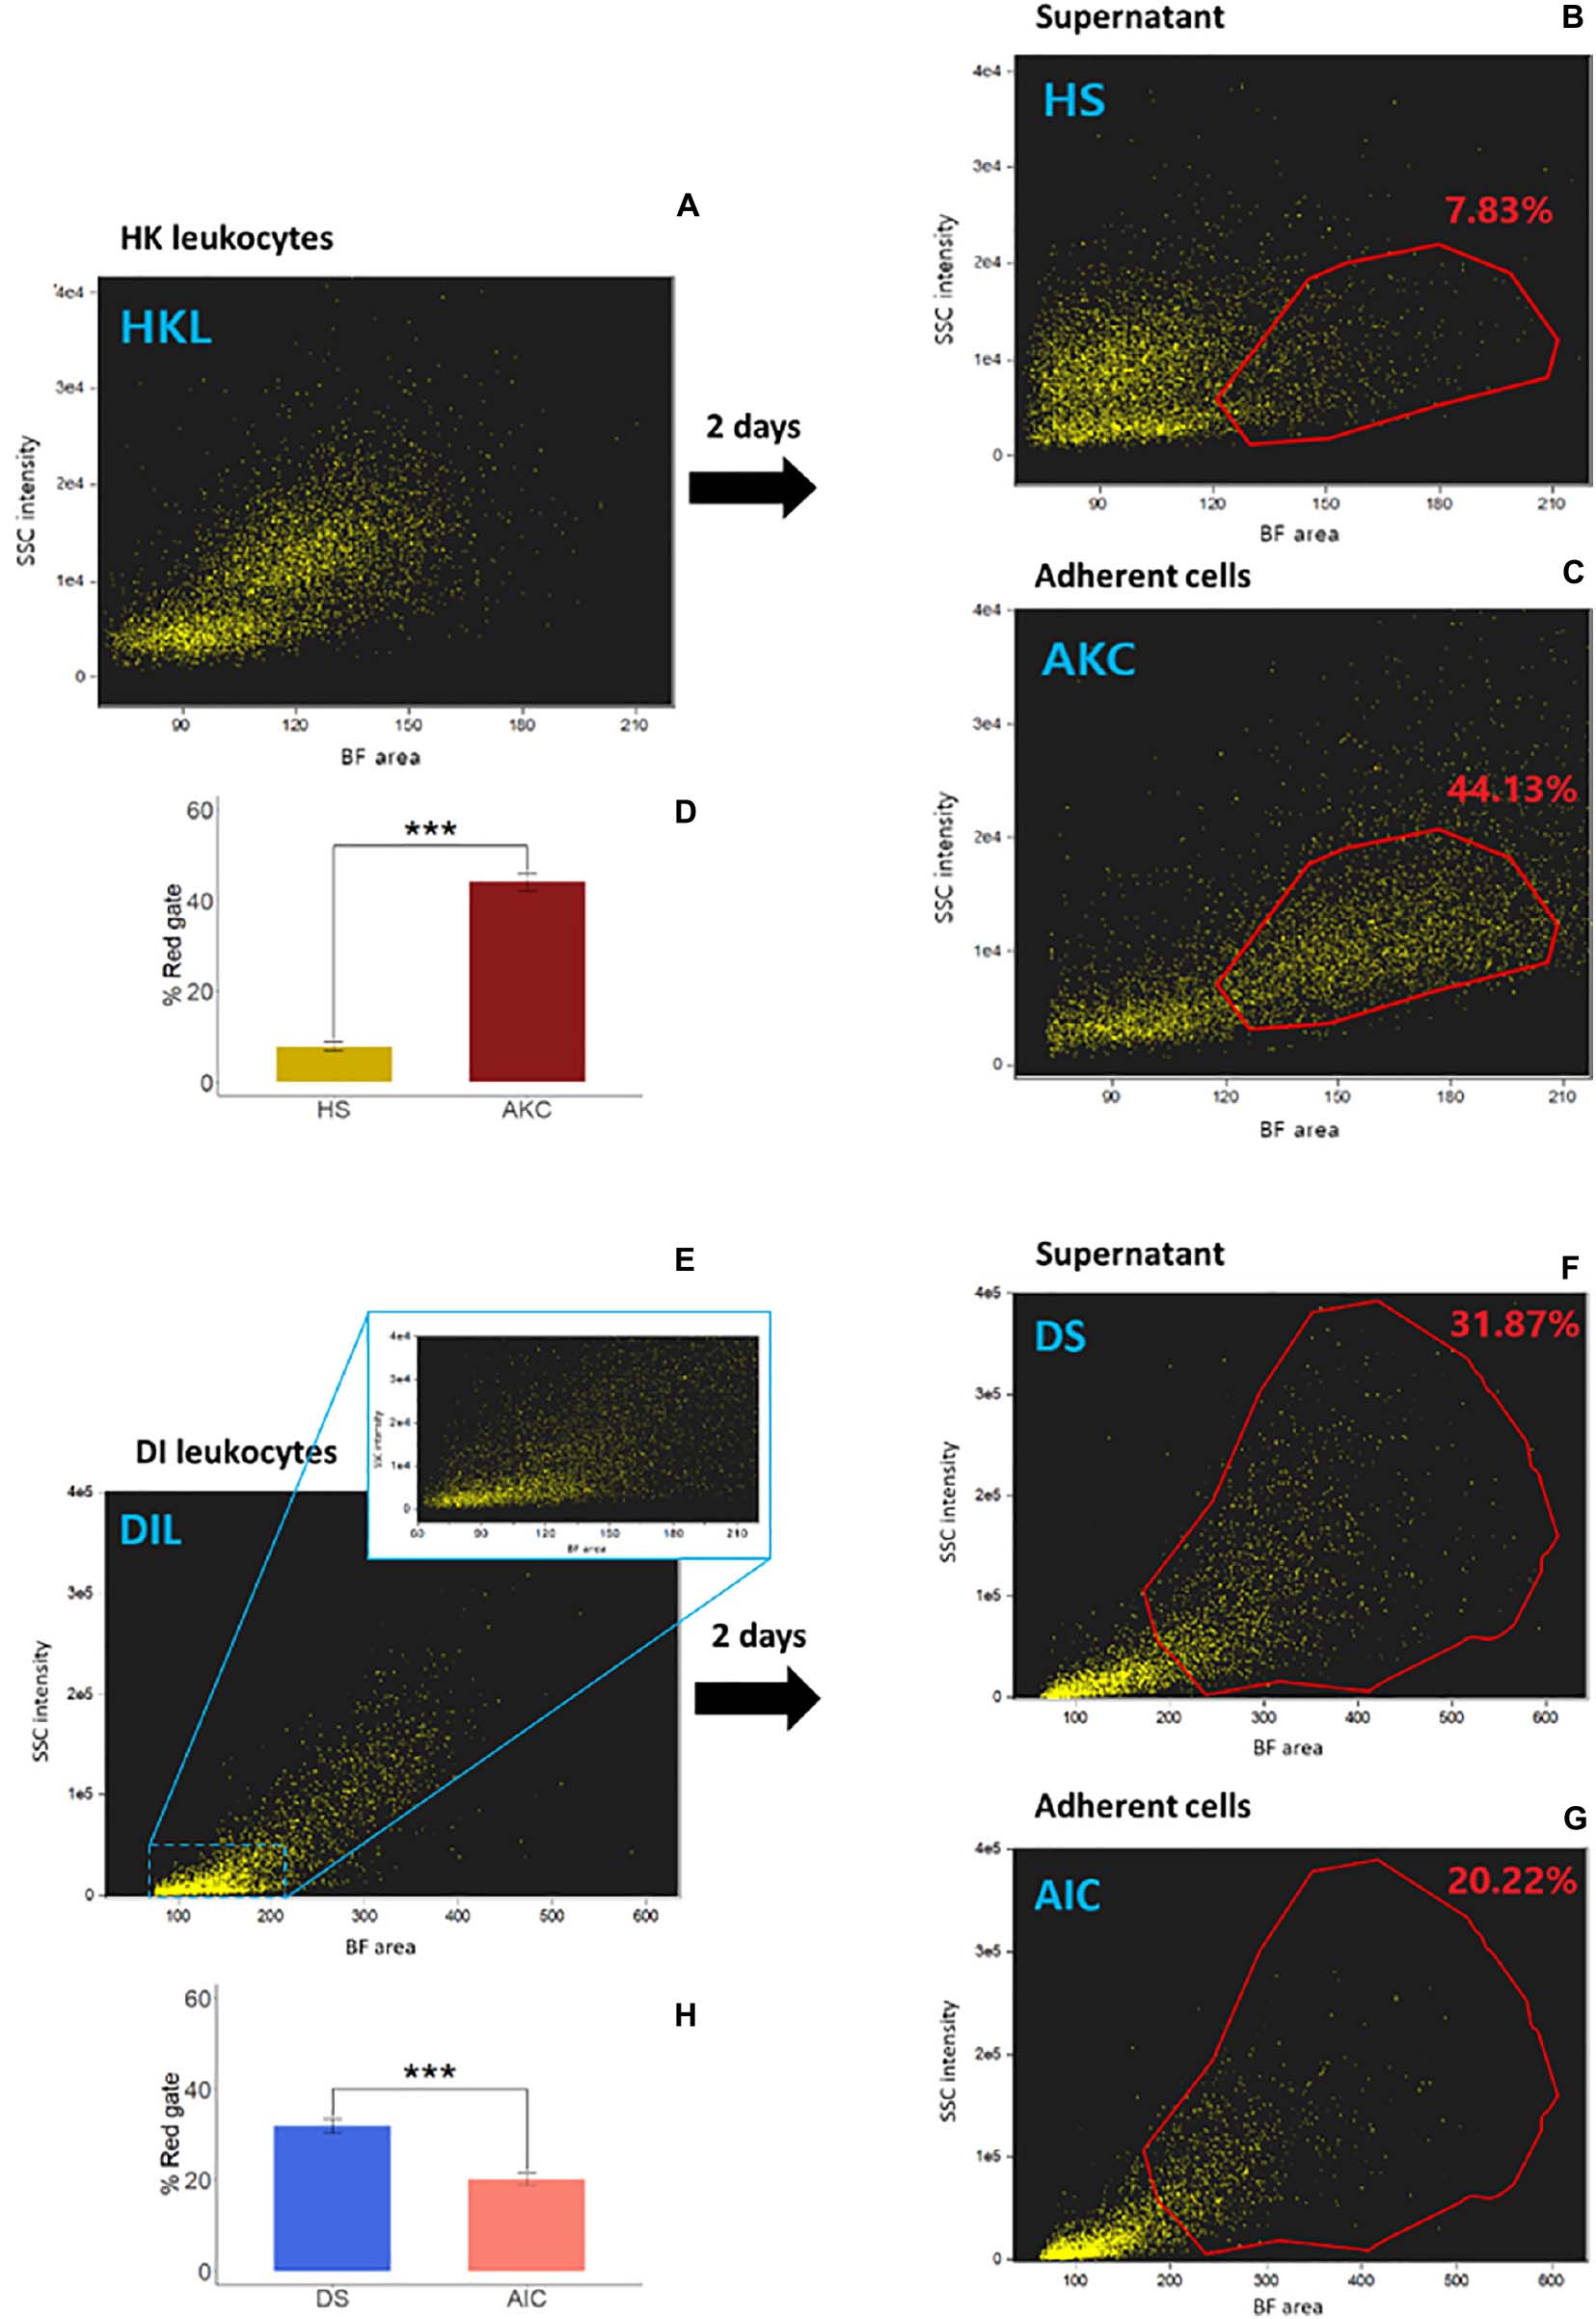
Figure 2. Examination of adherent cell population from Atlantic salmon head kidney and distal intestine by imaging flow cytometry. We compared cell populations from three cell suspensions; (A and E) whole leukocytes (HKL and DIL, respectively), (B and F) supernatants (HS and DS, respectively) and (C and G) adherent cells (AKC and AIC, respectively) in a brightfield (BF) area (cell size) vs. side scatter (SSC) intensity plot (cell granularity) using IFC. The bar plots (D and H) indicate percent of the cells in the red gates in supernatants (B and F) vs. those in adherent cells (C and G, respectively). Statistically significant differences (p < 0.001) are indicated using asterisks. Bar plots show the mean ± SD (n = 6).
To compare the phagocytic activity of whole leukocytes and adherent cells from HK (Figures 3A–C) and DI (Figures 4A–C), we quantified the uptake of E. coli BioParticlesTM by the cells (Park et al., 2020). The phagocytic abilities of AKC and AIC were significantly higher than those of HKL and DIL (Figures 3A, 4A), respectively. The phagocytes from AIC had different morphologies compared to AKC (Figures 3C, 4C). Among AICs, along with single and round shaped phagocytes, we found oval shaped (5.69% of total phagocytes, Figure 4D) and doublets consisting of a phagocytic cell and an interacting cell (1.15% of total phagocytes, Figure 4E).
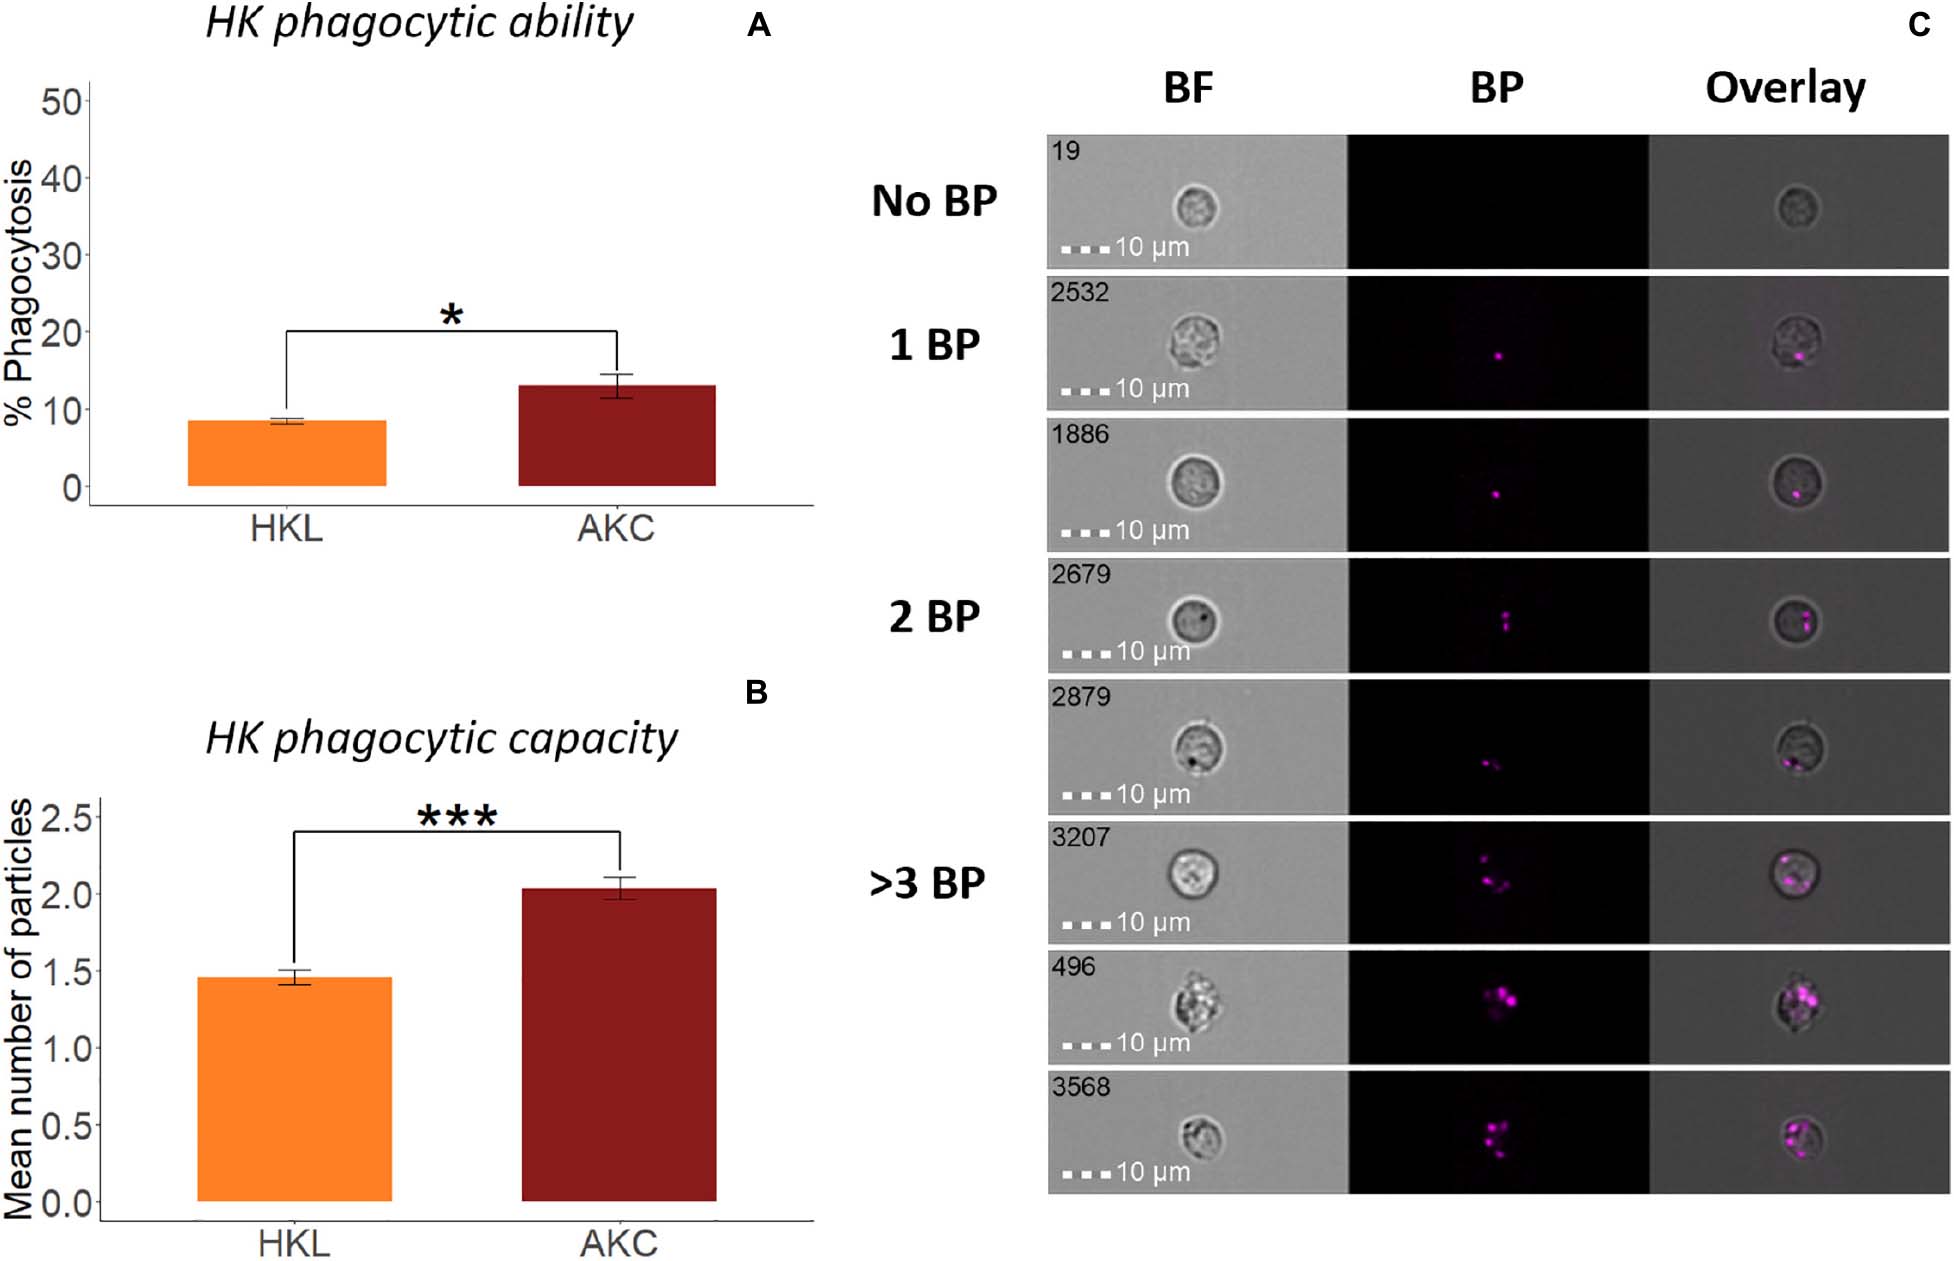
Figure 3. Phagocytic activity of whole leukocytes and adherent cells from Atlantic salmon head kidney. Percent of phagocytic cells or phagocytic ability (A) and mean number of bio-particles (BP) ingested per phagocytic cell or phagocytic capacity (B) are shown. (C) Representative cell images show cells with no BP, and 1BP, 2BP, and >3BP. Statistically significant differences (p < 0.05) are indicated using asterisks. Bar plots show the mean ± SD (n = 6). All cell images were captured with 40 × objective. Scale bar = 10 μm. BF, brightfield; 1 BP, 2 BP, and > 3 BP, 1–3 internalized bio-particles.
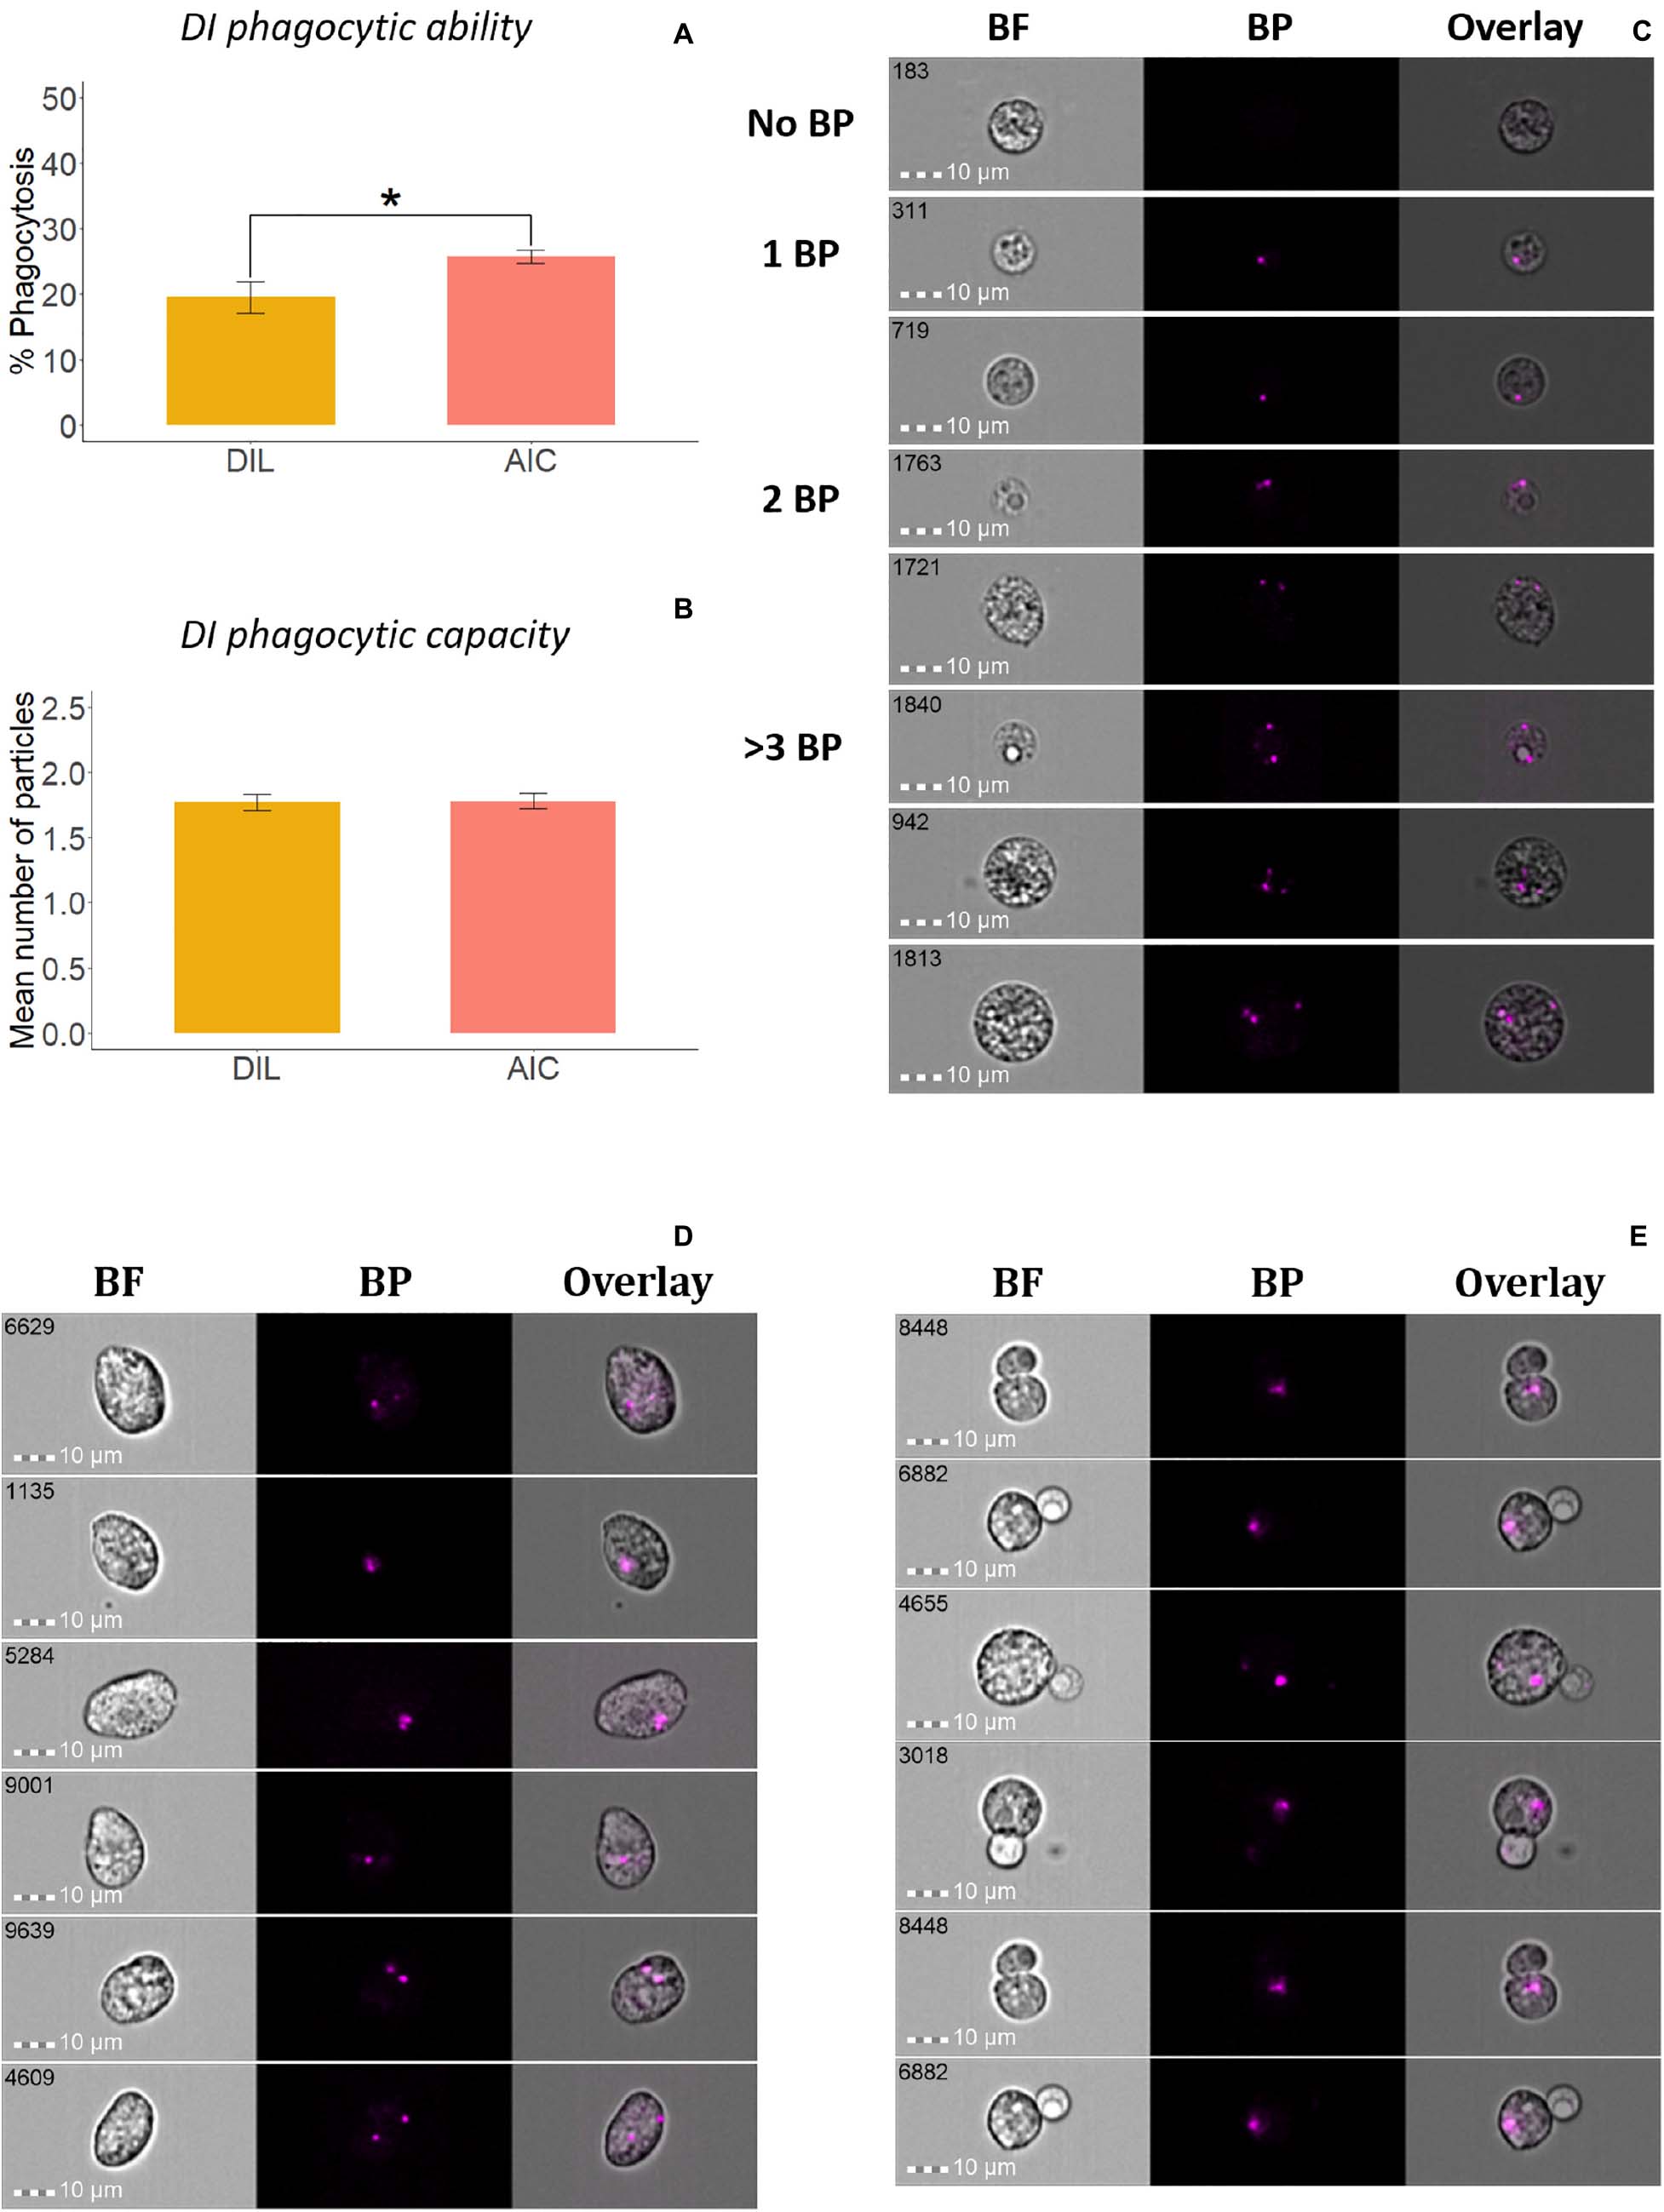
Figure 4. Phagocytic activity of whole leukocytes and adherent cells from Atlantic salmon distal intestine. Percent of phagocytic cells or phagocytic ability (A) and mean number of bio-particles (BP) ingested per phagocytic cell or phagocytic capacity (B) are shown. (C) Representative cell images show cells with no BP, and 1BP, 2BP, and >3BP. Statistically significant differences (p < 0.05) are indicated using asterisks. In addition, oval shaped phagocytes (D) and doublets containing a phagocyte that interacts with a lymphocyte-like cell (E) were found among the adherent intestinal cells. Bar plots show the mean ± SD (n = 6). All cell images were captured with 40 × objective. Scale bar = 10 μm. BF, brightfield; 1 BP, 2 BP, and >3 BP, 1–3 internalized bio-particles.
To understand the identity of cell types in AIC, the expression of selected genes in AIC was compared with those of AKC. We obtained over 312 million cleaned reads from 12 (6 from AIC and 6 from AKC) samples after adapter trimming and quality filtering. Of them, over 285 million reads were mapped to Atlantic salmon genome. Average mapping percentage among samples was 91.36% (Supplementary Table 1). The dispersion of the genes decreased with increase in mean of normalized counts (Supplementary Figure 1).
Employing the normalized read counts from DESeq2 analyses, we describe the expression of 34 cell-specific (macrophage, dendritic cell, endothelial cell, T and B cells) genes and 42 immune-related (cytokines, chemokines, mucins and toll-like receptors) genes in AIC compared to AKC. Lack of appropriate cell markers and unavailability of easy intestinal cell isolation techniques hamper the characterization of adherent cells. Therefore, we adopted the targeted analysis strategy to delineate the cell types by linking them to known genes.
The expression of 34 genes associated with macrophages, dendritic cells (DC), endothelial cells, T and B cells in AIC were compared to those in AKC (Figures 5, 6). Among the 9 macrophage-related genes, the expression of 8 genes (h2-eb1, cd74, cd68, marco, capg, mpeg1, cd200r1, and csf1r) was significantly lower in AIC compared to AKC (Figure 5A). As for the DC specific genes (Figure 5B), AIC had significantly lower expression of cd209 and cd83 than those of AKC. As for the endothelial cell-related genes, the expression of ecscr and cd151l was significantly higher in AIC than in AKC though this was not the case for the pecam gene (Figure 5C).
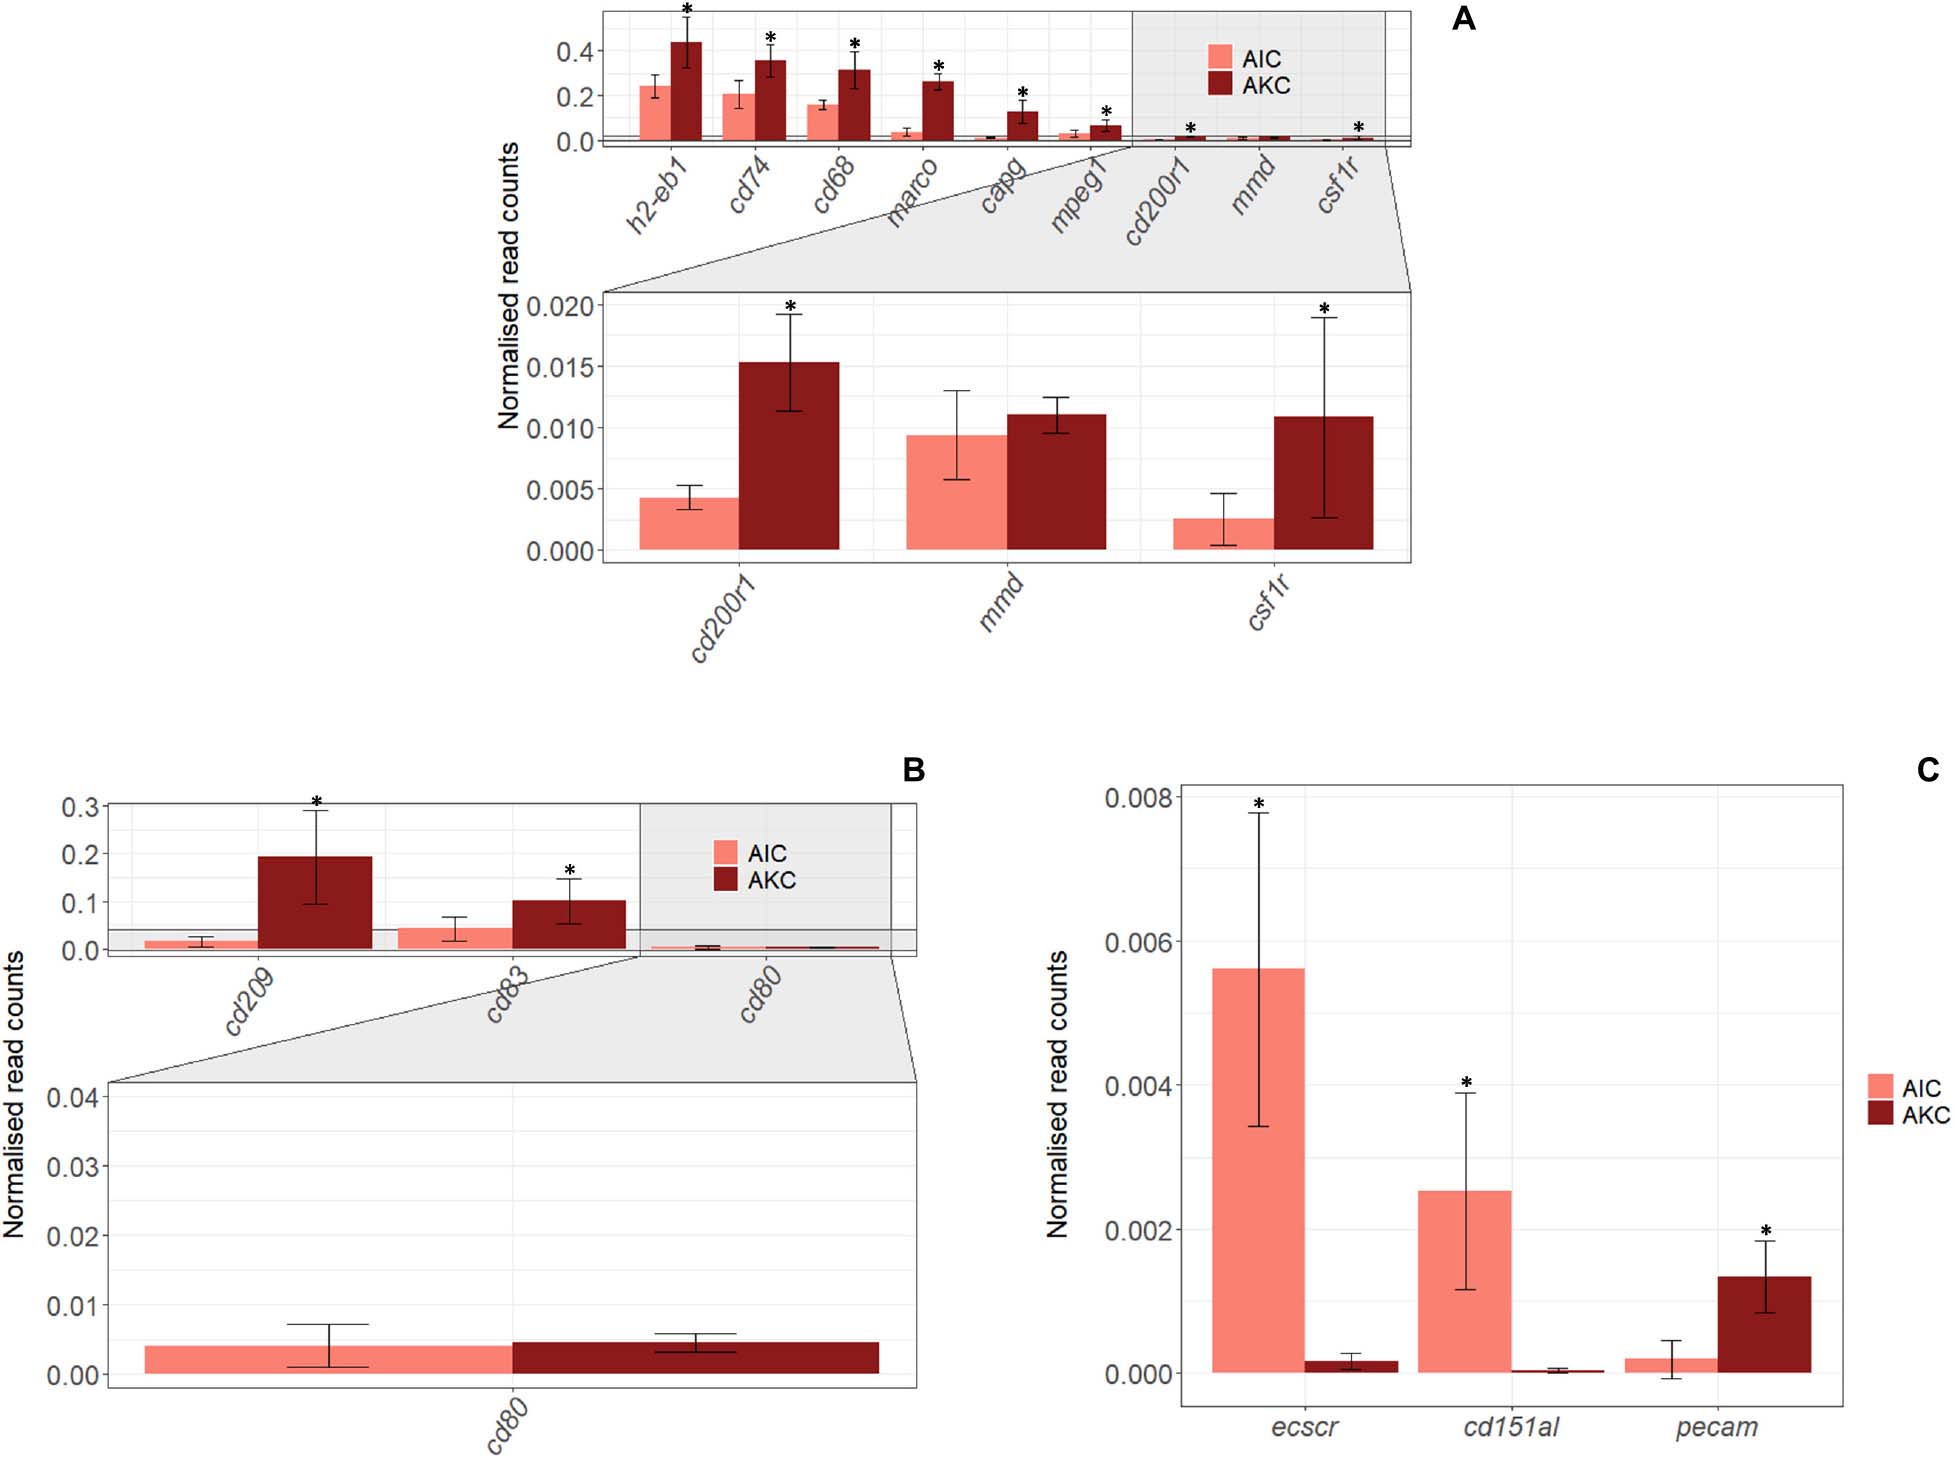
Figure 5. The expression of genes linked to macrophages, dendritic cells and endothelial cells in the adherent cells from Atlantic salmon distal intestine and head kidney. Employing the normalized read counts from DESeq2 analyses, the expression of genes related to macrophages (A), dendritic cells (B) and endothelial cells (C) were determined, and the expression levels between the adherent cells from salmon distal intestine (AIC) and head kidney (AKC) were compared. Statistically significant differences (p < 0.05) are indicated using asterisks. Bar plots show the mean ± SD. Sample size = 6.
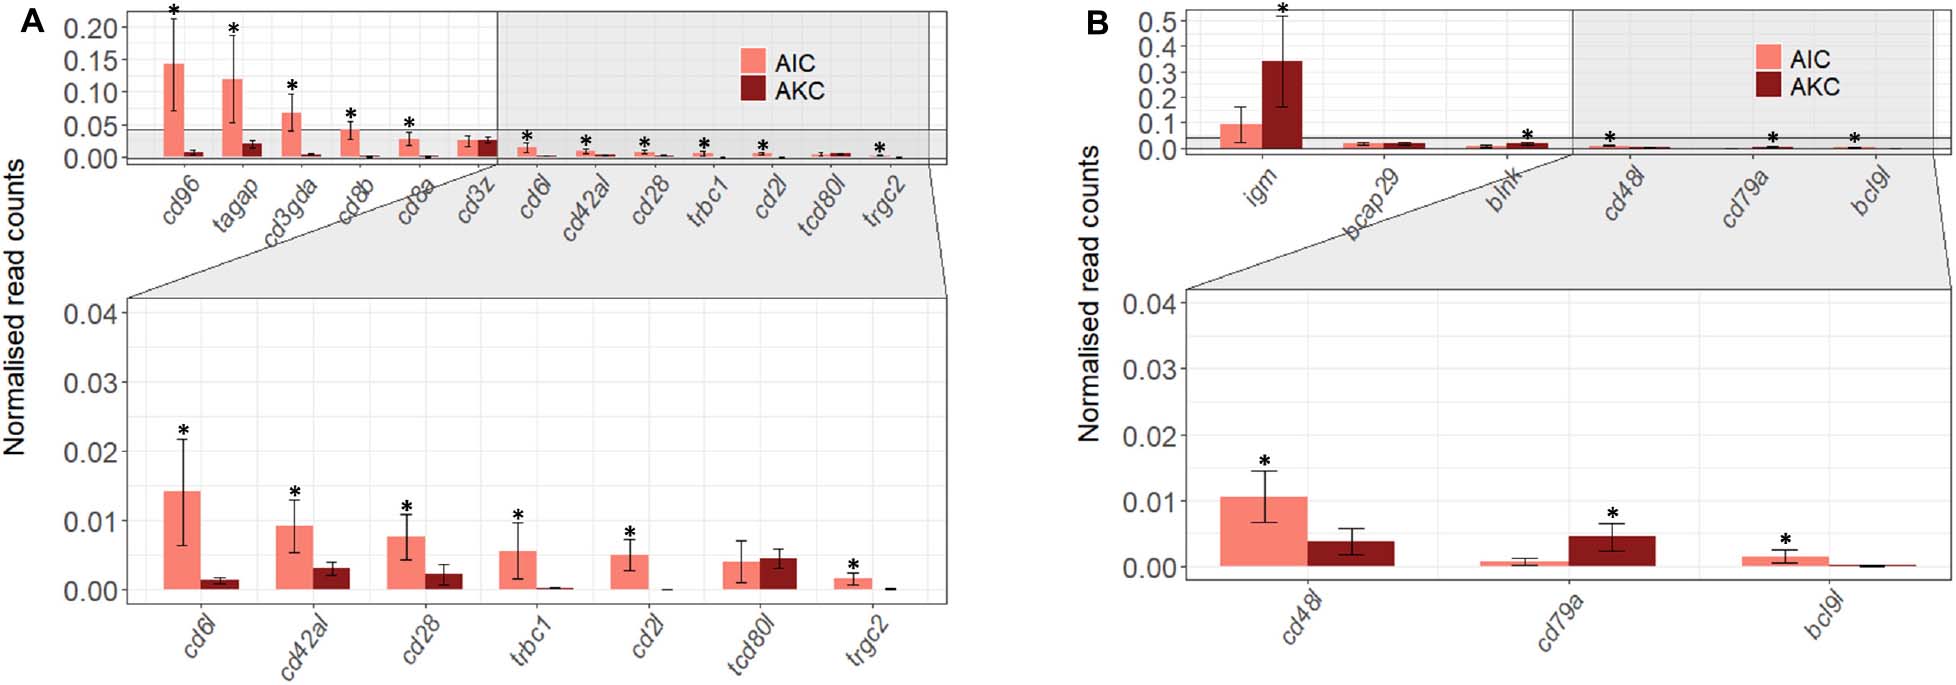
Figure 6. The expression of genes related to T and B cells in the adherent cells from Atlantic salmon distal intestine and head kidney. Employing the normalized read counts from DESeq2 analyses, the expression of T (A) and B cells (B) associated genes in the adherent cells from salmon distal intestine (AIC) and head kidney (AKC) were compared. Statistically significant differences (p < 0.05) are indicated using asterisks. Bar plots show the mean ± SD (n = 6).
Regarding the T and B cell-specific gene profile (Figure 6), AIC had significantly higher expression of most T cell-related genes (cd96, tagap, cd3gda, cd8b, cd8a, cd6l, cd42al, cd28, trbc1, cd2l, and trgc2), but significantly lower expression of B cell-related genes (igm, blnk, and cd79a).
The expression of 21 immune-related cytokine genes were also considered for the AIC vs. AKC comparisons (Figure 7). AIC had significantly lower expression of interleukin 1 and 6 receptors (il1rap and il6r) while the expression of tumor necrosis factor (TNF)-related genes (tnfrsf10a, tnfsf11, traf2, and tnfrsf6b) was significantly higher. Among the transforming growth factor (TGF)-related genes, the expression of TGFβ receptors (tgfbr1 and tgfbr2) were significantly higher, while the expression of TGFβ activated kinase binding protein (tab2) was significantly lower in AIC.
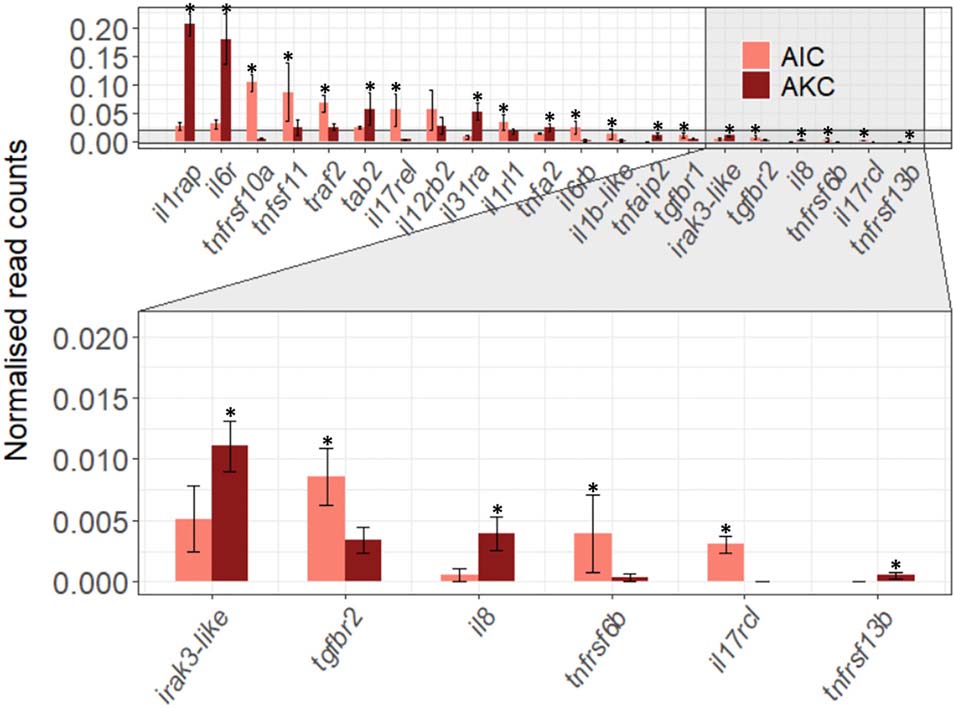
Figure 7. The expression of cytokine-related genes in the adherent cells from Atlantic salmon distal intestine and head kidney. Employing the normalized read counts from DESeq2 analyses, the expression of cytokine-related genes in the adherent cells from salmon distal intestine (AIC) and head kidney (AKC) were compared. Statistically significant differences (p < 0.05) are indicated using asterisks. Bar plots show the mean ± SD (n = 6).
Twelve immune-related genes of chemokines were also studied in AIC and AKC (Figure 8A). The expression levels of ccr9l, ccl20l, ccr6l, and ccr5l were significantly higher, while the expression of, cxcr3l, ccr3, ccl25, cxcr4l, cxcr1l, and cxcr5l was significantly lower in AIC.
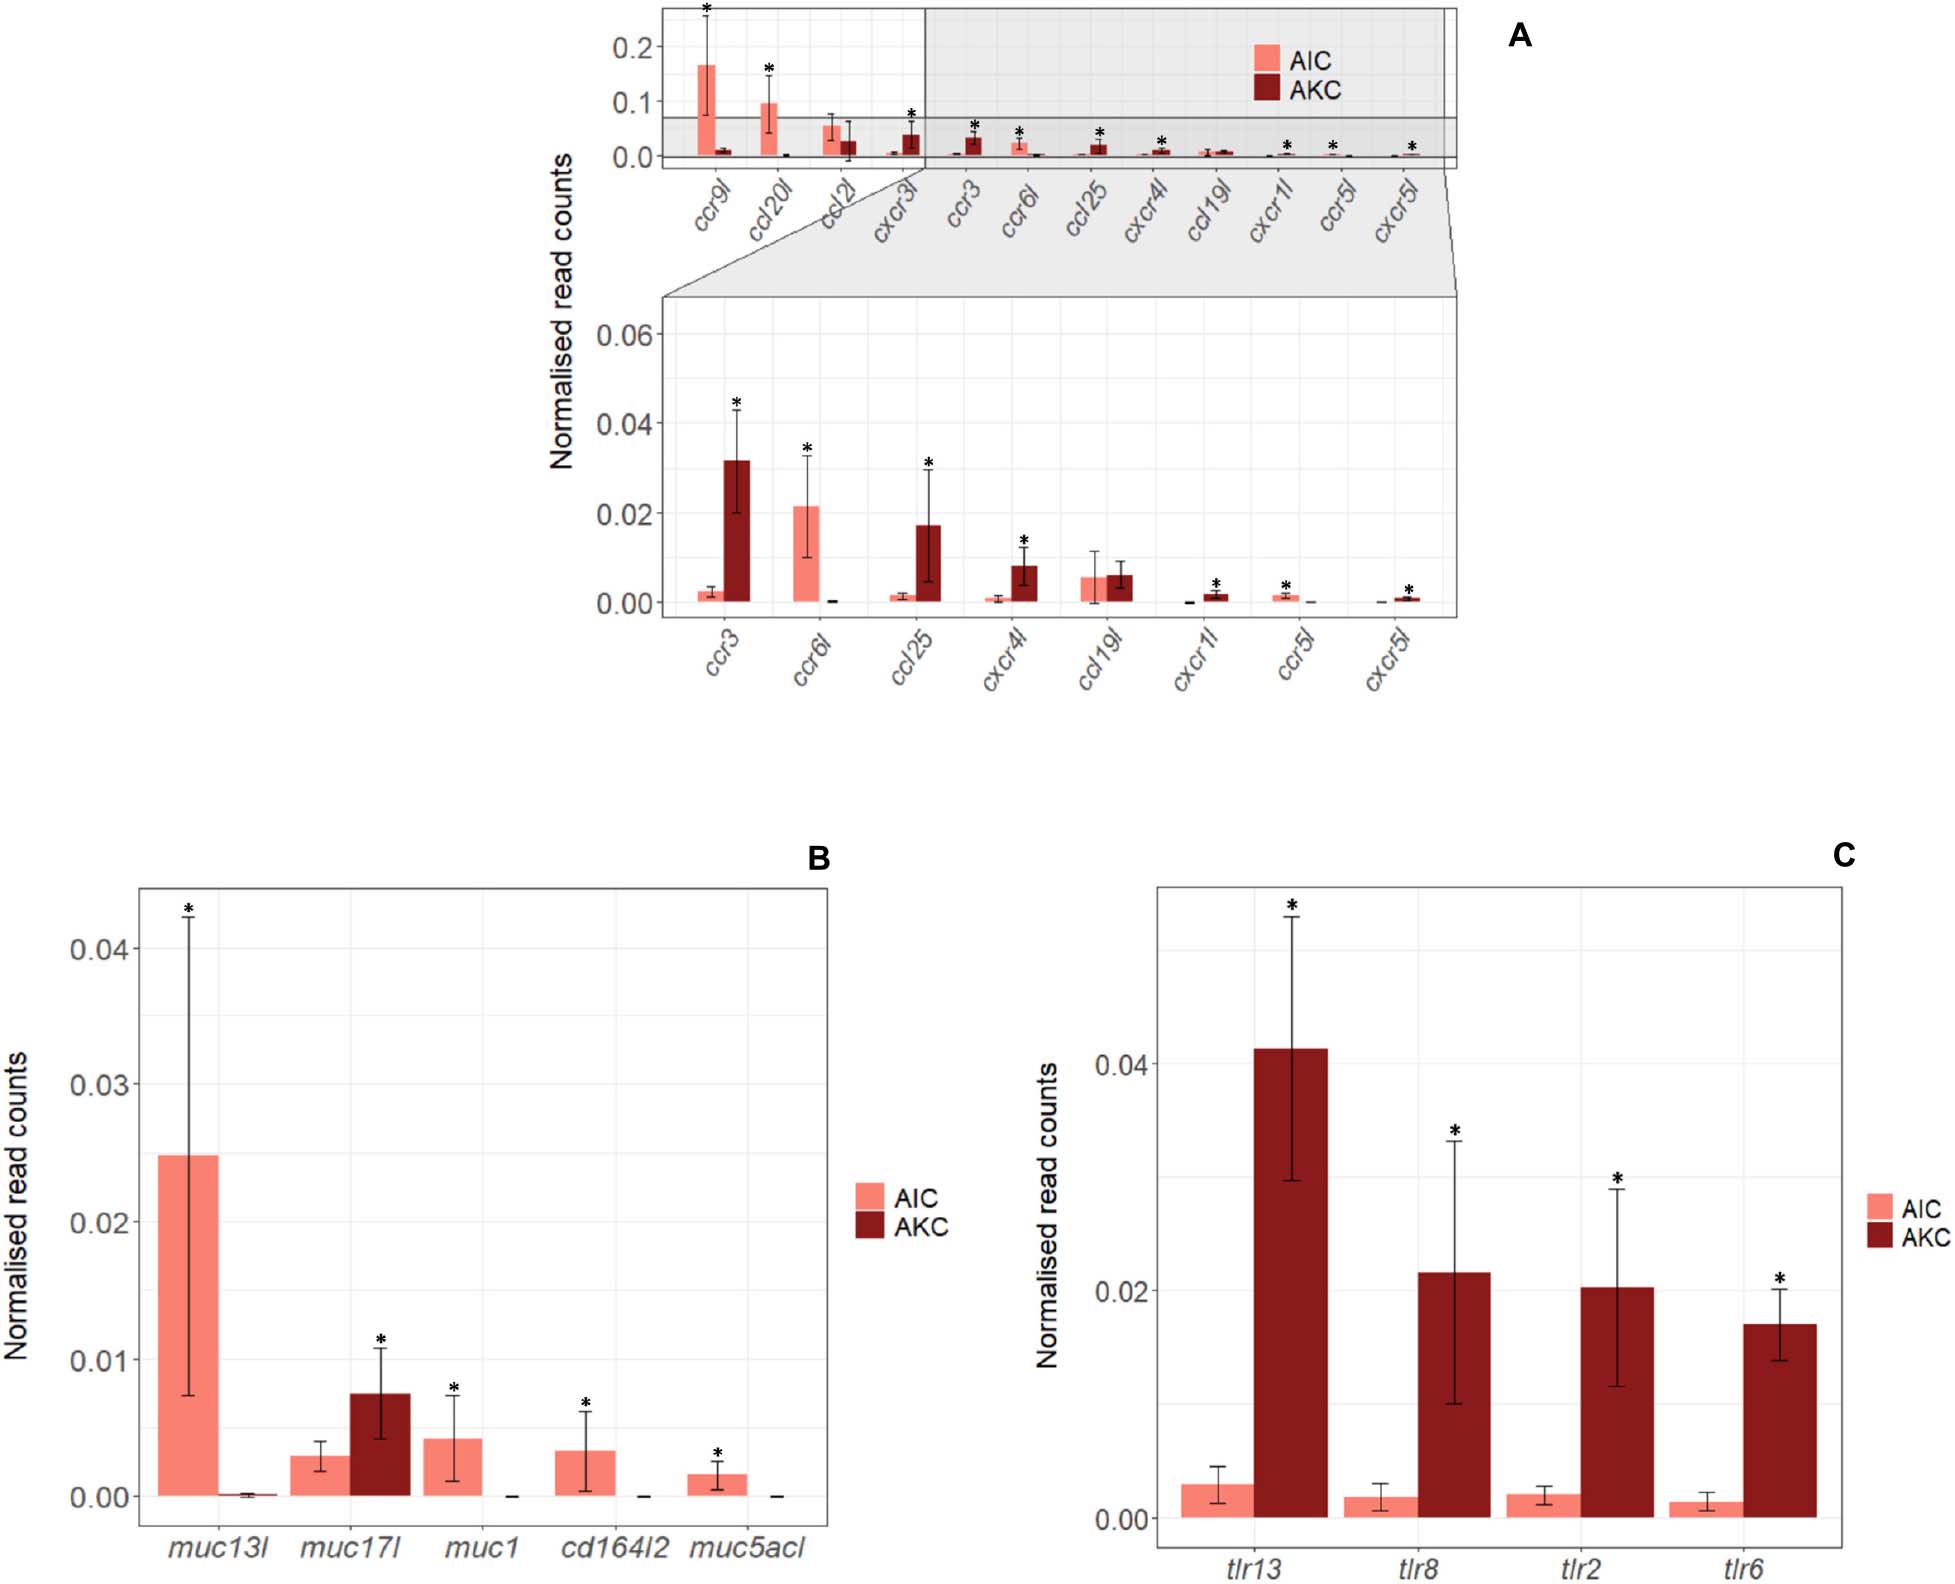
Figure 8. The expression of genes related to chemokines, mucins and toll-like receptors in the adherent cells from Atlantic salmon distal intestine and head kidney. Employing the normalized read counts from DESeq2 analyses, the expression of genes related to chemokines (A), mucins (B) and toll-like receptors (C) in the adherent cells from salmon distal intestine (AIC) and head kidney (AKC) were compared. Statistically significant differences (p < 0.05) are indicated using asterisks. Bar plots show the mean ± SD (n = 6).
The expression of 9 immune-related genes for mucin and toll-like receptor (TLR) were also compared to understand the differences in AIC and AKC (Figures 8B,C). Mucin-related genes (muc13l, muc1, cd164l2, and muc5acl) were mainly expressed in AIC but several TLR genes (tlr13, tlr8, tlr2 and tlr6) were not predominantly expressed in AIC.
Hierarchical clustering-based heatmap along with the boxplot annotation shown in Figure 9 reveals the gene profiles associated with AIC and AKC. Although the expression of the genes associated with AKC macrophages was significantly higher than those of AIC, both showed predominantly higher expression of the macrophage-specific genes than those of other cell types such as T and B cells.

Figure 9. Heatmap of the expression of selected genes in the adherent cells from Atlantic salmon distal intestine and head kidney. Box plots indicate the expression of genes related to macrophages, dendritic cells, endothelial cells, T and B cells. The color gradient from light yellow to dark red in the heatmap indicates increasing transcript levels.
The intestine has a key role in sustaining the health of fishes. Various cells in the intestine act in harmony to maintain the local (Okumura and Takeda, 2016) as well as systemic homeostasis (Biteau et al., 2011; Ramakrishnan et al., 2019). Of these cells, the GALT cells are imperative in responding to antigens, both benign and pathogenic. The immune cells that are developed in the main lymphoid site enter the circulation, and along with the GALT cells they surveil the host immune status. In the present study, we obtained leukocytes from DI and HK of Atlantic salmon and then separated the adherent cells from the two cell populations.
Employing IFC, we examined the phagocytic activity of the adherent intestine cells and compared it with those of adherent head kidney cells. We also examined the expression of immunologically relevant genes through RNA-Seq of the cells from the two key immune organs of Atlantic salmon.
AIC had distinct cell population; the cells were less diverse than the whole leukocyte population. Other researchers were also able to isolate cells from the intestine of Atlantic salmon (Attaya et al., 2018) and gilthead seabream (Salinas et al., 2007), but they did not specifically examine adherent cells. The major phagocytes in vertebrates are neutrophils, monocytes, macrophages, mast cells, and immature dendritic cells (Robinson and Babcock, 1998). In the present study, we confirmed the phagocytic ability of AIC, which had different shapes compared with those of AKC. Unlike monocyte-derived macrophages which have mainly stretched shapes, the AIC appeared larger and rounded as shown in a mice study (Vereyken et al., 2011). Rombout et al. (1998) reported that the carp intestinal cells are diverse compared to the cells from other immunological tissues such as spleen and head kidney. In addition to many round-shaped cells, the oval shaped phagocytes, similar to the ones we observed, are reported as endothelial cells in mammals, and they were shown to have the ability to internalize pathogenic bacteria (Rengarajan et al., 2016). Furthermore, Lindell et al. (2012) showed that oval-shaped skin epithelial cells in trout can perform phagocytosis of Vibrio anguillarum. However, their identity has to be validated by employing specific cell markers. As for the doublets in the adherent cells, the phagocytes in them resembled macrophage-like cells (R1, Figure 1A) while the interacting small cells had a morphology similar to that of lymphocytes. A study that investigated mouse intestinal cells using imaging flow cytometry (Zhao et al., 2014) indicated that similar doublets consisted of CD103+ intestinal dendritic cells and CD4+ T cells. From our results, we infer that the oval-shaped cells similar to endothelial cells or epithelial cells with phagocytic ability may have special roles in mucosal immune system. In addition, the presence of the doublets indicates the interaction between phagocytes and lymphocyte-like cells that cooperate with them in immune defense.
In the present study, considering the phagocytic ability and high expression levels of macrophage genes in AIC we presume that majority of cell types in AIC are macrophages. Salmon macrophages can be effectively harvested after culturing adherent cells from HK (Paulsen et al., 2001). The presence of macrophages in adherent cells from fish intestine and their phagocytic properties have not been reported yet. In the present study, high levels of TNF-related genes (tnfrsf10a, tnfsf11, traf2 and tnfsf6b) and TGFβ receptors (tgfbr1 and tgfbr2) in AIC can be linked to activation and proliferation of macrophages (Luckett-Chastain et al., 2016; Yu et al., 2017) and T cells (McKarns and Schwartz, 2005; Mehta et al., 2018) while high levels of il1 and il6 in AKC can be linked to the classical activation of macrophages (Luckett-Chastain et al., 2016). We have also found that the expression of eight macrophage-related genes (h2-eb1, cd74, cd68, marco, capg, mpeg1, cd200r1, and csf1r) was highest in AIC among selected cell type linked genes (Figure 9) although the expression in AKC was significantly higher than those of AIC (Figure 5). Our results are in agreement with another HK transcriptomic study; carp HK macrophage-like cells had higher expression of cd68 and mcsfr compared to those of HK leukocytes (Hu et al., 2018). Furthermore, a study conducted by Jenberie et al. (2018) revealed the higher expressions of csf1r and marco in HK macrophage-like cells. Another salmon study indicated the higher expression of MHCIIβ in the adherent cells from the head kidney (Iliev et al., 2019), and we found that the expression of h2-eb1 gene was higher in AKC. This gene in association with MHC class II plays a role in the processing and presentation of antigens (Adamus et al., 2012), and teleost mucosa has major T cells receptors (TCR) such as TCRαβ and TCRγδ, and their respective co-receptors, namely CD4 and CD8, which facilitate antigen recognition (Toda et al., 2011). The presence of T cells in fish intestine was reported years ago by Rombout et al. (1998). Another study (Romano et al., 2007) also indicated the abundance of T cells and TCRβ+ lymphocytes in the posterior intestine and mid-intestine of seabass, respectively. In addition, CD3ε+ cells are abundant in salmonid immune organs including intestine (Koppang et al., 2010). Our results about the higher expression of T cell-related genes and h2-eb1 in AIC and the doublets could be pointing to the cooperation between the adherent cell populations. AIC had higher expression of chemokines, probably those related to T cells. Furthermore, three chemokines (ccr9l, ccl20l, and ccr6l) were dominantly expressed in AIC. It has been reported that mammalian CD4+ T cells express ccr9 (Cosorich et al., 2019) while ccl20 and ccr6 are expressed on CD8+ T cell (Kondo et al., 2007; Kish, 2015). The chemokines that are highly expressed in AKC are related to macrophage activation: teleost macrophage-like cells express cxcr3l (Lu et al., 2017), ccl25 (Aquilino et al., 2016) and cxcr4l (Chia et al., 2018) while mammalian macrophages express ccr3 (Park et al., 1999). In present study, higher expression levels of ccr9l, ccl20l, and ccr6l may be indicating the presence of T cells in AIC. Furthermore, considering our hypothesis that the adherent cells could be mainly phagocytes, the expression of T cell-related genes in the intestine could be suggestive of their critical role in mucosal immune system. A study on zebrafish (Wan et al., 2017) showed that γδ T cells which are generally abundant in the intestinal epithelium have potent phagocytic ability. In addition, the phagocytic activity of AIC and the finding of a previous study on the ability of oval-shaped mammalian endothelial cells to internalize pathogens (Rengarajan et al., 2016) likely indicate the phagocytic property of endothelial cells in AIC. We found that AIC had significantly higher expression of endothelial genes (ecscr and cd151l) while AKC had higher expression of pecam gene. Both ecscr and cd151 are known as general signatures of mammalian endothelial cells (Verma et al., 2010; Yang et al., 2017) though they have not yet been reported in fish. On the other hand, pecam (or cd31) is a gene associated with endothelial cell adhesion molecule and it was highly expressed within blood vascular compartment (Privratsky and Newman, 2014). Furthermore, the presence of the mucin-like receptor, cd164 could be an indication of the ability of certain cells in AIC to adhere to endothelial cells (Havens et al., 2006).
In summary, employing IFC and transcriptomics, we were able to characterize the adherent cell populations from DI, based on the genes reported as specific to certain cell types. AIC had different-shaped phagocytes and expressed genes associated with macrophages, T cells, and endothelial-like cells. Overall (selected) gene profiles show that AIC predominantly express macrophage-related genes. Further investigation on the transcriptomic responses of the intestinal cells to different antigens will help to expand our understanding of their crosstalk at the mucosal surfaces in teleosts.
The obtained raw sequencing data was deposited in the Gene Expression Omnibus (GEO, NCBI); the accession number is GSE154142.
The animal study was reviewed and approved by National Animal Research Authority in Norway (Mattilsynet; FOTS ID 10050).
YP, JF, and VK conceived and designed the study. YP performed the experiments on the cells and wrote the first draft of the manuscript. YP and QZ conducted RNA sequencing and data analysis. GW provided suggestions to improve the manuscript. YP, QZ, GW, JF, and VK read, revised and approved the manuscript for submission. All authors contributed to the article and approved the submitted version.
The INFISH project (272004) funded by the Regionale Forskningsfond Nord-Norge partly supported this study. YP is a recipient of the Korean Government Scholarship—National Institute for International Education, South Korea.
The authors declare that the research was conducted in the absence of any commercial or financial relationships that could be construed as a potential conflict of interest.
The authors, especially YP, is grateful to Bisa Saraswathy for her valuable support in data analyses, discussions and comments on the manuscript. The authors would like to thank the staff at the Research Station, Nord University for their help in the laboratory.
The Supplementary Material for this article can be found online at: https://www.frontiersin.org/articles/10.3389/fcell.2020.580848/full#supplementary-material
Supplementary Figure 1 | Dispersion estimation plot. The plot indicates the shrinkage of the gene-wise dispersions.
Supplementary Table 1 | Details of raw reads, cleaned reads and mapped reads from different samples.
Adamus, G., Brown, L., Andrew, S., Meza-Romero, R., Burrows, G. G., and Vandenbark, A. A. (2012). Neuroprotective effects of recombinant T-cell receptor ligand in autoimmune optic neuritis in HLA-DR2 mice. Invest. Ophthalmol. Vis. Sci. 53, 406–412. doi: 10.1167/iovs.11-8419
Andrews, S. (2010). FastQC: A Quality Control Tool for High Throughput Sequence Data. Babraham Bioinformatics. Cambridge: Babraham Institute.
Aquilino, C., Granja, A. G., Castro, R., Wang, T., Abos, B., Parra, D., et al. (2016). Rainbow trout CK9, a CCL25-like ancient chemokine that attracts and regulates B cells and macrophages, the main antigen presenting cells in fish. Oncotarget 7, 17547–17564. doi: 10.18632/oncotarget.8163
Attaya, A., Wang, T., Zou, J., Herath, T., Adams, A., Secombes, C. J., et al. (2018). Gene expression analysis of isolated salmonid GALT leucocytes in response to PAMPs and recombinant cytokines. Fish Shellf. Immunol. 80, 426–436. doi: 10.1016/j.fsi.2018.06.022
Bernard, D., Six, A., Rigottier-Gois, L., Messiaen, S., Chilmonczyk, S., Quillet, E., et al. (2006). Phenotypic and functional similarity of gut intraepithelial and systemic T cells in a teleost fish. J. Immunol. 176, 3942–3949. doi: 10.4049/jimmunol.176.7.3942
Biteau, B., Hochmuth, C. E., and Jasper, H. (2011). Maintaining tissue homeostasis: dynamic control of somatic stem cell activity. Cell Stem Cell 9, 402–411. doi: 10.1016/j.stem.2011.10.004
Braniste, T., Tiginyanu, I., Horvath, T., Raevschi, S., Cebotari, S., Lux, M., et al. (2016). Viability and proliferation of endothelial cells upon exposure to GaN nanoparticles. Beilstein J. Nanotechnol. 7, 1330–1337. doi: 10.3762/bjnano.7.124
Chia, K., Mazzolini, J., Mione, M., and Sieger, D. (2018). Tumor initiating cells induce Cxcr4-mediated infiltration of pro-tumoral macrophages into the brain. eLife 7:e31918.
Cosorich, I., Mcguire, H. M., Warren, J., Danta, M., and King, C. (2019). CCR9 expressing T helper and T follicular helper cells exhibit site-specific identities during inflammatory disease. Front. Immunol. 9:2899. doi: 10.3389/fimmu.2018.02899
Geven, E. J., and Klaren, P. H. (2017). The teleost head kidney: integrating thyroid and immune signalling. Dev. Compar. Immunol. 66, 73–83. doi: 10.1016/j.dci.2016.06.025
Havens, A. M., Jung, Y., Sun, Y. X., Wang, J., Shah, R. B., Bühring, H. J., et al. (2006). The role of sialomucin CD164 (MGC-24v or endolyn) in prostate cancer metastasis. BMC Cancer 6:195. doi: 10.1186/1471-2407-6-195
Hu, Y., Wei, X., Liao, Z., Gao, Y., Liu, X., Su, J., et al. (2018). Transcriptome analysis provides insights into the markers of resting and LPS-activated macrophages in grass carp (Ctenopharyngodon idella). Intern. J. Mol. Sci. 19:3562. doi: 10.3390/ijms19113562
Iliev, D. B., Lagos, L., Thim, H. L., Jørgensen, S. M., Krasnov, A., and Jørgensen, J. B. (2019). CpGs induce differentiation of Atlantic salmon mononuclear phagocytes into cells with dendritic morphology and a proinflammatory transcriptional profile but an exhausted allostimulatory activity. Front. Immunol. 10:378. doi: 10.3389/fimmu.2019.00378
Iliev, D. B., Thim, H., Lagos, L., Olsen, R., and Jørgensen, J. (2013). Homing of antigen-presenting cells in head kidney and spleen-salmon head kidney hosts diverse APC types. Front. Immunol. 4:137. doi: 10.3389/fimmu.2018.00137
Jenberie, S., Thim, H. L., Sunyer, J. O., Skjødt, K., Jensen, I., and Jørgensen, J. B. (2018). Profiling Atlantic salmon B cell populations: CpG-mediated TLR-ligation enhances IgM secretion and modulates immune gene expression. Sci. Rep. 8, 1–12. doi: 10.1038/s41598-018-21895-9
Joerink, M., Ribeiro, C. M., Stet, R. J., Hermsen, T., Savelkoul, H. F., and Wiegertjes, G. F. (2006). Head kidney-derived macrophages of common carp (Cyprinus carpio L.) show plasticity and functional polarization upon differential stimulation. J. Immunol. 177, 61–69. doi: 10.4049/jimmunol.177.1.61
Khalili, A. A., and Ahmad, M. R. (2015). A review of cell adhesion studies for biomedical and biological applications. Intern. J. Mol. Sci. 16, 18149–18184. doi: 10.3390/ijms160818149
Kihara, H., Kim, D. M., Nagai, M., Nojiri, T., Nagai, S., Chen, C.-Y., et al. (2018). Epithelial cell adhesion efficacy of a novel peptide identified by panning on a smooth titanium surface. Intern. J. Oral Sci. 10, 1–8. doi: 10.1038/s41368-018-0022-1
Kish, D. (2015). Roles of the CCL20-CCR6 axis and CXCR3 in CD8 T cell-mediated contact hypersensitivity (CCR5P. 211). J. Immunol. 194:186.13.
Kondo, T., Takata, H., and Takiguchi, M. (2007). Functional expression of chemokine receptor CCR6 on human effector memory CD8+ T cells. Eur. J. Immunol. 37, 54–65. doi: 10.1002/eji.200636251
Koppang, E. O., Fischer, U., Moore, L., Tranulis, M. A., Dijkstra, J. M., Köllner, B., et al. (2010). Salmonid T cells assemble in the thymus, spleen and in novel interbranchial lymphoid tissue. J. Anat. 217, 728–739. doi: 10.1111/j.1469-7580.2010.01305.x
Kratofil, R. M., Kubes, P., and Deniset, J. F. (2017). Monocyte conversion during inflammation and injury. Arterioscler. Thromb. Vasc. Biol. 37, 35–42. doi: 10.1161/atvbaha.116.308198
Li, J., Barreda, D. R., Zhang, Y.-A., Boshra, H., Gelman, A. E., Lapatra, S., et al. (2006). B lymphocytes from early vertebrates have potent phagocytic and microbicidal abilities. Nat. Immunol. 7, 1116–1124. doi: 10.1038/ni1389
Lindell, K., Fahlgren, A., Hjerde, E., Willassen, N.-P., Fällman, M., and Milton, D. L. (2012). Lipopolysaccharide O-antigen prevents phagocytosis of Vibrio anguillarum by rainbow trout (Oncorhynchus mykiss) skin epithelial cells. PLoS One 7:e37678. doi: 10.1371/journal.pone.0037678
Love, M. I., Huber, W., and Anders, S. (2014). Moderated estimation of fold change and dispersion for RNA-seq data with DESeq2. Genome Biol. 15:550. doi: 10.1186/s13059-014-0550-8
Lu, X.-J., Chen, Q., Rong, Y.-J., Chen, F., and Chen, J. (2017). CXCR3. 1 and CXCR3. 2 differentially contribute to macrophage polarization in teleost fish. J. Immunol. 198, 4692–4706. doi: 10.4049/jimmunol.1700101
Luckett-Chastain, L., Calhoun, K., Schartz, T., and Gallucci, R. M. (2016). IL-6 influences the balance between M1 and M2 macrophages in a mouse model of irritant contact dermatitis. J. Immunol. 196:196.17.
McKarns, S. C., and Schwartz, R. H. (2005). Distinct effects of TGF-β1 on CD4+ and CD8+ T cell survival, division, and IL-2 production: a role for T cell intrinsic Smad3. J. Immunol. 174, 2071–2083. doi: 10.4049/jimmunol.174.4.2071
McMillan, D. N., and Secombes, C. J. (1997). Isolation of rainbow trout (Oncorhynchus mykiss) intestinal intraepithelial lymphocytes (IEL) and measurement of their cytotoxic activity. Fish Shellf. Immunol. 7, 527–541. doi: 10.1006/fsim.1997.0099
Mehta, A. K., Gracias, D. T., and Croft, M. (2018). TNF activity and T cells. Cytokine 101, 14–18. doi: 10.1016/j.cyto.2016.08.003
Okumura, R., and Takeda, K. (2016). Maintenance of gut homeostasis by the mucosal immune system. Proc. Jpn. Acad. Ser. B 92, 423–435. doi: 10.2183/pjab.92.423
Park, I.-W., Koziel, H., Hatch, W., Li, X., Du, B., and Groopman, J. E. (1999). CD4 receptor-dependent entry of human immunodeficiency virus type-1 env-pseudotypes into CCR5-, CCR3-, and CXCR4-expressing human alveolar macrophages is preferentially mediated by the CCR5 coreceptor. Am. J. Respir. Cell Mol. Biol. 20, 864–871. doi: 10.1165/ajrcmb.20.5.3547
Park, Y., Abihssira-García, I. S., Thalmann, S., Wiegertjes, G. F., Barreda, D. R., Olsvik, P. A., et al. (2020). Imaging flow cytometry protocols for examining phagocytosis of microplastics and bioparticles by immune cells of aquatic animals. Front. Immunol. 11:203. doi: 10.3389/fimmu.2018.00203
Parra, D., Reyes-Lopez, F. E., and Tort, L. (2015). Mucosal immunity and B cells in teleosts: Effect of vaccination and stress. Front. Immunol. 6:354. doi: 10.3389/fimmu.2018.00354
Paulsen, S. M., Engstad, R. E., and Robertsen, B. (2001). Enhanced lysozyme production in Atlantic salmon (Salmo salar L.) macrophages treated with yeast β-glucan and bacterial lipopolysaccharide. Fish Shellf. Immunol. 11, 23–37. doi: 10.1006/fsim.2000.0291
Privratsky, J. R., and Newman, P. J. (2014). PECAM-1: regulator of endothelial junctional integrity. Cell Tissue Res. 355, 607–619. doi: 10.1007/s00441-013-1779-3
Ramakrishnan, S. K., Zhang, H., Ma, X., Jung, I., Schwartz, A. J., Triner, D., et al. (2019). Intestinal non-canonical NFκB signaling shapes the local and systemic immune response. Nat. Commun. 10, 1–16. doi: 10.1038/s41467-019-08581-8
Rengarajan, M., Hayer, A., and Theriot, J. A. (2016). Endothelial cells use a formin-dependent phagocytosis-like process to internalize the bacterium Listeria monocytogenes. PLoS Pathog. 12:e1005603. doi: 10.1371/journal.pone.1005603
Robinson, J. P., and Babcock, G. F. (1998). Phagocyte Function: A Guide for Research and Clinical Evaluation. New York, NY: Wiley-Liss.
Romano, N., Rossi, F., Abelli, L., Caccia, E., Piergentili, R., Mastrolia, L., et al. (2007). Majority of TcRβ+ T-lymphocytes located in thymus and midgut of the bony fish, Dicentrarchus labrax (L.). Cell Tissue Res. 329, 479–489. doi: 10.1007/s00441-007-0429-z
Rombout, J., Joosten, P., Engelsma, M., Vos, A., Taverne, N., and Taverne-Thiele, J. (1998). Indications for a distinct putative T cell population in mucosal tissue of carp (Cyprinus carpio L.). Dev. Compar. Immunol. 22, 63–77. doi: 10.1016/s0145-305x(97)00048-7
Rombout, J. H., Abelli, L., Picchietti, S., Scapigliati, G., and Kiron, V. (2011). Teleost intestinal immunology. Fish Shellf. Immunol. 31, 616–626. doi: 10.1016/j.fsi.2010.09.001
Salinas, I., Meseguer, J., and Esteban, M. (2007). Assessment of different protocols for the isolation and purification of gut associated lymphoid cells from the gilthead seabream (Sparus aurata L.). Biol. Proc. 9:43. doi: 10.1251/bpo132
Selvarajan, K., Moldovan, L., Chandrakala, A. N., Litvinov, D., and Parthasarathy, S. (2011). Peritoneal macrophages are distinct from monocytes and adherent macrophages. Atherosclerosis 219, 475–483. doi: 10.1016/j.atherosclerosis.2011.09.014
Shimizu, Y., Newman, W., Gopal, T. V., Horgan, K. J., Graber, N., Beall, L. D., et al. (1991). Four molecular pathways of T cell adhesion to endothelial cells: Roles of LFA-1, VCAM-1, and ELAM-1 and changes in pathway hierarchy under different activation conditions. J. Cell Biol. 113, 1203–1212. doi: 10.1083/jcb.113.5.1203
Toda, H., Saito, Y., Koike, T., Takizawa, F., Araki, K., Yabu, T., et al. (2011). Conservation of characteristics and functions of CD4 positive lymphocytes in a teleost fish. Dev. Compar. Immunol. 35, 650–660. doi: 10.1016/j.dci.2011.01.013
Vereyken, E. J., Heijnen, P. D., Baron, W., De Vries, E. H., Dijkstra, C. D., and Teunissen, C. E. (2011). Classically and alternatively activated bone marrow derived macrophages differ in cytoskeletal functions and migration towards specific CNS cell types. J. Neuroinflamm. 8:58. doi: 10.1186/1742-2094-8-58
Verma, A., Bhattacharya, R., Remadevi, I., Li, K., Pramanik, K., Samant, G. V., et al. (2010). Endothelial cell-specific chemotaxis receptor (ecscr) promotes angioblast migration during vasculogenesis and enhances VEGF receptor sensitivity. Blood J. Am. Soc. Hematol. 115, 4614–4622. doi: 10.1182/blood-2009-10-248856
Wan, F., Hu, C.-B., Ma, J.-X., Gao, K., Xiang, L.-X., and Shao, J.-Z. (2017). Characterization of γδ T cells from zebrafish provides insights into their important role in adaptive humoral immunity. Front. Immunol. 7:675. doi: 10.3389/fimmu.2018.00675
Yang, X., Li, S., Zhong, J., Zhang, W., Hua, X., Li, B., et al. (2017). CD151 mediates netrin-1-induced angiogenesis through the Src-FAK-Paxillin pathway. J. Cell. Mol. Med. 21, 72–80. doi: 10.1111/jcmm.12939
Yi, H.-J., and Lu, G.-X. (2012). Adherent and non-adherent dendritic cells are equivalently qualified in GM-CSF, IL-4 and TNF-α culture system. Cell. Immunol. 277, 44–48. doi: 10.1016/j.cellimm.2012.05.014
Yu, X., Buttgereit, A., Lelios, I., Utz, S. G., Cansever, D., Becher, B., et al. (2017). The cytokine TGF-β promotes the development and homeostasis of alveolar macrophages. Immunity 47, 903–912. doi: 10.1016/j.immuni.2017.10.007
Zhang, Q., Kopp, M., Babiak, I., and Fernandes, J. M. (2018). Low incubation temperature during early development negatively affects survival and related innate immune processes in zebrafish larvae exposed to lipopolysaccharide. Sci. Rep. 8, 1–14. doi: 10.1038/s41598-018-22288-8
Zhao, W., Minderman, H., and Russell, M. W. (2014). Identification and characterization of intestinal antigen-presenting cells involved in uptake and processing of a nontoxic recombinant chimeric mucosal immunogen based on cholera toxin using imaging flow cytometry. Clin. Vaccine Immunol. 21, 74–84. doi: 10.1128/CVI.00452-13
Keywords: adherent, intestinal cells, ImageStream®X, Atlantic salmon, phagocytosis, RNA-Seq, macrophages
Citation: Park Y, Zhang Q, Wiegertjes GF, Fernandes JMO and Kiron V (2020) Adherent Intestinal Cells From Atlantic Salmon Show Phagocytic Ability and Express Macrophage-Specific Genes. Front. Cell Dev. Biol. 8:580848. doi: 10.3389/fcell.2020.580848
Received: 07 July 2020; Accepted: 22 September 2020;
Published: 15 October 2020.
Edited by:
Yi Feng, The University of Edinburgh, United KingdomReviewed by:
Dimitar Borisov Iliev, Institute of Molecular Biology (BAS), BulgariaCopyright © 2020 Park, Zhang, Wiegertjes, Fernandes and Kiron. This is an open-access article distributed under the terms of the Creative Commons Attribution License (CC BY). The use, distribution or reproduction in other forums is permitted, provided the original author(s) and the copyright owner(s) are credited and that the original publication in this journal is cited, in accordance with accepted academic practice. No use, distribution or reproduction is permitted which does not comply with these terms.
*Correspondence: Viswanath Kiron, a2lyb24udmlzd2FuYXRoQG5vcmQubm8=
Disclaimer: All claims expressed in this article are solely those of the authors and do not necessarily represent those of their affiliated organizations, or those of the publisher, the editors and the reviewers. Any product that may be evaluated in this article or claim that may be made by its manufacturer is not guaranteed or endorsed by the publisher.
Research integrity at Frontiers

Learn more about the work of our research integrity team to safeguard the quality of each article we publish.