 Briana Mezuk
 Kristen Kelly3
 Jeannie B. Concha
95% of researchers rate our articles as excellent or good
Learn more about the work of our research integrity team to safeguard the quality of each article we publish.
Find out more
ORIGINAL RESEARCH article
Front. Clin. Diabetes Healthc. , 17 March 2023
Sec. Diabetes Multiorgan Complications
Volume 4 - 2023 | https://doi.org/10.3389/fcdhc.2023.1026402
This article is part of the Research Topic Diabetes and Depression View all 5 articles
Background: Comorbidity between depression and type 2 diabetes is thought to arise from the joint effects of psychological, behavioral, and biological processes. Studies of monozygotic twins may provide a unique opportunity for clarifying how these processes inter-relate. This paper describes the rationale, characteristics, and initial findings of a longitudinal co-twin study aimed at examining the biopsychosocial mechanisms linking depression and risk of diabetes in mid-life.
Methods: Participants in the Mood and Immune Regulation in Twins (MIRT) Study were recruited from the Mid-Atlantic Twin Registry. MIRT consisted of 94 individuals who do not have diabetes at baseline, representing 43 twin pairs (41 monozygotic and 2 dizygotic), one set of monozygotic triplets, and 5 individuals whose co-twin did not participate. A broad set of variables were assessed including psychological factors (e.g., lifetime history major depression (MD)); social factors (e.g., stress perceptions and experiences); and biological factors, including indicators of metabolic risk (e.g., BMI, blood pressure (BP), HbA1c) and immune functioning (e.g., pro- and anti-inflammatory cytokines), as well as collection of RNA. Participants were re-assessed 6-month later. Intra-class correlation coefficients (ICC) and descriptive comparisons were used to explore variation in these psychological, social, and biological factors across time and within pairs.
Results: Mean age was 53 years, 68% were female, and 77% identified as white. One-third had a history of MD, and 18 sibling sets were discordant for MD. MD was associated with higher systolic (139.1 vs 132.2 mmHg, p=0.05) and diastolic BP (87.2 vs. 80.8 mmHg, p=0.002) and IL-6 (1.47 vs. 0.93 pg/mL, p=0.001). MD was not associated with BMI, HbA1c, or other immune markers. While the biological characteristics of the co-twins were significantly correlated, all within-person ICCs were higher than the within-pair correlations (e.g., HbA1c within-person ICC=0.88 vs. within-pair ICC=0.49; IL-6 within-person ICC=0.64 vs. within-pair=0.54). Among the pairs discordant for MD, depression was not substantially associated with metabolic or immune markers, but was positively associated with stress.
Conclusions: Twin studies have the potential to clarify the biopsychosocial processes linking depression and diabetes, and recently completed processing of RNA samples from MIRT permits future exploration of gene expression as a potential mechanism.
Over the past three decades, population and clinic-based studies have established that depression and type 2 diabetes are linked over the lifespan, likely through psychological, behavioral, social and biological processes (1). Understanding these complex processes in a comprehensive manner requires innovative and integrative approaches to study design, data collection, and statistical analysis (2).
Genetically-informative study designs (i.e., designs that derive inferences about, or otherwise account for, genetic liability by comparing twins, siblings, or extended family members) provide a rigorous means to investigate exposures that cannot be randomized, either due to the intrinsic nature of the exposure (e.g., exposures that are likely to cause harm) or due to the long latency period thought to underlie the exposure-outcome relationship (e.g., early life psychosocial factors and health outcomes in mid and late-life) (3). These challenges are central to efforts to examine whether, how, and under what conditions psychosocial factors, such as depression, relate to the risk, prognosis, or outcomes of diabetes over the life course (4). Understanding the various ways that genetic and environmental factors interrelate – such as gene-environment interaction, gene-environment correlation, and epigenetic modification – to influence the comorbidity between depression and type 2 diabetes can inform intervention strategies within the precision health framework (5, 6).
One of the most widely used genetically informative study designs is the co-twin design (3). Monozygotic twins (MZ) share 100% of their genes identical by descent, are intrinsically “matched” on important individual-level confounders (e.g., sex, age, race), and are usually raised in the same household thus controlling for family-level socioeconomic and other early life factors (7). Because of this, MZ twins can be conceptualized as a naturally-occurring “counterfactual” because they essentially start life with the same set of genetic and environmental liabilities and assets, or, at the very least, are better matched on these observed – and unobserved – liabilities and assets than standard case-control studies could achieve. As a result, comparing outcomes of MZ twins provides a unique opportunity for studying how environmental exposures influence health, including questions related to the accumulation of risk and protective factors, the influence of timing of exposures, and variation in the consequences of those exposures over the life course.
Despite these conceptual strengths of the twin design, to date there have been few longitudinal twin studies focused on the relationship between depression and type 2 diabetes, particularly outside of Northern Europe (4). Existing twin studies of this comorbidity indicate little evidence of shared genetic factors between depression and diabetes (8–10), and there evidence to support a bi-directional phenotypic causation model (that is, even accounting for genetic and environmental confounders, depression is associated with increased risk of diabetes, and vice versa) (4). While population-based twin registries have the advantage of large samples, they often lack detailed assessment of psychosocial factors salient to health (e.g., mental health, stress exposure, coping, personality, health behaviors) and may also have limited biological data that could be used to identify mechanisms linking said psychosocial factors to health outcomes. Finally, being primarily limited to Northern Europe, twin registries often have limited representation of racial/ethnic minorities. In sum, there are few twin studies of middle-age and older adults that have comprehensive measurement of psychosocial factors, objective clinical assessments (i.e., biomarkers, anthropomorphic measures), and gene expression outcomes. This latter component is increasingly recognized as a mechanism by which environmental exposures become “embodied” and influence health (2, 11).
First articulated by Engel (1977) (12) and now a foundational component of health psychology (2), the biopsychosocial model provides a unified framework for considering how psychological, social, and biological aspects of health inter-relate over the life course. This model rejects the reductionist notion that the causes of complex diseases (e.g., diabetes, depression) can be solely understood as a function of biological changes. Instead, it emphasizes the importance of psychological and social factors as salient to etiopathology. In terms of how psychological factors may influence risk of type 2 diabetes, prior work has shown that depressive symptoms are correlated with biological factors such as inflammation (13–15) and hypothalamic-pituitary-adrenal (HPA) axis dysregulation (16–18), which are in turn associated with diabetes risk (19). In addition, these psychological factors are also associated with health behaviors (e.g., poor diet, physical inactivity, sleep disturbances), which are established causes of diabetes. Also, the biopsychosocial model explicitly calls for research that uses a “systems” approach, i.e., considers individuals as nested within social and physical environments, as a means of understanding these multiple determinants of health in an integrated manner (12). Finally, this model has direct implications for interventions, as it suggests there may be opportunities to modify psychosocial risk factors as a means to prevent or improve management of diabetes (20, 21).
This paper describes the rationale, design and data collection protocol, participant characteristics, and initial findings regarding psychological, social, and biological correlates of diabetes risk from the Mood and Immune Regulation in Twins (MIRT) Study, a recently completed monozygotic co-twin study recruited from the Mid-Atlantic Twin Registry (MATR). The goal of the MIRT Study was to assess whether and how depression and related psychosocial factors (e.g., stress) influence immune functioning and risk of type 2 diabetes in mid-life. This study’s detailed phenotypic and environmental measures and longitudinal biomarker and gene expression data provide a novel resource for exploring the mechanisms underlying these hypothesized etiologic relationships.
Recruitment for the MIRT Study was conducted through the Mid-Atlantic Twin Registry (MATR), based at Virginia Commonwealth University (VCU). The MATR is the largest twin registry in the United States (22), with approximately 300,000 twin pairs recruited primarily from Virginia, North Carolina, and South Carolina. The sampling frame for MIRT was limited to complete pairs of self-identified monozygotic (MZ) twins (see Results for genetic confirmation of zygosity) aged 40 to 70 (ages when incidence of type 2 diabetes is highest), who both lived within a two-hour drive of the VCU Medical Center (a catchment area which covered the most populous counties in Virginia), where all data collection took place. Participants’ parking fees were paid for by the study, and a car service was provided for those who were unable to drive themselves. Exclusion criteria included current diagnosis of diabetes (type 1 or 2), an unstable medical condition (e.g., currently receiving treatment for cancer), or use of atypical antipsychotic medications, as these are known to influence diabetes risk.
Potential participants were identified and screened for eligibility by MATR staff by telephone; individuals were told that only complete twin pairs were eligible for the study but were not told if their co-twin had agreed to be contacted by MIRT staff to preserve confidentiality. Once contacted by MATR, if both members of the pair were willing to participate, their contact information was passed on to MIRT staff who conducted recruitment into the study and scheduling. As shown by Figure 1, contact information for 129 individuals (representing 63 complete twin pairs and one complete set of triplets) was provided to MIRT staff by the MATR. Overall, 94 individuals (representing 44 complete sib-ships) completed the baseline assessment, and of these 83 individuals (representing 37 complete sib-ships) also completed the 6-month follow-up assessment.
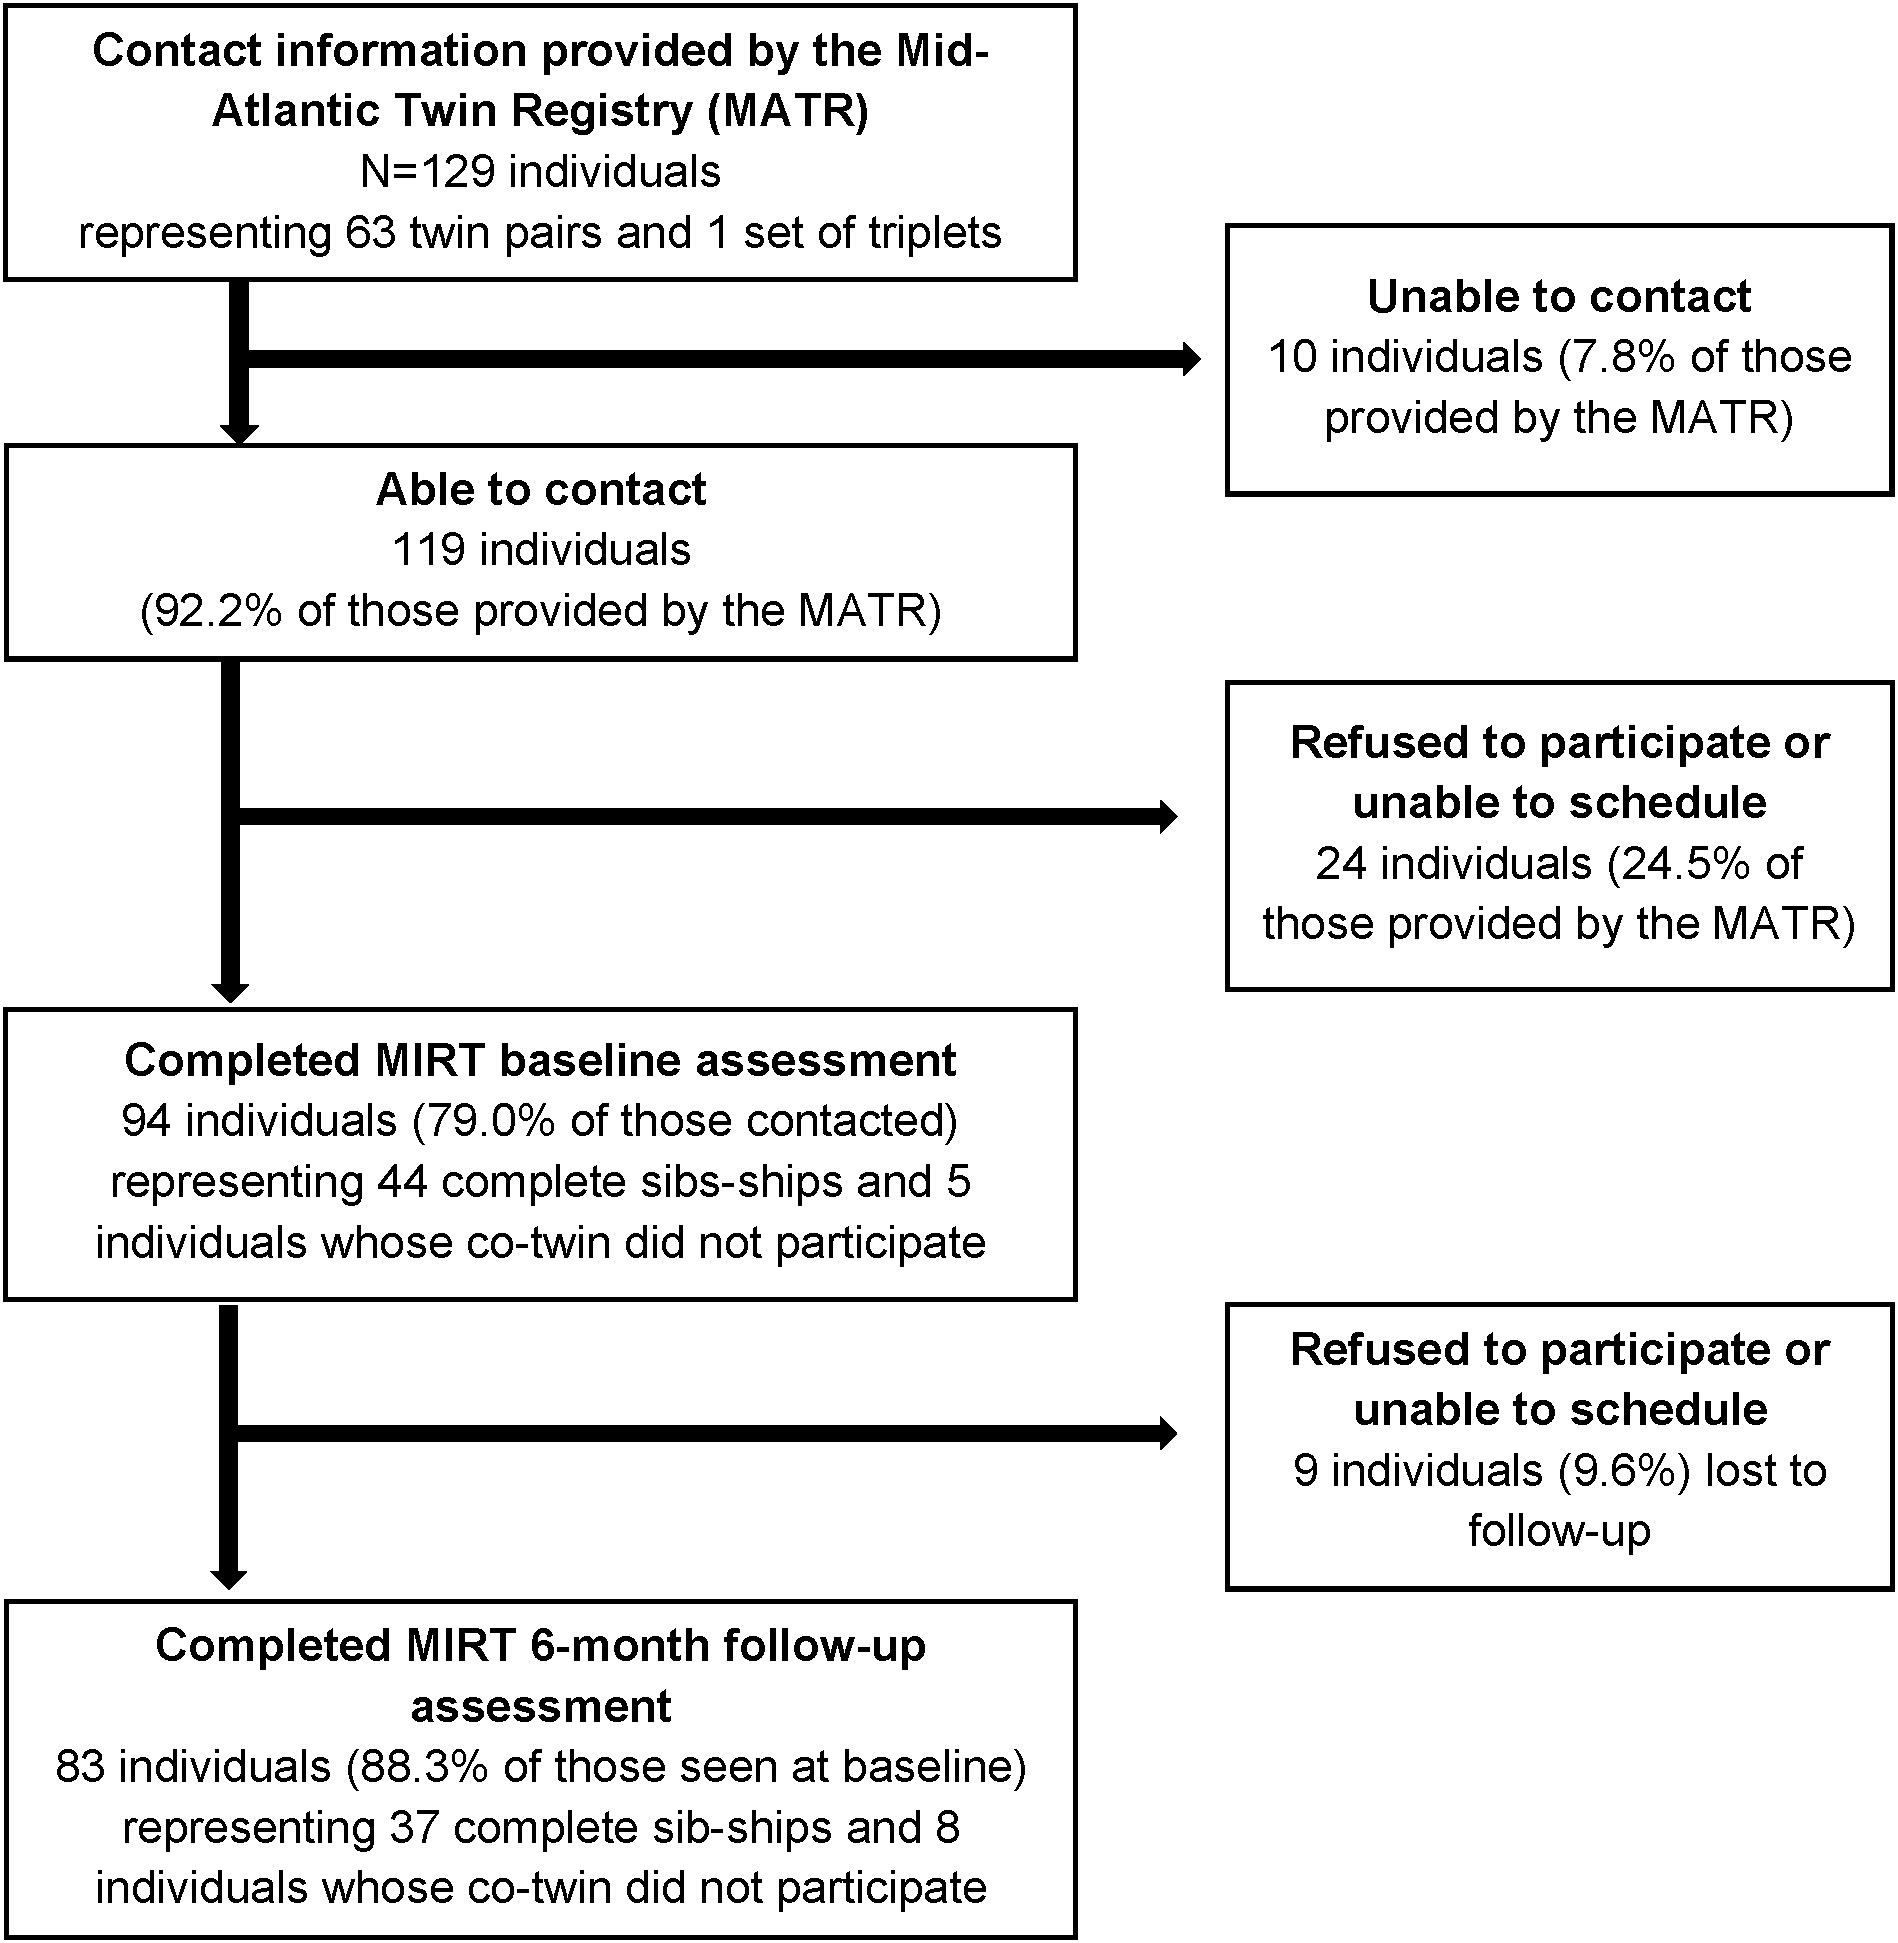
Figure 1 Flowchart of participant recruitment and retention in the Mood and Immune Regulation in Twins (MIRT) Study. Eligible and potentially interested twin pairs were first identified and screened by the MATR, which then provided their contact information to the MIRT Study team for recruitment. Sib-ships include twin pairs and one set of triplets. All participants believed themselves to be monozygotic at the time of study enrollment. Genetic testing was conducted as part of the baseline assessment to confirm zygosity, which determined that 42 of the 44 twin pairs and the sole set of triplets were indeed genetically identical. Genetic testing was not conducted on those individuals whose co-twin did not participate in the study, as DNA from both members is necessary to determine zygosity.
The MIRT study can thus be conceptualized as a two-by-two study design, in which individuals can be compared both to their co-twin at baseline, as well as to themselves at the 6-month follow-up. The 6-month follow-up period was chosen because it provides a long-enough window of time for meaningful variation in psychosocial factors (e.g., perceived stress), and thus sets the stage for future studies to examine the stability of observed relationships between psychosocial factors with gene expression, as described in more detail in the Discussion.
This study was approved by the Institutional Review Board at VCU (HM15108), and all participants provided written informed consent. Participants received a report from their clinical assessment to share with their healthcare provider and received an honorarium of $125 ($50 for the baseline assessment and $75 for the follow-up) to compensate them for their time. This manuscript was pre-registered at the Open Science Framework (23), where we also share the recruitment and data collection materials and data codebooks.
All data collection occurred at the Clinical Research Services Unit at VCU School of Medicine in Richmond, Virginia between 2014 and 2016. Participants were instructed to fast before their scheduled appointment and reported on the time and date of their last meal during the interview. After obtaining written informed consent, data collection procedures involved of two parts: first, participants underwent a clinical evaluation which included a blood draw and assessment of blood pressure (BP, measured twice using an electronic sphygmomanometer), weight and height (measured without shoes and wearing light clothing), and waist circumference (measuring using a flexible tape measure) by a trained research nurse. Afterward, participants completed an in-person interview administered by a trained research assistant. These same assessments were repeated twice: once at baseline and again approximately 6 months later. While both members of the twin pair were not required to attend the data collection procedures at the same time, many elected to do so; in all such cases, the personal interview was conducted in separate private rooms by different interviewers.
A 30cc venous blood draw was used to collect whole blood for extracting DNA to confirm zygosity status, for analysis of circulating levels of biomarkers of diabetes risk and immune functioning, and for collection of RNA to quantify gene expression. All participants believed themselves to be monozygotic at the time of study enrollment (only a handful had ever undergone genetic testing to confirm this belief). Zygosity testing was conducted by the Virginia Institute for Psychiatric and Behavioral Genetics (VIPBG) lab by comparing genotypes at 19 single nucleotide polymorphisms (SNPs). This comparison confirmed that all but two pairs were indeed MZ (i.e., identical alleles at all SNPs); the set of triplets was also confirmed to be monozygotic. The two pairs that were dizygotic (DZ) were retained for the descriptive statistics of the sample but excluded from the ICC analysis.
Markers of diabetes risk (i.e., hemoglobin A1c (HbA1c, an indicator of average blood glucose over the past 30-90 days), random glucose, and insulin) were analyzed by the VCU Pathology and Core Laboratory using standard laboratory protocols. Serum levels were measured of several immune-related biomarkers were analyzed by the Center for Biobehavioral Research at the VCU School of Nursing. These markers were chosen based on prior literature and to provide coverage of both pro- and anti-inflammatory processes (24). The markers included interleukin 6 (IL-6), soluble tumor necrosis factor receptor 2 (TNF-RII), high-sensitivity C-reactive protein (CRP), interleukin 10 (IL-10), interleukin 1 receptor antagonist (IL-1ra), and cortisol. R&D Systems Quantkine ELISA tests were used to measure CRP, IL-1ra, IL-6, IL-10, and TNF-RII. The R&D Systems Parameter Cortisol test was used to measure cortisol. Details of these tests can be found in Supplementary Table 1.
Venous blood samples for analysis of RNA were collected using Paxgene tubes and stored at VIPBG as whole blood frozen at -80 degrees Celsius until being shipped to the University of Michigan (UM), where the UM Central Biorepository performed RNA extraction. RNA was then delivered to the UM Advanced Genomics Core, where they underwent Qiagen 3’ UPX library preparation (25), a library preparation method that captures only the 3’ end of each transcript, allowing for accurate quantification of expression without transcript length bias (26). Six samples had a concentration less than 10ng and increased via bead purify to before UPX library preparation. This was followed by RNA sequencing on an Illumina NovaSeq 6000 S1 device (27). To eliminate the influence of batch effects on within-pair comparisons, for each participant both their baseline and 6-month follow-up samples, and those of their co-twin, were assigned to the same batch; this was done for both library preparation and RNA sequencing. This assignment reflects our prioritization of within-sibship comparisons, since within-sibship comparisons will allow future analyses to make inferences about the association between MD and gene expression in individuals matched for genotype and early-life factors.
After completing the clinical assessment and blood draw with the research nurse, participants were taken into a private room where they were offered a snack and water and then underwent a personal interview administered by a trained research assistant. The interview took an average of 60 minutes to complete. It assessed a range of topics including demographic and economic characteristics, history of major depression, health-related behaviors (e.g., tobacco use, alcohol use, diet, physical activity, sleep), personality, medication use, exposure to stress, coping strategies, neighborhood characteristics, and personal and family history of health conditions. The MIRT survey instruments are provided in an Open Science repository (https://osf.io/3mxuv).
Depression. Lifetime history of major depression (MD) was measured at the baseline assessment only using the Diagnostic Interview Schedule (DIS) (28). The DIS is a full-structured diagnostic interview that assesses the criteria for MD according to the Diagnostic and Statistical Manual of Mental Disorders-IV (DSM-IV). These criteria include the nine symptom groups (i.e., dysphoria, anhedonia, sleeping disturbances, appetite disturbances, fatigue, concentration problems, psychomotor agitation/retardation, guilt/worthlessness, and preoccupation with death/suicidal ideation) as well as indicators of onset, recency, and impairment due to those symptoms. While there is no gold standard for measurement of MD, the DIS has moderate concordance with assessment of MD as compared to clinical psychiatric interviews (28). Although the version of the DIS used was designed for the DSM-IV, the only change in the diagnostic criteria for MD from DSM IV to 5 was that the latter removed the bereavement exclusion (29), and for this study we did not apply the bereavement exclusion in our scoring determination of lifetime MD. In addition to the DIS, participants were asked if they had any first-degree relatives with a history of depression (coded yes/no).
Stress. Two measures of stress exposure, were drawn from the PhenX Toolkit, a NIH-supported archive of psychosocial measures for use in genetics research (30). These measures included the Perceived Stress Scale (PSS) and a modified version of the Chronic Stress Scale (CSS) and were assessed at both baseline and 6-month follow-up interviews. The PSS consists of 10 items (Cronbach’s α=0.89) that assess general stress perceptions during the past 30 days, each on a five-point Likert scale ranging from Never to Very Often (31). The PSS does not ask about specific domains (i.e., items are asked about “difficult, stressful times” generally, and do not reference specific situations such as work, relationships, etc.). The PSS asks about the psychological appraisal of stressful situations (e.g., items ask about being unable to control important things, feeling overwhelmed, feeling nervous or “stressed”). In comparison, the CSS asks about experiences that many people find stressful across 11 life domains: general, finances, work, romantic relationships (partners, divorce/separated, non-partnered), social life, social isolation, family relationships/parenthood, residence/housing, and family health/caregiving using 47 items (see Supplemental Table 2). Items in the CSS are each measured on a three-point Likert scale in which each situation is rated as Not true, Somewhat True, or Very True for them at this time. However, respondents are not asked to rate their psychological appraisal of those situations (e.g., that is, they are not asked how stressed that situation makes them feel). The CSS generates both domain-specific and overall average scores, and for this analysis we used only the overall score (30).
Demographic characteristics. Demographic characteristics were assessed by self-report and included age (measured in years), sex (male, female), race (white, black), educational attainment (measured as highest schooling completed:<high school, high school, some college, college degree, and graduate/professional degree), annual household income (categorized as<$50,000, $50,000 to<$100,000, $100,000 to<$150,000 and ≥$150,000, based on the sample distribution), employment status (categorized as working full-time, working part-time, retired, and other), and marital status (categorized as married/cohabitating and not married (i.e., divorced/separated, widowed, or never married), based on the sample distribution).
Descriptive characteristics were calculated using measures of central tendency, both for the sample overall and stratified by lifetime history of MD. Variation as a function of history of MD was evaluated using t-tests or Mann-Whitney U tests, as appropriate, for continuous variables and Fisher’s exact tests for categorical variables. Intraclass correlation coefficients (ICCs) were calculated using mixed models with random intercepts for sibship and for person-within-sibship. To compare the role of sibship-level and individual-level effects, we calculated two ICCs: ICCsibship () and ICCsibship+person (). Both ICCs were calculated using only sibships with complete data for both baseline and follow-up assessments. Values were log-transformed, as needed, to normalize distributions.
While this analysis is exploratory in nature, based on prior literature the overall expectations were that lifetime history of MD would be: 1) positively correlated with the measures of stress, 2) positively correlated with indicators of inflammation (e.g., higher IL-6, lower IL-1ra), and 3) positively correlated with indicators of diabetes risk (e.g., higher HbA1c). In addition, twins were expected to be highly correlated with each other on all these measures (both at baseline and over the 6-month follow-up period), but with lower correlations for psychosocial factors (e.g., stress scores) than biological factors (e.g., indicators of immune functioning), due to their unique environmental exposures but shared genetic background.
Analyses were performed in R (4.2.1) and SAS (9.4). R package lme4 (version 1.1-30) was used to calculate the ICCs. All p-values refer to two-tailed tests.
The mean age of participants at baseline was 52.9. The sample was predominantly female (68%), with a racial/ethnic composition of 77% white and 23% black. Using DSM-5 criteria, 33 individuals had a lifetime history of MD. There were 20 twin pairs discordant for having MD (19 of which were MZ), 7 pairs concordant for having MD (all MZ) and 17 pairs (16 of which were MZ) concordant for not having a history of MD. Examining recency, all episodes of MD last occurred at least 6 months prior to the baseline assessment, and >75% occurred at least a year prior to the baseline assessment, indicating that the MD cases identified here were recovered and not currently depressed.
Table 1 shows descriptive statistics of participants both overall and stratified by lifetime history of MD. While differences were not statistically significant, participants with a history of MD were older, more likely to be female, white, and retired and had less education, lower household income, and were less likely to be married. Participants with a history of MD were about five times more likely to have a family history of MD (70% vs. 15%, p<.0001) and had higher diastolic (87.2 vs. 80.8 mmHg, p<0.002) and systolic (139.1 vs. 132.2 mmHg, p=0.05) BP. Waist circumference, BMI, CRP, HbA1c, blood glucose, and cortisol were comparable between the two groups, while IL-6 was higher among those with a history of MD (1.47 vs. 0.93 pg/mL, p=0.001).
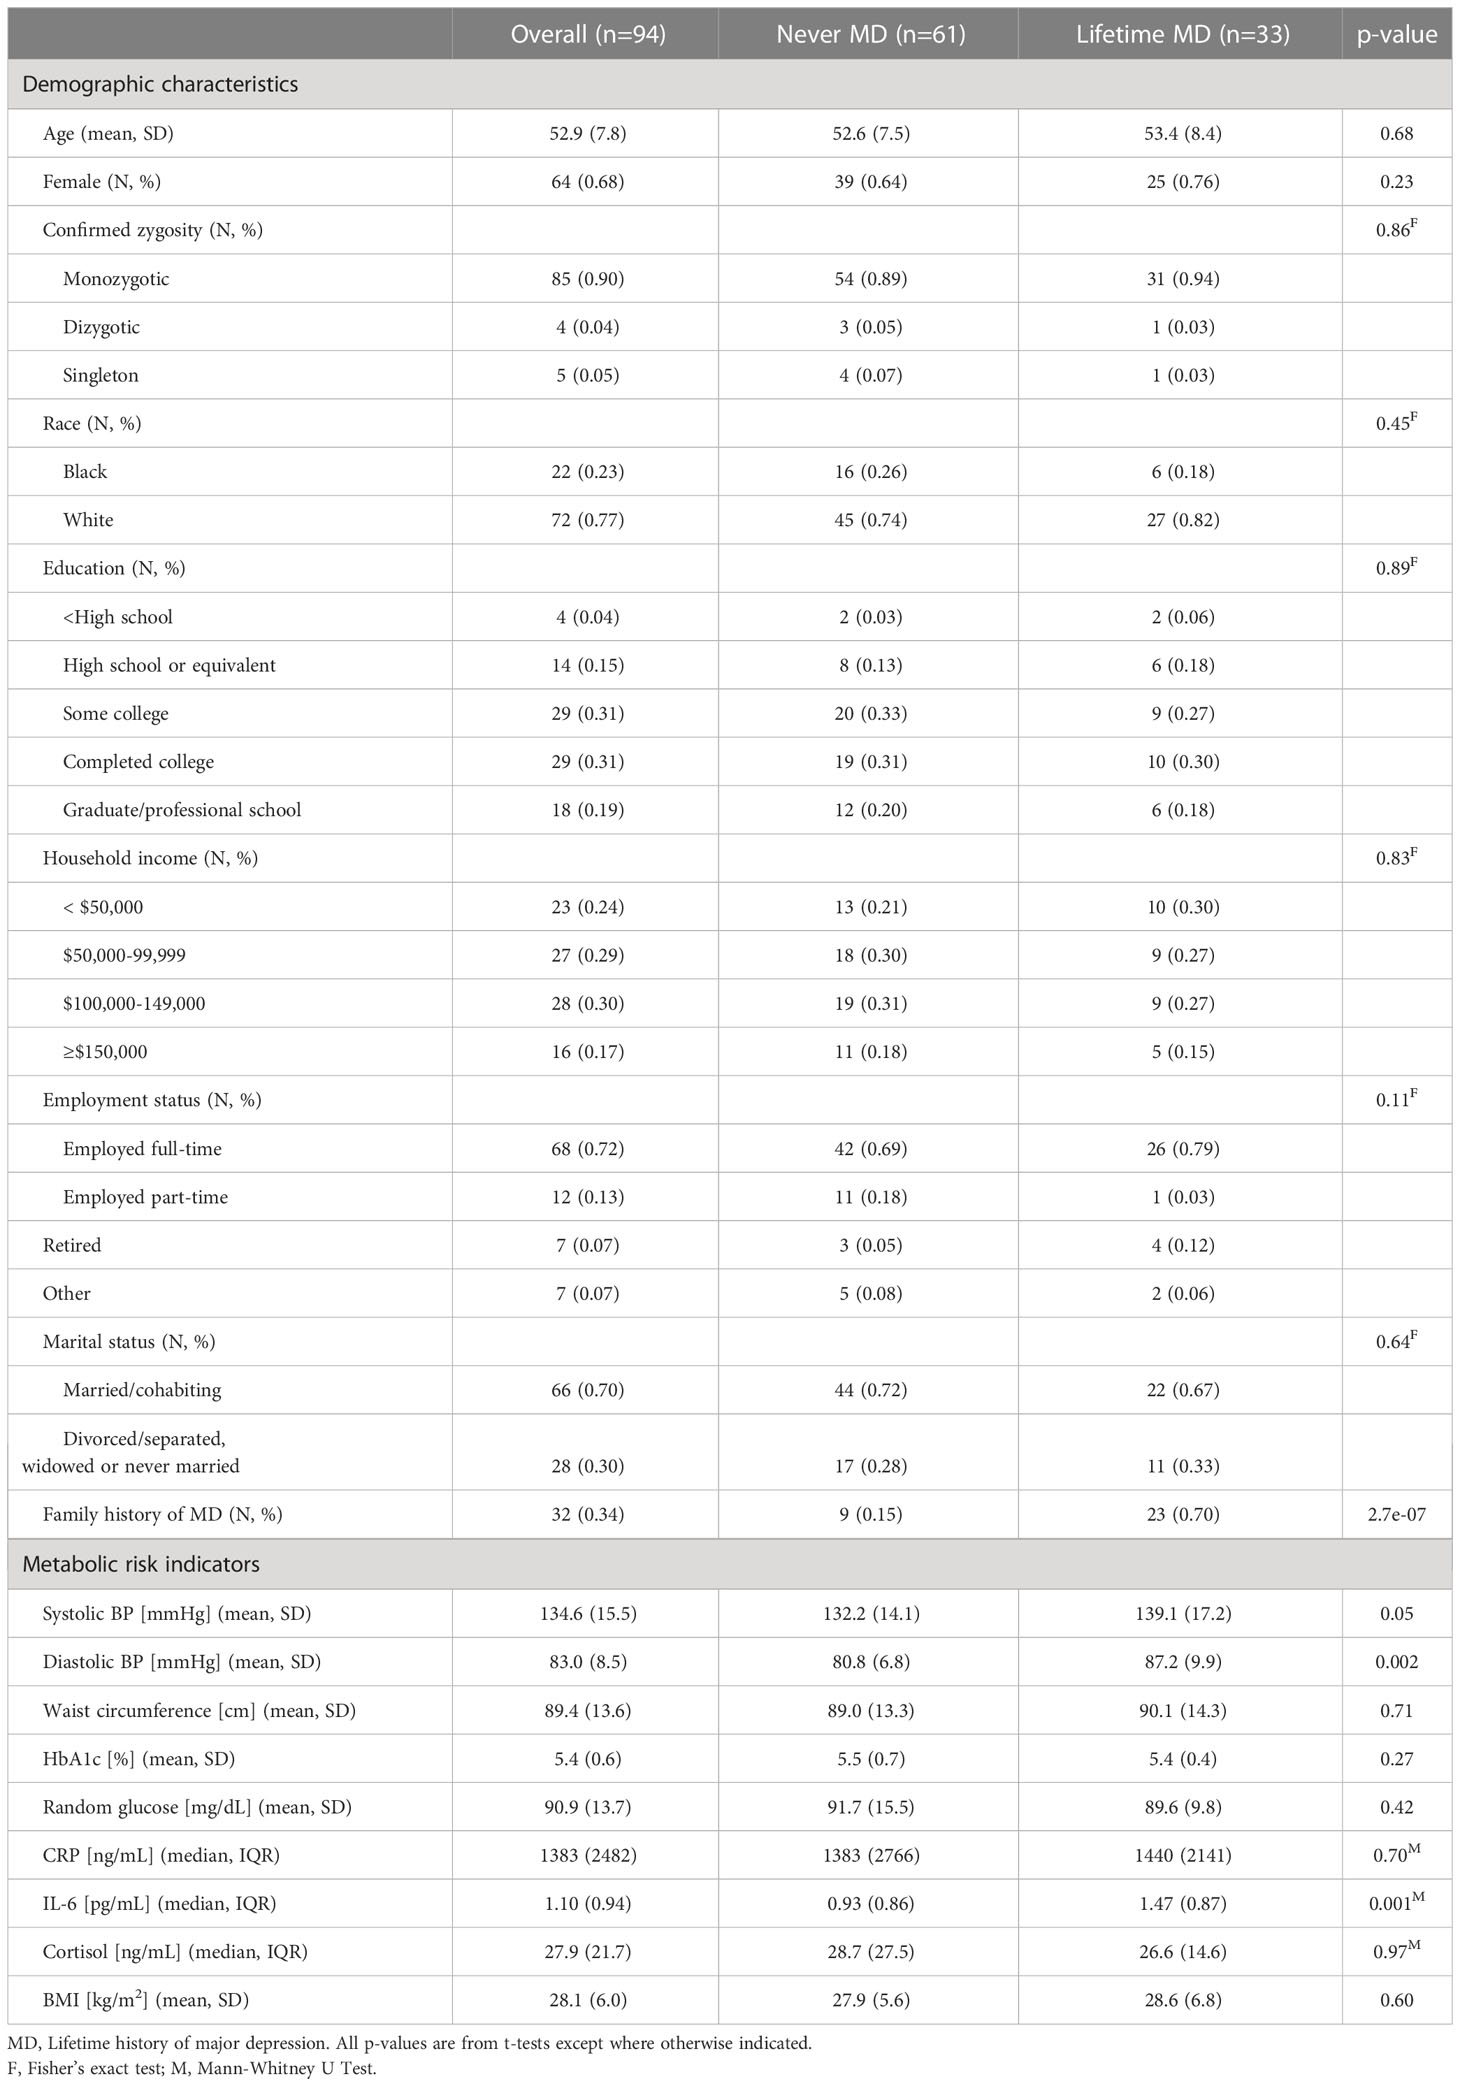
Table 1 Baseline characteristics of the Mood and Immune Regulation in Twins Study.
Table 2 and Supplemental Figure 1 show the ICCs in metabolic risk, immune functioning, and stress indicators for individuals (self-over-time between baseline and 6-month follow-up), and for members of the sibling pair (between co-twins). For all measures, the ICCsibship+person was higher than ICCsibship as the result of the person-level random effects being nested within sibships. Height had a high ICCsibship value and an ICCsibship+person value that was not much larger than ICCsibship, indicating that similarity between an individual’s measurements with those of their co-twin was almost as high as similarity between an individual’s measurements over time. Other traits with high ICCsibship such as waist circumference and BMI had higher values for ICCsibship+person, indicating that although there was high similarity between the twins there were also between-twin differences that remained stable across study visits. Notably, the PSS score and the two metabolic biomarkers (random glucose and HbA1c) had large differences between ICCsibship and ICCsibship+person, suggesting that an individual’s measurements at baseline and 6-months were more similar to each other than to those of their co-twin. This indicates that these are measuring perceptions and biological states, respectively, that differ between the members of the pairs but which are relatively stable for individuals. Some immune indicators such as CRP had differences between the two ICCs that suggest persistent individual-specific differences, while others with a temporal rhythm (i.e., cortisol) or short-term fluctuations in response to environmental factors (i.e., IL-6) showed little increase in the ICC when including the random effect for person, suggesting that any between-twin differences may not be stable over time.
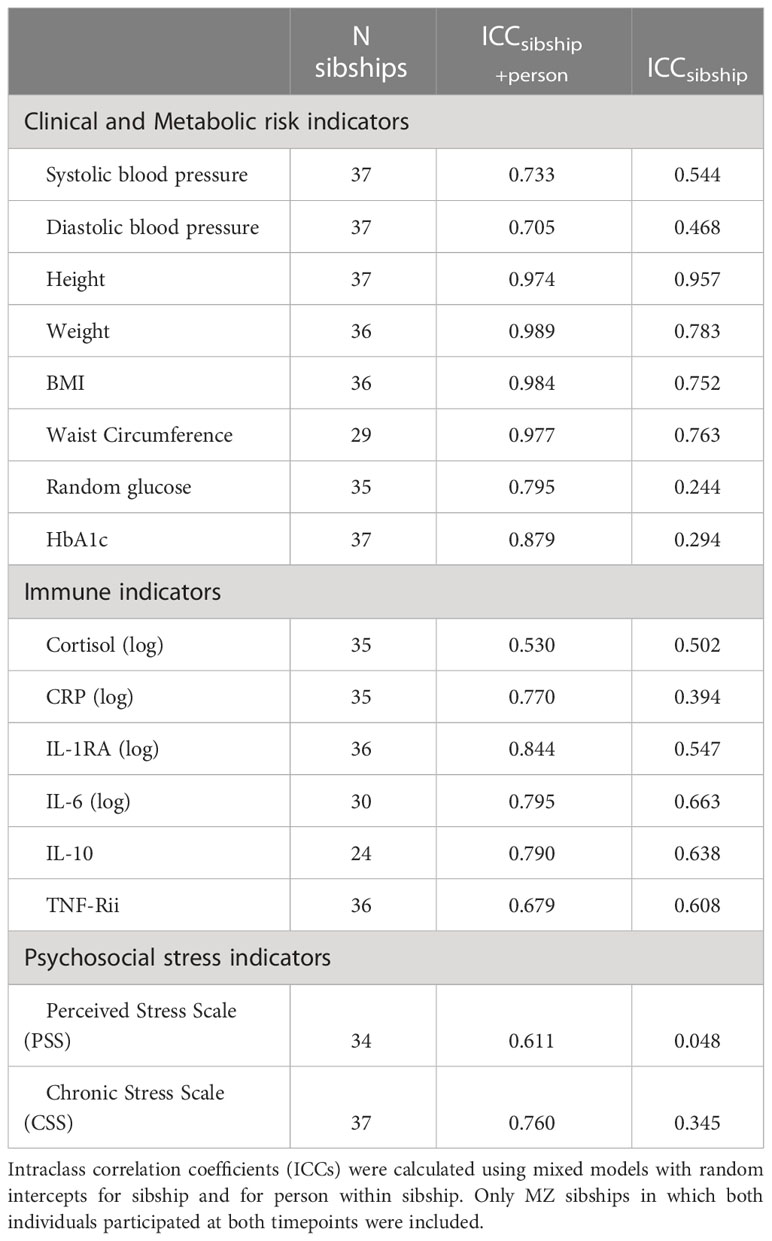
Table 2 Correlations in diabetes risk and stress measures among complete monozygotic twin pairs: Correlations of self-over-time and co-twin.
Figures 2–4 display an array of violin plots showing the distribution of the metabolic, immune, and psychosocial indicators for the 42 pairs of monozygotic twins by MD status of the pair (concordant for not having MD, discordant for MD, and concordant for having MD). Examining only the values for the discordant pairs (which by the nature of the co-twin design represent comparisons matched on key confounders such as age, sex, race, socioeconomic status in childhood, and genetic liability), while there is relatively little difference in the metabolic (Figure 2) and most immune indicators (Figure 3), the twin with MD tended to have higher levels of IL-6 and reported more stress on both the PSS and CSS scales (Figure 4). The direction of these differences was consistent with that shown by twins from pairs concordant for having MD.
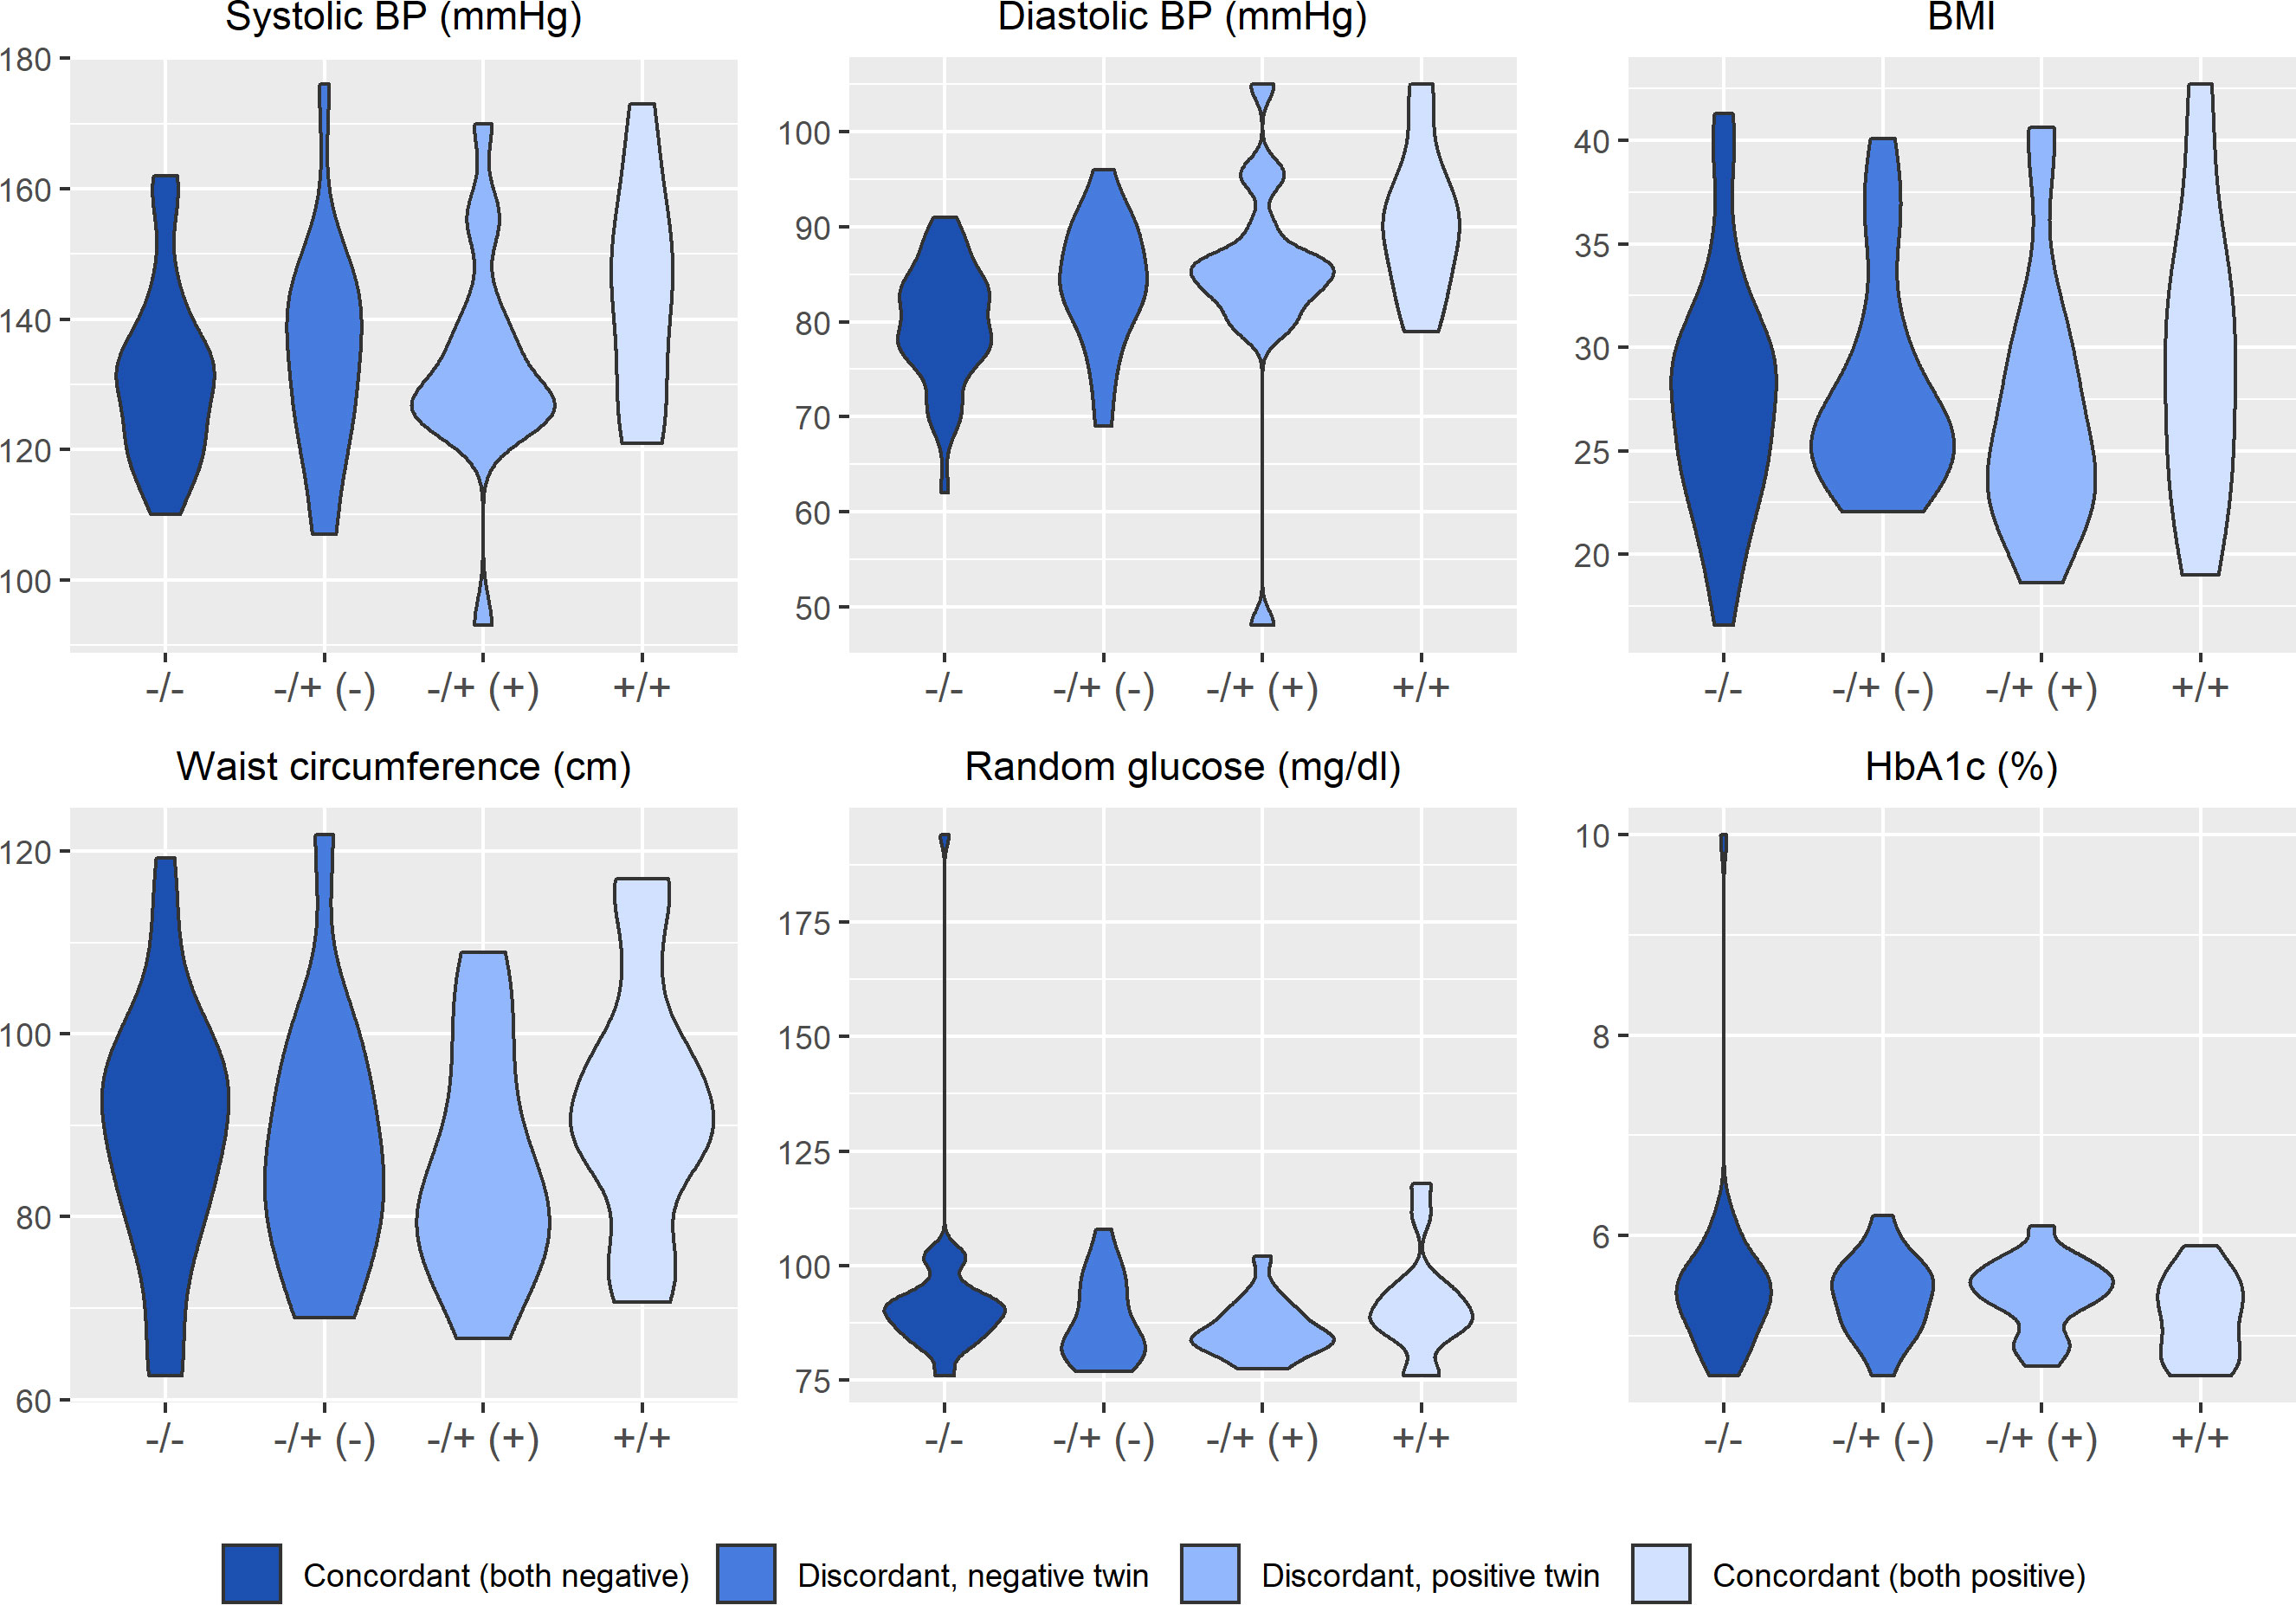
Figure 2 Distribution of clinical and metabolic markers arrayed by twin concordance for lifetime history of Major Depression (MD). Distribution of clinical and metabolic indicators by twin concordance for MD as assessed by the Diagnostic Interview Schedule. Units of the Y-axis for each indicator are shown in the subheading above each plot. Each plot is limited to the 42 twin pairs that were confirmed to be monozygotic using genetic testing. Sample size for each group shown in the legend: NCorcordant (both do not have MD) = 16 twin pairs (32 individuals), NDiscordant for MD (-) = 19 twin pairs (19 individuals), NDiscordant for MD (+) = 19 twin pairs (19 individuals), and NCorcordant (both have MD) = 7 twin pairs (14 individuals).
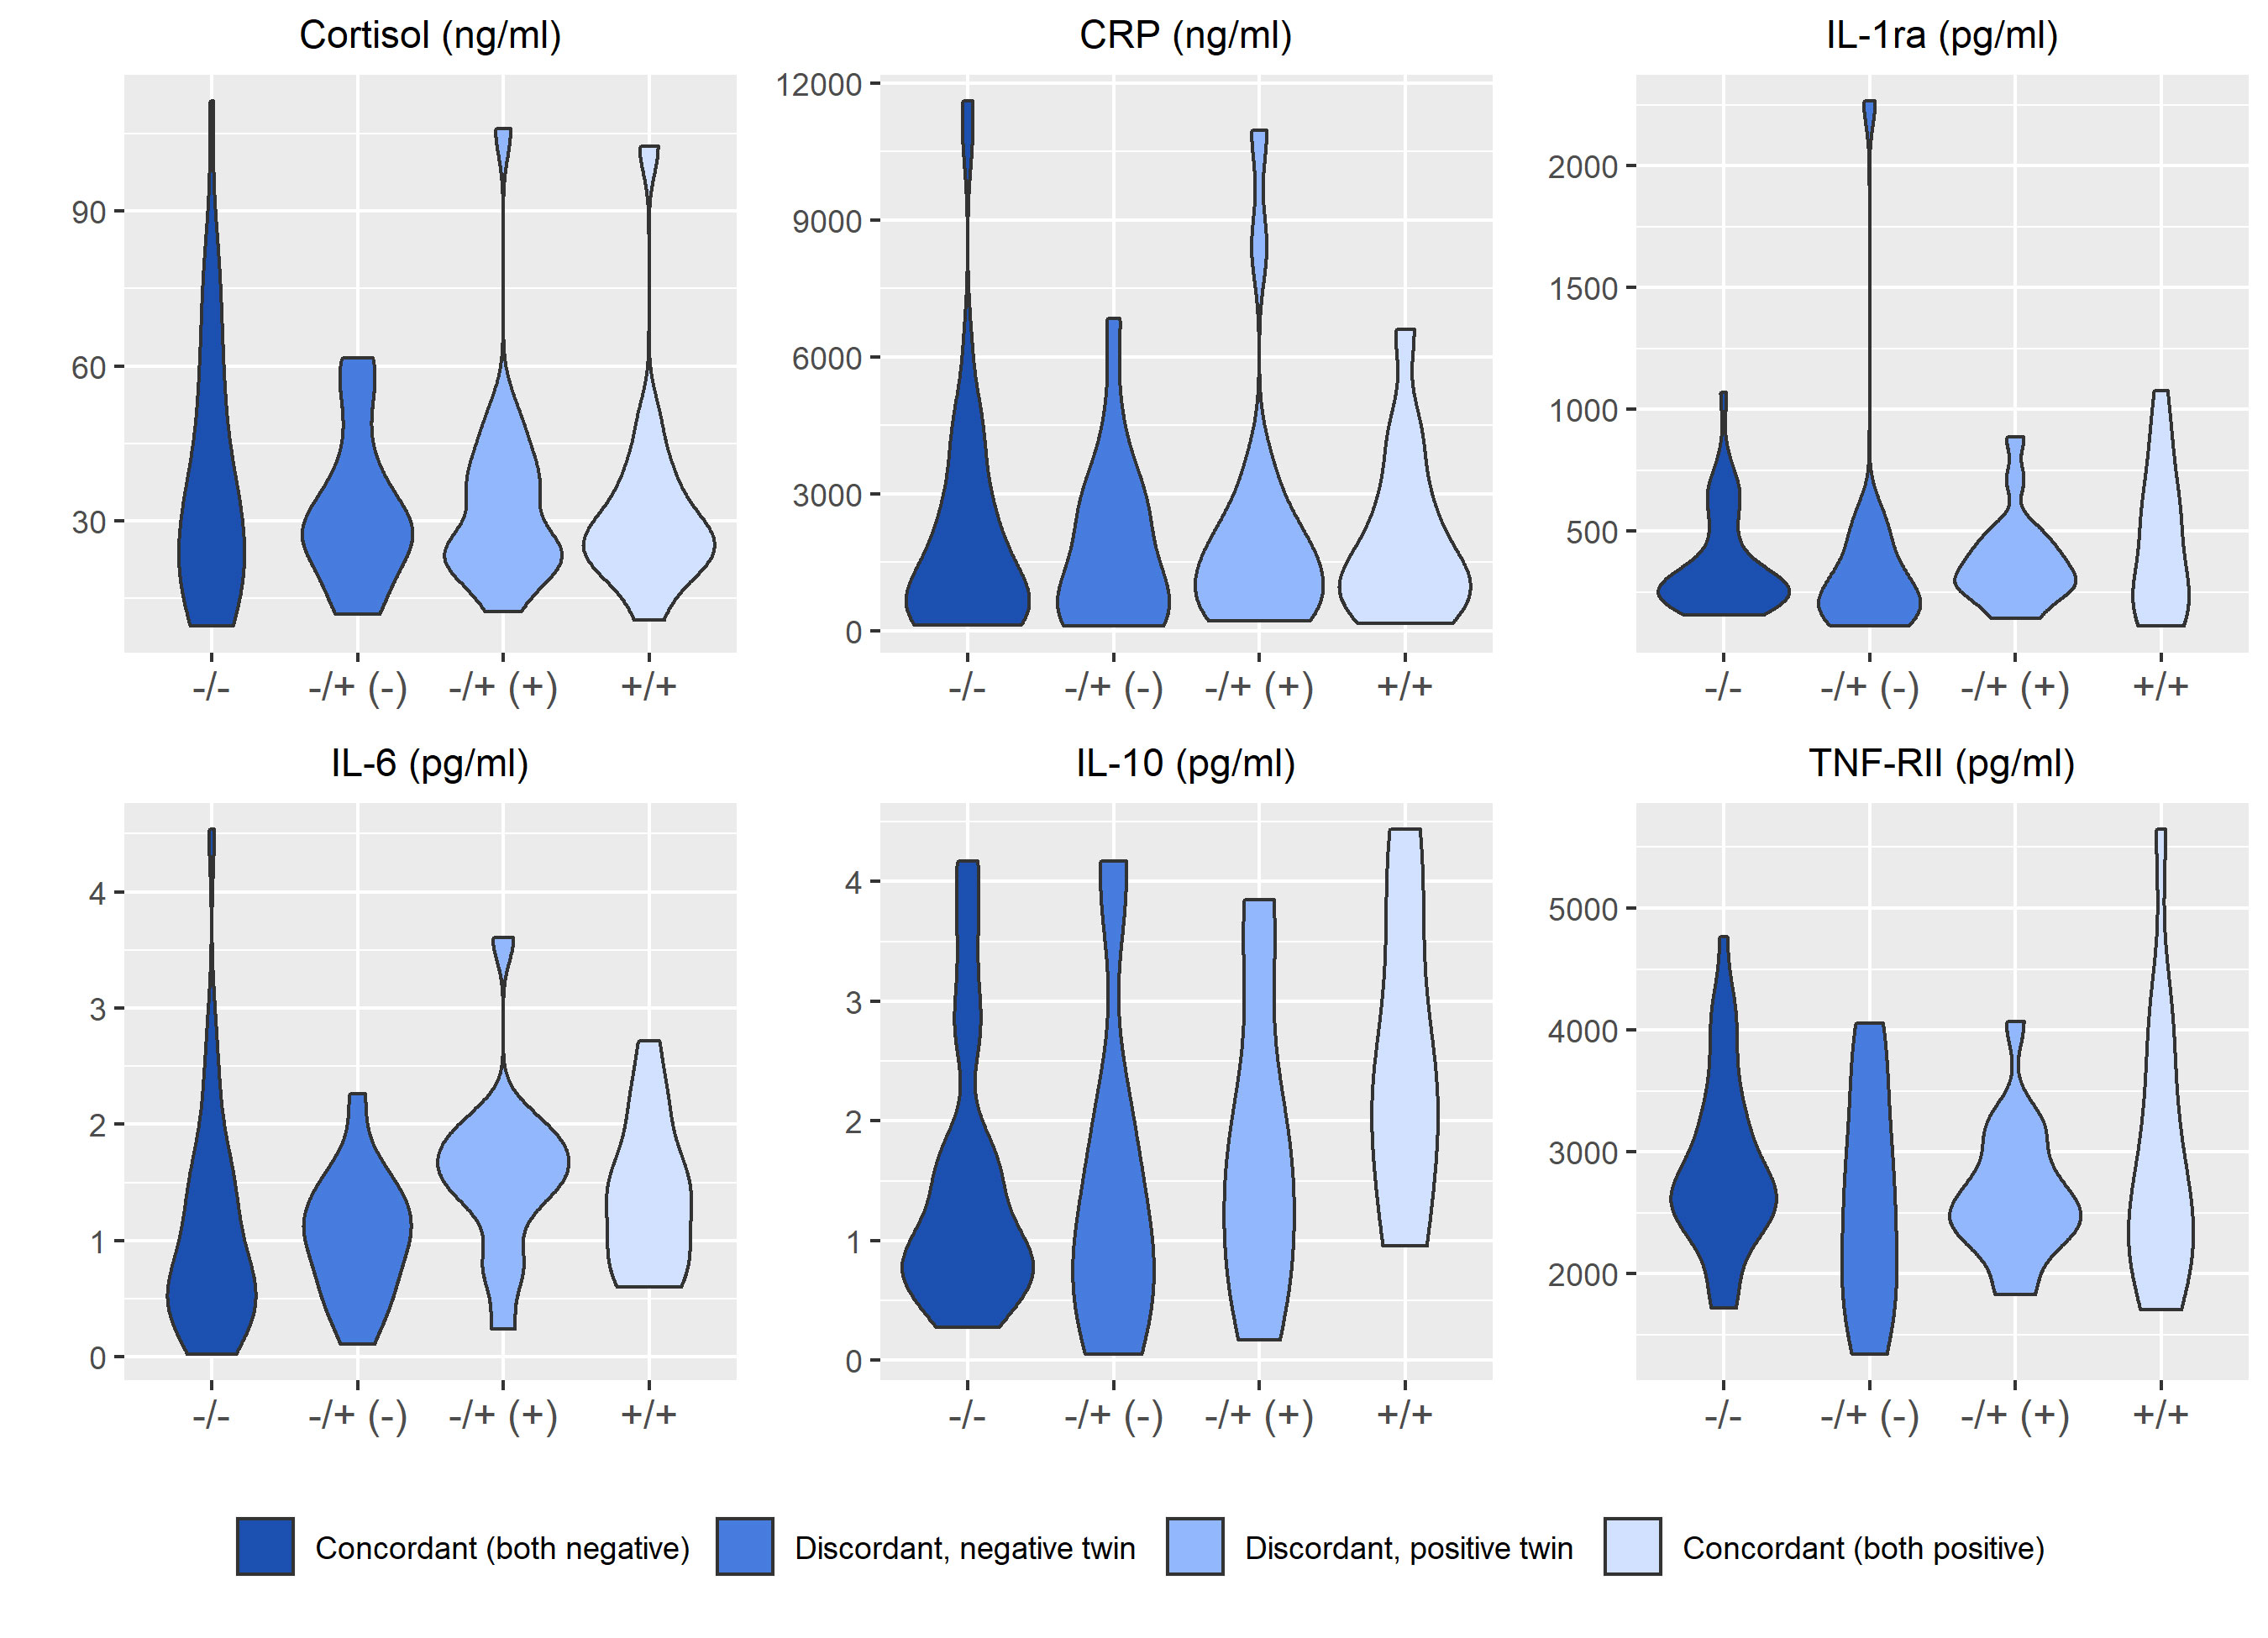
Figure 3 Distribution of immune markers arrayed by twin concordance for lifetime history of Major Depression (MD). Distribution of immune indicators by twin concordance for MD as assessed by the Diagnostic Interview Schedule. Units of the Y-axis for each indicator are shown in the subheading above each plot. Each plot is limited to the 42 twin pairs that were confirmed to be monozygotic using genetic testing. Sample size for each group shown in the legend: NCorcordant (both do not have MD) = 16 twin pairs (32 individuals), NDiscordant for MD (-) = 19 twin pairs (19 individuals), NDiscordant for MD (+) = 19 twin pairs (19 individuals), and NCorcordant (both have MD) = 7 twin pairs (14 individuals).
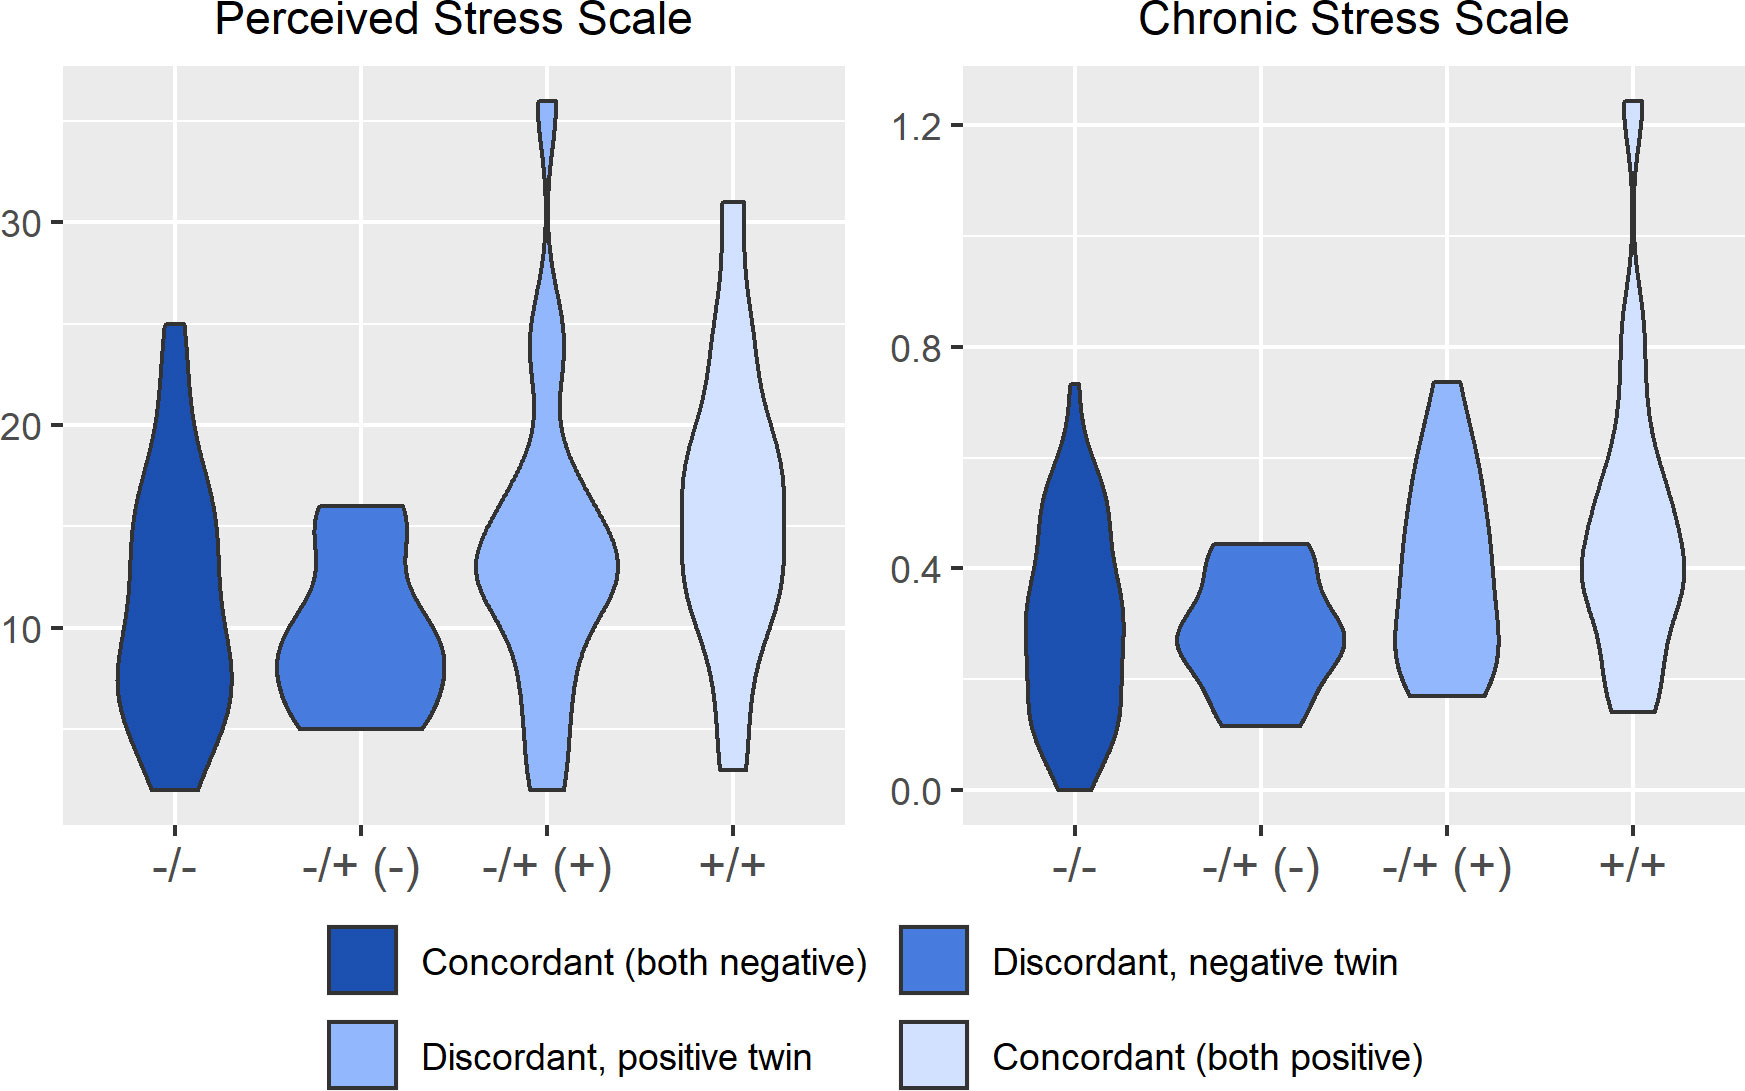
Figure 4 Distribution of psychosocial stress arrayed by twin concordance for lifetime history of Major Depression (MD). Distribution of stress indicators (Perceived Stress Scale and Chronic Stress Scale) by twin concordance for MD as assessed by the Diagnostic Interview Schedule. Each plot is limited to the 42 twin pairs that were confirmed to be monozygotic using genetic testing. Sample size for each group shown in the legend: NCorcordant (both do not have MD) = 16 twin pairs (32 individuals), NDiscordant for MD (-) = 19 twin pairs (19 individuals), NDiscordant for MD (+) = 19 twin pairs (19 individuals), and NCorcordant (both have MD) = 7 twin pairs (14 individuals).
The debate juxtaposing ‘nature versus nurture’ has long been set aside, as it is established that both genetic liability and environmental exposures are fundamental determinants of health conditions, including depression and diabetes (4). However, studies that incorporate a wide range of genetic, epigenetic, and environmental data to investigate how these mechanisms inter-relate to shape mental and physical health have only recently emerged (32). Beginning with the biopsychosocial model as a conceptual foundation, this paper described the study design, data collection protocols, sample characteristics, and initial findings from a longitudinal co-twin study. While other studies have examined differences in gene expression between MZ twins at a single point in time (33, 34), to our knowledge this is one of the few studies (35, 36) with longitudinal data on gene expression within a co-twin design.
While exploratory in nature, the findings from this study emphasize the need to consider both genetic and environmental factors for MD and diabetes. In the sample overall, MD was associated with higher IL-6 and blood pressure, but not other indicators of diabetes risk. Comparing members of discordant pairs, the twin with MD reported more stress than their co-twin in line with our expectations; however, differences in metabolic and immune indicators comparing the discordant pairs were more modest. As stated above, the MIRT study can be conceptualized as a two-by-two study design, in which individuals can be compared to both their co-twin at baseline and to themselves at the 6-month follow-up. This comparison was quantified by the ICC analysis, which clarified that variation in some risk factors (e.g., BMI) is primarily due to factors shared among both members of each sibships (i.e., genotype and early-life environmental factors), while variation in other risk factors (e.g., perceived stress) is primarily reflective of an individual’s unique environmental exposures which also have a degree of stability (at least over a 6-month period). Taken together, this analysis helps clarify which psychosocial characteristics are potentially more modifiable and thus could be prioritized as targets for intervention (20).
The past few decades have yielded tremendous advances in genetic epidemiology, driven by large repositories such as the UK Biobank (37) and consortia that aggregate multiple samples (e.g., Psychiatric Genetics Consortium, Diabetes Genetics Replication and Meta-analysis) (38). These datasets have been vital to the advancement of health research, but they are not without their limitations. First, while greater sample size clearly improves the precision of effect estimates, this does not necessarily result in more valid inferences; this is particularly relevant for mental health phenotypes that require extensive interviews for appropriate case identification (39), which is often not possible in large samples. Second, so-called “big data” can lead to complacency with statistically significant but scientifically trivial findings because sample size has an inverse relationship with detectable effect size; therefore, as sample size increases, it is logical to decrease alpha or commit to a more ambitious alternative hypothesis (40). Yet in practice we tend to apply the same arbitrary alpha value for a wide range of sample sizes and tout any p-value less than 0.05 as noteworthy.
Finally, large repositories and aggregated samples often lack “depth.” Depth in data here refers to both comprehensive measurement of exposures and outcomes, as well as consideration of study design and data collection protocols. Depth can also be characterized by situating data within a theoretical context that considers how genetic factors intersect with psychological, social, and behavioral pathways over the life course. The MIRT data includes detailed questionnaires about mental health, stress, coping, and health behaviors, often using multiple instruments and measuring different but related constructs, allowing nuanced examination of how such factors inter-relate and influence health. In sum, there is both a need for “breadth” and “depth” in genetically-informative study designs, and MIRT serves as an example of the latter.
Strengths of this study include the racial diversity of the sample (e.g., African Americans are significantly under-represented in health research) (41), multiple assessments of key exposures (e.g., including both the PSS and CSS) which permits examination of the role of measurement error on our inferences, the longitudinal study design, and the use of appropriate tissue (e.g., white blood cells) for examining immune-related RNA mechanisms. Limitations include the limited sample size and relatively brief follow-up period, both of which increase type 2 error. Therefore, the results of MIRT should be considered primarily as exploratory and hypothesis-generating. Due to the lengthy DIS protocol we also did not re-assess MD at the 6-month follow-up to mitigate respondent burden, and therefore it is possible that incident or recurrent episodes of depression occurred between these assessments that were not captured by our study. If the biological mechanisms linking psychosocial factors to health are general rather than specific in nature (e.g., not MD per say, but rather a result of any form of persistent psychological distress), these processes may be captured by measures such as the PSS which assess current exposures. All cases of MD were resolved (i.e., last occurred at least 6 months before baseline) and this may have reduced our ability to detect associations between MD and the biological measures, especially if these relationships are primarily acute in nature. However, lifetime history of MD was positively associated with scores on the PSS and CSS, suggesting that while these participants did not meet DSM diagnostic criteria at the time, they were still experiencing higher levels of psychosocial distress than those who had never had MD.
As a longitudinal study of twins, MIRT is useful for exploring relationships among biological, psychosocial and behavioral indicators of health. Because MZ twins are matched on an array of confounders such as age, sex, race, childhood socioeconomic status, and genetic liability, the effects of individual-specific environmental exposures can be inferred with more certainty. This study collected a broad range of psychological, social, and biological measures, and thus it has the potential for exploring an array of scientific questions derived from the biopsychosocial model (2). Future analyses of the MIRT cohort will explore how MD relates to changes in physiologic and psychological indicators over time, as well as within-pair differences in gene expression. Such decompositions of the role of genetic and environmental sources of depression and diabetes risk are only possible because of the genetically-informed nature of the MIRT sample. It is hoped that this study will eventually add to the growing body of literature on the complex biological and epigenetic processes that contribute to the connections between psychosocial factors and health (42).
Participant recruitment, data collection materials, and data codebooks are publicly available at the Open Science Framework (https://osf.io/24vpb/). The datasets generated by the MIRT Study are available by contacting the corresponding author. Sequencing data is not publicly available due to concerns regarding participant/patient anonymity. Requests to access the datasets should be directed to the corresponding author.
The studies involving human participants were reviewed and approved by Institutional Review Board at Virginia Commonwealth University (Protocol ID: HM15108). The patients/participants provided their written informed consent to participate in this study.
BM conceptualized the study, obtained funding for the data collection, and wrote the first draft of this manuscript. KK conducted the statistical analysis and assisted with drafting the manuscript. EB conducted the literature review and assisted with drafting the manuscript. JC led the data collection effort and assisted with drafting the manuscript. All authors contributed to the article and approved the submitted version.
Funding for this project is from the National Institute of Mental Health (K01-MH093642) and the University of Michigan (both to BM). At the time of the study, KK was supported by the Genomics Science Training Program (T32 HG000040-26). Data collection was also supported by the VCU Clinical and Translational Research Center (UL1-TR002649).
We would like to thank the staff at the Mid-Atlantic Twin Registry (MATR), especially Dr. Judy Silberg, Ms. Emily Lilley, and Ms. Anne-Taylor Morris and colleagues at the Virginia Institute of Psychiatric and Behavioral Genetics (VIPBG), especially Dr. Kenneth Kendler, Dr. Brien Riley, Dr. Elizabeth Prom-Wormley and Mr. Brian Wormley, for their support and assistance with this project. We would like to thank Dr. Natalie Bareis for her help with data collection and Ms. Lily Johns for her assistance with manuscript preparation. Finally, we would like to thank the participants in the MIRT Study, without whom this work would not have been possible.
The authors declare that the research was conducted in the absence of any commercial or financial relationships that could be construed as a potential conflict of interest.
All claims expressed in this article are solely those of the authors and do not necessarily represent those of their affiliated organizations, or those of the publisher, the editors and the reviewers. Any product that may be evaluated in this article, or claim that may be made by its manufacturer, is not guaranteed or endorsed by the publisher.
The Supplementary Material for this article can be found online at: https://www.frontiersin.org/articles/10.3389/fcdhc.2023.1026402/full#supplementary-material
1. Mezuk B, Eaton WW, Albrecht S, Golden SH. Depression and type 2 diabetes over the lifespan: a meta-analysis. Diabetes Care (2008) 31(12):2383–90. doi: 10.2337/dc08-0985
2. Miller G, Chen E, Cole SW. Health psychology: developing biologically plausible models linking the social world and physical health. Annu Rev Psychol (2009) 60:501–24. doi: 10.1146/annurev.psych.60.110707.163551
3. McGue M, Osler M, Christensen K. Causal inference and observational research: The utility of twins. Perspect Psychol Sci (2010) 5(5):546–56. doi: 10.1177/1745691610383511
4. Bergmans RS, Rapp A, Kelly KM, Weiss D, Mezuk B. Understanding the relationship between type 2 diabetes and depression: lessons from genetically informative study designs. Diabetes Med (2021) 38(2):e14399. doi: 10.1111/dme.14399
5. Sullivan PF. The psychiatric GWAS consortium: Big science comes to psychiatry. Neuron (2010) 68(2):182–6. doi: 10.1016/j.neuron.2010.10.003
6. Chung WK, Erion K, Florez JC, Hattersley AT, Hivert MF, Lee CG, et al. Precision medicine in diabetes: A consensus report from the American diabetes association (ADA) and the European association for the study of diabetes (EASD). Diabetes Care (2020) 43(7):1617–35. doi: 10.2337/dci20-0022
7. D’Onofrio BM, Class QA, Rickert ME, Sujan AC, Larsson H, Kuja-Halkola R, et al. Translational epidemiologic approaches to understanding the consequences of early-life exposures. Behav Genet (2016) 46(3):315–28. doi: 10.1007/s10519-015-9769-8
8. Scherrer JF, Xian H, Lustman PJ, Franz CE, McCaffery J, Lyons MJ, et al. A test for common genetic and environmental vulnerability to depression and diabetes. Twin Res Hum Genet (2011) 14(2):169–72. doi: 10.1375/twin.14.2.169
9. Mezuk B, Heh V, Prom-Wormley E, Kendler KS, Pedersen NL. Association between major depression and type 2 diabetes in midlife: findings from the screening across the lifespan twin study. Psychosom Med (2015) 77(5):559–66. doi: 10.1097/PSY.0000000000000182
10. Kan C, Pedersen NL, MacCabe JL, Ismail K, Rijsdijk F. The genetic overlap of type 2 diabetes and depression-finding from the swedish twin registry. Eur Psychiatry (2015) 30:292. doi: 10.1016/S0924-9338(15)30235-2
11. Beam CR, Turkheimer E, Finkel D, Levine ME, Zandi E, Guterbock TM, et al. Midlife study of the Louisville twins: Connecting cognitive development to biological and cognitive aging. Behav Genet (2020) 50(2):73–83. doi: 10.1007/s10519-019-09983-6
12. Engel GL. The need for a new medical model: a challenge for biomedicine. Science (1977) 196(4286):129–36. doi: 10.1126/science.847460
13. Hackett RA, Hamer M, Endrighi R, Brydon L, Steptoe A. Loneliness and stress-related inflammatory and neuroendocrine responses in older men and women. Psychoneuroendocrinology (2012) 37(11):1801–9. doi: 10.1016/j.psyneuen.2012.03.016
14. Kelly KM, Smith JA, Mezuk B. Depression and interleukin-6 signaling: A mendelian randomization study. Brain Behav Immun (2021) 95:106–14. doi: 10.1016/j.bbi.2021.02.019
15. Bergmans RS, Kelly KM, Mezuk B. Inflammation as a unique marker of suicide ideation distinct from depression syndrome among U.S adults. J Affect Disord (2019) 245:1052–60. doi: 10.1016/j.jad.2018.11.046
16. Hackett RA, Kivimäki M, Kumari M, Steptoe A. Diurnal cortisol patterns, future diabetes, and impaired glucose metabolism in the Whitehall II cohort study. J Clin Endocrinol Metab (2016) 101(2):619–25. doi: 10.1210/jc.2015-2853
17. Steptoe A, Hackett RA, Lazzarino AI, Bostock S, Marca RL, Carvalho LA, et al. Disruption of multisystem responses to stress in type 2 diabetes: Investigating the dynamics of allostatic load. PNAS (2014) 111(44):15693–8. doi: 10.1073/pnas.1410401111
18. Kalesnikava VA, Clarke PJ, Mukherjee B, Sen S, Mezuk B. Psychosocial stress and hypothalamic-Pituitary-Adrenal axis stress reactivity: Variations by race and socioeconomic status among adults at risk of diabetes. Psychosom Med (2022) 84(7):813–21. doi: 10.1097/PSY.0000000000001112
19. Hackett RA, Steptoe A. Type 2 diabetes mellitus and psychological stress - a modifiable risk factor. Nat Rev Endocrinol (2017) 13(9):547–60. doi: 10.1038/nrendo.2017.64
20. Pouwer F, Schram MT, Iversen MM, Nouwen A, Holt RIG. How 25 years of psychosocial research has contributed to a better understanding of the links between depression and diabetes. Diabetes Med (2020) 37(3):383–92. doi: 10.1111/dme.14227
21. Mezuk B, Allen JO. Rethinking the goals of diabetes prevention programs. Diabetes Care (2021) 44(11):2457–9. doi: 10.2337/dci21-0038
22. Lilley ECH, Silberg JL. The mid-Atlantic twin registry, revisited. Twin Res Hum Genet (2013) 16(1):424–8. doi: 10.1017/thg.2012.125
23. Mezuk B, Johns L. Leveraging genetically-informative study designs to explore the relationship between depression and type 2 diabetes: Rationale and baseline characteristics of the mood and immune regulation in twins study (2022). Available at: https://osf.io/3mxuv.
24. García-Juárez M, Camacho-Morales A. Defining the role of anti- and pro-inflammatory outcomes of interleukin-6 in mental health. Neuroscience (2022) 492:32–46. doi: 10.1016/j.neuroscience.2022.03.020
25. Moll P, Ante M, Seitz A, Reda T. QuantSeq 3′ mRNA sequencing for RNA quantification. Nat Methods (2014) 11(i–iii). doi: 10.1038/nmeth.f.376
26. Ma F, Fuqua BK, Hasin Y, Yukhtman C, Vulpe CD, Lusis AJ, et al. A comparison between whole transcript and 3’ RNA sequencing methods using kapa and lexogen library preparation methods. BMC Genomics (2019) 20(1):9. doi: 10.1186/s12864-018-5393-3
27. Illumina, Inc. NovaSeq 6000 system (2019). Available at: https://www.illumina.com/systems/sequencing-platforms/novaseq.html.
28. Eaton WW, Neufeld K, Chen LS, Cai G. A comparison of self-report and clinical diagnostic interviews for depression: Diagnostic interview schedule and schedules for clinical assessment in neuropsychiatry in the Baltimore epidemiologic catchment area follow-up. Arch Gen Psychiatry (2000) 57(3):217–22. doi: 10.1001/archpsyc.57.3.217
29. Pies R. The bereavement exclusion and DSM-5: An update and commentary. Innov Clin Neurosci (2014) 11(7–8):19–22.
30. Hamilton CM, Strader LC, Pratt JG, Maiese D, Hendershot T, Kwok RK, et al. The PhenX toolkit: get the most from your measures. Am J Epidemiol (2011) 174(3):253–60. doi: 10.1093/aje/kwr193
31. Cohen S, Kamarck T, Mermelstein R. A global measure of perceived stress. J Health Soc Behav (1983) 24(4):385–96. doi: 10.2307/2136404
32. McEwen BS, Bulloch K. Epigenetic impact of the social and physical environment on brain and body. Metabolism (2019) 100:153941. doi: 10.1016/j.metabol.2019.07.005
33. Nygaard M, Larsen MJ, Thomassen M, McGue M, Christensen K, Tan Q, et al. Global expression profiling of cognitive level and decline in middle-aged monozygotic twins. Neurobiol Aging (2019) 84:141–7. doi: 10.1016/j.neurobiolaging.2019.08.019
34. van Dongen J, Willemsen G, Heijmans BT, Neuteboom J, Kluft C, Jansen R, et al. Longitudinal weight differences, gene expression and blood biomarkers in BMI-discordant identical twins. Int J Obes (2015) 39(6):899–909. doi: 10.1038/ijo.2015.24
35. Ouwens KG, Jansen R, Nivard MG, van Dongen J, Frieser MJ, Hottenga JJ, et al. A characterization of cis- and trans-heritability of RNA-seq-based gene expression. Eur J Hum Genet (2020) 28(2):253–63. doi: 10.1038/s41431-019-0511-5
36. Anderson A. MultiMuTHER team tracks expression, metabolite relationships in aging TwinsUK participants. Genomeweb (2021). Available at: https://www.genomeweb.com/sequencing/multimuther-team-tracks-expression-metabolite-relationships-aging-twinsuk-participants (Accessed August 20, 2022).
37. Bycroft C, Freeman C, Petkova D, Band G, Elliott LT, Sharp K, et al. The UK biobank resource with deep phenotyping and genomic data. Nature (2018) 562(7726):203–9. doi: 10.1038/s41586-018-0579-z
38. Major Depressive Disorder Working Group of the PGC, Wray NR, Sullivan PF. Genome-wide association analyses identify 44 risk variants and refine the genetic architecture of major depression. bioRxiv (2017) 167577.
39. Davis KAS, Cullen B, Adams M, Brailean A, Breen G, Coleman JRI, et al. Indicators of mental disorders in UK biobank–a comparison of approaches. Int J Methods Psychiatr Res (2019) 28(3):e1796. doi: 10.1002/mpr.1796
40. Beesley LJ, Salvatore M, Fritsche LG, Pandit A, Rao A, Brummett C, et al. The emerging landscape of health research based on biobanks linked to electronic health records: Existing resources, statistical challenges, and potential opportunities. Stat Med (2020) 39(6):773–800. doi: 10.1002/sim.8445
41. Sirugo G, Williams SM, Tishkoff SA. The missing diversity in human genetic studies. Cell (2019) 177(1):26–31. doi: 10.1016/j.cell.2019.02.048
Keywords: depression, co-twin, gene-environment interaction, stress, allostatic load, inflammation, diabetes
Citation: Mezuk B, Kelly K, Bennion E and Concha JB (2023) Leveraging a genetically-informative study design to explore depression as a risk factor for type 2 diabetes: Rationale and participant characteristics of the Mood and Immune Regulation in Twins Study. Front. Clin. Diabetes Healthc. 4:1026402. doi: 10.3389/fcdhc.2023.1026402
Received: 23 August 2022; Accepted: 01 March 2023;
Published: 17 March 2023.
Edited by:
Sridhar R. Gumpeny, Endocrine and Diabetes Centre, IndiaReviewed by:
Andreia S Mocan, County Emergency Hospital Cluj-Napoca, RomaniaCopyright © 2023 Mezuk, Kelly, Bennion and Concha. This is an open-access article distributed under the terms of the Creative Commons Attribution License (CC BY). The use, distribution or reproduction in other forums is permitted, provided the original author(s) and the copyright owner(s) are credited and that the original publication in this journal is cited, in accordance with accepted academic practice. No use, distribution or reproduction is permitted which does not comply with these terms.
*Correspondence: Briana Mezuk, Ym1lenVrQHVtaWNoLmVkdQ==
Disclaimer: All claims expressed in this article are solely those of the authors and do not necessarily represent those of their affiliated organizations, or those of the publisher, the editors and the reviewers. Any product that may be evaluated in this article or claim that may be made by its manufacturer is not guaranteed or endorsed by the publisher.
Research integrity at Frontiers
Learn more about the work of our research integrity team to safeguard the quality of each article we publish.