 Fabrizio Ambrosino1,2
 Giuseppe La Verde1,2*
 Roberta Oliva3Mohamed Y. Hanfi4Antonio Sarno5
 Mariagabriella Pugliese1,2
- 1Department of Physics “E. Pancini”, University of Naples Federico II, Naples, Italy
- 2Section of Naples, National Institute of Nuclear Physics, Naples, Italy
- 3Department of Electrical Engineering and Information Technologies, University of Naples Federico II, Naples, Italy
- 4Ural Federal University, Ekaterinburg, Russia
- 5Department of Physics Aldo Pontremoli, University of Milan La Statale, Milan, Italy
In the context of the 2024 Italian National Radon Action Plan requiring the monitoring of workplaces, work activities, and buildings with public access, 222Rn activity concentrations in 67 schools in the Campania region (Italy) —kindergartens, primary schools, secondary schools and high schools—were measured using passive detectors over a year. The information collected for evaluation involved the construction materials used, the covering of walls and floors, the intended use of the rooms, and the type of people exposed, whether students, teachers, or administrative staff. Annual effective dose (AED), lung cancer cases (LCC), and excess lifetime cancer risk (ELCR) for these three people categories were estimated. The average 222Rn activity concentration was 262 Bq/m3 in kindergartens (std. dev. = 158 Bq/m3), 292 Bq/m3 for both primary and secondary schools (std. dev. = 189 Bq/m3 and 213 Bq/m3, respectively), and 150 Bq/m3 (std. dev. = 205 Bq/m3) in high schools. The difference between schools built of tuff and those of concrete was statistically different, with average activity of 276 Bq/m3 vs. 144 Bq/m3. As expected, the floor level had a considerable impact, with the activity concentration reducing as the distance from the ground floor increased. The average AED ranged between 2.2 mSv (kindergarten) and 1.1 mSv (high school) for students and between 1.3 mSv and 0.6 mSv for teachers. AED for administrative staff was estimated to be 2.5 mSv on average. The highest AED corresponded to the highest LCC and ELCR for administrative staff, estimated at 45 per million people and 8.6%, respectively. Such a proposed approach could be used to implement a risk management system in accordance with the principles of radiation protection and prevention of harm to human health.
1 Introduction
Radon (222Rn) is one of the leading causes of lung cancer for non-smokers and the second cause of lung cancer among smokers, being responsible for 3–14% of all cases1,2. The mechanisms of interaction between the alpha particles emitted by radon and its daughters with biological tissues are well known (UNSCEAR, 2000; BEIR, 2006; Durante et al., 1994); however, it remains a topic of great public health interest, with radiation protection from radon gas being the subject of international guidelines and national legislation. European Directive 2013/59/Euratom (Council Directive, 2013) established the basic safety standards for protection against dangers arising from exposure to ionizing radiation. This also includes exposure to radon gas, for which Member States are required to implement mandatory decrees. In Italy, the directive was implemented with Legislative Decree 101/2020 (D.lgs 101/2020, 2020), which specifies the field of application (i.e., the places monitored) and the reference values; in the workplace and in public spaces, these have been set at 300 Bq/m3 for existing buildings and 200 Bq/m3 for those built after 31 December 2024. Similarly, legislation in the United States of America (United States) identifies three different zones on the basis of the mitigation requirements (Eidy et al., 2024; Gordon et al., 2018). Radon Zone 3 is accepted as normal and presents 2 pCi/L (74 Bq/m3). Radon Zone 2 with radon activity concentrations of 2–4 pCi/L (74–148 Bq/m3) suggests that mitigation should be performed. Radon Zone 1 with radon activity concentration exceeding 4 pCi/L (148 Bq/m3) is recognized as an Action Level, requiring necessary mitigation since such levels positively correlate with an increased risk of lung cancer. Canadian Government guidelines set the threshold for action at 200 Bq/m3, extending such a limit for indoor radon concentration also to schools (Shergill et al., 2021).
Recently, again in compliance with Directive 2013/59/Euratom (Council Directive, 2013), the Italian National Radon Action Plan, NRAP (DPCM, 2024), was published. This document provides an overview of the measurement and characterization activities carried out by individual regions. The goal of the NRAP is achieved through various actions divided into the three axes of measuring, acting, and involving. Activities foreseen within the aforementioned actions are carried out with the involvement of different administrations. In particular, Action 1.3—identification of the types of workplaces, work activities and buildings with public access at greatest risk—indicates schools as places subject to measures and monitoring.
The aim of this study is to offer support to Action 1.3 by providing the results of measurements of radon gas concentration activity in schools, distributed throughout the Campania region, from nursery to high school, inclusive of kindergartens and primary and secondary schools. The study and measurement activity was carried out on an area which, due to its volcanic nature, is of a radioprotective interest from a scientific perspective (Mancini et al., 2020; Sabbarese et al., 2017). To complete the already published radiometric data set (La Verde et al., 2023), the most common radioprotection indices were calculated considering the different types of exposed individuals—students and workers—with statistical analysis as well as comparison with prior research. Having covered educational institutions, the measurements were also combined with information seminars on the risks related to exposure to radon gas. These activities therefore also had an important role in information dissemination and citizen science, since members of the public, especially those from the school environment, were active participants in the monitoring processes (Colucci et al., 2023; Ambrosino et al., 2024).
2 Materials and methods
2.1 Investigated buildings
222Rn activity concentration was measured in 67 schools (in Campania region, southern Italy) comprising kindergartens (children 3–5 years old), primary schools (students 6–10 years old), secondary schools (“secondary school of the first order” in the Italian nomenclature, with students 11–13 years old) and high schools (“secondary school of the secondary order” in the Italian nomenclature, comprising students 14–18 years old). Table 1 reports the composition of the places investigated and, for each school type, the number of classrooms. In addition, the number of common areas—“room type 2” / “type 2”—and administrative areas—“room type 3” / “type 3”—are reported. Room type 2 includes all rooms that are supposed to be occupied by students and workers at a maximum of 10 h per month, such as laboratories, gyms, and libraries. Room type 3 includes all rooms dedicated to workers, such as administrative rooms, secretariats, and directorates.
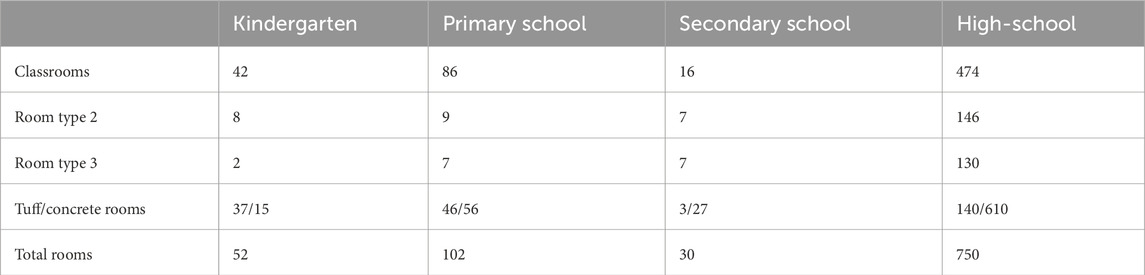
Table 1. Investigated indoor spaces classified per room type, school type, and building material.
Table 1 differentiates places located in concrete buildings from those made of tuff, as in the latter typology, a greater 222Rn activity concentration is expected (Malanca et al., 1991). The maps in Figure 1 localize the selected buildings with a red dot.
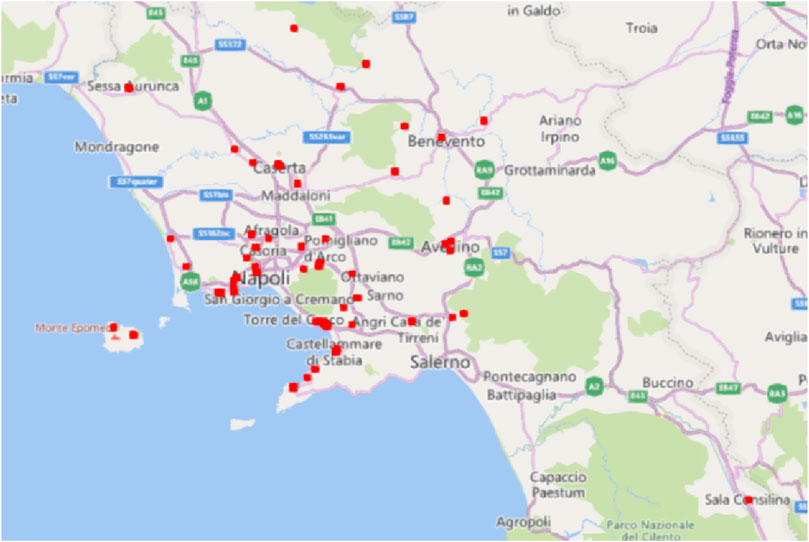
Figure 1. School building localization in the Campania region.
Table 2 shows the location of rooms as function of the floor, for each of the four school types. Note that kindergartens have a prevalence of rooms at ground floor, while high schools were the only ones to have rooms at the second, third, and fourth floors.
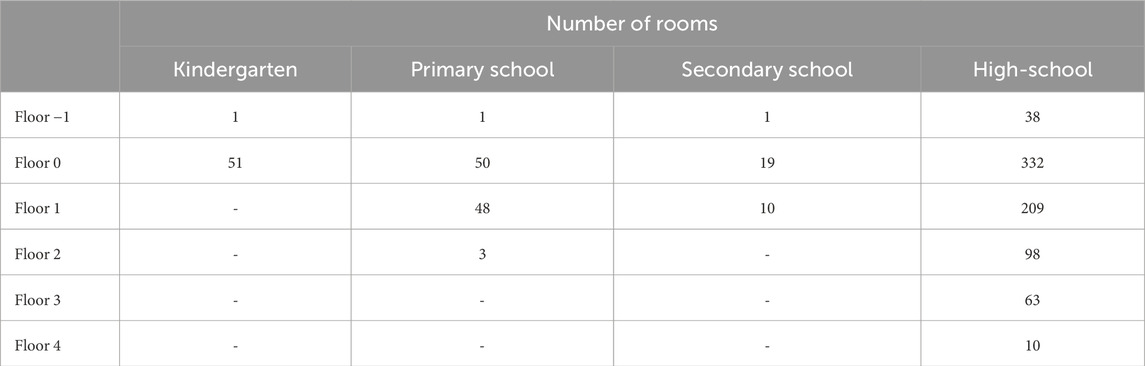
Table 2. Rooms per floor for each investigated school degree.
In all the rooms examined, air exchange is obtained by opening windows for 10 min every 2 h approximately.
The dataset was statistically analyzed by Matlab® software.
2.2 Measurements
222Rn measurements were performed using an LR-115 passive detector (79%), CR39 passive detector (5%), and electrets (16%). The detectors were located 2 m from the floor and 50 cm from the perimetral walls All detectors were exposed for 1 year (= two semesters).
2.2.1 LR-115
Cellulose nitrate LR-115 detectors were provided by Dosirad (France) and contained in diffusion chambers. After collection, the films were developed via a NaOH 2.5M chemical etching. Exposed films were scanned with a dual illumination scanner, and analysis of the acquired images was performed with ImageJ image processing software (Image Processing and Analysis in Java, version 1.46r, National Institutes of Health, Bethesda, MD, United States) for a region of interest (ROI) of 2.25 cm2 (De Cicco et al., 2014). The activity concentration of 222Rn (CRn) was then estimated using Formula 1:
where h is the exposure time in hours, e the detector efficiency, and R6.5 is the track density corrected by background track density and normalized to the nominal thickness of 6.5 µm. The measurements performed with LR-115 detectors presented an average uncertainty of 14% (median value = 11%).
2.2.2 CR-39
CR-39 detectors are solid-state nuclear track detectors (SSNTDs) of poly-allyl-diglycol-carbonate. The detection system is a closed chamber (Radout®, holder for CR-39 produced by Mi.am srl) selective for only 222Rn, excluding the other radioisotopes (220Rn and 219Rn), dust particles, and humidity. In addition, in this case, α particles emitted by 222Rn and their daughters damage the aggregation state of the polymer, leaving latent traces. These traces are made visible by an optical microscope after chemical etching consisting of immersing a CR-39 detector in 25% weight/volume sodium hydroxide (NaOH) solution at 98℃ and 1.181 g cm−3 density for 1 h, and then in 2% weight/volume acetic acid (CH3COOH) solution for 30 min. The detector was then rinsed in distilled water for 1 h in order to stop further etching (D’Avino et al., 2021). The CR-39 detector images were acquired using the Epson Perfection V800 Photo scanner® with a double lens, while the analysis used ImageJ software. The observed track densities were converted into radon activity concentrations using an appropriate calibration factor; more details are reported in Sabbarese et al. (2020). The measurements performed with CR-39 detectors presented an average uncertainty of 7% (median value = 6%).
2.2.3 Electret
The electrets are passive detectors consisting of a pre-electrostatically charged Teflon plate (initial voltage) connected to a diffusion chamber (Rad. Elec. Inc., Frederick, MD, United States). This allows the entry, by diffusion, of filtered air containing only 222Rn. Once at equilibrium, it decays, and the ionization produced by the decay will discharge the plate (final voltage) (Kotrappa et al., 1990).
The electret passive environmental radon monitor (E-Perm) electret ion chamber (EIC) system used in these measurements was in long–long term (LLT) configuration: chamber long term, with a volume of 50 mL and low sensitivity electret long term [ref]. The charge loss of the electret was measured using an electrometer (Rad. Elec. Inc. Mod. 6383-01, Frederick, MD, United States).
222Rn activity concentration was calculated by applying the appropriate calibration factor and exposure time, as per Equations 2, 3 (Kotrappa et al., 1988):
—whereVi and Vf are electret voltage readings before and after exposure, respectively;Td is exposure time in days;Gγ is gamma dose rate in µR h−1; C1 = 0.59, C2 = 0.02383, C3 = 0.0000112: constants are given by the manufacturer depending on the configuration and volume of the E-Perm chamber.
The measurements performed with electrets presented an average uncertainty of 40% (median value = 13%).
2.3 Radiological risk indices
Starting from measured 222Rn activity concentrations, three radiological indices were calculated, strongly correlating with the radon health risk (UNSCEAR, 2000; La Verde et al., 2022): AED, ELCR, and LCC. These indices were estimated by supposing the exposure time reported in Table 3, expressed in hours per year. Table 3 divides students from employees (teachers and administrative staff) and takes into account the occupational times (employment time for workers and time spent in school for students and teachers) following Italian legislation (https://www.miur.gov.it/orario-scuole).
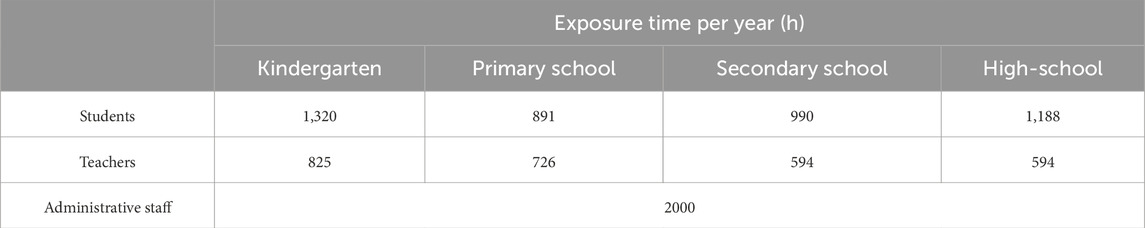
Table 3. Exposure time per year for students and employees divided by school type. The considered occupation factor follows Italian legislation (https://www.miur.gov.it/orario-scuole).
Room occupancy was divided as follows:
- Students were considered to occupy classrooms for all the time of Table 3
- Teachers were considered to work full-time in classrooms
- Administrative staff were considered to be employed full time in room type 3
We have not evaluated risk indices for room type 2, assuming that time spent by both students and staff was negligible with respect to the total amount of exposure time (i.e., less than 10 h per month following Italy’s Conference of the Presidents of the Regions and Autonomous Provinces of Trento and Bolzano (2003)).
AED was calculated as per Equation 4:
—where Cinh = 6.7 · 10−6 mSv·Bq−1·h-1 is the effective dose per inhaled gas 222Rn and progeny with an equilibrium factor of 0.4 (ICRP, 1987), T is the exposure time following Table 3, and CRn is the 222Rn activity concentration value.
The LCC is estimated as per Equation 5:
—where RFLC is the risk factor for lung cancer induction, assumed to be 18·10−6 mSv-1 (Crameri and Werner, 1989).
The ELCR was finally computed as per Equation 6:
Here, DL is the life expectancy and is assumed to be 79 years for male individuals and 83 years for female individuals in the region being considered (ISTAT, 2022). RF is the mortal cancer risk and is assumed 5.5 10−2 Sv-1 for the average population and 4.1 · 10−2 Sv-1 for adults (ICRP, 2017). The first value was that assumed for students and the second for teachers and administrative staff. ELCR is meant to estimate the excess of lifetime cancer risk of a lifetime exposure (Taalab et al., 2023), whereas here, at least for students, the exposure does not exceed 13 years. On the other hand, for administrative staff and teachers, we can assume that exposure to the risk factor is life-long (13 years minimum as student and about 42 years for workers). The same may be also extended for the calculation of LCC.
3 Results
3.1 Radon concentrations
Figure 2 reports whisker boxplots with the 222Rn activity concentration values divided per room type. The distribution mean value is 167 Bq/m3 in classrooms (std. dev. = 169 Bq/m3), 195 Bq/m3 in room type 2 (std. dev. = 267 Bq/m3), and 188 Bq/m3 in room type 3 (std. dev. = 269 Bq/m3). Activity exceeding the reference level of 300 Bq/m3 was shown in 17% of the classrooms, increasing to 19% for room type 2 and 20% for room type 3.

Figure 2. 222Rn activity concentration distributions as function of a room’s intended use. Dashed line represents the reference level of 300 Bq/m3 indicated in D. Lgs. 101/2020.
Considering 222Rn activity concentration values based on the building materials of concrete and tuff, the close relationship between tuff and the presence of indoor radon is evident (Figure 3). In fact, rooms in tuff buildings presented 222Rn activity concentration higher than 300 Bq/m3 in 34% of cases, with an average of 276 Bq/m3 (std. dev. = 260 Bq/m3); on the other hand, in just 13% of the measurements performed in concrete buildings, the concentration activity exceeded the 300 Bq/m3 reference level, with an average of 144 Bq/m3 (std. dev. = 177 Bq/m3). The significance of the difference between the two distributions in Figure 3 was analyzed via a T-test. The variances of the distributions were supposed to be unknown and unequal (Behrens–Fisher problem). The T-test conducted rejected the null hypothesis with a confidence level of 5% (p-value = 1.6605 · 10−8), confirming that tuff buildings presented statistically significant higher concentrations.

Figure 3. 222Rn activity concentration distributions as a function of the building material. Dashed line represents the reference level of 300 Bq/m3 indicated in D. Lgs. 101/2020.
Figure 4 reports 222Rn activity concentration values for each floor of the buildings. A decreasing gradient of the values can be seen as the distance from the ground floor increases, particularly from the trend of the maximum values of the distribution. No tuff buildings exceeding two floors were present in the study. Figures 5 and 6 split the data of Figure 4 in two, showing 222Rn concentration activity as a function of floors in tuff- and concrete-made buildings, respectively. In both cases, the dependence of the concentration on the floor remains, and as already shown in the boxplots in Figure 3, such concentration in tuff buildings is higher than those in concrete. In particular for Floor −1 (underground), the average concentration activity was 430 Bq/m3 for tuff buildings (Std. Dev. = 533 Bq/m3), with more than one out of three rooms investigated presenting values higher than the reference values of 300 Bq/m3. Such an average value reduces to 214 Bq/m3 (Std. Dev. = 295 Bq/m3) for concrete buildings, with just 16% of cases over the reference values. In the case of tuff buildings, the number of rooms with activity concentration over the reference value is 40% at ground floor, reducing to 22% at the first and second floors (two out of nine); the second-floor data included just nine samples. All three rooms investigated at the third floor presented activity concentration lower than 300 Bq/m3. Over-300 Bq/m3 rooms for concrete building resulted in 17% at the ground floor, 13% at the first floor, and 9% and 2%, respectively, at the second and third floors. No rooms with a concentration activity higher than 300 Bq/m3 were found on the fourth floor in concrete buildings.
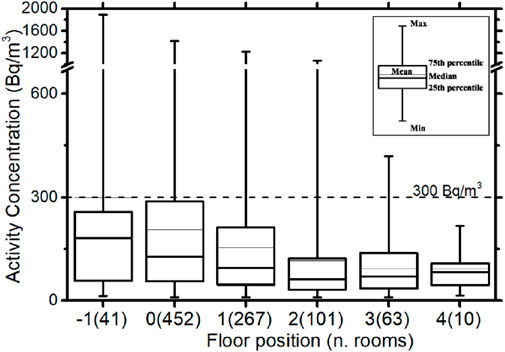
Figure 4. 222Rn activity concentration distributions as a function of the floor. Data includes both tuff and concrete buildings. Floors 3 and 4 are exclusively rooms from concrete buildings. Dashed line represents reference level of 300 Bq/m3 indicated in D. Lgs. 101/2020. Average value line for −1 floor overlaps the dashed line.
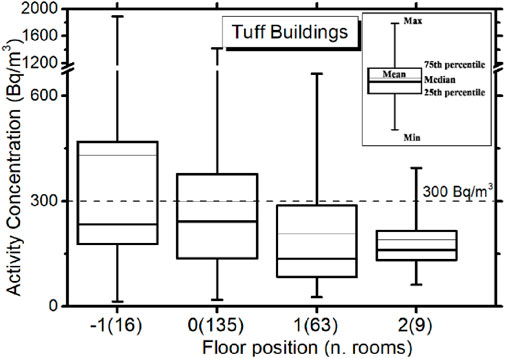
Figure 5. 222Rn activity concentration distributions as function of floor for tuff buildings. Dashed line represents reference level of 300 Bq/m3 indicated in D. Lgs. 101/2020.
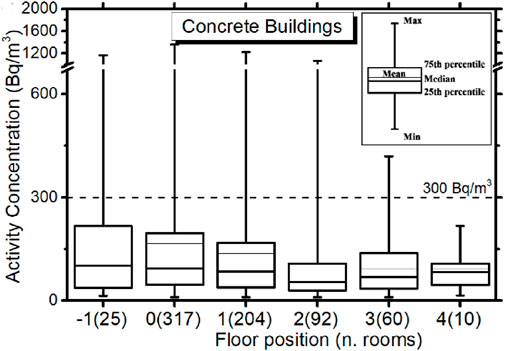
Figure 6. 222Rn activity concentration distributions as function of the floor for concrete buildings. Dashed line represents reference level of 300 Bq/m3 indicated in D. Lgs. 101/2020. For −1 floor, the 75th percentile line is also the average value.
Figure 7 shows the average concentration activity as function of the building floor for both tuff- and concrete-made buildings. In both cases, the average concentration monotonically reduces as the distance from the −1 floor increases. For all investigated floors, the average value in the tuff buildings is higher than in concrete buildings.

Figure 7. Average 222Rn activity concentration as a function of the floor for tuff and concrete buildings.
The boxplots in Figure 8 show the distributions of measured activity concentration for each investigated school type. Measurements for classrooms and room types 2 and 3 are merged. For kindergartens, primary schools, and secondary schools, the measured activity concentrations were close to 300 Bq/m3, on average; it resulted in 262 Bq/m3 in the first case (std. dev. = 158 Bq/m3) and 292 Bq/m3 for both primary and secondary schools (std. dev. of the distribution resulted in 189 Bq/m3 and 213 Bq/m3, respectively). A T-test confirmed no significant differences between activity distribution measured in kindergartens and primary and secondary schools. On the other hand, mainly due by the highest number of floors of investigated rooms (see Table 2) and the large prevalence of concrete buildings (see Table 1), the activity concentration in high schools was statistically lower (p-value = 6.028 · 10−4 for T-test between distribution in high-schools and primary schools). The average activity concentration of 222Rn in investigated rooms in high schools was 150 Bq/m3 (std. dev. = 205 Bq/m3), and just 12% of the total cases presented a concentration higher than 300 Bq/m3. This percentage was 40% for the kindergartens, 43% for primary schools, and 50% for secondary schools.

Figure 8. 222Rn activity concentration distributions as a function of school type. Dashed line represents reference level of 300 Bq/m3 indicated in D. Lgs. 101/2020.
3.2 Radiobiological risk indices
3.2.1 Workers
Figure 9 shows the AED distributions for teachers for each of the four school types. The distributions presented reflect the activity concentrations weighted for the working time of Table 3. The average AED ranges between 1.3 mSv (std. dev. of the distribution = 0.7 mSv) estimated for primary schools and 0.6 mSv estimated for high schools (std. dev. of the distribution = 0.6 mSv). For kindergartens and primary and secondary schools, the 75th percentile is lower than 2.0 mSv, reducing to 0.7 for the distribution of AED in high schools. The activity concentrations for room type 3 in Figure 2 were used for AED evaluation of administrative staff (Figure 10). Due to the smaller data and no differences of working time across the different school types, a single distribution of AED was produced by merging the concentration activities from all four school types. The exposure time was more than double with respect to the teachers (Table 3), with an AED for the administrative staff of 2.5 mSv, on average over the data with a distribution standard deviation of 3.6 mSv. The 25th and 75th percentiles of the distribution resulted in 0.5 mSv and 3.1 mSv, respectively.
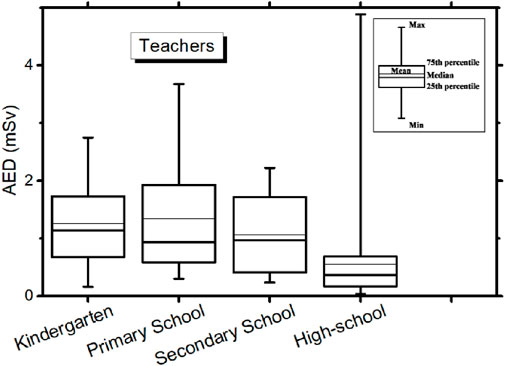
Figure 9. AED of teachers, divided by school type.
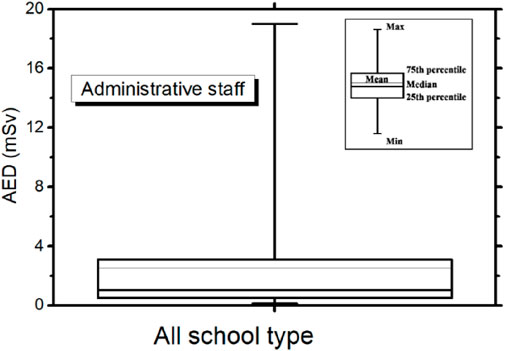
Figure 10. AED of administrative staff. Values for all schools are merged.
From the AED distributions were estimated the LCC for both worker categories—teachers and administrative staff. Table 4 reports that the LCC indices averaged over the computed distributions. These indices ranged from 10 per million teachers evaluated for exposure in high schools up to 24 per million teachers evaluated for primary schools. LCC reached 45 per million individuals in the case of administrative staff, averaged over all school types.

Table 4. LCC for teachers and administrative staff. Indices are expressed as mean value over the distribution derived from the AED.
ELCR values for teachers and administrative staff are reported in Table 5. These results indicate that at the measured level of concentration activity, a life-long exposure may increase the risk of developing a mortal cancer of 8.6% and 8.2% in female and male administrative staff, respectively. Reflecting reduced work time (see Table 3), ELCR is lower for teachers, ranging between 1.8 evaluated for males at high schools up to 4.6 for female teachers in primary schools.
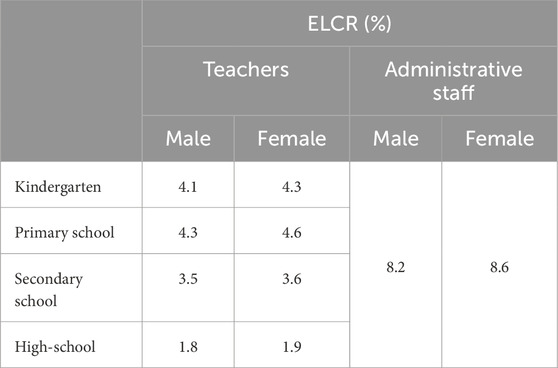
Table 5. ELCR mean values for teachers and administrative staff.
3.2.2 Students
The boxplots in Figure 11 report AED for the students. Data were differentiated on the basis of school type. For students at kindergarten, an average AED of 2.0 mSv was estimated (std. dev. of the distribution = 1.1 mSv), with a 75th percentile of the distribution at 2.8 mSv. The average value of the AED reduced for estimates related to primary school and secondary school, down to 1.6 mSv and 1.8 mSv, respectively (respective std. dev. of the distributions 1.1 mSv and 1.2 mSv). As a consequence of the lower assessed activity concentration (Figure 8), the AED for students in high school was also lower, showing an average value of 1.1 mSv (std. dev. of distribution = 1.3 mSv) and a 75th percentile of the distribution of 1.4 mSv.

Figure 11. AED of students, divided by school type.
The LCC and ELCR values for students are reported in Table 6. These values are calculated from AED as the average value over the derived distributions. Reflecting the dose value, LCC and ELCR values for high school students were lowest. Hence, LCC was 20 per million individuals and ELCR was 4.8% and 5.1%, estimated for male and female students, respectively. The highest values were estimated for kindergarten, with the LCC as 36 per million people, and ELCR 8.8% and 9.2% for male and female students, respectively.

Table 6. LCC and ELCR for students. Both indices are indicated as the mean value over the distribution derived from the AED.
4 Discussion
The activity concentration was analyzed as a function of the school type among four groups—kindergarten, primary school, secondary school, and high school—as a function of the floor and building material. Regarding this last aspect, we assessed a substantial higher 222Rn activity concentration in those schools constructed from tuff compared to those from concrete. The average activity concentration result was 276 Bq/m3 in the first cases, with 34% of the rooms investigated presenting values higher than 300 Bq/m3; in concrete-construction schools, the average concentration was 144 Bq/m3, with just 13% of cases over the 300 Bq/m3 reference level. In classrooms, where students and teachers spend the most of their time at school, the assessed average 222Rn activity concentration was 167 Bq/m3, with 17% of rooms exceeding 300 Bq/m3. The activity concentration was a little higher in all those rooms used for administrative functions, such as administrative rooms, secretariats, and directorates. Here, the average value was 188 Bq/m3, with 20% of the room exceeding 300 Bq/m3. The kindergartens under investigation had 37 out of 52 rooms in tuff buildings located at the −1 floor (one room) and at the ground floor (51 rooms), and the average 222Rn activity concentration was 262 Bq/m3, with 40% of the rooms with more than 300 Bq/m3. The average activity concentration was 292 Bq/m3 for both primary and secondary schools, with 43% and 50% respectively of the cases exceeding 300 Bq/m3. These average values reduced to 150 Bq/m3 in the high schools, whose rooms were located between the first and fourth floors in half the cases. The AED due to the 222Rn in the investigated places ranged from 1.1–2.0 mSv for students and 0.6–1.3 mSv for teachers; regarding administrative staff, an average AED was 2.5 mSv. The LCC risk index was 45 per million individuals for administrative staff and between 24 (for primary schools) and 10 (for high schools) per million people for teachers. ELCR for female teachers ranged 1.9%–4.6%, and with an estimated average of 8.6% for female administrative staff. Related to the slightly lower life expectancy, ELCR for male individuals was some decimals lower.
Some studies have reported 222Rn monitoring in schools worldwide, but no studies were also conducted on radiobiological risk indices estimation. Only Coretchi et al. (2023) reported results of annual effective dose AED for children in a classroom between a 0.21–4.88 mSv (average 1.19 mSv) interval, which is in agreement with the present study at 1.1–2.2 mSv. Mean activity concentrations in this study were compared with the results of the more accurate and comprehensive review of Zhukovsky et al. (2018), which reports 63 national and regional radon surveys in kindergartens and schools: 42 in Europe, 11 in Asia, four in Africa, and three in North America. The average value of radon activity concentration of the 63 radon surveys was 59 Bq/m3, particularly 98 Bq/m3 at ground floor. In Europe, the mean value was 130 Bq/m3. These values were much lower than the mean value obtained in this work—249 Bq/m3 and 285 Bq/m3 at ground floor. Higher values of radon activity concentration can be found in Albania-Vukpalaj (277 Bq/m3), Upper Austria (240 Bq/m3), Bulgaria-Kremikovtsi (339 Bq/m3), Spain-Galicia (318 Bq/m3), Greece-Xanthi (231 Bq/m3), and Macedonia (215 Bq/m3). Moreover, in this study, the radon concentration for rooms located on lower floors is higher than on the upper floors, which is a result of the closeness of these lower floors to the main source of radon—the soil—a trend that is supported by all the results in the review of Zhukovsky et al. (2018).
5 Conclusion
Recognizing that exposure to indoor radon can cause harm to human health, worldwide regulations have introduced limits and/or action levels for keeping the activity concentrations below a certain threshold. For example, the 2013/59/Euratom directive introduced for European Union Member States a reference level of an annual 222Rn average activity concentration of 300 Bq/m3 in working places. For planned action, knowledge of the distribution of the indoor 222Rn activity concentration over the territory is required. This study reported and analyzed 222Rn activity concentration in schools of the Italian region of Campania, which features volcanic soil characteristics that may be favorable to the presence of indoor 222Rn (La Verde et al., 2023). No extensive measurement campaigns had been conducted in this area, particularly regarding 222Rn in schools. This study measured the 222Rn activity concentration and also estimated dose and risk indices for students and workers who spent their time in the buildings investigated. This study reports the 222Rn activity concentration in schools from kindergarten to high school in the Campania region of Italy. Data focused on the building material and the intended use of the rooms. This second aspect was primarily to select those exposed to the radon activity and AED and health risks indices for time spent in indoor rooms. Rooms in buildings of tuff construction showed a 222Rn activity concentration of 276 Bq/m3, higher on average than the value calculated for concrete made buildings (144 Bq/m3). The average activity concentration was 262 Bq/m3 in kindergarten, and 292 Bq/m3 for both primary and secondary schools, with respectively 43% and 50% of the cases exceeding 300 Bq/m3. Such a percentage was 40% for the kindergartens. In the high schools, where classrooms were located in taller buildings, the average activity concentration was 150 Bq/m3. Administrative-purpose rooms had 188 Bq/m3 of average activity concentration. The average AED due to the exposure to 222Rn in the schools was estimated at 2.3 mSv for administrative staff; such an average value, evaluated for each of the school types, ranged between 1.3 mSv and 0.6 mSv for teachers and 2.0 mSv and 1.1 mSv for students. LCC was estimated at 24 per million people for teachers in primary schools; for administrative staff, LCC was 45 per million people. Similarly, ELCR was up to 4.6% for (female) teachers and up to 8.6% for (female) administrative staff.
The results of this study confirmed that some buildings and room features are significant determinants of indoor radon concentrations in schools—particularly the building’s floor and the main construction material. This information is key not only for scientific and technical materials in indoor air studies but also to decision-makers and school building managers responsible for protecting people’s health. Radon screening should be conducted in all school buildings, even in those located outside the risk areas identified in radon risk maps or in expected radon-prone areas according to Art. 11 of D. Lgs. 101/2020. Although radon testing is cheap, mitigation can be costly; governments should thus develop and fund initiatives to protect the health of children and school staff. School stakeholders should inform the school population of the results obtained and then inform regional and national authorities in order to secure public funding to implement remedial actions (Gagliardo et al., 2024; Portaro et al., 2023), ranging from simple mitigation techniques to renovating buildings with radon-proof materials, according to current legislation.
Data availability statement
The original contributions presented in the study are included in the article/supplementary material; further inquiries can be directed to the corresponding author.
Author contributions
FA: conceptualization, data curation, formal analysis, methodology, validation, visualization, and writing–original draft. GL: conceptualization, investigation, methodology, visualization, and writing–review and editing. RO: formal analysis and writing–review and editing. MH: investigation, validation, visualization, writing–review and editing. AS: data curation, formal analysis, methodology, visualization, and writing–original draft. MP: conceptualization, funding acquisition, project administration, resources, supervision, validation, visualization, and writing–review and editing.
Funding
The author(s) declare that no financial support was received for the research, authorship, and/or publication of this article.
Conflict of interest
The authors declare that the research was conducted in the absence of any commercial or financial relationships that could be construed as a potential conflict of interest.
Generative AI statement
The author(s) declare that no Generative AI was used in the creation of this manuscript.
Publisher’s note
All claims expressed in this article are solely those of the authors and do not necessarily represent those of their affiliated organizations, or those of the publisher, the editors and the reviewers. Any product that may be evaluated in this article, or claim that may be made by its manufacturer, is not guaranteed or endorsed by the publisher.
Footnotes
1https://www.who.int/news-room/fact-sheets/detail/radon-and-health
2https://www.health.harvard.edu/a_to_z/lung-cancer-overview-a-to-z
References
Ambrosino, F., La Verde, G., Colucci, M., Fanti, V., Barrale, D., Caciolli, A., et al. (2024). RadioLab project: knowledge of radon gas in Italy. Sci. Rep. 14, 1224. doi:10.1038/s41598-023-45809-6
Beir, V. I. I. (2006). “Health risks from exposure to low levels of ionizing radiation,” in Committee to assess health risks from exposure to low levels of ionizing radiation. Washington, DC: National Academies Press US: National Research Council.
Colucci, M., Ambrosino, F., La Verde, G., Groppi, F., and Pugliese, M. (2023). ISOradioLAb: an educational project on environmental radioactivity for Italian minor islands—the case study of Lampedusa and Linosa. Eur. Phys. J. Plus 138 (8), 691. doi:10.1140/epjp/s13360-023-04299-1
Conference of the Presidents of the Regions and Autonomous Provinces of Trento and Bolzano (2003). Guidelines for measuring radon concentrations in air in underground workplaces.
Coretchi, L., Ene, A., Virlan, S., Gincu, M., Ababii, A., Capatina, A., et al. (2023). Children’s exposure to radon in schools and kindergartens in the Republic of Moldova. Atmosphere 14 (1), 11. doi:10.3390/atmos14010011
Council Directive (2013). European Council Directive 2013/59/Euratom on basic safety standards for protection against the dangers arising from exposure to ionising radiation and repealing Directives 89/618/Euratom, 90/641/Euratom, 96/29/Euratom, 97/43/Euratom and 2003/122/Euratom. OJ of the EU. L13 2014, 57, 1–73.
Crameri, R., and Werner, B. (1989). The radon problem. Int. J. Radiat. Appl. Instrum. C Radiat. Phys. Chem. 34 (2), 251–259. doi:10.1016/1359-0197(89)90233-6
D’Avino, V., Pugliese, M., Ambrosino, F., Bifulco, M., La Commara, M., Roca, V., et al. (2021). Radon survey in bank buildings of Campania region according to the Italian transposition of euratom 59/2013. Life 11, 533. doi:10.3390/life11060533
De Cicco, F., Pugliese, M., Roca, V., and Sabbarese, C. (2014). Track counting and thickness measurement of LR115 radon detectors using a commercial image scanner. Radiat. Prot. Dosim. 162, 388–393. doi:10.1093/rpd/nct310
D.lgs 101/2020 (2020). Legislative Decree n. 101 implementation of Directive 2013/59/Euratom which establishes fundamental safety standards relating to protection against the dangers deriving from exposure to ionizing radiation. Rome, Italy: Gazz. Uff. n.201.
DPCM (2024). Decree of the president of the council of ministers on january 11, 2024; adoption of the national action plan for radon 2023-2032. Official journal of the Italian republic - ordinary supplement to the official journal, n. 43.
Durante, M., Grossi, G. F., Pugliese, M., Manti, L., Nappo, M., and Gialanella, G. (1994). Single charged-particle damage to living cells: a new method based on track-etch detectors. Nucl. Instrum. Methods Phys. Res. Sect. B Beam Interact. Mater. Atoms 94 (3), 251–258. doi:10.1016/0168-583x(94)95363-5
Eidy, M., Regina, A. C., and Tishkowski, K. (2024). “Radon toxicity,” in StatPearls. Treasure island (FL) (Treasure Island, FL: StatPearls Publishing).
Gagliardo, G., Hanfi, M. Y., La Verde, G., Pugliese, M., Gargiulo, N., Caputo, D., et al. (2024). Efficacy of zeolites in radon adsorption: state of the art and development of an optimized approach. Isot. Environ. Health Stud. 60 (4), 471–484. doi:10.1080/10256016.2024.2383709
Gordon, K., Terry, P. D., Liu, X., Harris, T., Vowell, D., Yard, B., et al. (2018). Radon in schools: a brief review of state laws and regulations in the United States. Int. J. Environ. Res. Public Health 15, 2149. doi:10.3390/ijerph15102149
ICRP (1987). International commission on radiological protection - lung cancer risk from indoor exposures to radon daughters. Publication 50. Volume 17 No. 1.
ICRP (2017). International commission on radiological protection - occupational intakes of radionuclides: Part 3. Publication 137. Volume 46 No. 3/4 2017.
ISTAT (2022). Italian national institute of statistics - life expectancy at birth in Italy – Campania region (demography).
Kotrappa, P., Dempsey, J. C., Hickey, J. R., and Stieff, L. R. (1988). An electret passive environmental 222Rn monitor based on ionization measurement. Health Phys. 54, 47–56. doi:10.1097/00004032-198801000-00002
Kotrappa, P., Dempsey, J. C., Ramsey, R. W., and Stief, L. R. (1990). A practical E-PERM (electret passive environmental radon monitor) system for indoor 222Rn measurement. Health Phys. 58, 461–467. doi:10.1097/00004032-199004000-00008
La Verde, G., Ambrosino, F., Ragosta, M., and Pugliese, M. (2023). Results of indoor radon measurements in Campania schools carried out by students of an Italian outreach project. Appl. Sci. 13 (8), 4701. doi:10.3390/app13084701
La Verde, G., Artiola, V., La Commara, M., D’Avino, V., Angrisani, L., Sabatino, G., et al. (2022). COVID-19 and the additional radiological risk during the lockdown period in the province of naples city (south Italy). Life 12 (2), 246. doi:10.3390/life12020246
Malanca, A., Pessina, V., and Dallara, G. (1991). Influence of tuff on the radon concentration in dwellings. J. Environ. Radioact. 14 (4), 295–303. doi:10.1016/0265-931x(91)90020-g
Mancini, S., Guida, M., Cuomo, A., and Guida, D. (2020). A geogenic approach for the Radon monitoring and the exposure assessment at a regional scale: the results of the Rad_Campania project. Adv. Geosci. 52, 87–96. doi:10.5194/adgeo-52-87-2020
Portaro, M., Tuccimei, P., Galli, G., Soligo, M., Longoni, C., and Vasquez, D. (2023). Testing the properties of radon barrier materials and home ventilation to mitigate indoor radon. Atmosphere 14 (1), 15. doi:10.3390/atmos14010015
Sabbarese, C., Ambrosino, F., De Cicco, F., Pugliese, M., Quarto, M., and Roca, V. (2017). Signal decomposition and analysis for the identification of periodic and anomalous phenomena in radon time-series. Radiat. Prot. Dosim. 177 (1-2), 202–206. doi:10.1093/rpd/ncx159
Sabbarese, C., Ambrosino, F., and Roca, V. (2020). Analysis by scanner of tracks produced by radon alpha particles in CR-39 detectors. Radiat. Prot. Dosim. 191, 154–159. doi:10.1093/rpd/ncaa140
Shergill, S., Forsman-Phillips, L., and Nicol, A. M. (2021). Radon in schools: a review of radon testing efforts in Canadian schools. Int. J. Environ. Res. Public Health 18 (10), 5469. doi:10.3390/ijerph18105469
Taalab, S. A., Mohamed, W. H., Abdel-Rahman, A. M., Alqahtani, M. S., La Verde, G., Pugliese, M., et al. (2023). Distribution maps and hazard of radioelements from granitic rocks in an Egypt region. Eur. Phys. J. Plus 138 (9), 828. doi:10.1140/epjp/s13360-023-04452-w
UNSCEAR (2000). “Sources and effects of ionizing radiation,” in Report of the united nations scientific committee on the effects of atomic radiation to the general assembly (New York, NY, USA: United Nations).
Keywords: ionizing radiation, radon measurements, radon exposure, dose assessment, school, radon risk indices, radiation protection
Citation: Ambrosino F, La Verde G, Oliva R, Hanfi MY, Sarno A and Pugliese M (2025) Indoor radon risk assessment in education buildings from kindergarten to high school in Campania region. Front. Built Environ. 11:1532791. doi: 10.3389/fbuil.2025.1532791
Received: 22 November 2024; Accepted: 22 January 2025;
Published: 26 February 2025.
Edited by:
Francesca Romana d’Ambrosio, University of Salerno, ItalyReviewed by:
Antoaneta Ene, Dunarea de Jos University, RomaniaSimona Mancini, University of Salerno, Italy
Copyright © 2025 Ambrosino, La Verde, Oliva, Hanfi, Sarno and Pugliese. This is an open-access article distributed under the terms of the Creative Commons Attribution License (CC BY). The use, distribution or reproduction in other forums is permitted, provided the original author(s) and the copyright owner(s) are credited and that the original publication in this journal is cited, in accordance with accepted academic practice. No use, distribution or reproduction is permitted which does not comply with these terms.
*Correspondence: Giuseppe La Verde, Z2l1c2VwcGUubGF2ZXJkZUB1bmluYS5pdA==