- 1Department of Civil Engineering, National Institute of Technology Patna, Patna, India
- 2Department of Civil Engineering, School of Engineering and Technology, Sharda University, Greater Noida, India
This study investigates the impact of nearby structures on the cyclic settlement mechanisms of shallow foundations in liquefiable soils using a numerical model based on Biot’s porous media theory. The model predicts excess pore water pressure and settlement by coupling equilibrium and continuity equations, solved using an implicit time integration scheme. Soil nonlinearity under cyclic loading is represented using generalized plasticity, boundary surfaces, and non-associated models. Three scenarios are simulated to study the effect of spacing between light and heavy foundations and variation in acceleration intensity. Results show that as spacing between foundations increases, lateral displacement and settlement decrease. Excess pore water pressure generation also decreases with increased foundation spacing. Soil just below the foundation exhibits maximum settlement, decreasing with depth. When input acceleration increases from 0.1 g to 0.15 g and 0.2 g, settlement increases by 40%–55% and 90%–110% respectively for both light and heavy foundations, regardless of spacing. Excess pore water pressure also increases sharply with higher acceleration intensity. The findings highlight the importance of considering foundation-soil-foundation interaction effects in liquefaction-prone urban settings and provide insights for designing resilient shallow foundations. The advanced numerical modeling approach offers engineers a more informed way to mitigate liquefaction risk and build safer, more durable structures in earthquake-prone areas.
1 Introduction
Liquefaction, which seriously harms engineering structures, is one of the most major earthquake-induced processes. Foundations settle as a result of a decline in shear strength and bearing capacity brought on by the building of pore water pressure during seismic activity. Buildings are frequently placed close to one another in metropolitan areas because there is a lack of available land. In the past, during the Niigata earthquake of 1964, liquefaction caused excessive settlement and tilting, which caused damage to multiple reinforced concrete buildings (Yoshimi and Tokimatsu, 1977; Seed and IIdriss, 1967; Nagase and Ishihara, 1988). The 1990 Luzon, Philippines earthquake caused liquefaction of the subsoil in Dagupan, which led to excessive settlement in several buildings (Adachi et al., 1992; Ishihara et al., 1993; Acacio et al., 2001). Building settling and tilt are influenced by the placement of nearby structures. Moreover, corner buildings have been shown to be significantly tilted and settled (Tokimatsu et al., 1991). According to Tokimatsu et al., (1994), the stability of a structure depends on its dimensions, confining pressure, and the shear stress that it and nearby structures place on one another. In their analysis of the 1999 earthquake in Adapazari, Turkey, Yoshida et al. (2001) discovered that shallow, thin, fully-soaked sand layers were to blame for the structures being damaged during liquefaction.
For a deeper understanding of this issue, several experiments using a centrifuge and a shaking table trials, were carried out in addition to the field research. Several centrifuge tests were performed by Liu and Dobry (1997) to look into the factors causing soil to settle and pore pressure to increase. The shear strains given by the superstructure and the post-liquefaction volumetric strains acted as the main mechanisms of the overall settlement, according to a centrifuge test conducted by Dashti et al. (2010). According to Marques et al. (2012) and Coelho (2013), first-order static shear stress that a solid foundation delivers has an impact on the history of excess pore pressure. Mason et al. centrifugal.'s experiments Mason et al. (2013) examined the connection between the seismic soil, foundation, and structure of framed buildings. Structure-soil-structure interaction (SSSI), which has been found to rely on the structural system and seismic motion, can have either a positive or negative effect. Two sets of seismic 1 g shaking table experiments on rigid circular foundations were carried out by Tsukamoto et al. (2012) to analyze the effects of shaking duration and the group effects of foundations. Settlements during the shaking period remained essentially constant, regardless of the foundation spacing. Yet, depending on the spacing, the settlements after the tremor differed. Foundations often settle less when they are close to one another. The dynamic impedance function relations for foundations for various frequencies and masses were researched by Ashoori and Pakiman (2015), Hayden et al. (2015). It was demonstrated that neighboring constructions tended to tilt away from one another and settle less than isolated structures. According to Kumar and Kumari (2019) investigation into the impact on the soil permeability and contact pressure under sinusoidal loading, foundation settlement increased as soil permeability rose. The majority of the investigations, which either used experimental findings or analytical answers, were conducted for isolated foundations without neighbouring structures. Yet, the close proximity of structures in metropolitan settings may impact the seismic reaction of foundations. Only a few research looked at the effect of nearby structures on the numerical settling process of shallow foundations. When designing and analyzing shallow footings, nearby foundations, and foundation-soil-foundation interaction (FSFI) effects are frequently disregarded. Such consequences are especially difficult to understand in seismic urban settings where neighboring buildings are built on saturated sand that has a high risk of liquefaction.
The current study considers the impact of nearby structures on the cyclical settlement mechanisms of shallow foundations. To investigate the behaviour of nearby shallow foundations, a numerical model based on Biot (1956) porous media theory was created. This theory predicts extra pore water pressure and settlement by fusing equilibrium and continuity equations. These equations have been solved using the implicit time integration scheme. Generalized plasticity, boundary surfaces, and non-associated models have been used to represent the soil’s nonlinearity under cyclic loading conditions. The effect of spacing between light and heavy foundations as well as a variation in acceleration intensity have been studied under three different scenarios that have been simulated.
This research addresses a key challenge in urban development; i.e., to protect structures from the damaging effects of liquefaction caused by earthquakes. By focusing on shallow foundations, the present paper explores how the proximity of neighboring buildings impacts seismic performance, offering practical insights for improving resilience. Unlike many studies that overlook the interaction between adjacent foundations, this work highlights the importance of foundation-soil-foundation interactions (FSFI) in earthquake-prone urban settings. By using advanced numerical modeling, the findings provide engineers with a more informed approach to designing safer, more durable foundations, supporting the construction of resilient cities.
2 Governing equations
A saturated porous media is seen as a two-phase system that consists of a fluid phase and a soil phase. For modelling the poroelasticity consolidation model of Biot’s linked fluid and mechanics, Phillips and Wheeler (2007) developed a finite element method. The equilibrium or momentum balance in this case has a mass balance for the entire soil and fluid system as well as a momentum balance for the fluid phase. Settlement of the solid phase (us), Settlement of the fluid phase relative to the solid phase (urf), and Pressure of the fluid phase are the unknowns in these sets of equations (P). The relative velocity of the fluid phase (urf) has little effect in dynamic issues when high-frequency oscillations are not significant, such as difficulties under earthquake loading, and is thus ignored.
Using the finite element method (FEM) for spatial discretization, the u-P formulation with the above-mentioned simplification is as follows:
Where, Q denotes the discrete gradient operator coupling the motion and flow equations, P is the pore pressure vector, S is the compressibility matrix, and H is the permeability matrix. M is the mass matrix, u is the solid displacement vector, B is the strain-displacement matrix, and is the effective stress tensor. The impacts of body forces and specified boundary conditions are included in the vectors fu and fp.
Time integration of the finite element Equations 1–5 is performed by using a finite difference time stepping algorithm proposed by Newmark (Newmark, 1959).
Similarly, for pore pressure terms; Zienkiewicz (Singh and Ghani).
To prevent the wave from propagating back into the soil layer, viscous damping, also known as Rayleigh damping, has been introduced into the dynamic equation as shown in equation (Acacio et al., 2001)
The coefficientsψ1 and ψ2 are dependent on damping ratio (ξ) and a certain frequency (ωi), such that
To improve the energy dissipation feature of the constitutive model, 5% Rayleigh damping is introduced at the dominant frequency motion.
3 Constitutive behaviour of soil
3.1 Generalized plasticity model PZ-III
A advanced constitutive model that can accurately reproduce the soil degradation process, which manifests as gradual resistance and stiffness changes over time, primarily as a result of repetitive loading, is essential for achieving an accurate soil response associated with the fluid-soil-structure interactions. The constitutive model taken into consideration in this study is based on the generalized plasticity theory; however, neither the yield nor the plastic potential surface is defined explicitly in this model (Singh and Ghani). As demonstrated, in Equations 8–17 the plastic potential function (g), the loading function (f) and the plastic modulus (HL) are related to the stress tensor invariants (p´, q, θ) as follows:
Where,
In equation (Tokimatsu et al., 1994; Yoshida et al., 2001; Liu and Dobry, 1997; Dashti et al., 2010; Marques et al., 2012; Coelho, 2013; Mason et al., 2013; Tsukamoto et al., 2012; Ashoori and Pakiman, 2015; Hayden et al., 2015) p´ = the mean effective stress; q = the generalized shear stress; θ = the Lode angle; I1, J2 and J3 are the stress tensor invariants; αg = the factor relating to the soil’s stress-dilatancy relationship; Mg = the phase transition line’s gradient; αf = the loading surface’s shape that is determined by the material constant, which is typically assumed to be the same as αg; Mf = the material parameter used to calculate the loading surface’s dimensions; H0 = a scaling factor for the plastic modulus; η(=q/p´) = the ratio of stresses; ηf = ((1 + 1/αf)Mf) = the constant for materials; β0 and β1 = material constant; and ξ = the cumulative plastic tension caused by deviatoric stresses.
The Generalized Plasticity Model PZ-III involves several parameters that govern the soil’s behavior under cyclic loading conditions. In our study, we considered a range of material parameters based on well-established values from the literature and calibrated them for the specific soil type and loading conditions used in the simulations. Below are the key parameters and their ranges:
i. Elastic Modulus (E): The elastic modulus of the soil was set within a range of 10 MPa–50 MPa, depending on the density and compaction of the soil.
ii. Poisson’s Ratio (ν): Poisson’s ratio was taken in the range of 0.3–0.35, reflecting the typical behavior of saturated soils.
iii. Phase Transition Line Gradient (Mg): The gradient of the phase transition line, which controls the soil’s dilatancy behavior, was selected in the range of 1.0–1.2.
iv. Plastic Modulus Scaling Factor (H0): The plastic modulus scaling factor, which influences the rate of plastic strain accumulation, was considered in the range of 500–1,000.
v. Stress-Dilatancy Factor (αg): The factor governing the relationship between stress and dilatancy was set between 0.8 and 1.1, depending on the relative density of the soil.
vi. Material Constant (Mf): The material parameter controlling the size of the loading surface was taken between 0.9 and 1.1, which defines the limit stress ratio in the soil.
vii. Cumulative Plastic Strain (ξ): The cumulative plastic strain, which affects the hardening/softening behavior of the soil, was varied between 0.1 and 0.3.
These parameters were calibrated through a combination of experimental data and literature references to ensure that the numerical model accurately reflected the real behavior of the soil under cyclic loading. The range of parameters was chosen to capture the essential aspects of soil behavior during liquefaction and to ensure that the model predictions remained robust across different scenarios. Complex soil behaviour results from cyclic loading. In order to accurately anticipate the appropriate value of displacements and excess pore pressure, the constitutive relation employed for numerical prediction should be able to simulate the soil behaviour during seismic loading taking into account permanent settlement, dilatancy, and hysteresis loops. In order to better understand the soil domain, a generalised plasticity, bounding surface, non-associated model has been utilised (Pastor et al., 1990). The boundary surface’s hardening parameter in this model takes into account both volumetric and deviatoric plastic strains during loading and unloading as shown in equation (Kumar and Kumari, 2019; Biot, 1956; Phillips and Wheeler, 2007; Newmark, 1959; Singh and Ghani, 2024).
In the Elasto-plastic analysis, as shown in Equation 18 the total strain increment ΔƐ is further separated into elastic strain ΔƐe and plastic strain components ΔƐp as:
The relationships presented in Equation 19 between incremental stress Δσ and incremental strains Δε have been derived from the theory of generalized plasticity. This relationship is expressed as:
where, Dep is defined as the elastoplastic constitutive matrix as:
In Equation 20, De denotes the elastic constitutive matrix, n represents vector of normal in loading direction, ngL/U denotes flow direction vector during loading or unloading condition, and HL/U represents loading or unloading plastic modulus.
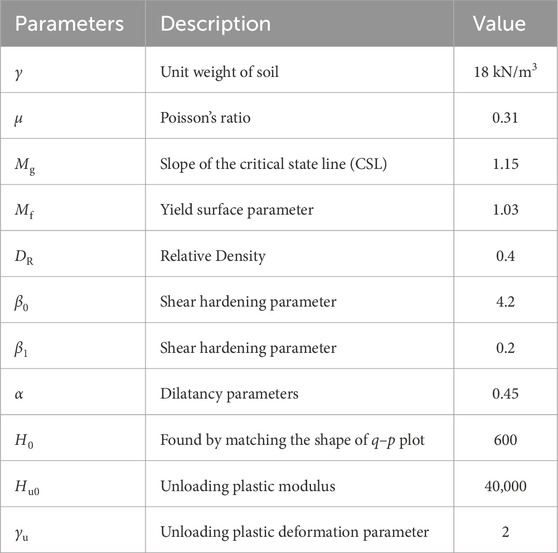
Table 1 provides key parameters used in geotechnical or constitutive modeling of soil behavior. Unit weight of soil represents the weight of the soil per unit volume, a basic physical property of the soil. In this case, the value is 18 kN/m³, which is typical for compacted soils or sands. Poisson’s ratio describes the ratio of lateral strain to axial strain in a material under loading. A value of 0.31 is common for many types of soil, indicating some degree of incompressibility. Slope of the critical state line; parameter describes the slope of the critical state line in the q-p stress space, which is related to the soil’s shear strength. Here, 1.15 is used, which may indicate typical behavior for granular soils. Moreover, Yield surface parameter defines the shape of the yield surface in soil models. A value of 1.03 suggests it is very close to the critical state line, indicating the proximity of yield behavior to the failure state. Relative density measures the compactness of granular soils. A value of 0.4 suggests the soil is in a medium dense condition, which affects its strength and deformation characteristics. Shear hardening parameter controls how much the soil hardens under shear. A value of 4.2 is used to define the rate of shear hardening, indicating how the soil strengthens with increasing strain. Furthermore, Secondary shear hardening parameter, 0.2, modifies the hardening behavior to capture the nonlinearity in the soil response under shear. Dilatancy refers to the volume change tendency of the soil when sheared. A value of 0.45 indicates moderate dilatancy behavior, where the soil tends to expand under shearing. H0 a model calibration parameter, with a value of 600, used to fit the shape of the stress-strain curve in the q (deviatoric stress) vs. p (mean stress) plot. Unloading plastic modulus describes the stiffness of the soil during unloading after plastic deformation. A high value of 40,000 indicates a relatively stiff response during unloading. Unloading plastic deformation parameter controls the extent of plastic deformation during unloading, with a value of 2, which moderates the plastic response in the model.
4 Validation
By contrasting the quantitative outcomes of the increased pore water pressure (IPWP) and settlement with the centrifuge model testing outcomes, they suggested using a FEM-based solution algorithm shown to be valid (Elgamal et al., 2005). Since the stress conditions it generates are the same as those in the full-scale prototype, it is regarded as the ideal technique for observing soil liquefaction behaviour. In order to induce in-flight earthquake shaking at the base of the soil or soil-structure model that produces the appropriate horizontal earthquake acceleration time history with an exceptionally minimal vertical component, an electrohydraulic shaker is put on the centrifuge platform (Dashti and Bray, 2013). Nevada sand, with a D50 of 0.13 mm, is a fine, homogenous soil that was utilized in all models of the centrifuge test. Sand has a permeability of k = 0.0021 cm/s. The top of the soil layer was taken into consideration as the ground water table. To verify the precision and validity of the suggested model, a 12 m saturated medium of Nevada sand with a relative density (Dr) of 40% was taken into consideration.
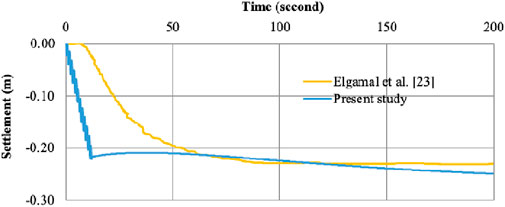
Figure 1 shows the comparison between the numerically simulated settlement and experimental values. Both the results are showing a similar trend. It is seen that the settlement curve is steep initially and after sometimes it becomes almost constant. Maximum settlements of 0.23 m and 0.249 m are observed from centrifuge test and numerical simulation respectively. Liu and Dobry (1997) have reported a similar trend.
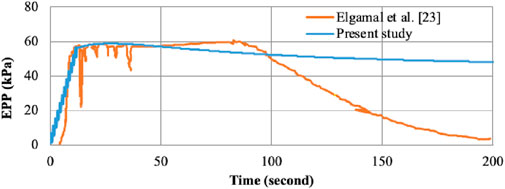
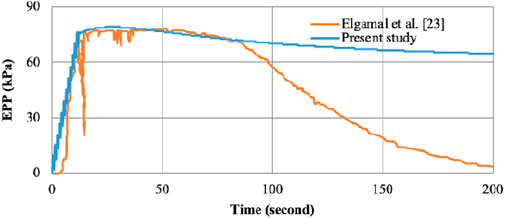
Figures 2, 3 show the variation of EPWP verses time at a depth of 4 m and 6 m of soil domain. The numerical results are approximately the same as the experimental results. The peak value of EPWP (60.789 kPa) obtained from the centrifuge test is nearly equal to numerically simulated values (59.012 kPa) at 4 m depth. A similar trend is also seen at 6 m depth in Figure 3. It is also noted that dissipation of EPWP in centrifuge model is faster as compared to the present study. This may be due to the reason that the finite element mesh gets almost distorted after liquefaction. Hence, all these results show close agreement in between the present model and the centrifuge model.
5 Numerical example
The objective of the numerical inquiry is to investigate the response of two adjacent footings to changes in foundation spacing. However, numerical analysis is done to determine liquefaction-induced settlements and EPWP of both light and heavy foundations in limited and complete liquefaction scenarios. The saturated loose soil strata of size 48 m 12 m have been taken into consideration when looking at nearby footings. In the analysis, a mixed element of 8–4 nodes have been employed. In this work, the entire unbounded soil domain is divided into the finite near-field and the truncated far-field unbounded soil domain using an artificial transmitting boundary. These boundary types are positioned far enough from the vibration source to absorb the energy of emitted waves and avoid reflections of such waves back at the structure. According to Supplementary Figure S1, Kelvin elements (spring and dashpot) are connected to the transmitting boundary’s nodes in both the vertical and horizontal directions. Considered is a loose soil mass with a permeability of 7.47 × 10⁻⁵ cm/s that is lying on a gravel layer with a greater permeability of 2.1 × 10⁻² cm/s. It is presumable that the plane strain condition will lessen the computational work. The static contact pressure of the heavy foundation (Foundation H), which is equivalent to the load of a nine-story building, is 86.78 kPa, whereas that of the light foundation (Foundation L), which is equivalent to the load of a three-story building, is 30.89 kPa. Building and foundation loads are also a part of these loads. It is applied to the soil domain’s surface as a surcharge load. The influence of space between two foundations as well as light and heavy foundation has been investigated using numerical simulations of three different circumstances.
In case- I, there was essentially no distance between the locations of the heavy and light footing. Supplementary Figure S2, which also includes significant model dimensions, illustrates it. In Case II and Case III, the foundations are spaced 8 m and 16 m apart, respectively, as shown in Supplementary Figures S3, S4. Side boundaries are restrained whereas bottom boundaries are not restrained. The soil domain is of depth 12 m and width 48 m. Foundation width is assumed as 4 m.
To simulate initial and final stress conditions, static analysis was performed before and after applying a cyclic load. The static forms of Equations 1 and 2 are presented in Equations 21, 22 as:
5.1 Case I (foundation response without spacing)
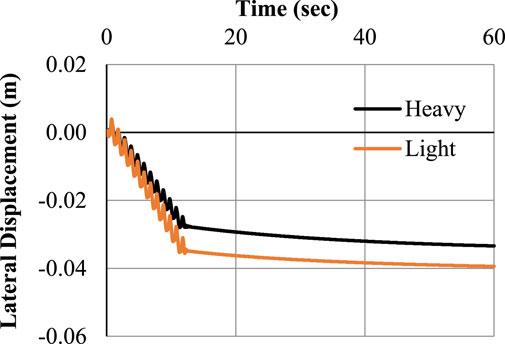
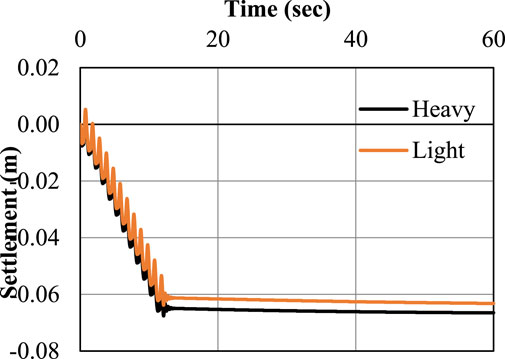
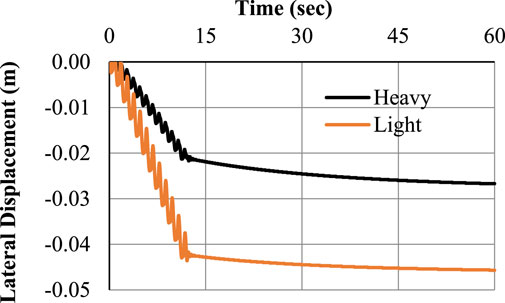
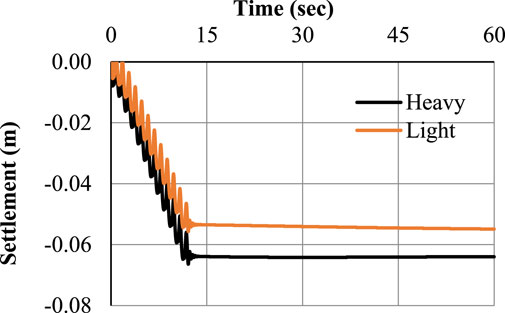
This condition is satisfied if there is no space between the two foundations. Ground motions with a sinusoidal amplitude of 0.1 g and frequency of 1 Hz have been input to the model. The results of lateral displacement and settlement of light and heavy foundations directly below the footing’s center are depicted in Figures 4, 5. Following the initial round of shaking, foundation settlement started right away and persisted over time. The heavy foundation moved farther than the light foundation when lateral displacement is compared. Partial drainage and the inertial force caused by foundation surcharge are the two primary mechanisms of foundation settling during shaking. For a light foundation, the maximum lateral displacement is 3.94 cm, whereas for a heavy foundation, it is 3.34 cm. Up to the conclusion of reconsolidation in the upper levels, foundations continued to resist settlement even after stimulation. The accumulation of settlement slowed gradually when the shaking stopped. During soil reconsolidation, the foundation just slightly settled. Recent centrifuge tests have identified and characterized that behavior. (Dashti and Bray, 2013). Up until 13 s after that sluggish settling is noticed, a steep curve is first visible. Settlements of 6.65 cm for heavy footing and 6.32 cm for light footing, respectively, were noted. The vertical settlement is always greater than the horizontal settlement for both heavy and light foundations. Just 5% more vertical settlement occurs in heavy footing compared to light footing, while 17% more lateral displacement occurs. The overburden effect of heavy footing may be to blame for this tendency in the results.
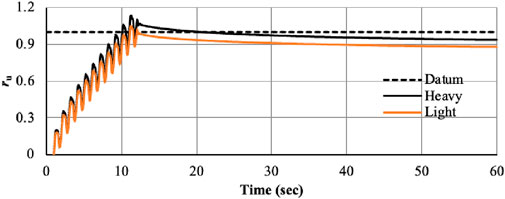
Since U represents excess pore pressure and v is the vertical effective stress, solid lines in the pore pressure curves indicate the datum line for ru values of 1. The red lines show whether or not the generated pore pressure reaches the fundamental liquefaction state due to excitation or the condition of zero effective stress. Theoretically, liquefaction should take place if ru goes to 1.0 and effective stress approaches zero. However, the theoretical definition of liquefaction incidence is merely ru = 1.0. Hazirbaba and Rathje (2004) conducted a series of strain-controlled undrained cyclic simple shear tests on the same material that was utilized in the field studies in order to properly compare in situ and laboratory pore pressure responses. According to typical test results, the formation of pore pressure progressed smoothly until it reached a pore pressure ratio, ru, of about 0.9, and the resultant shear stress reduced over time until it was extremely low as liquefaction neared. Therefore, if ru reaches a value larger than 0.9, it is assumed that liquefaction has occurred. The upper border of ru values that define the occurrence of liquefaction is 0.9.
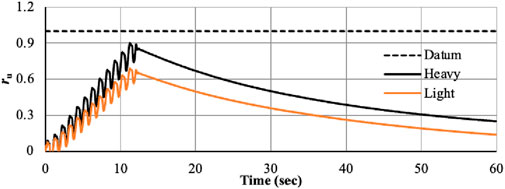
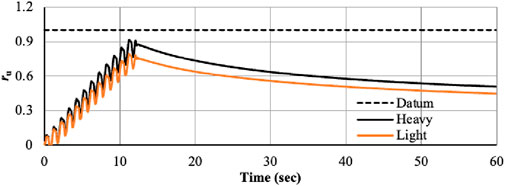
The time-dependent ru generated for heavy and light footings at various depths, including 3 m, 5 m, 7 m, and 9 m, is shown in Figures 6–9. Early liquefaction of upper layers caused rapid liquefaction to spread to the full depth of the soil profile immediately below the heavy footing after 12 s. While at a depth of 9 m, ru has a value larger than 1. In the case of both heavy and light foundations, results in liquefaction underneath both footings, which may be brought on by frequency amplification. Vertical and horizontal hydraulic gradients formed as soon as the excitation stopped, and the water in the area started to flow toward the foundations. After a considerable amount of time, seepage caused a big positive EPWP to be formed beneath the foundations. The soil began to reconsolidate from the base of the soil strata to the soil surface once the horizontal hydraulic gradients vanished and the water pressure in each level was equal. At 5 m and 7 m, Figures 7, 8 demonstrate no liquefaction. At bottom boundary of soil domain, the coarser layer of higher permeability is present so development of pore water pressure is negligible, hence, no liquefaction is observed. According to experimental research, the deposit’s excess pore pressure dissipation starts at the bottom and progresses upward from there. Locations closer to the base tend to dissipate the excess pore pressure more quickly than shallower levels, where the effective pore pressure tends to remain nearly constant for a while (Hazirbaba and Rathje, 2004).
5.2 Case II (response of foundations with an 8 m separation)
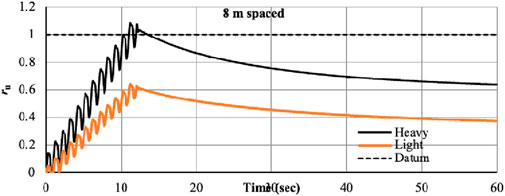
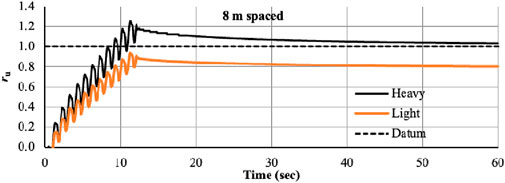
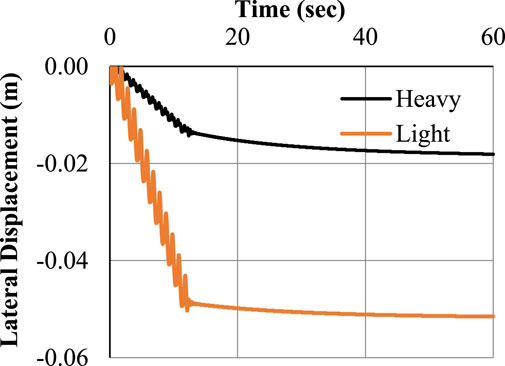
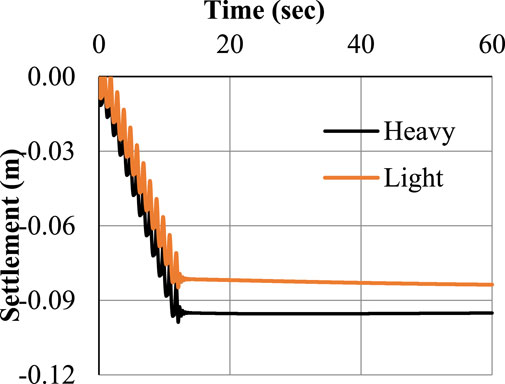
Case-II illustrates the situation when there is an 8 m separation between the light and heavy foundation. The identical input parameters as in instance I were used. The heavy and light foundations for lateral displacement and settlement are shown in Figures 10, 11 with an 8 m spacing. The outcome demonstrates that for light and heavy foundations, there is a greater variance in lateral displacement than in settlement. In case of light foundation, the maximum lateral displacement is 4.57 cm, whereas for heavy foundation, this value is 2.67 cm, i.e., a sharp increase of 71%. This variation is seen due to the weight of the foundation because the lighter foundation moves laterally more. Also, a mild variation is seen in vertical settlement (6.4 cm below heavy foundation and 5.49 cm below light foundation).
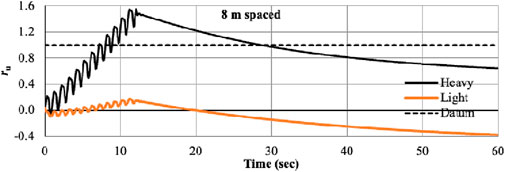
Due to spacing, no confinement occurs near the light foundation and hence no liquefaction occurs. The soil below the heavy foundation gets densified due to overburden load. In this case, the structure is subjected to increased dynamic effects due to the acceleration transmitted through the dense layer, which raises the shear stress beneath the structure. The increased settlement of soil beneath the shallow foundation is therefore anticipated if the dense layer’s decrement effect on settlement does not surpass its effect on earthquake exaggeration. The results of the peak value of ru verses Z/H (Non-dimensional depth factor) has been shown in Figures 12–15. It is observed that the value of ru is less than 1 beneath foundation L at all depths; hence, no liquefaction occurred during shaking event whereas soil just below heavy foundation liquefies at all depth. Although soil beneath the light foundation was not liquefied during shaking, it experienced a generation of large positive EPWP during different input motions. Also, large negative EPWP was generated under foundation H at all depths during shaking. The average value of ru under Foundation H is greater than 1.0 at all depths. After excitation, vertical and horizontal hydraulic gradients were created, and the water in the area started to flow toward the foundations. After a considerable amount of time, seepage caused a big positive EPWP to be formed beneath the foundations. Horizontal hydraulic gradients disappeared after the water pressure in each level was equal, and the soil started to reconsolidate from the base up to the soil surface.
5.3 Case III (response of foundations with spacing of 16 m)
Figures 16, 17 depict the settlement time histories of the light and heavy foundations in Case III. After the original earthquake, foundation settlement started right away and continued over time. Even after the excitation subsided and the underlying layers had finished reconsolidating, foundations kept sinking. The shaking halted, which caused a slowdown in the accumulation of settlement. Recent centrifuge testing revealed and recorded that behavior (Dashti et al., 2010). Partial drainage and inertial force caused by foundation surcharge appear to be the two main causes of foundation settling during shaking. Results show the lateral displacement variation is more as compared to settlement for light and heavy foundation. In case of light foundation lateral displacement is 5.15 cm and for heavy foundation 1.81 cm i.e., more in case of light foundation. But the settlement is more in case of heavy foundation, i.e., 9.51 cm for heavy and 8.37 cm for light.
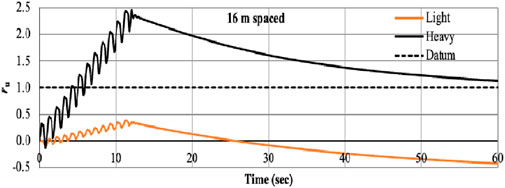
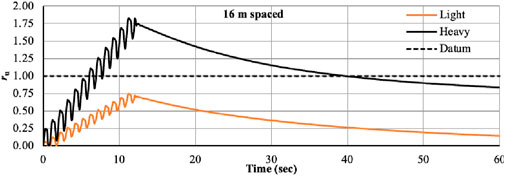
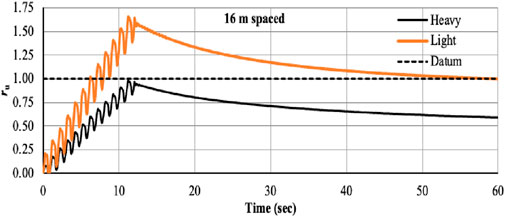
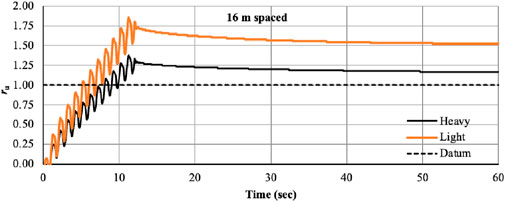
Figures 18–21 show the ru of thin (light) and thick (heavy) foundation situated at 16 m at 1 Hz frequency and 0.1 g acceleration for different depth. The results show that heavy foundation liquefies at each depth, but light foundation liquefies at 9 m depth. In case of light foundation at shallow depth, negative pore pressure developed, so no liquefaction was observed. As the depth increases, the ru value increases; it means pore pressurebecomes positive and at the depth of 9 m the value is greater than 1 and liquefaction occurs. For thick (heavy) footing at the shallow depth high pore pressure develops and liquefaction occurs at each depth.
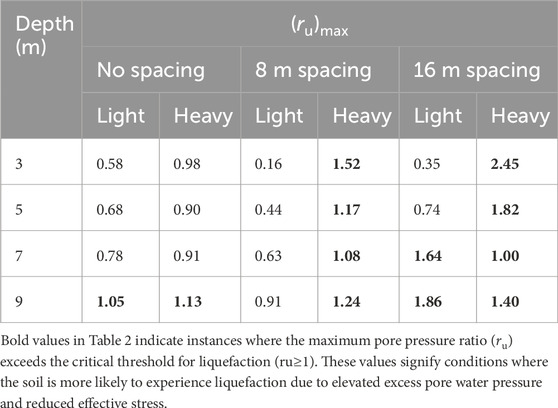
Table 2 compares the maximum ru for both thin (Light) and thick (Heavy) foundations at various spacings. The maximum ru value for light foundation and heavy foundation is determined to be roughly 1 at the greatest depth when there is no gap between the foundations. Both foundations exhibit mixed single-structure behaviour and monolithic behaviour to cause liquefaction. The maximum ru value is drastically reducing below the light foundation when the distance between the two foundations is extended to 8 m, yet this value is more than 1 throughout the entire depth of the heavy foundation. This illustrates that spacing is a crucial factor since separate foundation stress contours overlap at greater depths, which raises the ru value slightly. Also, the ru value below heavy foundation is noticeably high along all depth when spacing is raised to 16 m, but the trend for light foundation is different. At greater depths, the ru value below light foundation is noticeably high. As the distance between two foundations is widened, each foundation exhibits a distinct response. As a result, beneath a solid basis, it is perceived to have a very high value. Moreover, due to uniqueness, light foundation is exhibiting potential for liquefaction at greater depths. As a result, there is a critical distance between the foundations of two buildings that defines the point at which liquefaction begins to occur.
In the present study, an artificial transmitting boundary is applied to separate the whole unbounded soil domain into the finite near-field and the truncated far-field unbounded soil domain. These types of boundaries are placed at a sufficient location from the source of vibration to absorb the wave energy of outgoing waves and prevent them from reflecting back towards the structure. The near field is approximated horizontally within the range of 10 m on each side from the centre of the soil domain and vertically 12 m in the downward direction. The far field is assumed to be outside this boundary. Kelvin elements (spring and dashpot) are connected in vertical and horizontal directions to the nodes of the transmitting boundary as shown in Supplementary Figure S5.
The basic function of Kelvin element is to absorb the shear/surface energy of outward propagating waves and preventing backward reflection into the near field. The required mesh size with Kelvin elements is much smaller than that required with frequency independent viscous dampers.
5.4 Effect of variation in acceleration intensity
Lateral displacement and settlement analysis of light and heavy foundations situated at different spacing have been studied with the variation of acceleration intensity of 0.1 g, 0.15 g and 0.2 g. The results in the form of lateral displacement and settlement are represented in Table 3, which comprised of all the three cases, i.e., case I, case II and case III. From Table 3, it is clear that as the spacing between foundations increases, lateral displacement and settlement value decrease. When there will be no spacing, both foundations will behave like a mono-foundation. Hence close foundations or mono-foundation oscillates more strongly as compared to the isolated foundation. Mehrzad et al. (2016) observed similar findings using FLAC software which consider UBCSAND Model for non-linearity of soil. This model is based on uncoupled approach.
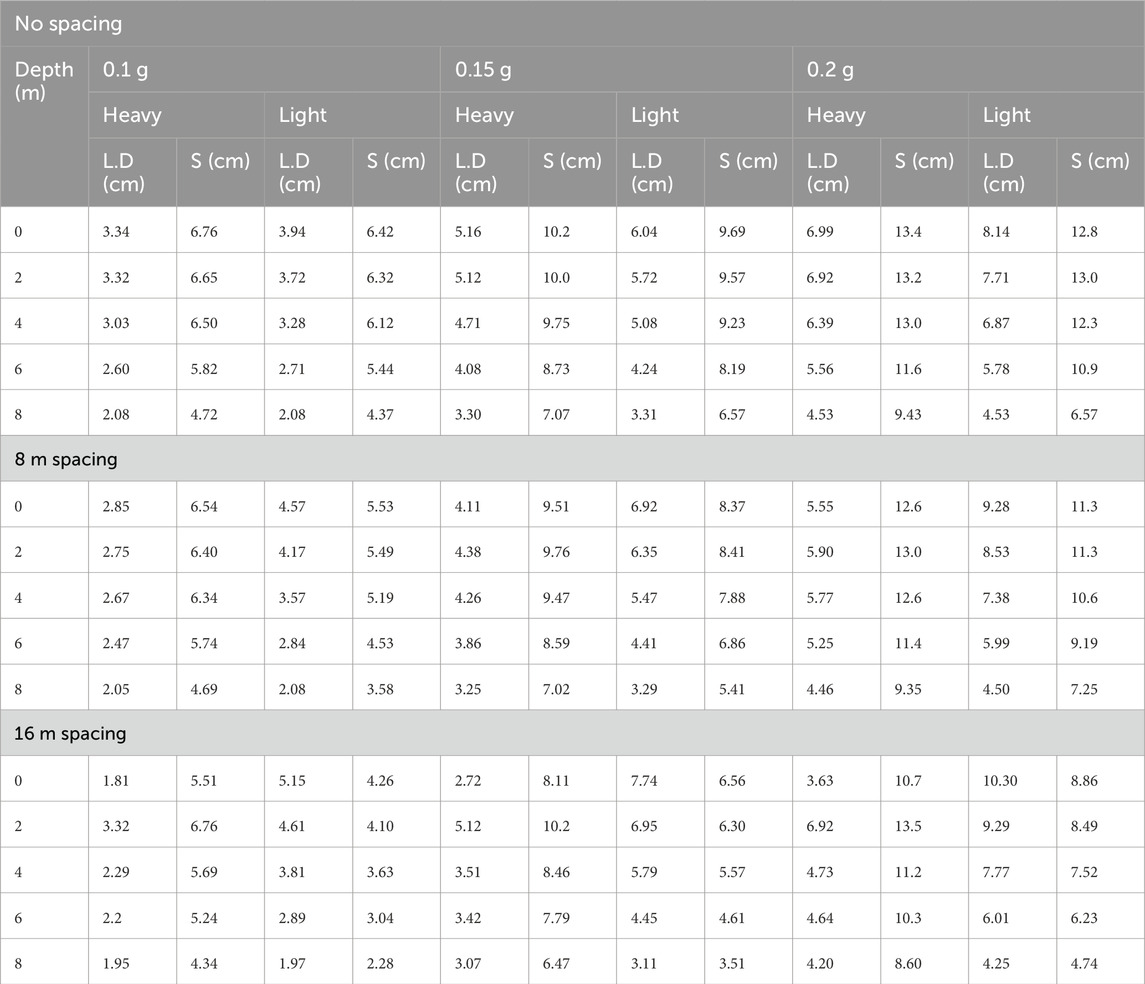
Table 3. Lateral displacement (L.D) and settlement (S) variation with acceleration at different depth.
The lateral displacement beneath the light footing is higher than that of heavy foundation, whereas settlement below the heavy foundation is high as compared to the light foundation. Sand tended to flow laterally towards the free side under the heavy foundation, and more settlement is seen on this side. The variation in acceleration intensity shows a significant change in a settlement. (Ghani and Kumari, 2022; Ghani et al., 2024; Ghani and Kumari, 2021; Thapa et al., 2024a; Thapa et al., 2024b). With the increase of acceleration intensity, settlements also increase in all the three cases. From the table, it is observed that when spacing is increased, the settlement is decreasing for the same acceleration intensity at a particular depth. Soil just below the foundation shows maximum settlement and decreases with depth. When the input acceleration increases from 0.1 g to 0.15 g and 0.2 g, settlement increases by 51% and 98%, respectively for soil just below foundation H (Case I). These increments are in the range of 40%–55% and 90%–110% for most of the case, irrespective of space in between light and heavy foundation. Similar type of trend is seen at all the depths. Therefore, it is observed that the influence of spacing does not mark able for predicting settlement when the intensity of acceleration is high.
Table 4 shows the EPWP variation with acceleration at different depth at the centre of heavy and light footings. For heavy foundation liquefaction occurs at most of the depth irrespective of spacing. In case I, the liquefaction does not trigger at 0.1 g acceleration in soil mass just below light and heavy footings. But in case of higher acceleration intensity of 0.15 g, liquefaction occurs at higher depths, whereas for heavy footing, liquefaction is observed at shallow depth. For 0.2 g acceleration intensity liquefaction phenomena observed for both light and heavy footings since the generation of extra pores water pressure. The EPWP development below the heavy footing is high as compared to the light foundation, may be due to punching effect. In a centrifuge experiment, Hayden et al. (2015) reported the same outcomes.
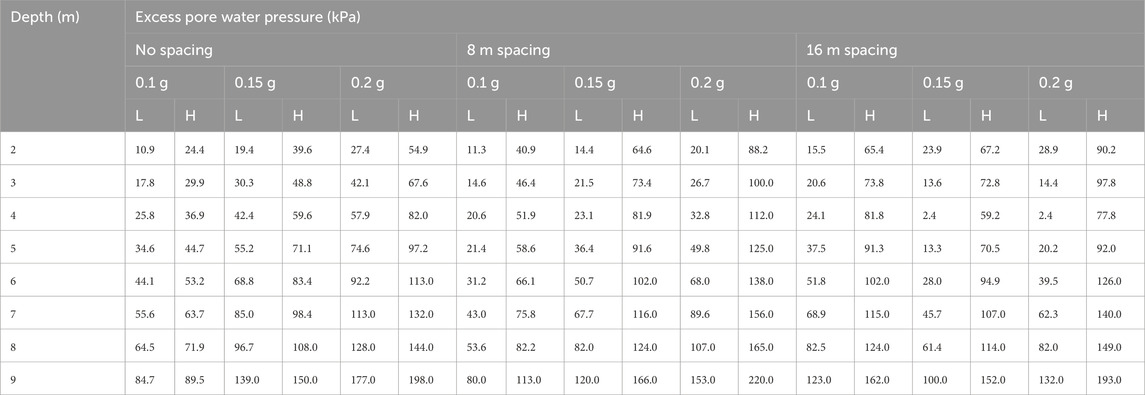
Table 4. EPWP of Light (L) and Heavy foundation (H) variation with acceleration and spacing at different depth.
6 Conclusion
Three cases of numerical analysis were performed to analyze the EPWP and settlement caused by liquefaction for shallow foundations. To explore the impact of seismic shaking strength and the size of liquefied zones, different shaking events were used to excite each model. Due to spacing and acceleration intensity, distinct changes in the settlement mechanisms of shallow foundations have been noted. The following broad conclusions can be drawn from the findings and discussion provided earlier:
➢ Lateral displacement and settlement value decrease with an increase in spacing between foundations.
➢ The generation of EPWP also decreases with an increase in spacing of foundations.
➢ The soil just below the foundation shows maximum settlement and decreases with depth.
➢ When the input acceleration increases from 0.1 g to 0.15 g and 0.2 g, settlement increases by 40%–55% and 90%–110% respectively for light and heavy foundation, irrespective of space in between them.
➢ EPWP also increases sharply with an increase in acceleration intensity.
In cases where there is a high likelihood of liquefaction, it is also suggested that it may not be prudent to ignore the interaction between two adjacent foundations; instead, FSFI effects should be taken into account during analysis and design. When foundations became closer together, they acted like a single foundation. In comparison to an isolated foundation, close foundations oscillated more violently. In this instance, the soil beneath the foundations oscillated like a rigid system in the same phase and amplitude. Urban areas rarely contain isolated buildings. The nearby foundations place more seismic strain on one another. Additionally, the superstructure’s impact was overlooked in the current research, which could make the analysis more difficult.
Data availability statement
The raw data supporting the conclusions of this article will be made available by the authors, without undue reservation.
Author contributions
SK: Conceptualization, Investigation, Methodology, Software, Validation, Visualization, Writing–original draft, Writing–review and editing. SG: Conceptualization, Methodology, Visualization, Writing–original draft, Writing–review and editing. AK: Investigation, Visualization, Writing–original draft.
Funding
The author(s) declare that no financial support was received for the research, authorship, and/or publication of this article.
Conflict of interest
The authors declare that the research was conducted in the absence of any commercial or financial relationships that could be construed as a potential conflict of interest.
Publisher’s note
All claims expressed in this article are solely those of the authors and do not necessarily represent those of their affiliated organizations, or those of the publisher, the editors and the reviewers. Any product that may be evaluated in this article, or claim that may be made by its manufacturer, is not guaranteed or endorsed by the publisher.
Supplementary Material
The Supplementary Material for this article can be found online at: https://www.frontiersin.org/articles/10.3389/fbuil.2024.1495499/full#supplementary-material
References
Acacio, A., Kobayashi, Y., Towhata, I., Bautista, R. T., and Ishihara, K. (2001). Subsidence of building foundation resting upon liquefied subsoil case studies and assessment. Soils and Found. 41 (6), 111–128. doi:10.3208/sandf.41.6_111
Adachi, T., Iwai, S., Yasui, M., and Sato, Y. (1992). “Settlement and inclination of reinforced concrete buildings in Dagupan City due to liquefaction during the 1990 Philippine earthquake,” in 10th world conference on earthquake engineering, International Association for Earthquake Engineering (IAEE) (Rotterdam: Balkema), 147–152.
Ashoori, T., and Pakiman, K. (2015). Dynamic response of different types of shallow foundation over sandy soils to horizontal harmonic loading. Int. J. Geotechnical Earthq. Eng. 6 (1), 1–14. doi:10.4018/IJGEE.2015010101
Biot, M. A. (1956). Theory of propagation of elastic waves in a fluid-saturated porous solid. I. Low-frequency range. J. Acoust. Soc. Am. 28 (2), 168–178. doi:10.1121/1.1908239
Coelho, P. (2013). Shallow foundations exposed to seismic liquefaction: a centrifuge based study on the level and mitigation of the effects. Ser. Rep.
Dashti, S., and Bray, J. D. (2013). Numerical simulation of building response on liquefiable sand. J. Geotechnical and Geoenvironmental Eng. 139 (8), 1235–1249. doi:10.1061/(asce)gt.1943-5606.0000853
Dashti, S., Bray, J. D., Pestana, J. M., Riemer, M., and Wilson, D. (2010). Centrifuge testing to evaluate and mitigate liquefaction-induced building settlement mechanisms. J. Geotechnical and Geoenvironmental Eng. 136 (7), 918–929. doi:10.1061/(asce)gt.1943-5606.0000306
Elgamal, A., Lu, J., and Yang, Z. (2005). Liquefaction-induced settlement of shallow Foundations and remediation: 3d numerical Simulation. J. Earthq. Eng. 9 (1), 17–45. doi:10.1080/13632460509350578Available at: http://www.bosai.go.jp/sougou/sanjigen/.
Ghani, S., and Kumari, S. (2021). “Plasticity-based liquefaction prediction using support vector machine and adaptive neuro-fuzzy inference system,” in Indian geotechnical conference (Singapore: Springer Nature Singapore), 515–527.
Ghani, S., and Kumari, S. (2022). “Consumption of industrial waste in sustainable development of clean and environmentally friendly city near an industrial area,” in Facets of a Smart City: computational and experimental techniques for sustainable urban development, 103.
Ghani, S., Kumari, S., and Choudhary, A. K. (2024). Geocell mattress reinforcement for bottom ash: a comprehensive study of load-settlement characteristics. Iran. J. Sci. and Technol. Trans. Civ. Eng. 48 (2), 727–743. doi:10.1007/s40996-023-01205-8
Hayden, C. P., Zupan, J. D., Bray, J. D., Allmond, J. D., and Kutter, B. L. (2015). Centrifuge tests of adjacent mat-supported buildings affected by liquefaction. J. Geotechnical and Geoenvironmental Eng. 141 (3). doi:10.1061/(asce)gt.1943-5606.0001253
Hazirbaba, K., and Rathje, E. M. (2004). A comparison between in situ and laboratory measurements of pore water pressure generation in 13th World Conference on Earthquake Engineering Vancouver B.C. Vancouver, Canada: Canada, 1220.
Ishihara, K., Acacio, A., and Towhata, I. 1993 Liquefaction-induced ground damage in dagupan in the july 16, 1990 Luzon earthquake Soils and foundations vol. , 33 no. 1 pp. 133–154. doi:10.3208/sandf1972.33.133
Kumar, A., and Kumari, S. (2019). Numerical modeling of shallow foundation on liquefiable soil under sinusoidal loading. Geotechnical and Geol. Eng. 37 (2), 517–532. doi:10.1007/s10706-018-0614-8
Liu, L., and Dobry, R. (1997). Seismic response of shallow foundation on liquefiable sand. J. Geotechnical and Geoenvironmental Eng. 123 (6), 557–567. doi:10.1061/(asce)1090-0241(1997)123:6(557)
Marques, A., Coelho, P., Cilingir, U., Haigh, S. K., and Madabhushi, G. (2012). “Earthquake-induced liquefaction effects on a shallow foundation,” in 15th world Conference on earthquake engineering Lisbon Portugal, 24179–24188.
Mason, H. B., Trombetta, N. W., Chen, Z., Bray, J. D., Hutchinson, T. C., and Kutter, B. L. (2013). Seismic soil-foundation-structure interaction observed in geotechnical centrifuge experiments. Soil Dyn. and Earthq. Eng. 48, 162–174. doi:10.1016/j.soildyn.2013.01.014
Mehrzad, B., Haddad, A., and Jafarian, Y. (2016). Centrifuge and numerical models to investigate liquefaction-induced response of shallow foundations with different contact pressures International Journal of Civil Engineering. Int. J. Civ. Eng. 14 (2), 117–131. doi:10.1007/s40999-016-0014-5
Nagase, H., and Ishihara, K. (1988). Liquefaction-induced compaction and settlement of sand during earthquakes. Soils and Found. 28 (1), 65–76. doi:10.3208/sandf1972.28.65
Newmark, N. M. (1959). A method of computation for structural dynamics. J. Eng. Mech. Div. 85 (3), 67–94. doi:10.1061/JMCEA3.0000098
Pastor, M., Zienkiewicz, O. C., and Chan, A. H. C. (1990). Generalized plasticity and the modelling of soil behaviour. Int. J. Numer. Anal. Methods Geomech. 14 (1), 151–190. doi:10.1002/nag.1610140302
Phillips, P. J., and Wheeler, M. F. (2007). A coupling of mixed and continuous Galerkin finite element methods for poroelasticity I: the continuous in time case. Comput. Geosci. 11 (2), 131–144. doi:10.1007/s10596-007-9045-y
Seed, H. B., and Iidriss, I. M. (1967). Analysis of soil liquefaction: Niigata earthquake. J. Soil Mech. and Found. Div. 93 (3), 83–108. doi:10.1061/JSFEAQ.0000981
Singh, S. V., and Ghani, S. (2024). A smarter approach to liquefaction risk: harnessing dynamic cone penetration test data and machine learning for safer infrastructure. Front. Built Environ. 10, 1495472. doi:10.3389/fbuil.2024.1495472
Thapa, I., Ghani, S., Waris, K. A., and Basha, B. M. (2024b). Prediction of California Bearing Ratio of nano-silica and bio-char stabilized soft sub-grade soils using explainable machine learning. Transp. Geotech. 49, 101387. doi:10.1016/j.trgeo.2024.101387
Thapa, I., Kumar, N., Ghani, S., Kumar, S., and Gupta, M. (2024a). Applications of bentonite in plastic concrete: a comprehensive study on enhancing workability and predicting compressive strength using hybridized AI models. Asian J. Civ. Eng. 25 (4), 3113–3128. doi:10.1007/s42107-023-00966-x
Tokimatsu, K., Kojima, H., Kuwayama, S., Abe, A., and Midorikawa, S. (1994). Liquefaction-induced damage to buildings in 1990 Luzon earthquake. J. Geotechnical Eng. 120 (2), 290–307. doi:10.1061/(asce)0733-9410(1994)120:2(290)
Tokimatsu, K., Midorikawa, S., Tamura, S., Kuwayama, S., and Abe, A. (1991). “Preliminary report on the geotechnical aspects of the Philipine earthquake of July 16, 1990,” in Second international conference on recent advances in geotechnical earthquake engineering and soil dynamics (St. Louis Missouri), 1693–1700.
Tsukamoto, Y., Ishihara, K., Sawada, S., and Fujiwara, S. (2012). Settlement of rigid circular foundations during seismic shaking in shaking table tests. Int. J. Geomechanics 12 (4), 462–470. doi:10.1061/(asce)gm.1943-5622.0000153
Yoshida, N., Tokimatsu, K., Yasuda, S., Kokusho, T., and Okimura, T. (2001). Geotechnical aspects of damage in Adapazari city during 1999 kocaeli, Turkey earthquake. Soils and Found. 41 (4), 25–45. doi:10.3208/sandf.41.4_25
Keywords: finite element method (FEM), liquefaction, foundation, spacing, acceleration intensity, excess pore water pressure (EPWP), settlement, cyclic load
Citation: Kumari S, Ghani S and Kumar A (2024) Smart modeling of soil-foundation interaction using coupled mechanisms: a numerical framework for liquefaction risk mitigation. Front. Built Environ. 10:1495499. doi: 10.3389/fbuil.2024.1495499
Received: 12 September 2024; Accepted: 18 October 2024;
Published: 05 November 2024.
Edited by:
Jitendra Khatti, Rajasthan Technical University, IndiaReviewed by:
Anil Choudhary, National Institute of Technology, IndiaRashid Mustafa, Katihar Engineering College, India
Copyright © 2024 Kumari, Ghani and Kumar. This is an open-access article distributed under the terms of the Creative Commons Attribution License (CC BY). The use, distribution or reproduction in other forums is permitted, provided the original author(s) and the copyright owner(s) are credited and that the original publication in this journal is cited, in accordance with accepted academic practice. No use, distribution or reproduction is permitted which does not comply with these terms.
*Correspondence: Sufyan Ghani, c3VmeWFuLmdoYW5pQHNoYXJkYS5hYy5pbg==
 Sunita Kumari
 Sufyan Ghani
 Amrendra Kumar1