- College of Civil Engineering, Inner Mongolia University of Technology, Hohhot, China
The dynamic behavior of liquid storage tanks represents a pivotal research area concerning structural safety and reliability. Notably, sloped bottom tanks exhibit heightened sloshing with reduced liquid mass compared to rectangular counterparts. This study adopts a hybrid approach that seamlessly integrates the linear potential-flow theory, renowned for its analytical rigor in fluid dynamics modeling, with principal component analysis (PCA), a potent technique for dimensionality reduction and feature extraction. The hybrid methodology initially employs the linear potential-flow theory to simulate the fundamental fluid dynamics within sloped bottom tanks subjected to horizontal excitation. Subsequently, PCA is applied to the simulated data, identifying key components of liquid sloshing wave height variations. Through the analysis of these principal components, an accurate model of the maximum sloshing wave height is derived, achieving a close correlation with ANSYS simulation results, exhibiting a correlation coefficient of 0.98 and a mean absolute error of 2.5%. This approach uniquely facilitates the evaluation of the intricate interplay between multiple factors, including tank geometry and excitation frequency, on the dynamic characteristics of liquid sloshing waves in sloped bottom tanks. The findings emphasize the significant influence of tank height and tilt angle, with a sensitivity analysis indicating a 4.07% increase in maximum wave height per degree increase in tilt angle under specified experimental conditions. This comprehensive methodology not only enhances understanding of the complex liquid sloshing phenomenon but also provides precise theoretical and practical guidance for fluid sway control strategies. Future investigations will further expand the scope and elucidate the fundamental mechanisms governing liquid sloshing dynamics.
1 Introduction
The seismic behavior of liquid storage tanks has been a subject of extensive research, particularly in understanding the complex fluid-structure interactions (FSI) and the resulting dynamic responses under seismic loading. Fluid sloshing, a key phenomenon in these systems, can cause significant structural damage during earthquakes, necessitating a deeper understanding of its dynamics. Early studies, such as those by Housner, 1963, laid the foundation by developing models that treat the fluid motion as an equivalent mass system, simplifying the complex interactions between the tank and the liquid (Barik and Biswal, 2023a; Barik and Biswal, 2023c). These models were instrumental in the initial design of seismic-resistant tanks, though they often simplified the complexities of fluid motion, particularly during large seismic events.
However, recent advances have recognized that the traditional methods do not fully capture the nonlinear and time-dependent behaviors of fluid sloshing, especially in the presence of seismic isolation techniques. Housner’s widely-used equivalent mass model, for instance, provides a basic framework but can lead to inaccuracies under certain conditions, particularly in tanks with non-horizontal bottoms or when complex fluid-structure interactions are at play (Barik and Biswal, 2023c; Housner, 1963). To address these challenges, researchers have increasingly focused on more sophisticated approaches, integrating computational fluid dynamics (CFD) and finite element analysis (FEA) with experimental studies to simulate more realistic seismic responses.
Recent contributions from Barik and Biswal (2022,2023,2024)have been particularly influential in advancing this field by exploring the role of seismic isolation in mitigating the effects of fluid sloshing. Their work on base-isolated rectangular tank-liquid-block systems, using lead rubber bearings (LRBs), demonstrated how seismic isolation can significantly alter the dynamic response of fluid storage systems, reducing both impulsive and convective sloshing responses during seismic events. In particular, Barik and Biswal (2023) showed that the LRBs effectively decouple the tank from the seismic forces, providing enhanced stability and reduced fluid motion (Barik and Biswal, 2023a). Building on this, Barik and Biswal (2023) extended the analysis by incorporating internal submerged blocks, revealing how these blocks can complicate the sloshing behavior by affecting both the impulsive and convective components of fluid motion (Barik and Biswal, 2023b). Their findings highlighted the need for accounting for such internal structures in seismic analysis, as they can substantially increase the seismic load and alter the system’s response.
Further advancing the study of nonlinear effects, Barik and Biswal (2023) also assessed the performance of laminated rubber bearings in seismically isolated tanks, emphasizing the importance of nonlinear dynamic assessment in understanding the true behavior of fluid tanks under large earthquake motions (Barik and Biswal, 2023c). Their work showed that while seismic isolation systems like laminated rubber bearings are effective in damping out large motions, they do not eliminate the nonlinear interactions between the fluid and the tank under extreme seismic conditions. Similarly, Barik and Biswal (2022) investigated the impact of near-fault earthquakes, finding that the unique characteristics of these events—such as long-period ground motions and large acceleration pulses—induce significant nonlinear behavior in both the isolator and the fluid, leading to increased sloshing heights and more complex fluid-structure interactions (Barik and Biswal, 2022a).
In addition to seismic isolation, the role of internal baffles and other structural modifications in controlling sloshing has garnered increasing attention. Barik and Biswal (2024) explored this concept by analyzing the effect of bottom-mounted vertical baffles in a base-isolated fluid tank subjected to irregular seismic excitation. Their study showed that internal baffles can effectively reduce fluid motion by controlling the sloshing wave heights and stabilizing the fluid surface during seismic events. This finding is particularly relevant as it suggests that combining seismic isolation with structural modifications such as baffles offers a comprehensive solution to managing fluid sloshing in seismic design (Barik and Biswal, 2024).
These studies underscore the growing recognition of the need to combine traditional seismic isolation techniques with advanced fluid-structure interaction models to improve the safety and reliability of fluid storage systems. Furthermore, recent numerical methods such as Principal Component Analysis (PCA) have been employed to analyze the effects of multiple interacting factors on fluid sloshing, as explored by (Housner, 1963). These data-driven approaches enable a more systematic understanding of the multi-factorial influences on fluid behavior, providing a powerful tool for optimizing seismic designs.
2 Mathematical formulation
2.1 Principal function
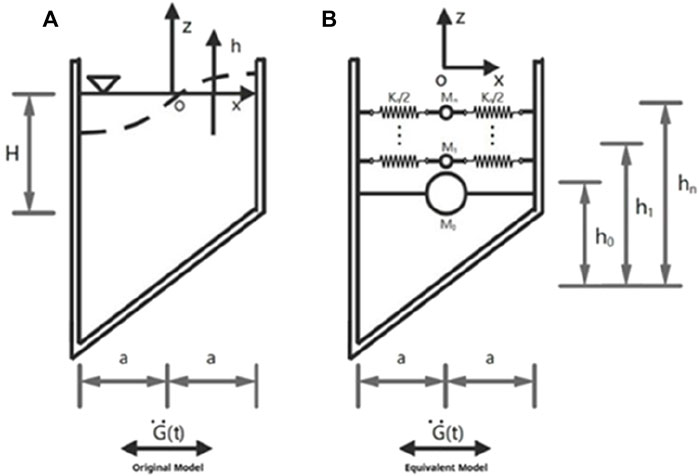
A rectangular container for storing liquids with an inclined base is shown in Figure 1. This container has a laterally enlarged width of
It is worth noting that in the reservoir structure shown in Figure 1A., the origins of the oxz coordinate axes are located at the center of the highest point of the liquid level and the center point of the highest cross section of the reservoir respectively after being subjected to a horizontal acceleration along the x-axis horizontal acceleration
Where Equations 1–4 in the
The pressure exerted by the liquid medium is:
In fluid dynamics analysis, the time variable is represented by the t denoted by, the velocity potential function is denoted by
As in Equations 7, 8 the total horizontal kinetic force applied to the liquid storage facility needs to be calculated accurately and considered in an integrated manner in order to fully reflect the combined effects of the various kinetic factors.
In this equation, the horizontal combined force on the right-hand side is assigned a positive value, while the horizontal combined force on the left-hand side is assigned a negative value. In order to ensure consistency and accuracy in the calculations, the positive and negative signs were determined in a clockwise direction for the overturning moment at the centre point of the bottom of the liquid. This is illustrated in the following example.
Among them.
Figure 1B depicts a mechanical model of a reservoir structure with an inclined base. The model consists of a fixed mass
Based on simulation principles (Ogata, 2010; Kreyszig, 2011), i.e., Equations 9–12, are equivalent to Equations 13, 14. By comparison it can be determined that there exist two time-dependent functions
Among them:
In addition, the maximum amplitude oscillation of the fluid system is related to the mass of the equivalent single-degree-of-freedom system
2.2 PCA-based dynamic evaluation for liquid sloshing wave height analysis
In light of the findings of Amato et al. (2020), who investigated the spatio-temporal prediction of environmental data, a novel framework has been proposed that employs deep learning techniques to efficiently process high-dimensional, spatio-temporally correlated data, thereby enhancing prediction accuracy (Amato et al., 2020). In light of this, the present study combines principal component analysis (PCA) with time series modelling, with the objective of simplifying the high-dimensional complexities inherent to the analysis of liquid sway wave heights while retaining the most important dynamic features. By extracting the principal components through PCA, redundant information among the variables is reduced, while the time series model captures the temporal dynamics of the wave height changes, thus providing a more accurate model for predicting future wave height fluctuations. This combined approach not only improves the reliability of the prediction, but also effectively copes with the complex spatio-temporal characteristics in liquid wobble systems.
Firstly, the standardised data matrix
The reduced matrix
Where λi is the ith feature value, ensuring that the main information is retained. Each column of the downscaled principal components Z is an independent time series. In order to capture the dynamic characteristics of the principal components in the time dimension, an autoregressive integral sliding average model (ARIMA) is applied to each principal component.
The model combines autoregressive (AR) and moving average (MA) components, rendering it suitable for modelling complex dynamic systems. Furthermore, to address potential volatility in the principal component series, it can be combined with the GARCH model.
Equations 20–24 introduction of the GARCH model facilitates the description of the amplitude of wave height fluctuations and enables the prediction of these fluctuations in conjunction with the results of principal component analysis (PCA).
The combination of PCA and time series analysis allows for a more precise expression of the dynamic response pattern of liquid wave height. Additionally, the relationship between the dynamics of each principal component and physical quantities is revealed. For instance, the first principal component may represent the main wave height trend, while the second principal component may contain the effect of the tilt angle. By predicting the future wave height change in the direction of the principal components, their time-series prediction in the post-decomposition space is achieved.
3 Numerical analysis
3.1 Finite element analysis model
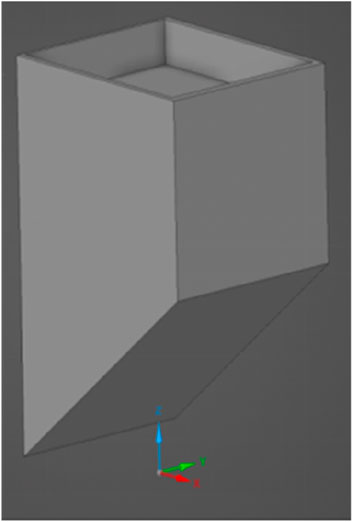
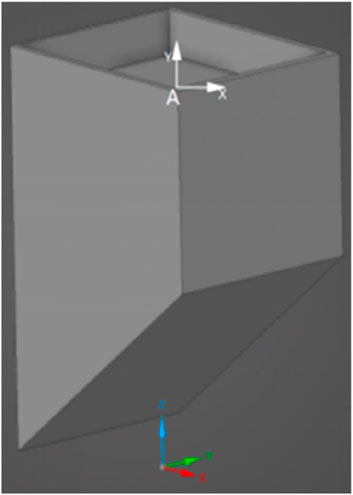
To address the issue of water supply for people’s livelihood, a construction team in Inner Mongolia, China, designed and constructed a storage tank based on the site’s topographic features, as depicted in Figure This structure features a rectangular liquid storage structure with an inclined bottom, measuring 10 m in length and width. It is worth noting that this figure is presented according to the editing of the geometric structure of the real picture in ANSYS. The structure stands 12 m tall from top to bottom, with a specific angle at the bottom. The structure’s walls have a thickness of 0.05 m, a modulus of elasticity of 2.07 × 10¹¹ Pa, a Poisson’s ratio of 0.3, and a density of 7,850 kg/m3. In terms of the stored liquid, the free surface is 10 m from the lowest point of the bottom, and the liquid is assumed to have a modulus of elasticity of 2.1 × 10⁹ Pa and a density of 1,050 kg/m³.
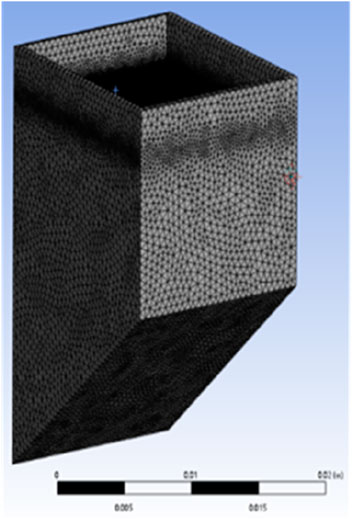
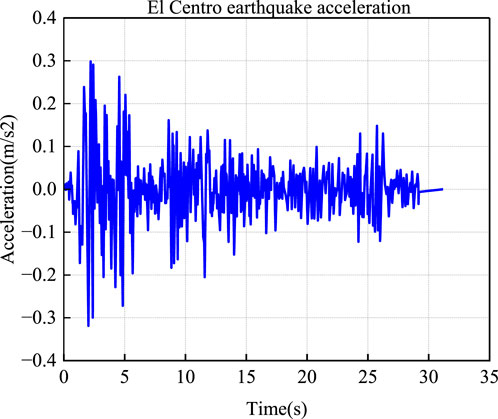
In the construction of the model and the performance of meshing using ANSYS software, the liquid surfaces are meshed in greater detail than other areas, given that the study is focused on these surfaces. This is illustrated in Figure 2. The software offers a variety of input methods, primarily GUI (Graphical User Interface) and Command Flow. The GUI operation is intuitive and straightforward, but it can be unwieldy when working with complex models, as it often necessitates repetitive operations. In contrast, the command flow approach is more efficient for modifying the model, requiring only a few lines of code to be altered (ANSYS Inc, 2020). As illustrated in Figure 3, the actual El Centro seismic waveform was imported to simulate horizontal excitation as shown in Figure 4, as per previous studies. Subsequently, the ACEL command was employed in ANSYS to guarantee that all units were synchronised to receive consistent seismic acceleration excitation.
3.2 Fluid sway height analysis
The highest theoretical height of the fluid’s oscillating wave peak in the numerical research, which is obtained by applying Equations 15–19 to a liquid storage structure with a sloped bottom—that is, a perfect rectangular vessel—is 0.263 m. This theoretical value closely matches the maximum wave height of 0.262 m obtained from finite element simulations using ANSYS, and both are in excellent agreement with the maximum wave height of 0.261 m predicted by the Housner method.
3.3 The inclination angle of the bottom of the tank
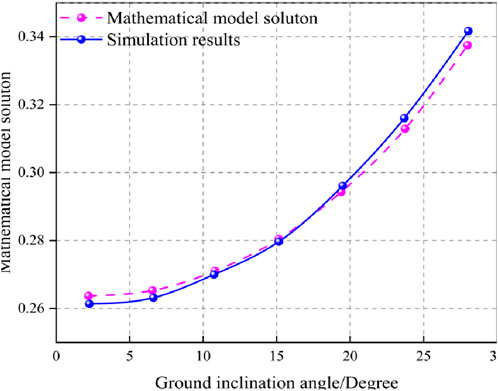
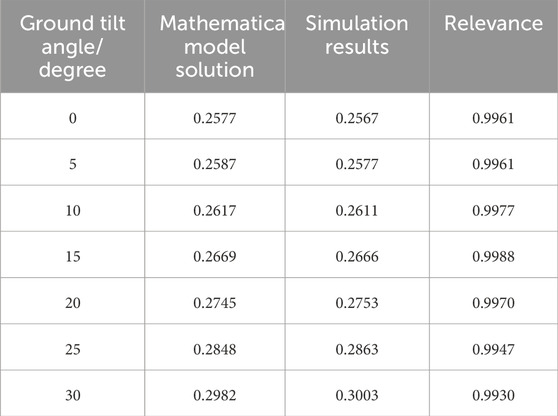
For the substrate of the liquid storage structure with non-zero tilt angle, by comparing the liquid sway wave height data obtained from ANSYS software-based simulation with the analytical solution obtained by applying the set of Equations 15–19, as shown in Figure 5, it can be observed that the numerical simulation results maintain a high degree of agreement with the analytical model proposed in this study, which confirms the reliability and accuracy of the numerical model and analytical method adopted. As shown in Table 1.
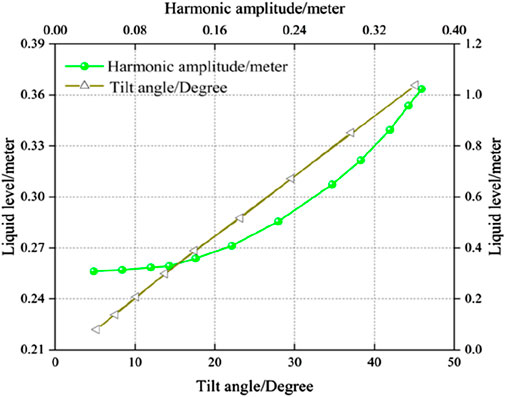
The data from the aforementioned images has been subjected to analysis, which has revealed that the degree of fluctuation in the surface of the flowing medium increases in direct correlation with the angle of inclination of the bottom of the liquid storage device. When the bottom of the liquid storage device is tilted at 20° and all other geometric parameters are maintained at a constant level, the amplitude of the horizontal oscillations experienced by the device will fall within the range of 0–0.4 m.
The width of the hydrostatic cross-section of the rectangular liquid storage structure is set to 20° in accordance with the specifications illustrated in Figure 6. In this scenario, the height H, measured from the centre of the bottom of the reservoir structure to the surface of the water, is set to 10 m, with an assumed value of 5 m. The ratio of the height to the width of the hydrostatic cross-section (i.e., H/2a) varies between 0.01 and 0.2. Consequently, the width of the hydrostatic cross-section will fluctuate between five and 10 m. The aforementioned figure illustrates the trend of the level swing height within the rectangular liquid storage structure at the bottom of the slope as the static water surface aspect ratio varies.
The design form of the liquid storage structure has a significant impact on its hydrodynamic behaviour. It can be observed that taller structures result in greater fluid oscillations and wave heights, whereas shorter, thicker structures help to minimise these effects. It is therefore essential that both hydrodynamic effects and safety are taken into account during the design process. To gain a deeper understanding of the effects of fluid oscillations on the vibrations of the reservoir structure, an equivalent mechanical model can be analysed.
In this model, the fluid within the reservoir structure is reduced to a system comprising a steady-state mass, M0, and a system of spring oscillators (comprising M1 and K1). In this context, M1 represents the oscillating mass, while K1 denotes the corresponding equivalent spring constant (16). This spring oscillator system is analogous to the fundamental oscillatory modes of the fluid, which frequently play a pivotal role in routine kinetic analyses. In many instances, only the fundamental oscillatory modes need to be taken into account for the accuracy of the analysis, while the higher-order oscillatory modes can be disregarded.
Table 2 shows the proportion of solids and suspended solids relative to the total fluid mass for sloped structures with a 20° angle of inclination at the bottom and with different heights and widths (Chen et al., 2022). Table 2 shows the proportion of solids and suspended solids relative to the overall fluid mass. In this table, the M represents the weight of the fluid as a whole, and is calculated by the formula
From Table 2 above, it can be seen that in liquid storage facilities between 0.6 and 0.7, most of the mass behaves as a fixed component that is not involved in shaking
Such a distribution implies that the presence of a fixed mass enhances the dynamic inertial effect of the system when the reservoir structure is subjected to dynamics. In some cases, the shaking portion of the liquid
4 Results and discussion
4.1 Time course curve analysis
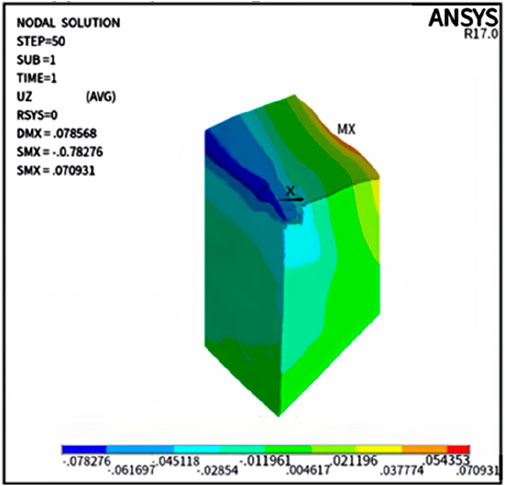
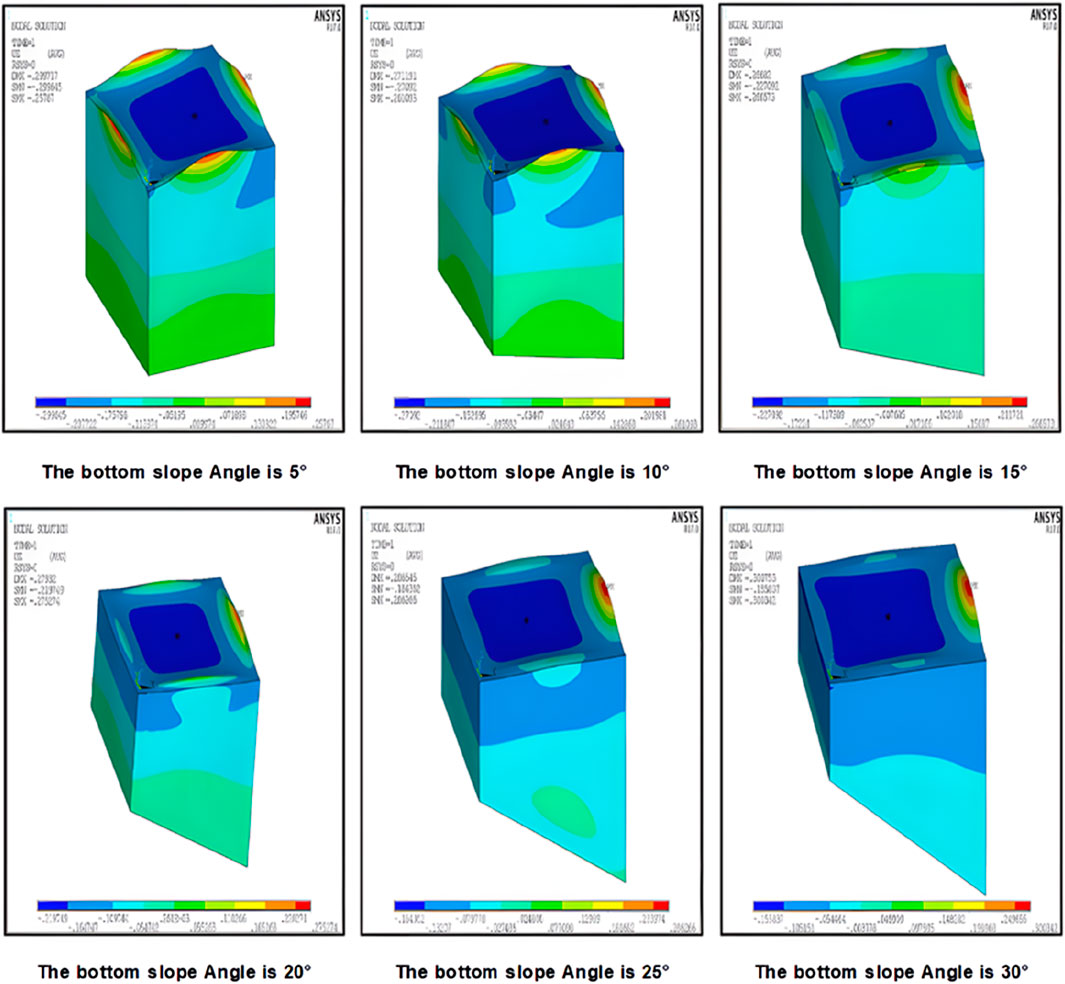
The results shown in Figure 7 were generated by FEA simulation using ANSYS software. They reveal the displacement of the liquid in the rectangular vessel at the bottom of the slope under the influence of El-Centro seismic waves. By carefully analysing these clouds, it is possible to visualise the magnitude of the level fluctuations and thus gain insights into the effect of seismic action on the stability of the liquid within this type of liquid storage structure.
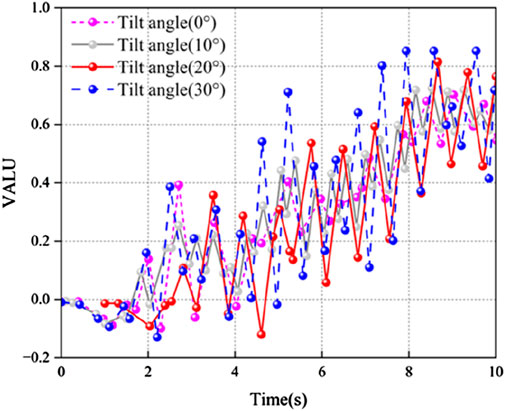
The ANSYS software enables the construction of a 3D model of the fluid within the storage structure and the precise determination of the location of point A, defined as the point at which the fluid surface reaches its maximum elevation during oscillation (see Figure 8) (Jin et al., 2024). Furthermore, by varying the angle of inclination of the bottom surface of the reservoir structure (0°, 10°, 20°, 30°), specific curves can be observed for the displacement changes of point A with time under the El-Centro seismic waves, as illustrated in Figure 9. These curves demonstrate that the dynamic process at point A varies with time when the liquid surface vibrates maximally in the horizontal direction.
From the time course folds of displacement changes shown in Figure 9, it can be observed that the maximum wave height of the liquid surface shows an upward trend with the increase of the tilt angle of the bottom of the storage structure during the first 10 s of the action of the north-south component of the El-Centro seismic wave. This indicates that the liquid surface fluctuation is significantly affected by the bottom tilt angle and is enhanced with increasing angle.
4.2 Density vs. liquid shake height analysis
The force analysis at a point will be used to reflect the degree of shaking, and the maximum impact force on the fluid storage structure will be
As shown in Equation 25 in the context of finite element modelling, the focus is on point A, with the objective of studying the impact of different liquids (e.g., oil, petrol and paraffin) under (see Table 3) the excitation of El-Centro seismic waves. The extent of fluid shaking was inferred through the measurement of displacement at point A. The fluid shaking was measured in a rigid container with an acceleration of 0.5 mm, and all tests were conducted in a rigid container with acceleration set to g and a uniform filling ratio of 0.9 for the liquids.
As can be seen in Figure 10, the moment at which the maximum impact force occurs is consistent regardless of the fluid used, indicating that it is independent of the specific type of fluid. In addition, the maximum impact force is directly related to the density of the fluid and not so much to its viscosity. This phenomenon can be attributed to the fact that the fluid motion is predominantly in the form of turbulence, in which case the effect of viscosity is less significant and the effect of inertial forces is more pronounced.
4.3 PCA-based correlation discussion
In the unidirectional analysis, the effects of vessel tilt angle, vessel height and liquid type on liquid level wobble were initially explored. In order to further understand the interactions between the factors and their combined effects on liquid level swing, principal component analysis (PCA) was used to refine the data dimensions and identify the key influencing factors. Therefore, in this paper, SPSS software was used, combined with statistical methods such as multiple regression analysis, to comprehensively analyse the role of these three factors in liquid level wobble. Based on the previous PCA analysis, the relevant variables of tilt angle, liquid type, vessel height, and liquid surface vibration height (vibration amplitude) and their correlation coefficients were defined, and the following matrix was obtained. This approach is similar to the studies of Vathi et al. (2013) who investigated the seismic response of liquid storage tanks and emphasised the effect of vessel geometry and liquid properties on the dynamic behaviour (Vathi et al., 2013), and Luo et al. (2020) who analysed the seismic response of LNG tanks considering similar factors such as the vessel height and the liquid type (Luo et al., 2020). Costa et al. (2020) also supported the use of multivariate statistical techniques (e.g., PCA) to analyse complex interactions between multiple factors. They applied PCA to assess environmental data and demonstrated the effectiveness of these methods in understanding interdependent variables (Costa et al., 2020).
As shown in Table 4 the correlation between each of the influencing factors, the greater the absolute value of the coefficient of association between each of the two indicators, the stronger the link between the two indicators, For example, the correlation coefficient between the height of the container and the material stiffness is 0.547, which means that when the angle of inclination increases, the material stiffness may become more rigid, which suggests that there is a greater correlation between the two. On the other hand, the correlation coefficient between the type of liquid and liquid level sway is −0.833, which is a negative correlation, suggesting that a certain type of liquid may reduce the stiffness of the material (reducing the lateral load on the perimeter of the vessel). The expression the material stiffness may become more rigid can be improved, and related to the explanation of correlation.
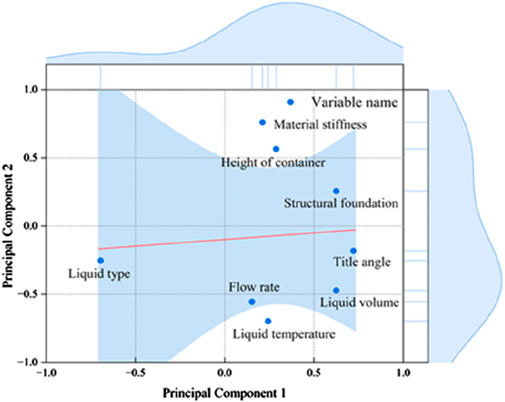
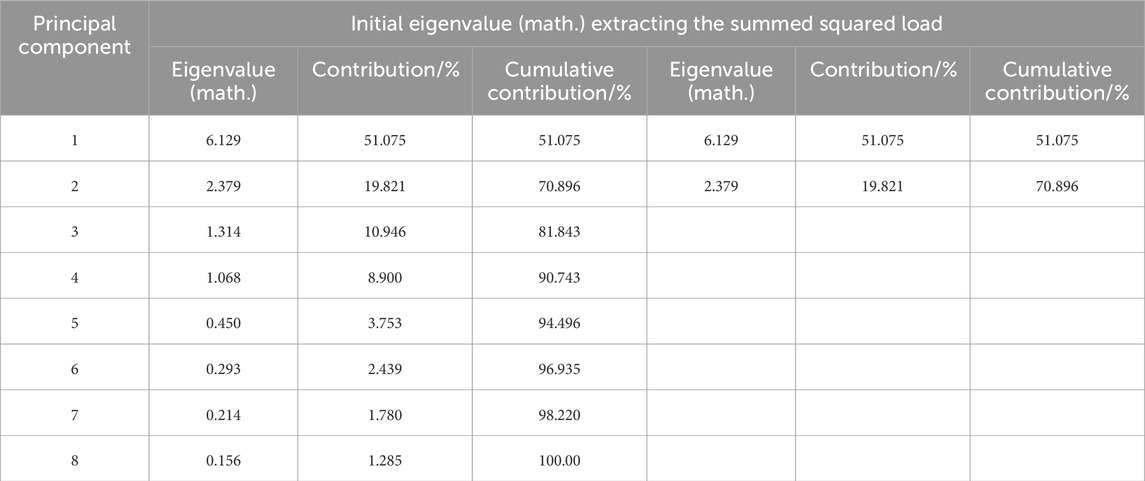
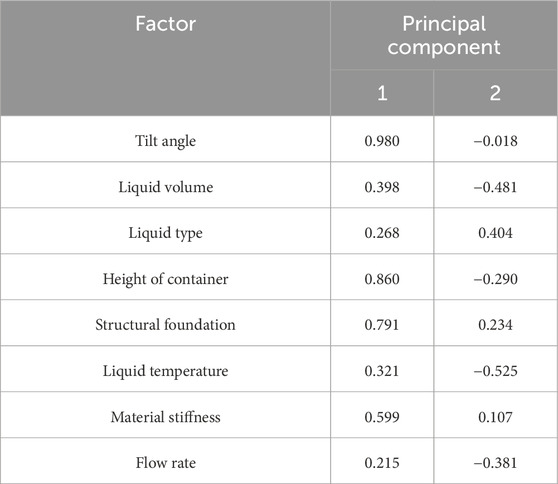
In Figure 11, it can be clearly seen that indicator one corresponds to an eigenvalue greater than six and is greater than the eigenvalue one for a total of four indicators, while the remaining four are all less than 1. Figure 12 shown in the principal components of the projection plot, the indicators from the center of the more far 12 indicating that the correlation coefficient between the indicators and the principal components of the greater, can be seen that the angle of inclination, the volume of the liquid, the structural basis, the height of the container and the principal components of the correlation between the strong, and from the figure can be through the distance between each projection point and then determine the kinship of each indicator (influencing factors).
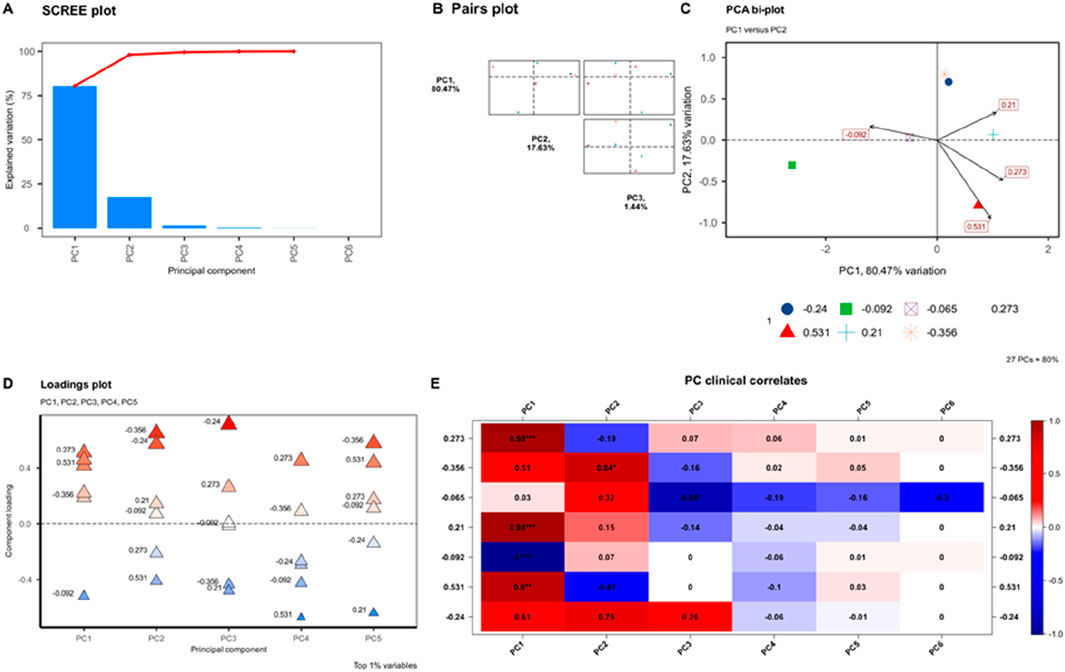
Figure 11. Figure 11 PCA analysis chart.
As shown in Tables 5, 6 shows the relationship between the indicators and the principal components, the greater the absolute value of the linkage coefficient between the indicators and a principal component, the closer the linkage between the principal component and the indicators, and based on the above table and the principle of the principal component loading matrix, it can be seen that the tilt angle, the height of the container, the structural foundation, the stiffness of the material these indicators in the first principal component of the loading is higher, which in turn indicates that the first principal component can better reflect the relationship information between these indicators. The rest of the indicators, such as liquid volume, liquid flow rate, etc., have higher loading on the second principal component, then the second principal component reflects the information of these indicators, so it can be concluded that the initial indicators can be comprehensively explained by using two principal components.
In order to combine the matrix with the multi-factor analysis, it is envisioned that the variables in the matrix (vessel tilt angle, liquid type, vessel height) will be used as potential independent variables in the logistic regression analysis. However, it is important to note that the linear relationships revealed by the correlation analysis cannot be directly used in the logistic regression analysis, which explores nonlinear relationships between binary response variables (e.g., whether the liquid level wobble exceeds the safety threshold) and the independent variables. Before performing logistic regression analysis using software such as SPSS to decipher how the independent variable affects the response variable, it is necessary to perform the above analysis based on the correlation matrix shown in Table 4 shown in order to reduce the arithmetic complexity by selecting the subjective factors affecting, i.e., the tilt angle, the type of liquid, the height of the vessel, and the volume of the liquid. At the same time, it is necessary to consider the control of confounding factors and to test the model’s fitting effectiveness and predictive ability by means of diagnostic tools such as the Hosmer- Lemeschow test, in order to fully understand the mechanism by which the independent variables affect the level wobbling, as shown in the table below as shown in Table 7.
From the table, it can be concluded that for every unit increase in the tilt angle of the vessel, the chances of the liquid level swaying above the safety threshold will increase by a factor of about 2.34 (Exp(B) = 2.34). The type of liquid has a significant effect on liquid level wobble, but the exact effect depends on the difference between the coding method and the type of liquid. HereExp(B) = 0.55 means that a certain liquid type may reduce the chance of liquid level wobble exceeding the safety threshold relative to the reference category. For each unit increase in container height, the chance of liquid level sway exceeding the safety threshold increases by a factor of approximately 1.49 (Exp(B) = 1.49).
4.4 Finite element analysis results
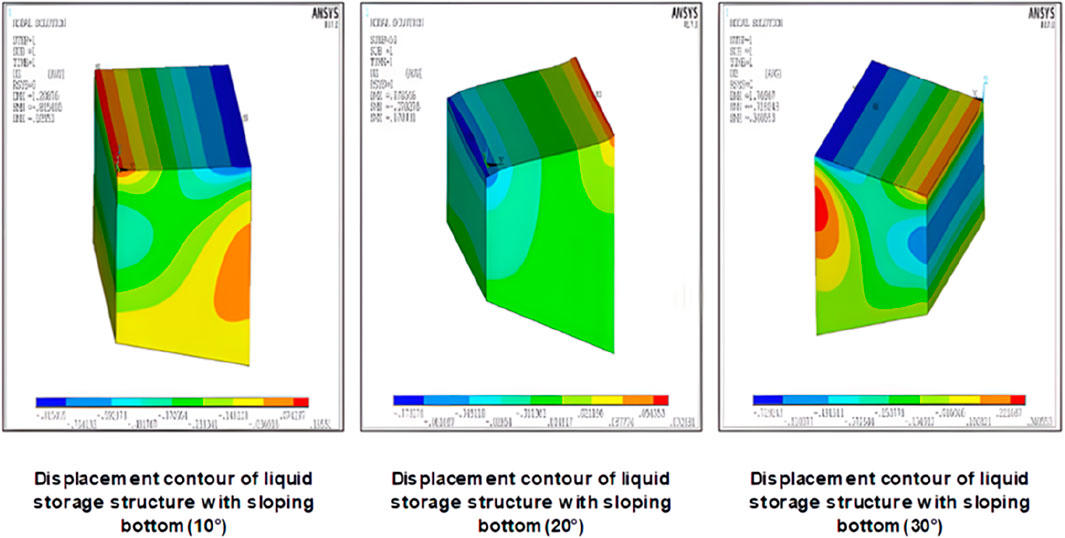
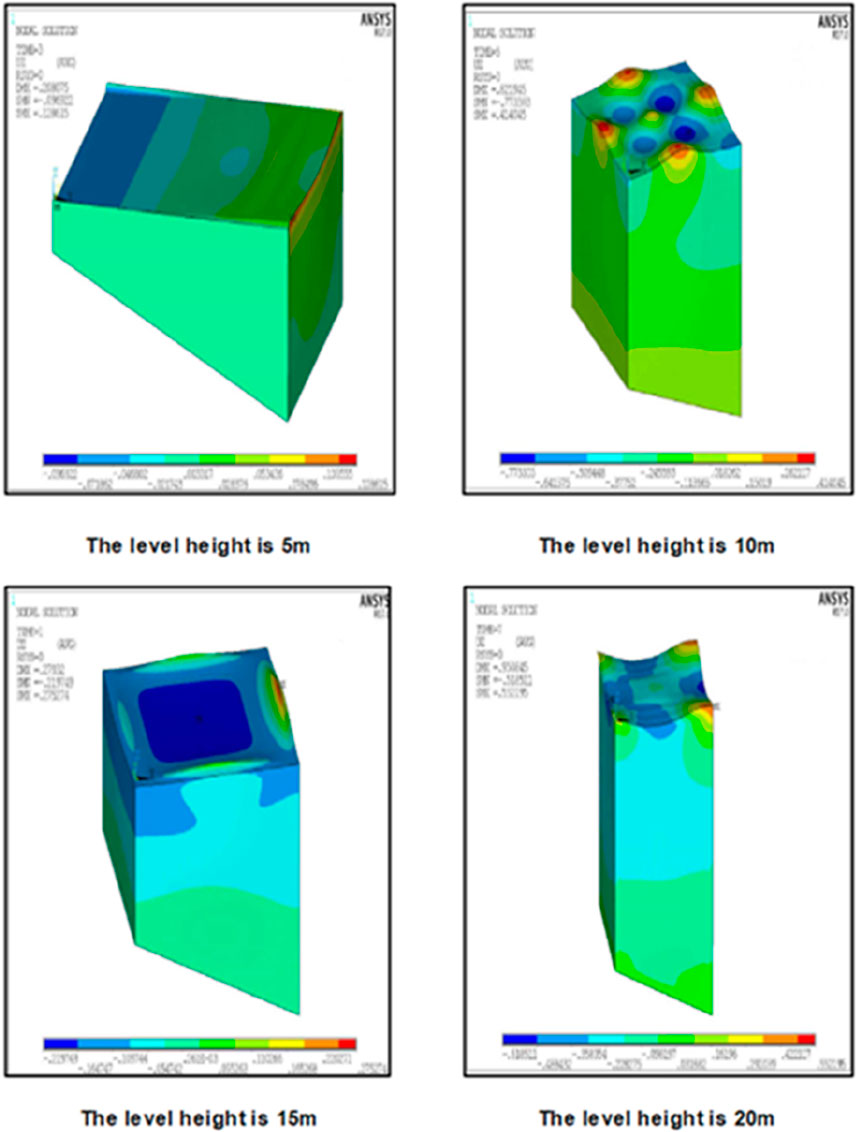
Carry out finite element analysis software to simulate and thus obtain the maximum wave height of 0.2567m, which can only be described as extremely similar to the maximum wave height determined by Housner’s method, and this supported by the various angles of the displacement map as shown in Figure 13, and in order to validate the ranking of the main influencing factors of the previous section, it was carried out the following based on the basis of the seismic wave of the displacement map of the different angles of the case. As shown in Figure 14.
After that, the displacement clouds at different angles shown in Figure 14 can illustrate the degree of influence of the wave height of the fluid under the influence of the angle as the main factor, i.e., the wave height difference.
In finite element simulation, considering all factors together can lead to detailed predictions; however, this is usually accompanied by significant computational costs and time consumption. Therefore, researchers tend to simplify the model according to the specific requirements of the problem. In order to quantify the effects of different parameters on the vibration characteristics of the level, a principal component analysis (PCA) approach is used to reduce the dimensionality of the data set. Specifically, by modelling the level vibration response at different combinations of tilt angles and liquid types, a series of data points are collected and their covariance matrices are calculated. Subsequently, the eigenvalue decomposition of the covariance matrix was performed to extract the principal components that had the greatest influence on the data variations. The results of the PCA analyses showed that the first principal component mainly reflected the variations in the tilt angle, and its contribution was significantly higher than that of the other principal components. This indicates that the tilt angle is the main factor affecting the level vibration characteristics, especially when the tilt angle changes, the frequency and amplitude of the level vibration will change significantly. Although the change of liquid type also causes some fluctuation, its effect is relatively small. Based on the above results, it can be argued that the simplified method of considering only the tilt angle is reasonable in specific cases when the change in the liquid type is small, especially when the tilt angle changes over a wide range and the liquid type remains unchanged. However, there are limitations to this simplified approach, such as the inability to accurately predict the effect of a change in fluid type on the vibration characteristics of the level, especially under extreme operating conditions. This is also confirmed in the study of fluid-structure interactions (Parameshwaran, Dhulipalla, Yendluri, 2016) (Parameshwaran et al., 2016), i.e., the effect of fluid type on vibration behaviour may become more pronounced under extreme conditions, and thus more refined models are required to accurately predict vibration characteristics.
In addition, the improved analytical model proposed by Wu et al. (2023) for predicting the behaviour of unanchored liquid storage tanks under seismic action is closely related to our research on the vibration behaviour of liquid storage tanks (Wu et al., 2023). In this model, the fluid-structure interaction is considered in detail, emphasising the interaction between the fluid and the storage tank structure. This is complementary to the analysis of the effects of tilt angle and fluid type on level vibration by PCA in this paper, which further validates the complexity of the effect of fluid type change on vibration characteristics in different cases.
Based on the influence of various major factors on the liquid system as depicted in Figures 13, 15, only the height of the liquid (the structure of the container) and the tilt angle of the liquid (the tilt angle of the container) are taken into account here. Lf this simulation result is consistent with the ranking of the major influencing factors presented in the above PCA analysis, the similarity between the two can be verified, along with the accuracy of this paper. It can be observed from the previous section that for every 1° increase in the tilt angle, the degree of influence on the wave height of the liquid system is 0.0407; for every 1 m increase in the height of the liquid system, the height of the container structure can be reflected since the liquid system is adsorbed on the inner surface of the container; when the height rises by 1 m,the degree of influence on the wave height is 0.0297. The extent to which this affects the height of the liquid is precisely in line with the main ranking of the influencing factors of PCA as described above.
5 Conclusion
Based on the advanced simulation technology of ANSYS, this study conducted a comprehensive and in-depth exploration of the liquid sloshing behavior of rectangular liquid storage structures under seismic load. Through meticulous numerical simulation analysis, the intricate mechanism of liquid sloshing dynamics under the coupling effect of multiple factors was disclosed. The core findings of the study indicate that the tilt angle of the container, as the predominant factor, exerts the most substantial influence on the liquid slosh characteristics, and even a minor alteration of the container can lead to a significant escalation in wave height. The specific quantification reveals that for every 5° increase in the tilt angle, the relative change of wave height amounts to as high as 14.07%, emphasizing the utmost significance of tilt angle control in seismic design.
In addition, the liquid type constitutes another crucial variable, and the interaction mechanism between rheological characteristics and swaying behavior is complex and substantial. Although the specific degree of influence is influenced by the coding strategy and the inherent properties of the liquid, it generally reveals the importance of the optimal selection of the liquid type for enhancing the seismic performance of the system. In contrast, the influence of vessel height on slosh behavior is relatively moderate, and its influence is significantly lower than that of the tilt angle and the liquid type. Specifically, for every 5-m increase in height, the relative change of wave height is approximately 4.97%. This discovery furnishes a scientific basis for the rational setting of vessel height in engineering design.
The limitations of this study lie in that although the liquid sloshing characteristics of rectangular liquid storage structures under seismic action are profoundly analyzed through ANSYS simulation and the key influencing factors are identified, the study fails to fully contemplate the diversity of seismic spectra, the constraints of model simplification, and the absence of support from experimental verification. These factors might affect the universality and precision of the conclusions to a certain extent.
This study not only successfully validated the accuracy of the previous Principal Component Analysis (PCA) results but also further strengthened the understanding of the mechanism of multi-factor interaction through mutual corroboration of numerical simulation and statistical analysis, and provided robust data support for the optimization of seismic design of liquid storage structures through precise quantitative analysis. In practical engineering applications, it is recommended to consider the synergetic effect of various factors and adopt advanced optimization algorithms for multi-objective optimization design to achieve effective control of liquid slosh behavior, ensure the safety and stability of engineering structures under extreme loads such as earthquakes, and meet the stringent requirements of high precision and high reliability design in the engineering field.
Data availability statement
The raw data supporting the conclusions of this article will be made available by the authors, without undue reservation.
Author contributions
WR: Conceptualization, Data curation, Formal Analysis, Investigation, Methodology, Software, Writing–original draft. ZZ: Funding acquisition, Project administration, Resources, Supervision, Validation, Visualization, Writing–review and editing.
Funding
The author(s) declare that financial support was received for the research, authorship, and/or publication of this article. The research reported was financially supported by Research Program of Science and Technology at Universities of Inner Mongolia Autonomous Region (NJZY22388), Basic Research Funds for Colleges and Universities directly under the Autonomous Region (JY20230007). The financial supports are highly appreciated.
Conflict of interest
The authors declare that the research was conducted in the absence of any commercial or financial relationships that could be construed as a potential conflict of interest.
Publisher’s note
All claims expressed in this article are solely those of the authors and do not necessarily represent those of their affiliated organizations, or those of the publisher, the editors and the reviewers. Any product that may be evaluated in this article, or claim that may be made by its manufacturer, is not guaranteed or endorsed by the publisher.
References
Amato, F., Guignard, F., Robert, S., and Kanevski, M. (2020). A novel framework for spatio-temporal prediction of environmental data using deep learning. Sci. Rep. 10 (1), 22243. doi:10.1038/s41598-020-79148-7
Barik, J. R., and Biswal, K. C. (2022a). Nonlinear dynamic characteristics of coupled tank-isolator interactive systems under different types of near-fault earthquakes. Soil Dyn. Earthq. Eng. 184, 108829. doi:10.1016/j.soildyn.2024.108829
Barik, J. R., and Biswal, K. C. (2023a). Dynamic characteristics of seismically isolated rectangular tank–liquid–block systems implementing lead rubber bearing isolator. J. Earthq. Tsunami 17 (06), 2350027. doi:10.1142/s1793431123500276
Barik, J. R., and Biswal, K. C. (2023b). Seismic assessment of impulsive and convective responses for a base-isolated rectangular liquid tank with eccentric internal submerged block. Iran. J. Sci. Technology-Transactions Civ. Eng. 47 (Issue 4), 2219–2245. doi:10.1007/s40996-022-01017-2
Barik, J. R., and Biswal, K. C. (2023c). Nonlinear dynamic assessment of sloshing ina seismically isolated rectangular liquid tank using laminated rubber bearing. Soil Dyn.Earthq. Eng. 177. doi:10.1016/j.soildyn.2023.108425
Barik, J. R., and Biswal, K. C. (2024). Assessment of seismic responses of a base-isolated rectangular fluid tank with a bottom mounted vertical baffle under an irregular excitation. Linked Ref. 7, 21–31. doi:10.11159/ijci.2024.003
Chen, Z., Wu, Y., Wang, J., and Luo, P. (2022). Study on the solid-liquid suspension behavior in a tank stirred by the long-short blades impeller. Chin. J. Chem. Eng. 47, 79–88. doi:10.1016/j.cjche.2021.06.009
Costa, D. d. A., Soares de Azevedo, J. P., dos Santos, M. A., and Facchetti Vinhaes Assumpcao, R. d. S. (2020). Water quality assessment based on multivariate statistics and water quality index of a strategic river in the Brazilian Atlantic Forest. Sci. Rep. 10 (1), 22038. doi:10.1038/s41598-020-78563-0
Housner, G. W. (1963). The dynamic behavior of water tanks. Bull. Seismol. Soc. Am. 53 (2), 381–387. doi:10.1785/bssa0530020381
Jin, G., Zhang, Y., Zhao, M., Xie, X., and Li, H. (2024). Seismic response analysis of underground large liquefied natural gas tanks considering the fluid-structure-soil interaction. Appl. Sciences-Basel 14 (Issue 11), 4753. doi:10.3390/app14114753
Li, Z., Zhang, R., Liu, X., Chen, S., and Li, X. (2023). Analysis of seismic response of a large-scale isolated LNG tank considering dynamic soil-pile interaction. Structures 58, 105460. doi:10.1016/j.istruc.2023.105460
Luo, D., Liu, C., Sun, J., Cui, L., and Wang, Z. (2020). Liquefied natural gas storage tank simplified mechanical model and seismic response analysis. Soil Dyn. Earthq. Eng. 141, 106491. doi:10.1016/j.soildyn.2020.106491
Moslemi, M., and Kianoush, M. R. (2012). Parametric study on dynamic behavior of cylindrical ground-supported tanks. Eng. Struct. 42, 214–230. doi:10.1016/j.engstruct.2012.04.026
Parameshwaran, R., Dhulipalla, S. J., and Yendluri, D. R. (2016) “Fluid-structure interactions and flow induced vibrations: a review,” in 12th international conference on vibration problems (ICOVP) guwahati, India 2016.
Vathi, M., Pappa, P., and Karamanos, S. A. (2013). Seismic response of unanchored liquid storage tanks. ASME pressure vessels and piping conference (PVP-2013). Paris, FRANCE, 14–18.
Keywords: sloped bottom tank, liquid sloshing, principal component analysis, horizontal excitation, numerical study
Citation: Ren W and Zhong Z (2024) Identification of the factors influencing the liquid sloshing wave height in a sloped bottom tank under horizontal excitation using PCA approach. Front. Built Environ. 10:1488236. doi: 10.3389/fbuil.2024.1488236
Received: 29 August 2024; Accepted: 21 November 2024;
Published: 10 December 2024.
Edited by:
Duc-Kien Thai, Sejong University, Republic of KoreaReviewed by:
Chijioke Emmanuel Emere, Walter Sisulu University, South AfricaJyoti Ranjan Barik, National Institute of Technology Rourkela, India
Copyright © 2024 Ren and Zhong. This is an open-access article distributed under the terms of the Creative Commons Attribution License (CC BY). The use, distribution or reproduction in other forums is permitted, provided the original author(s) and the copyright owner(s) are credited and that the original publication in this journal is cited, in accordance with accepted academic practice. No use, distribution or reproduction is permitted which does not comply with these terms.
*Correspondence: Zuowei Zhong, bm1nZ3lkeHp6d0AxMjYuY29t
 Wenhao Ren
 Zuowei Zhong*