- 1Convergence Institute of Construction, Environmental and Energy Engineering, Kyungpook National University, Daegu, Republic of Korea
- 2School of Architecture, Civil, Environmental and Energy Engineering, Kyungpook National University, Daegu, Republic of Korea
- 3A3 Architecture Institute, Kyungpook National University, Daegu, Republic of Korea
Climate change has intensified flooding and increased localized torrential rainfalls, leading to disasters such as landslides, infrastructure collapse, and urban floods. The extent and accuracy of flood damage information significantly impact recovery processes. While previous studies primarily utilized satellite and aerial imagery for broad flood assessments, they often lacked the precision needed for accurate damage analysis. This study addresses the gap between rapid assessment needs and precise damage quantification in flood inundation analysis. This research introduces a novel image-based investigation approach to enhance the speed and accuracy of flood inundation assessment. By leveraging unmanned aerial vehicles (UAVs) and image-based spatial data technology, aerial images of flooded areas are rapidly captured to construct three-dimensional disaster site terrain information. The proposed methodology employs advanced techniques in aerial photography, image processing, and geographic analysis to quantitatively analyze flood inundation scale using only aerial images and geographic information systems (GIS). The research yielded a calculated flood inundation area of 3,847.36 m2 and a flood volume of 13,895.13 m3. This methodology complements existing flood inundation assessment techniques and has the potential to significantly improve disaster management efforts by providing rapid, accurate, and actionable data for decision-makers.
1 Introduction
Recent climate change has intensified flooding and increased the frequency of localized torrential rainfalls, leading to various disasters such as landslides, infrastructure collapse, and urban floods (Kim et al., 2022; Kim et al., 2020). The prompt investigation of flooded areas is crucial for establishing effective hazard prevention measures and facilitating recovery. While the Countermeasures Against Natural Disasters Act in South Korea mandates the creation of flood trace maps, practical limitations in budget and manpower often hinder comprehensive and timely investigations (Li et al., 2021).
Existing methods for flood damage assessment primarily rely on satellite imagery and terrain data. Studies by Brivio et al. (2002), Chae (2005), Frey et al. (2012), and Liu et al. (2018) have employed various satellite-based techniques to estimate flood extent and damage. However, these approaches face significant limitations. The low spatial resolution of satellite imagery, particularly in small-scale terrains, often leads to inaccurate flood extent mapping. There is also difficulty in accurately reflecting actual terrain using low-resolution data, which can result in misinterpretation of flood impacts. Furthermore, the lack of timely data acquisition from satellites hampers rapid response efforts, which is crucial in flood emergencies. Lastly, these methods often suffer from insufficient validation of flood extent determinations, raising questions about the reliability of the assessments.
To address these shortcomings, researchers have explored the use of unmanned aerial vehicles (UAVs) and spatial data models. Oh et al. (2017), Lim et al. (2016), and Kim et al. (2016) demonstrated the potential of UAV-based methods for disaster site investigation. Guerriero et al. (2018) and Samela et al. (2018) further advanced flood hazard mapping techniques using high-resolution topographic data and geomorphic approaches. These studies have shown promise in improving the efficiency and cost-effectiveness of damage assessment. However, a significant gap remains between the need for rapid assessment and the ability to provide precise damage quantification, particularly in urban flood scenarios.
The theoretical framework for flood inundation analysis has evolved from traditional hydrological models to more advanced remote sensing and geospatial techniques. Yet, the integration of high-resolution, rapidly acquired data with sophisticated spatial analysis methods remains underdeveloped, especially for urban flooding events.
This study addresses this gap by introducing a novel, image-based investigation approach that enhances both the speed and accuracy of flood inundation assessment. By leveraging UAVs and image-based spatial data technology, we propose a methodology that rapidly captures aerial images of flooded areas to construct three-dimensional disaster site terrain information. Geographic analysis in this study utilized UAV imagery and GIS technology for enhanced flood assessment. Building upon previous flood risk assessments that employed Remote sensing and GIS integration, this study adopts similar geographic analysis techniques while utilizing UAV imagery for enhanced spatial resolution and accuracy in flood volume calculations (Buse and ERCOŞKUN, 2024). This approach builds upon existing remote sensing theories while incorporating advanced techniques in aerial photography, image processing, and geographic information systems (GIS).
Our method offers several key advantages over conventional approaches. It provides improved spatial and temporal resolution for urban flood mapping, allowing for more detailed and up-to-date assessment of flood-affected areas. The approach also enhances accuracy in flood extent and volume calculations through the use of high-resolution UAV imagery and advanced GIS techniques. Additionally, it reduces reliance on complex simulation models, offering a more direct and efficient means of assessing flood impacts. Finally, our method enables faster data acquisition and processing, facilitating timely decision-making critical for effective flood response and management. The objective of this study is to develop and validate this new methodology for calculating flood inundation areas and volumes with improved precision and efficiency. By utilizing only UAV images and GIS techniques, we aim to provide a more accessible and rapid assessment tool for flood damage analysis.
This research contributes to the field by bridging the gap between rapid assessment needs and precise damage quantification in flood inundation analysis. The proposed methodology has the potential to significantly improve disaster management efforts by providing timely, accurate, and actionable data for decision-makers, particularly in urban environments where rapid response is crucial.
2 Materials and methods
2.1 Overview
Figure 1 shows the approximation of the methodology for small-scale urban center flooded area and flood volume outputs based on UAV imaging. As illustrated, the methodology proposed in this study consists of three stages. (1) Data acquisition: UAV-based aerial photography. (2) Constructing analysis data by using image processing techniques: (a) Construct spatial data using point cloud techniques and (b) generate 3D model-based terrain information. (3) Analysis of flood inundation information using geographic in-formation systems: (a) Derive flooded regions and estimate the area using unsupervised classification techniques and (b) determine flood volume using conversion techniques.
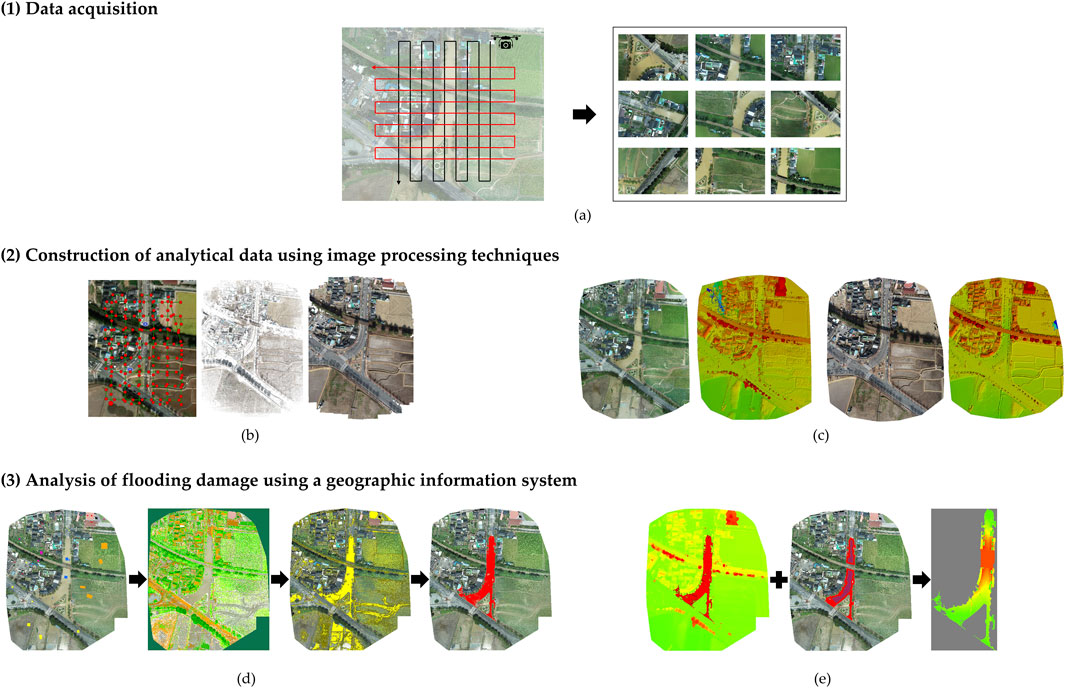
Figure 1. Visualizing flow chart for calculating flooded area and flood volume in small urban areas based on unmanned aerial vehicle images: (A) UAV-based aerial photography; (B) Con-struct spatial data using point cloud techniques; (C) Generate 3D model-based terrain information; (D) Derive flooded regions and estimate the area using unsupervised classification techniques; (E) Determine flood volume using conversion techniques.
2.2 Data acquisition
When collecting data through UAV-based aerial photography, a flight plan should be prepared after sufficient consideration of the shooting conditions. Furthermore, the quality of the data obtained through aerial photography will have an absolute impact on video processing and spatial data construction, so it is crucial to plan in advance. In this study, the flight plan was prepared, taking into account the safety of flights, the quality of the image data, and other factors.
The quality of the data and the duplication of the images obtained, together with flight stability, should be taken into account in the acquisition of aerial photography data for flooded area and flood volume outputs at a city center. Although UAVs used in aerial photography differ in the quality and safety of the photography sensors, most UAVs equipped with aerial sensors can take aerial photographs. However, specialized mapping equipment is needed for accurate measurements of geographical data, buildings, and flood information. Furthermore, a model with correct location information and compensation devices to reduce errors caused by aerial photography needs to be used.
The Phantom4 RTK model from DJI, China, was selected for the UAV, which was used in aerial photography for data acquisition. The Phantom4 RTK is a rotating UAV that has its own photography sensor and is fitted with a Real Time Kinematic (RTK) receiver on the aircraft to a high level of accuracy even in situations where the position correction of the UAV is not possible. The UAV used in this study has a vertical and horizontal accuracy of ±0.1 m when hovering and can detect surrounding obstacles ranging from 0.7 to 30 m. Additionally, the camera sensor is 1″CMOS with a resolution of 20 MP and is fitted with a mechanical shutter to move the UAV and no risk exists of rolling shutter distortion even during shooting.
The resolution of aerial images is determined by the performance and flight height of the mounted photography sensor. Nguyen et al. used a UAV with a resolution of 20 MP and set flight heights of 50, 100, 150, and 200 m to generate and analyze DEMs of complex terrains for resolution analysis based on flight altitude (Nguyen et al., 2020). Jiménez et al. analyzed more than 70 studies related to digital terrain model (DTM) generation to improve the accuracy of DTM generation through efficient aerial photography and proposed approximately 70–150 m of flight altitude for high accuracy and quality spatial data (Jiménez-Jiménez et al., 2021). Sadeghi and Sohrabi conducted a study on the impact of UAV flight height on tee height extraction accuracy in a broadleaf forest, using a photography sensor with a resolution of 20 MP to capture flight altitudes of 60–120 m at 20 intervals (Sadeghi and Sohrabi, 2019). Ma and Zhang performed low-altitude aerial shooting and remote exploration of UAVs to improve mapping accuracy and set a flight height of 80 m to acquire aerial images. The objective of the study was to obtain aerial images with a resolution of 20 MP, based on earlier studies, and to set the flight height to 60–90 m, taking into account the conditions of the target.
Image duplication also has a major impact on constructing point cloud-based spatial data for estimation of urban flooded area and flood volume. Furthermore, the higher the duplication rate of aerial image acquisition using UAVs, the more high-quality 3D point cloud can be achieved through multiple image matching (Ma and Zhang, 2022). Different mapping software applications present the recommended duplication of aerial imaging. Agisoft Metashape recommends a minimum of 80% front and 60% lateral image duplication (Haala et al., 2013). Pix4D recommends a minimum of 75% front and 60% lateral image duplication (Woo et al., 2023). In spatial data construction, the proposed duplication is typically equal to or greater than that of the front duplicate. In this study, an image duplication of at least 80% was chosen for both front and lateral overlap to ensure high accuracy in spatial data construction and reliable estimation of the urban flooded area and flood volume. The 80% duplication rate was selected based on the complex urban environment of the study area, which includes varied terrain and densely packed infrastructure. This higher overlap was necessary to capture sufficient detail for accurate 3D modeling, especially in areas where shadowing from buildings or other obstructions could hinder image matching.
2.3 Construction of analytics data using image processing technique
The following two methods are conducted to construct analytical data using an image processing technique: (a) spatial data construction using point cloud technique, and (b) 3D model-based terrain information generation.
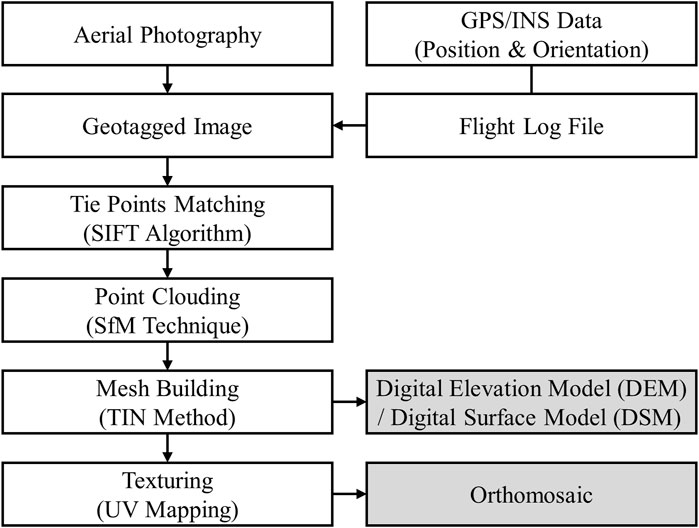
Construction of analytical data for urban flooded area and flood volume calculation first requires constructing spatial data from UAV-based aerial footage. The spatial data for UAV-based aerial images can be constructed by applying the point cloud method. The construction of point cloud-based spatial data consists of three stages: (1) initial processing, (2) point cloud and mesh, and (3) digital surface model (DSM) and orthomosaic. First, the Scale Invariant Feature Transform (SIFT) algorithm is used to identify feature points as key points in images containing location information. Then, images with the same feature points are found and matched, and the internal and external parameters of the photography sensor are corrected. Next, a point cloud is built through point densification using the generated feature points. 3D textured meshes can be generated based on the constructed point cloud, and 3D models can be constructed through this process. Additionally, DSM and orthoimages can be generated based on 3D models (Woo et al., 2022).
The creation of DTM is essential in many applications that utilize surface models with removed external elements such as artifacts and vegetation. To create a DTM, we need to remove points by filtering point clouds from DSM, which is called ground filtering (Parizi et al., 2022). Ground filtering is an important step in the process of accurately expressing the terrain characteristics of the surface and has become a standard function in commercial software applications (Hou et al., 2021). In this study, we employed ground filtering algorithm to remove non-terrain objects such as buildings, trees, and vegetation from the DSM. This approach uses a multi-scale model to differentiate ground points from non-ground points, and it is optimized for urban environments where objects like infrastructure and vegetation can interfere with accurate terrain modeling. The algorithm first segments the point cloud based on elevation differences and then classifies points as either ground or non-ground based on the relative height of nearby points. To fine-tune the filtering process, we adjusted the parameters within Pix4D to suit the specific characteristics of the study area. The key parameters included the maximum angle for slope tolerance and the minimum object height threshold, which were optimized to reduce the misclassification of elevated surfaces (such as low buildings or hills) as ground points. In this study, the slope tolerance was set to 20°, and the minimum height threshold was set to 0.5 m, which allowed the algorithm to accurately separate the terrain from small man-made structures and vegetation.
Despite these optimizations, some errors were encountered during the filtering process, particularly in densely built-up areas where the algorithm misclassified certain buildings or infrastructure as part of the terrain (Iqbal et al., 2023). To address these errors, manual post-processing was conducted, where we manually inspected the point clouds and corrected misclassified regions. Through this manual correction process, we were able to refine the DTM and produce a more accurate representation of the true terrain.
The workflow for constructing analytical data using image processing techniques is shown in Figure 2.
2.4 Flood inundation information analysis using a geographic information system
Flood inundation information analysis using the geographic information system is performed in two ways: (a) Deriving flooded region and area using an unsupervised classification technique, and (b) flood volume calculation using the conversion technique.
The flooded region and area were derived using the unsupervised classification technique based on the analytical data constructed in Section 2.3. Furthermore, the flood volume was calculated using the conversion technique based on the derived flooded region and area and analysis data.
Unsupervised classification was used in this study to determine the flooded region and area, which is a clustering technique that classifies pixels using the properties of pixels that make up the image without any prior information (Lee and Choi, 2014). When the operator specifies several variables, such as the maximum number of clusters, the maximum radius of the cluster, and the distance between the clusters, the image pixels are grouped and classified, and spectral distribution characteristics are expressed based on the center of a cluster and the covariance between the bands (Choung, 2015). This unsupervised classification technique is automatic classification of image pixels with only their statistical properties and can be used in situations where no prior information exists about the target region and slow occurring changes are traced (Moon et al., 2017). The present study used the unsupervised classification technique to classify image classes in the study area, and to extract values for parts of the flooded region. Subsequently, the extracted values were used to predict the flooded region in the study area, and the flooded area was derived by compensation of the extracted flooded region.
Next, the flood volume was calculated using the conversion technique based on the flooded area and analytical data obtained earlier. Constructing the spatial data of flooded regions using a UAV can cause DSM water surface disturbance (modeling noise) due to the technical limitations of the photographic measurement algorithm (Han, 2017). Thus, the pre-sent study generated raster data values for analytical data using the zone statistics of the geographic information system. To remove the occluded area within the study area, elevations around the occluded region was used. The conversion (raster to polygon) technique was used to create a DSM of the general (non-flooded) situation. A DSM of the flooded situation was generated using the elevation value of the flooded region based on flooded area derived from the previous flooding situation. In the next step, the raster data was con-structed using the conversion (polygon to raster) technique for the DSM of each situation. The flood volume was derived based on the constructed raster data. The workflow of the flood inundation information analysis methodology proposed in this study is shown in Figure 3.
3 Experimental results
3.1 Data acquisition
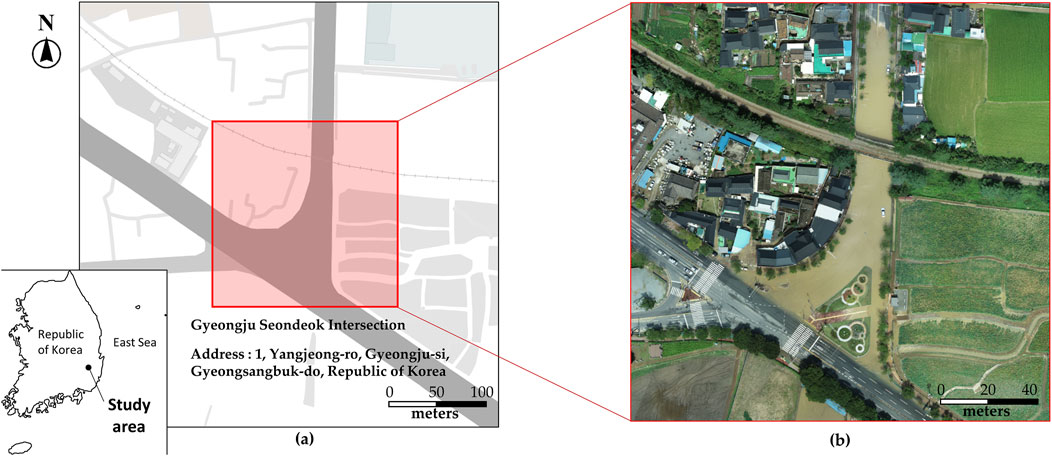
The study area was selected for the flooded area and flood volume calculation of a small city center terrain located in Inwang-dong, Gyeongju, Gyeongsangbuk-do, South Korea. The study area covers approximately 83,000 m2, and was flooded due to Typhoon “Hinnamno” on 6 September 2022, with a recorded daily average rainfall of about 249.7 mm. This is more than double the September average rainfall of 111.3 mm for Gyeongju. The strong winds and heavy rain caused by the typhoon led to flooding in low-lying areas and regions near rivers within a short period. This is believed to be related to factors such as increased impervious surfaces and insufficient drainage facilities due to urbanization. Consequently, this area was selected as the study site, and aerial photography was conducted. An overview of the target areas for performing aerial photography in this study are illustrated in Figure 4.
The UAV-based aerial photography was conducted four times over a period of 2 days, twice each for flooding and general situations. Automatic route flights were conducted in a double grid format in the study area, and the flight plans developed in this study are presented in Table 1.
The flight altitude was set at 60 and 90 m based on the previous studies presented in Section 2.2. Additionally, the study area includes both low-rise residential buildings and densely packed commercial structures. The selected flight height of 60–90 m was ideal for capturing high-resolution images that could distinguish between flooded regions and infrastructure without interference from building shadows or obstructions. Furthermore, image overlap was set to 80% of the front and side for a high-quality 3D point cloud. Four datasets (a total of 796 images) in the study area were obtained through aerial photography. The image metadata of each dataset is shown in Table 2.
The Ground Sample Distances (GSD) of the images acquired from aerial photography were analyzed at 2.12–2.49 cm/pixel, and were found to be useful in construction of analytical data for flooded area and flood volume calculations.
3.2 Construction of analytical data using image processing techniques
In this study, analysis data of flooded regions in small urban centers were constructed based on aerial images acquired from aerial photography. The aim of this study was to construct spatial data using point cloud techniques, and Switzerland’s Pix4Dmapper software was used to construct spatial data. The process of constructing spatial data for each dataset generated for analytical data construction is illustrated in Figure 5.
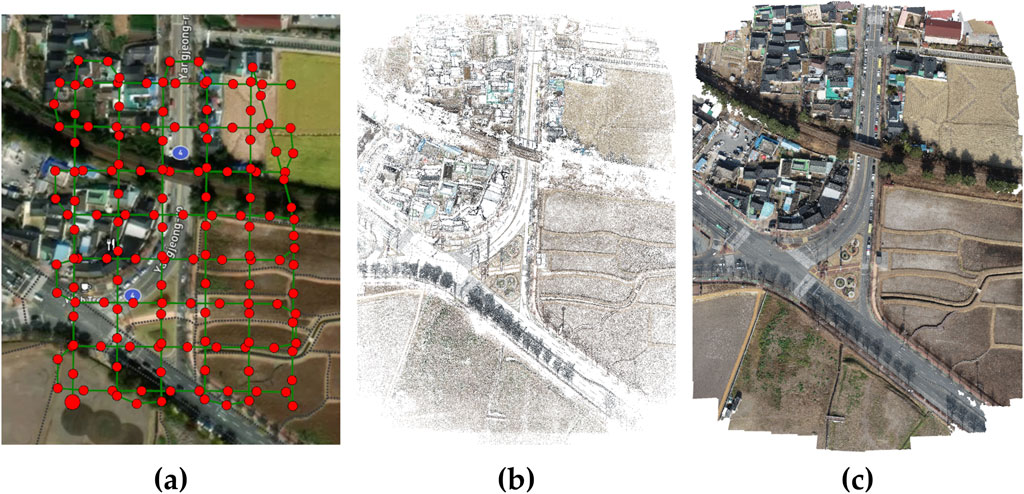
Figure 5. Spatial data construction process. (A) Geotagged images (B) Tie points matching (C) Point clouding.
Next, orthoimages and DSMs for constructing analytical data for flooded area and flood volume calculations were created. This study used the Pix4Dmapper software to create orthoimages and raster DSMs for flooding and non-flooding situations. The results of ground filtering were monitored and modified in the creation process. The constructed situation-specific orthoimages and DSM are as shown in Figure 6.
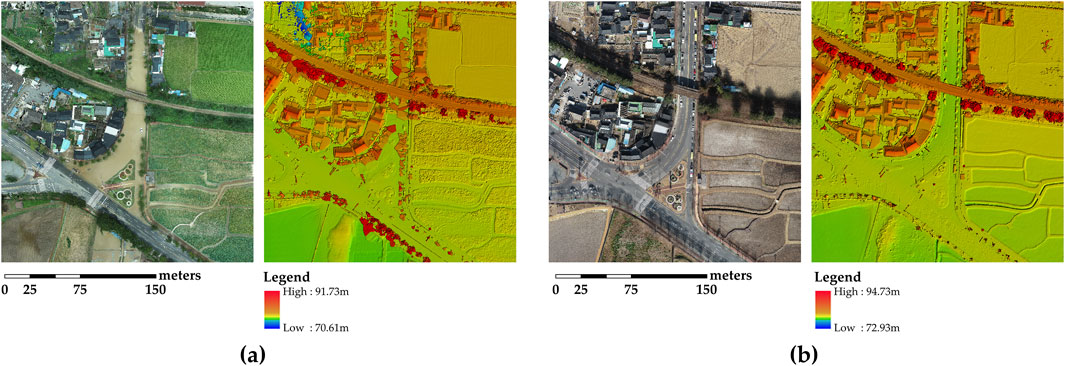
Figure 6. Result of orthoimages and DSM generation. (A) Flooding situation (B) Non-flooding situation.
3.3 Analysis of flood inundation information using a geographic information system
This study analyzed flooding inundation information using aerial imagery data. For the classification of the flooded region, we applied an unsupervised classification technique to the analysis data. The features used for classification included color information (e.g., RGB values), texture, and elevation data, which were selected because they allow effective differentiation between flooded and non-flooded regions, as well as between different land cover types (e.g., water, roof, land, forest, and field). These features are particularly relevant for distinguishing water bodies from surrounding land, which is critical in flood analysis. We selected the k-means clustering algorithm as the classifier due to its efficiency in handling large spatial datasets and its ability to partition the data into meaningful clusters without requiring prior knowledge of the target area. K-means was chosen because it is computationally efficient for large-scale image data and provides robust clustering for differentiating between flooded and non-flooded areas based on spectral and spatial properties of the data. The unsupervised classification was performed with the following parameters: maximum number of classes – 10, maximum number of iterations – 20, maximum number of clusters merged per iteration – 5, maximum merging distance – 0.5, minimum number of samples per cluster – 20, and skip coefficient – 10 (as shown in Figure 7). The classification produced five primary land cover categories, which were water, roof, land, forest, and field. After the initial classification, post-classification processing was conducted to refine the results and improve accuracy. This involved manually correcting misclassified areas, particularly focusing on the designated target area (the road under the bridge) where flooding occurred. Misclassified regions, such as areas incorrectly identified as flooded, were manually edited based on field verification data and visual inspection. This post-processing step is crucial for ensuring that only the actual flooded areas were included in the final calculation. As a result of this correction process, the total flooded area was calculated to be 3,847.36 m2, as shown in Figure 8.
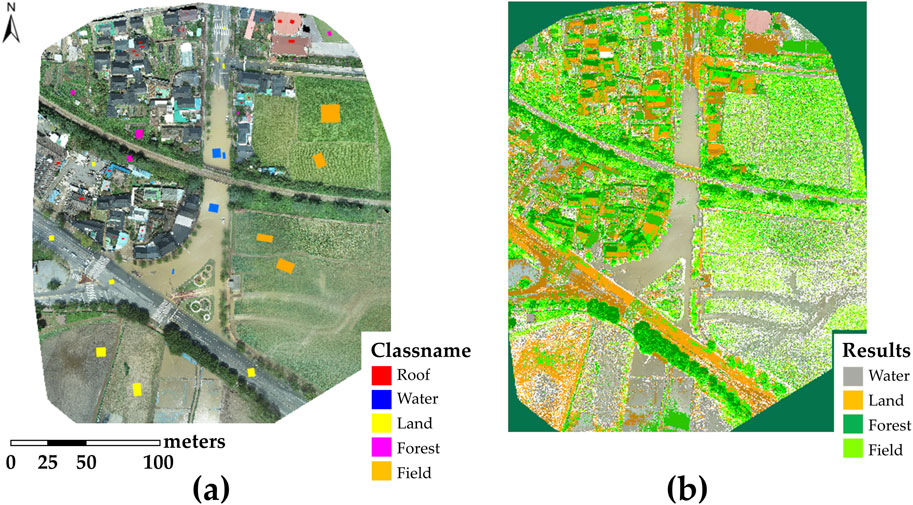
Figure 7. Unsupervised classification of analytical data to derive flooded region. (A) five parts of class scheme (B) results of unsupervised classification.
A flood volume calculation was performed based on the flooded area extracted and the analytical data constructed in Section 3.2. This study used the ArcGIS software from Esri in the United States to generate raster data values for flooding and non-flooding situations using zonal statistics techniques. Based on the generated raster data values, the occluded region was removed using elevation data around region (bottom of the bridge) that occurred in the flooded area. The next step was to create a DSM of a non-flooding situation using the Conversion technique, i.e., raster to polygon. The DSM of the non-flooding and flooding situation generated in this study is as follows in Figure 9.
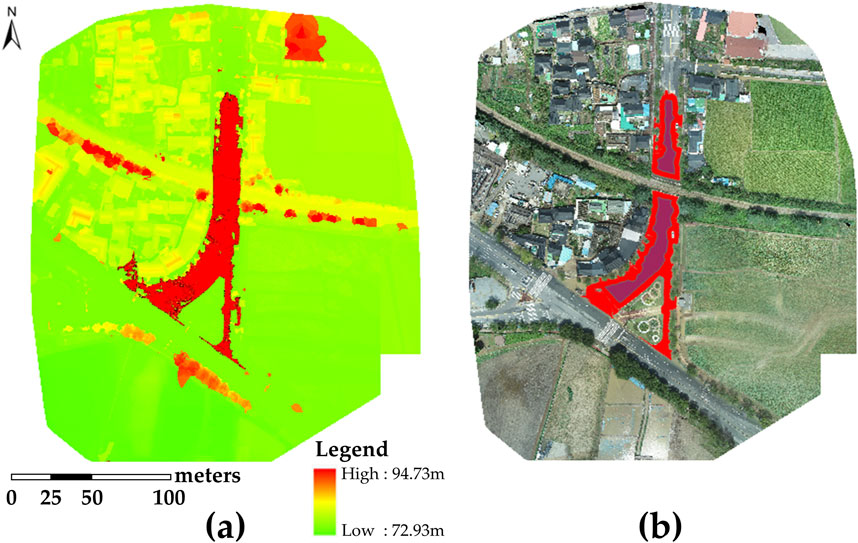
Figure 9. Results of generated DSM. (A) Non-flooding DSM for occluded region removal (B) Flooding DSM with error correction.
The flood volume was determined using polygon to raster in the conversion technique for flood volume derivation based on the built-in non-sinking and flood DSM. The analysis revealed that the flood volume of the study surface was 13,895.13 m3. The results regarding flood volume derivation are shown in Figure 10.
4 Discussion
This study employed UAVs and GIS to calculate flooded areas and flood volumes, addressing the critical need for rapid and accurate flood inundation assessment. By leveraging the advantages of UAVs in accessing hard-to-reach areas and combining this with GIS analysis, we achieved a high level of objectivity and accuracy. Our approach builds upon recent research trends in disaster management, such as the work of Annis et al. (2020), but extends beyond mere flood detection and spatial data construction.
The proposed methodology offers several advantages over conventional techniques. Firstly, it enables relatively quick quantitative inundation information calculation compared to earlier studies, which is crucial in disaster response scenarios where timely information can significantly impact recovery efforts. Secondly, our method allows for the construction of spatial data while minimizing the modeling noise that typically occurs when generating DSM of flooded areas using traditional aerial images. Lastly, the use of UAVs provides high-resolution imagery (GSD resolution of 2.12–2.49 cm/pixel in our study), allowing for more detailed flood mapping compared to satellite-based methods.
However, it's important to acknowledge the limitations of this study. The method requires spatial data of the study area under non-flooding conditions, which may not always be readily available. Due to the unavailability of suitable validation data, such as field survey measurements or high-resolution reference maps, we were unable to perform quantitative validation of the calculated flood extent and volume. This is a critical limitation that needs to be addressed in future research. Additionally, our study did not investigate the sensitivity of the results to various factors such as image resolution, GIS analysis parameters, or terrain characteristics.
To address these limitations, future research should prioritize several areas. Validation studies should be conducted by collecting field data during or immediately after flooding events for comparison with UAV-derived flood inundation information. Comparative analysis between our method and traditional simulation models or other established techniques would also be beneficial. Sensitivity analysis investigating how factors like image resolution, GIS analysis parameters, and terrain types impact the flood mapping results should be carried out. Furthermore, integrating our methodology with existing databases on flood-prone areas and hazardous structures, as demonstrated by Kim and Kim (2023) and Baek et al. (2023), could enhance the practical applicability of the approach.
Theoretically, our study contributes to the growing body of literature on remote sensing applications in disaster management. It bridges the gap between rapid assessment needs and precise quantification in flood analysis, potentially shifting the paradigm from traditional hydrological modeling to more agile, image-based approaches.
5 Conclusion
This study demonstrated the effective use of UAVs and GIS to calculate flooded areas and flood volumes in a small urban region. Through four aerial photography sessions over 2 days, we collected 796 images to create high-resolution orthoimages and a detailed DSM of the study area. Using unsupervised classification and GIS analysis techniques, we calculated a total flooded area of 3,847.36 m2 and a flood volume of 13,895.13 m3.
The methodology proposed in this study represents a significant step towards improving flood damage assessment techniques. By utilizing only UAV imaging and GIS, we’ve developed an approach that potentially offers faster and more detailed flood inundation mapping compared to traditional methods, aligning with our initial objective of enhancing the speed and accuracy of flood inundation assessment.
The theoretical significance of this work lies in its potential to shift flood analysis paradigms from complex hydrological models to more accessible, image-based approaches. This could democratize flood assessment capabilities, making them available to a wider range of stakeholders in disaster management.
Future research directions should focus on rigorous validation of the methodology through field studies and comparative analyses. Exploration of machine learning and AI techniques to further automate and enhance the accuracy of flood extent and volume calculations would be beneficial. Investigation of the method’s applicability in diverse geographical and urban settings is also necessary. Additionally, integration of real-time data processing capabilities for immediate flood assessment during ongoing disaster events should be pursued.
In conclusion, while our study has limitations, it presents a promising approach to rapid and detailed flood assessment. As climate change continues to increase the frequency and severity of flooding events, methodologies like the one proposed here will become increasingly valuable for effective disaster management and urban resilience planning.
Data availability statement
The original contributions presented in the study are included in the article/supplementary material, further inquiries can be directed to the corresponding author.
Author contributions
H-JW: Conceptualization, Investigation, Methodology, Validation, Writing–original draft. D-MS: Investigation, Methodology, Writing–original draft. M-SK: Formal Analysis, Investigation, Validation, Visualization, Writing–review and editing. H-KL: Methodology, Project administration, Visualization, Writing–original draft, Supervision, Validation.
Funding
The author(s) declare that financial support was received for the research, authorship, and/or publication of this article. This research was supported by the Basic Science Research Program through the National Research Foundation of Korea (NRF) funded by the Ministry of Education (NRF-2021R1I1A1A01052635) and the 23 KNU-DGG BIZ linked Open Innovation lab support project.
Conflict of interest
The authors declare that the research was conducted in the absence of any commercial or financial relationships that could be construed as a potential conflict of interest.
Publisher’s note
All claims expressed in this article are solely those of the authors and do not necessarily represent those of their affiliated organizations, or those of the publisher, the editors and the reviewers. Any product that may be evaluated in this article, or claim that may be made by its manufacturer, is not guaranteed or endorsed by the publisher.
References
Annis, A., Nardi, F., Petroselli, A., Apollonio, C., Arcangeletti, E., Tauro, F., et al. (2020). UAV-DEMs for small-scale flood hazard mapping. Water 12, 1717. doi:10.3390/w12061717
Baek, J., Noh, J., Hyeon, T., Cho, Y., and Lim, L. (2023). A study on building extraction within flood and landslide prone areas utilizing spatial information of buildings. J. Archit. Inst. Korea 39, 47–54. doi:10.5659/JAIK.2023.39.6.47
Brivio, P. A., Colombo, R., Maggi, M., and Tomasoni, R. (2002). Integration of remote sensing data and GIS for accurate mapping of flooded areas. Int. J. Remote Sens. 23, 429–441. doi:10.1080/01431160010014729
Buse, Ö., and Ercoşkun, Ö. Y. (2024). Integration of rs and GIS in assessing flood risk: a case study on istanbul-esenyurt. J. Contemp. Urban Aff. 8, 57–78. doi:10.25034/ijcua.2024.v8n1-4
Chae, H. (2005). Assessment of the inundation area and volume of tonle sap lake using remote sensing and GIS. J. Korean Assoc. Geogr. Inf. Stud. 8, 96–106.
Choung, Y. (2015). Land cover change detection in the nakdong river basin using LiDAR data and multi-temporal landsat imagery. J. Korean Assoc. Geogr. Inf. Stud. 18, 135–148. doi:10.11108/kagis.2015.18.2.135
Frey, D., Butenuth, M., and Straub, D. (2012). Probabilistic graphical models for flood state detection of roads combining imagery and DEM. IEEE Geoscience Remote Sens. Lett. 9, 1051–1055. doi:10.1109/lgrs.2012.2188881
Guerriero, L., Focareta, M., Fusco, G., Rabuano, R., Guadagno, F. M., and Revellino, P. (2018). Flood hazard of major river segments, benevento province, southern Italy. J. Maps 14, 597–606. doi:10.1080/17445647.2018.1526718
Haala, N., Cramer, M., and Rothermel, M. (2013). Quality of 3D point clouds from highly overlapping UAV imagery. Int. Archives Photogrammetry, Remote Sens. Spatial Inf. Sci. 40, 183–188. doi:10.5194/isprsarchives-xl-1-w2-183-2013
Han, S. (2017). Parallel processing of K-means clustering algorithm for unsupervised classification of large satellite imagery. J. Korean Soc. Surv. Geodesy, Photogrammetry Cartogr. 35, 187–194. doi:10.7848/ksgpc.2017.35.3.187
Hou, J., Ma, Y., Wang, T., Li, B., Li, X., Wang, F., et al. (2021). A river channel terrain reconstruction method for flood simulations based on coarse DEMs. Environ. Model. & Softw. 140, 105035. doi:10.1016/j.envsoft.2021.105035
Iqbal, A., Mondal, M. S., Veerbeek, W., Khan, M. S. A., and Hakvoort, H. (2023). Effectiveness of UAV-based DTM and satellite-based DEMs for local-level flood modeling in jamuna floodplain. J. Flood Risk Manag. 16, e12937. doi:10.1111/jfr3.12937
Jiménez-Jiménez, S. I., Ojeda-Bustamante, W., Marcial-Pablo, M. d.J., and Enciso, J. (2021). Digital terrain models generated with low-cost UAV photogrammetry: methodology and accuracy. ISPRS Int. J. Geo-Information 10, 285. doi:10.3390/ijgi10050285
Kim, D. H., and Kim, H. J. (2023). Analysis of flooding forecasting using GIS and suitability of the shelter site for elderly friendly cities: focusing on pohang city. J. Korean Soc. Geospatial Inf. Sci. 31, 13–25. doi:10.7319/kogsis.2023.31.3.013
Kim, J., Park, J., Cho, B., and Lee, S. (2020). A comparative analysis of disaster vulnerability factors between declining areas and urban areas. J.Digit.Contents Soc. 21, 2021–2032. doi:10.9728/dcs.2020.21.11.2021
Kim, M. C., Yoon, H. J., Chang, H. J., and Yoo, J. S. (2016). Damage analysis and accuracy assessment for river-side facilities using UAV images. J. Korean Soc. Geospatial Inf. Sci. 24, 81–87. doi:10.7319/kogsis.2016.24.1.081
Kim, S., Jun, K., Lee, S., and Pi, W. (2022). Analysis of the impact of building congested area for urban flood analysis. J. Korean Soc. Disaster Secur. 15, 41–46. doi:10.21729/ksds.2022.15.3.41
Lee, G., and Choi, Y. (2014). Land cover classification of nakdong river basin using object-based image analysis methods. J. Korean Cadastre Inf. Assoc. 16, 3–18.
Li, B., Hou, J., Li, D., Yang, D., Han, H., Bi, X., et al. (2021). Application of LiDAR UAV for high-resolution flood modelling. Water Resour. manage. 35, 1433–1447. doi:10.1007/s11269-021-02783-w
Lim, H., Ahn, S., Kim, J., Park, S., and Kim, Y. (2016). A study on the application of unmanned aerial vehicle for improvement method of the making inundation trace map. J. Korean Soc. Hazard Mitig. 16, 223–231. doi:10.9798/kosham.2016.16.2.223
Liu, Z., Zhao, L., Xu, T., Bu, F., Liu, X., and Zhou, D. (2018). Quantification of potential flood inundation areas in the marsh wetland of honghe national natural reserve, northeast China. Ecohydrol. & Hydrobiology 18, 355–364. doi:10.1016/j.ecohyd.2018.10.005
Ma, S., and Zhang, K. (2022). Low-altitude photogrammetry and remote sensing in UAV for improving mapping accuracy. Mob. Inf. Syst. 2022, 1–8. doi:10.1155/2022/5809991
Moon, H., Lee, S., and Cha, J. (2017). Land cover classification using UAV imagery and object-based image analysis-focusing on the maseo-myeon, seocheon-gun, chungcheongnam-do. J. Korean Assoc. Geogr. Inf. Stud. 20, 1–14. doi:10.11108/kagis.2017.20.1.001
Nguyen, Q., Goyal, R., Luyen, B. K., Le Van, C., Cuong, C. X., Van Chung, P., et al. (2020). Influence of flight height on the accuracy of UAV derived digital elevation model at complex terrain. Inżynieria Miner. 1, 179–186. doi:10.29227/im-2020-01-27
Oh, Y. O., Choi, K. A., and Lee, I. P. (2017). “Disaster damage detection using drone aerial images,” in 2017 Joint Fall Conference Proceedings of the Korean Society for Geo-spatial information Science, 213–214.
Parizi, E., Khojeh, S., Hosseini, S. M., and Moghadam, Y. J. (2022). Application of unmanned aerial vehicle DEM in flood modeling and comparison with global DEMs: case study of atrak river basin, Iran. J. Environ. Manage. 317, 115492. doi:10.1016/j.jenvman.2022.115492
Sadeghi, S., and Sohrabi, H. (2019). The effect of UAV flight altitude on the accuracy of individual tree height extraction in a broad-leaved forest. Int. Archives Photogrammetry, Remote Sens. Spatial Inf. Sci. 42, W18.
Samela, C., Albano, R., Sole, A., and Manfreda, S. (2018). A GIS tool for cost-effective delineation of flood-prone areas. Comput. Environ. Urban Syst. 70, 43–52. doi:10.1016/j.compenvurbsys.2018.01.013
Woo, H., Hong, W., Oh, J., and Baek, S. (2023). Defining structural cracks in exterior walls of concrete buildings using an unmanned aerial vehicle. Drones 7, 149. doi:10.3390/drones7030149
Keywords: flood inundation data, flood inundation assessment, unmanned aerial vehicle, aerial photography, spatial information
Citation: Woo H-J, Seo D-M, Kim M-S and Lee H-K (2024) Development of methodology for calculating flooded area and flood volume in small urban areas based on unmanned aerial vehicle images. Front. Built Environ. 10:1482330. doi: 10.3389/fbuil.2024.1482330
Received: 18 August 2024; Accepted: 21 October 2024;
Published: 06 November 2024.
Edited by:
Chen Ren, Southeast University, ChinaReviewed by:
Hourakhsh Ahmadnia, Alanya University, TürkiyeHaocheng Zhu, Southeast University, China
Copyright © 2024 Woo, Seo, Kim and Lee. This is an open-access article distributed under the terms of the Creative Commons Attribution License (CC BY). The use, distribution or reproduction in other forums is permitted, provided the original author(s) and the copyright owner(s) are credited and that the original publication in this journal is cited, in accordance with accepted academic practice. No use, distribution or reproduction is permitted which does not comply with these terms.
*Correspondence: Hye-Kyoung Lee, bGhrQGtudS5hYy5rcg==
 Hyun-Jung Woo
 Dong-Min Seo
 Min-Seok Kim2
 Hye-Kyoung Lee