
94% of researchers rate our articles as excellent or good
Learn more about the work of our research integrity team to safeguard the quality of each article we publish.
Find out more
ORIGINAL RESEARCH article
Front. Built Environ. , 13 November 2024
Sec. Indoor Environment
Volume 10 - 2024 | https://doi.org/10.3389/fbuil.2024.1464027
Clean indoor air is crucial for human lives in residential and workplace settings, including food safety and supply chains. Since the COVID-19 outbreak, disinfecting air has become vital for the public as the SARS-CoV-2 virus and other infectious diseases transmit via inhalable aerosols. Ultraviolet (UV) light is known to be effective in disinfecting air. However, it is still challenging to properly design practical UV applications with common light design software. Visible light analysis software, AGi32, assists architectural applications. AGi32 utilizes digitized luminaire IES files to model light intensity on user-designed geometry in common far-field uses. IES files are based on far-field photometry to model light intensity at different distances and angles from the source. The common application of IES files is to model visible light intensities; however, IES files generated for UV light are still rarely available. Due to the increasing need for surface and air disinfection, modeling UV light intensity using IES files may be beneficial for designing and evaluating systems containing UV light bulbs in near-field applications. There is limited information regarding the accuracy of UV modeling in AGi32 software using IES files. Therefore, the research objectives were to (1) create IES files of a UV-C germicidal lamp (254 nm) and a visible fluorescent lamp with almost identical metrics; (2) compare the IES files output with physical UV measurements inside and outside of an air duct; (3) develop correlations between light intensities of visible and UV light bulbs. Linear correlations were observed when comparing UV irradiance and visible illuminance for both measured and modeled data. The results indicated high variability between the measured and modeled light data, signifying the importance of further investigation of potential error sources and improving the accuracy of modeling.
Light design and modeling software such as AGi32 and DiaLux utilize “.ies” (Illuminating Engineering Society) files to design lighting systems as well as calculate light illuminance with numeric and rendered solutions. These lighting analysis software or tools have been used in architectural lighting design and they can help with interior lighting design, daylighting analysis, exterior and landscape lighting, visualization of lighting effects, and others. IES files, a common digitized luminaire file type, typically document the information based on a single light fixture model. IES files are often created with sophisticated equipment, such as a goniophotometer, in highly controlled laboratory conditions. They are often based on far-field photometry, which assumes light coming from a single point (point source irradiation), and the light distribution follows the “five times rule” with near-Lambertian distributions. The “five times rule” states that the light can be treated as a point source when the target object is at least five times the largest dimension (length or diameter) of the luminaire in an ideal environment condition (ANSI/IES, 2022; Keitz, 1971). Most publicly available IES files are for visible light luminaries, such as fluorescent lamps and light-emitting diodes (LED).
When this paper was in preparation, there were limited publicly available IES files for tubular UV bulbs. Some manufacturers choose to share IES files publicly while some do not; on the other hand, acquiring IES files through a certified laboratory can be costly. To our knowledge, thus far, there has been no UV-related irradiance modeling published using AGi32 software. The AGi32 is a popular add-on package developed to assist with far-field architectural applications such as roadways, parking lots, sports arenas, and commercial indoor spaces. Also, there is limited available research regarding the generation and application of IES files for UV light modeling. Modeling UV irradiance using IES files in AGi32 could be a viable solution for estimating UV irradiance effectively and efficiently, especially with complex geometry and computer-aided design (CAD) files. However, the accuracy of the modeling needs to be evaluated before widespread adoption, especially for near-field applications common to UV disinfection of air. Conversely, due to the scarcity of UV-based IES files, utilizing currently available IES files for UV modeling might be an option.
This research attempts to find if there are linear correlations between the modeled light intensity data from existing visible light IES files and modeled UV irradiance from a UV bulb with similar specifications. If successful, the linear correlation approach can be an alternative way to model UV, as there are overwhelmingly more IES files for visible light bulbs while very few for UV bulbs.
There has been increasing interest in adopting UV for air and surface disinfection to inactivate pathogens potentially harmful to human and animal health. Studies have shown that UV light is effective in mitigating many airborne and surface-borne pathogens. ASHRAE mentioned a conservative dose for 99% inactivation of airborne SARS-CoV-2 virus as 1.50 mJ/cm2 (ASHRAE, 2024). According to Sabino et al. (2020), UV-C (254 nm) dose needed for surface-borne SARS-CoV-2 is 0.706 mJ/cm2 for 99% reduction and 6.556 mJ/cm2 for 99.9% reduction. UV is also effective on common viruses and bacteria in animal production industries (Li et al., 2021). Due to the harmful effect of UV, UV bulbs cannot be positioned for direct exposure when humans or animals are present. For enclosed air cleaner or purifier design, UV bulbs can be more effective when positioned after air filters. This would prevent dust from covering the bulbs and therefore reduce their effectiveness (Li et al., 2024a). UV applications in buildings can help improve indoor air quality (IAQ) by removing unwanted pathogens and improve the equivalent air changes per hour (ACHe). This reduces the ventilation needed to achieve the same level of pathogen reduction, which would make the building more energy efficient and sustainable. The UV application would align with the vision of design of efficient and healthy buildings (González-Lezcano, 2023). There is a practical need to properly model UV irradiance with popular engineering software such as AGi32 to accurately estimate the needed UV irradiance and, therefore UV dose for a particular target. Therefore, examining the performance of commonly used light modeling software and its accuracy in near-field consistent with UV treatment of air provides useful information for users to make decisions while choosing the modeling option. This research builds upon a prior experiment by Li et al. (2024b) where UV and visible light measurements in near- and far-field scenarios were conducted in an air cleaner prototype, and spreadsheet-based point-source and line-source modeling was performed. In the previous study, we observed major discrepancies between measured and modeled data, especially in near-field applications. Therefore, the objectives of this research were to adopt AGi32 for modeling UV light solutions in an effective and efficient manner. More specifically, we aimed to (1) create IES files of a UV-C germicidal lamp (254 nm) and a visible fluorescent lamp with almost identical metrics; (2) compare the IES file output with physical UV measurements in and out of air duct; (3) develop the correlation between the visible and UV light intensity of the two lamps.
Light measurement data were adopted from a previous study on UV and fluorescent light intensity3. Briefly, a common UV-C bulb (low-pressure monochromatic bulb, #G30T8; Ushio America Inc., Cypress, CA, United States) and a common fluorescent bulb (fluorescent light bulb, F30T8, 4100K color temperature; General Electric, Boston, MA, United States) were chosen for the study. The UV and visible tubular light bulbs had the same physical dimensions (90 cm or 36 in. In length and 2.5 cm or 1 in. In diameter) and nominal power consumption (30 W). A radiometer (ILT 1700; International Light Technologies, Peabody, MA, United States) with a wavelength-specific combination of detectors and filters was used to measure the light output from UV and visible light on the cross-sectional area of an air duct (with an opening of 1.52 × 1.02 m; 60 × 40 in.) from a commercial air-cleaning prototype.
Three power output modes (1-bulb, 4-bulb, and 8-bulb) were measured. The UV measurement was conducted using the SED240 light detector and NS254 filter combination (International Light Technologies, Peabody, MA, United States), which measured a center wavelength of 254 nm with a range of 254–257 nm. The manufacturer had a ±6.5% transfer uncertainty to customers and a ±2.4% uncertainty from the National Institute of Standards and Technology (NIST), with a 95% confidence level. The visible light spectrum (400–700 nm) was measured by a combination of a SED033 light detector and a Y4 filter. The manufacturer had a ±4.3% transfer uncertainty to customers and a ±0.5% uncertainty from NIST, with a 95% confidence interval. Calibration factors for UV and visible light detector and filter combinations were provided by the manufacturer and were adopted during measurements on two different light type measurements, respectively. Light measurements were performed on vertical grid planes, each divided into 7 × 5 cells (in a total of 35 cells, with 0.14 × 0.12 m for each cell). The light detector was positioned at the center of each cell until the reading became stable before the measurement was recorded.
Four different distances, 0.0254 m, 0.0762 m, 0.127 m, and 0.254 m (1 in., 3 in., 5 in., and 10 in., respectively) from the UV or visible light source were measured inside the air duct. For outside of the duct, five distances, 0.762 m, 1.524 m, 3.048 m, 4.572 m, and 6.096 m (or 2.5 ft, 5 ft, 10 ft, 15 ft, and 20 ft, respectively) were measured. Three additional distances, 0.51 m, 7.62 m, and 9.14 m (20 in., 25 ft, and 30 ft, respectively) were simulated in Agi32 but not measured. Figure 1 displays the overview of light measurement with the radiometer, detectors, and sensors. The distance between the light bulbs to the end of the air duct was about 0.37 m (14.5 in.).
AGi32 software (Lighting Analysts, Inc, 2022) is light modeling software that can be used for exterior and interior lighting design and calculation common in far-field. The software can import IES files and position them on 3-D geometries to calculate and render the light output to facilitate the light designing process. To generate IES files from the UV and visible light bulbs used in this study for modeling and comparison purposes, upon request, UL Solutions (Allentown, PA, United States) generated the IES files based on standards IES LM-9–2009 (IES, 2009) and ANSI C82.77–10-2014 (ANSI, 2014). Two IES files were obtained, one for the fluorescent bulb and the other for the UV bulb, respectively (UL Verification Services, 2021a; UL Verification Services, 2021b).
To generate an equivalent UV IES file based on existing visible light IES file, an assumption was made that the distribution of a fluorescent lamp was equivalent to the UV-C low-pressure mercury lamp. The fluorescent lamp and ballast were mounted on a high-speed type-C Goniophotometer where the intensity distribution was measured (Figure 2). The UV-C lamp and ballast were then mounted onto the gonio and placed at a height of 2.30 m (90.5 in.) above an OL756 UV/VIS spectroradiometer (G&H, Somerset, United Kingdom).
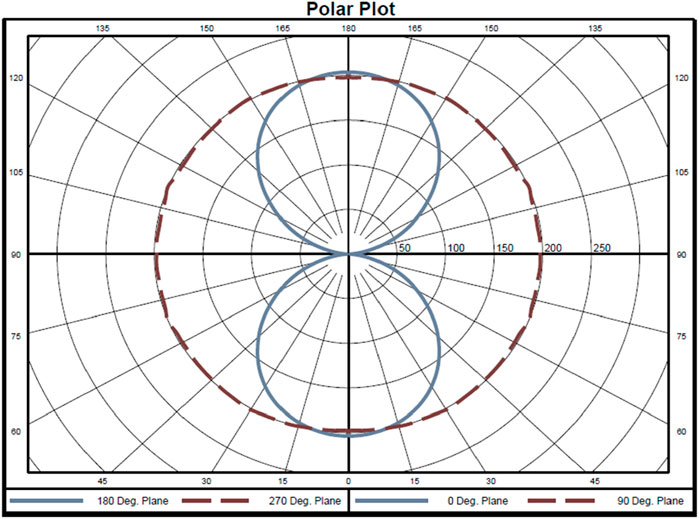
Figure 2. A polar graph was generated based on the goniometer measurement. The image is for illustration purposes and was extracted from a technical report (UL Verification Services. Indoor Distribution Test Report. Report No. 14030482.01, 9/21/2021. Allentown, PA)7 © 2024 UL LLC. All rights reserved.
An irradiance measurement of the UV-C lamp was made. With the known distance and known irradiance, the measurement was then converted to Watts per steradian (W/sr). With the known intensity at IES Type C coordinate location (0,0) and the known radiant intensity of the UV-C lamp at coordinate (0,0), a conversion factor from candela (cad) to W/sr was created. This conversion factor was then applied to the candela values in the IES file of the fluorescent lamp to create an equivalent IES file for the UV-C lamp in W/sr.
Eight cross-sectional planes, each plane segmented into a 7-by-5 grid (i.e., 35 points), were established in the AGi32 environment to estimate the UV irradiation and visible illumination. Note that the laboratory environment where the physical measurements were conducted cannot be fully reflected in the AGi32 environment. The reflectance of the surroundings, when the measurement planes were inside the duct, was assumed to be the default value of 0.8, which is similar to the estimated reflectance of galvanized steel (Decrolux, 2024), while the reflectance outside of the duct was assumed to be similar to common household floors and ceiling. The IES file generated for the fluorescent light bulb was also installed in the same established geometry (same exact grid sizes and distances to the light fixture plane) in AGi32.
The rendering effect is shown in Figure 3, simulating the number and positions of UV or visible light bulbs during the actual measurements.
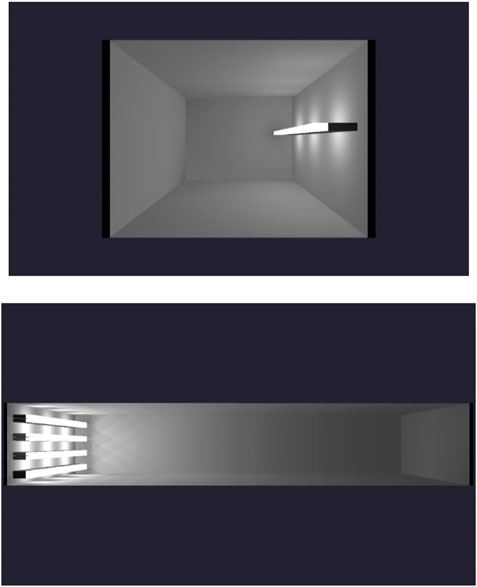
Figure 3. Top: Rendered image showing the 1-bulb irradiation scenario. The color displayed from the light source is pseudo-color, and the bright and dark distributions indicate the relative intensity of light. The opening of the “wall” facing the reader is only to view the light distribution. During the light calculation, the walls to the left and right sides of the light bulb are identical. Bottom: Ray tracing image showing the 8-bulb (4 fixtures, two bulbs each fixture) irradiation scenario. The color displayed from the light source is pseudo-color, and the bright and dark distributions indicate the relative intensity of light.
Equation 1 describes the calculation of the percent error of the average irradiance or illuminance from each plane between modeled and measured data. The measured data were treated as “true values,” and the percentage error describes how the modeled intensity deviates from the measured data. Besides the percentage error, a t-test was performed comparing the measured and the modeled data sets under each light bulb category and for each power mode.
Where Imod is the average (of 35 points per plane) modeled light intensity (irradiance for UV in mW/cm2; or illuminance in lux, for visible light), Imea is the average (of 35 points per plane) measured light intensity (irradiance for UV in mW/cm2 or illuminance for visible light in lux).
After the AGi32 simulation was completed, visible illuminance data were compared to UV irradiance data using linear regression in each of the nine planes.
Equation 2 describes the proposed correlation between UV irradiance and visible illuminance.
Where, y is the modeled UV irradiance (mW/cm2); x is the modeled visible illuminance (lux); C is the correlation factor between UV irradiance and visible illuminance, with a unit of lux. cm2. mW-1.
An example of the AGi32 modeled UV irradiance (mW/cm2) for one plane corresponding to the UV measurements at the center of each cell on a 7 × 5 grid is shown in Figure 4.
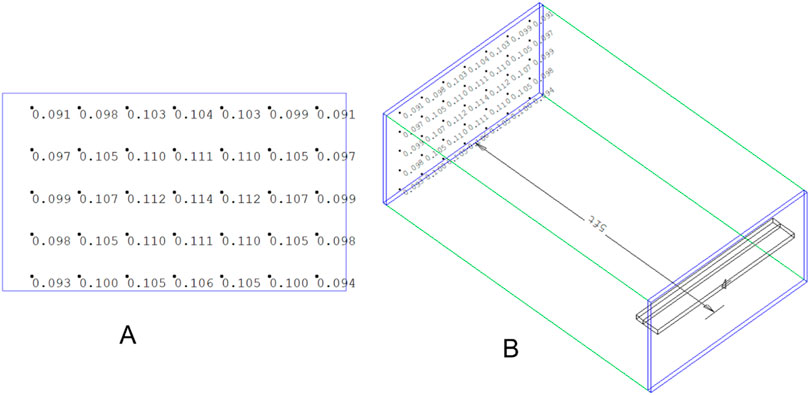
Figure 4. An example of AGi output on UV irradiance (mW/cm2) with 7 × 5 grids in the 1-bulb power mode. The distance between the UV light plane to the light intensity calculation plane is 1.5 m (or 5 ft). (A) the display of calculation results for each of the 35 grids; (B) the geometry of the UV light plane and the light intensity calculation plane.
Table 1 summarizes the measured and modeled UV irradiance data for all distances inside the air duct. High errors exist between measured and model data, from as low as 5% to as high as 351% (in absolute values). No obvious trends in errors over distances were observed. For 1-bulb and 4-bulb scenarios, there are statistically significant differences between the measured and the modeled data set.
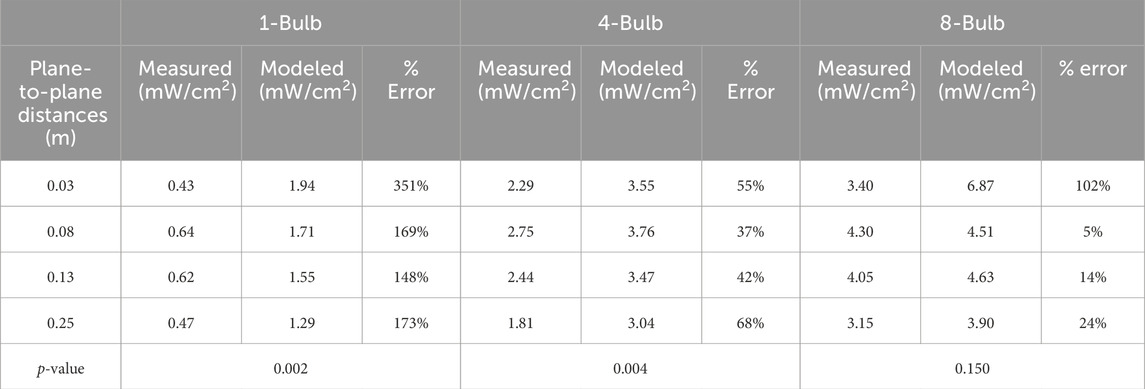
Table 1. Summary of measured and modeled UV irradiance results inside the air duct from each measurement plane of various distances from the light source plane with the default reflectance condition (reflectance = 0.8).
Table 2 summarizes the measured and modeled visible illuminance data for all distances. High errors exist between measured and model data, from as low as 2% to as high as 154% (in absolute values). No obvious trends in errors with respect to distances were observed.

Table 2. Summary of measured and modeled visible illuminance results in-duct from each measurement plane of various distances from the light source plane with the default reflectance condition (reflectance = 0.8). Negative values refer to the cases where the modeled is less than the measured, resulting in less than 0% error.
The average values of modeled visible illuminance and UV irradiance were linearly correlated, as shown in Figure 5. Statistical parameters are summarized in Table 3. The results indicated that there is a correlation between visible illuminance and UV irradiance of two types of light bulbs that share the same physical geometry and nominal power consumption. The correlation factors for all three power output modes have a coefficient of determination (R-square values) of above 0.95, indicating strong linear correlations.
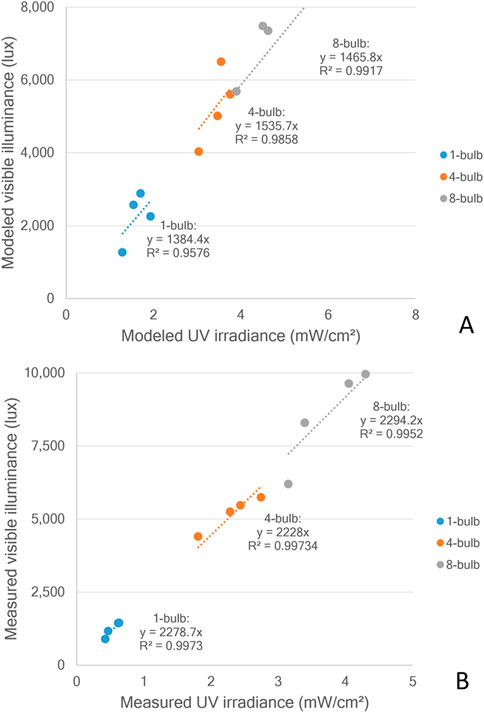
Figure 5. Correlation between modeled illuminance and modeled irradiance for all three power output options (A) and correlation between measured illuminance and measured irradiance for all power output options (B).

Table 3. Summary of coefficients and R2 of the correlations between modeled illumination and modeled irradiance.
For measurement and modeling outside of the air duct, Table 4 summarizes the measured and modeled UV irradiance data for all distances. High errors exist between measured and model data, from as low as 3% to as high as 120% (in absolute values). No obvious trends in errors related to the distance were observed.
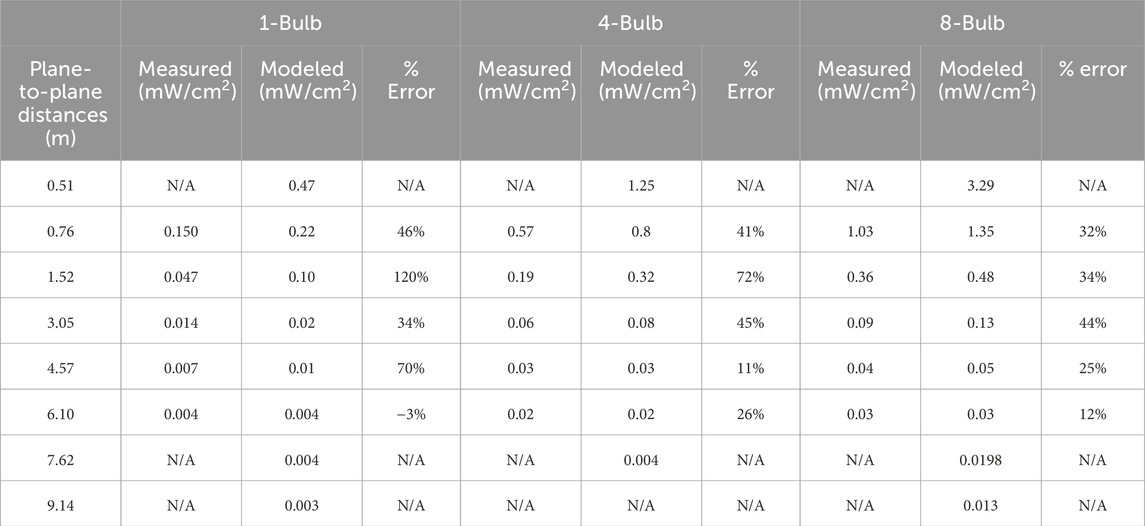
Table 4. Summary of measured and modeled UV irradiance results outside of the air duct from each measurement plane of various distances from the light source plane with the realistic reflectance condition. N/A indicates that the data were not measured or unavailable.
Likewise, Table 5 summarizes the measured and modeled visible illuminance data for all distances out of the air duct. The percentage error ranges from almost 0%–52% (in absolute values).
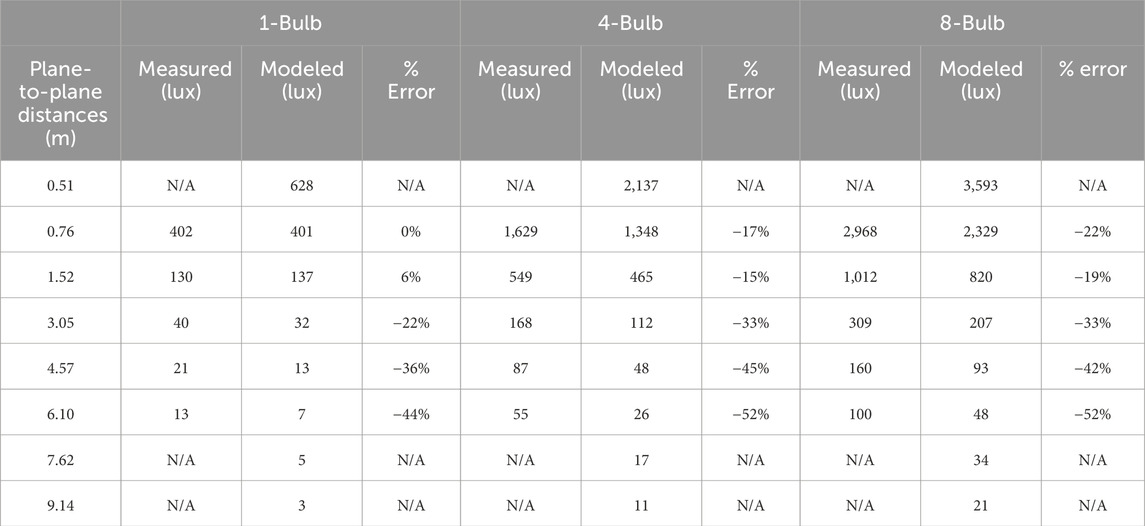
Table 5. Summary of measured and modeled visible illuminance results out-of-duct from each measurement plane of various distances from the light source plane with realistic reflectance conditions. Negative values refer to the cases where the modeled data is less than the measured, resulting in less than 0% error. N/A indicates that the data were not measured or unavailable.
Figure 6 shows the linear correlation between the average values of modeled visible illuminance and UV irradiance. Statistical parameters are summarized in Table 6. The correlation factors for all three power output modes have a coefficient of determination (R-square values) of above 0.96, indicating strong linear correlations.
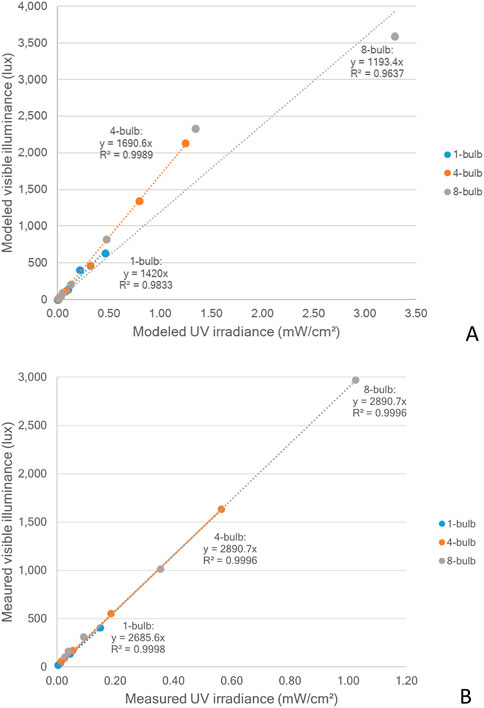
Figure 6. Correlation between modeled illuminance and modeled irradiance for all three power output options (A) and correlation between measured illuminance and measured irradiance for all power output options (B).

Table 6. Summary of coefficients and R2 of the correlations between modeled illumination and modeled irradiance.
In this study, the radiometer-measured data can be regarded as “references” to evaluate the accuracy of the modeled data, although the measured data still have an uncertainty of 8.9% and 4.8% for UV and visible light measurements, respectively, based on manufacturer information9. Based on the results of percent error, high errors between modeled and measured data were observed. Therefore, identifying sources of error and improving modeled light intensity in AGi32 is necessary for more accurate modeling of UV light distribution. For UV light, higher power output (8-bulb or 4-bulb mode) yielded lower errors than lower power output (1-bulb mode). However, a similar trend was not observed for the visible light bulbs. Also, no obvious relationship between the errors and distance was observed.
The accuracy of the IES files generated during the measurement of bulbs using a photogoniometer also plays an important role in determining the results of this experiment. Due to the early-stage development of digitizing UV light bulbs using a photogoniometer, a higher-than-expected error may exist and contribute to some of the abovementioned discrepancies.
Alternatively, the physical geometry of the light luminaire, the light structure, the air duct, and the surrounding environment cannot be fully recreated in AGi32 due to their complexity, which also contributed to the differences between modeled and measured data. Adjusting the environmental parameters, such as surface reflectance and light loss factors, to be more representative of realistic scenarios may help improve the accuracy of light modeling and reduce errors. The experimental setup can be improved by conducting the measurements in a painted duct with known reflectance, thereby reducing the difference between the measured and the modeled.
This study only focuses on one type of common UV bulb and one type of fluorescent bulb. The bulbs used were both tubular bulbs. The result may not be applicable or comparable to other types or shapes of UV or fluorescent bulbs. The correlation between UV and visible intensity is also influenced by the power output (such as the number of bulbs and the power consumption of each bulb). Therefore, more studies are needed to prove the linear correlation between UV and visible light intensity.
This research presents a preliminary attempt at modeling UV via IES files and correlating the light intensity of two types together for ease of modeling. IES files for UV and fluorescent lamps were created and used for modeling in AGi32. Strong linear correlations were observed when comparing UV irradiance and visible illuminance for both measured and modeled data. However, with high errors between the measured and modeled data, further development of IES files and modeling efforts are warranted to improve the modeling process and accuracy.
The original contributions presented in the study are included in the article/supplementary material, further inquiries can be directed to the corresponding author.
PL: Conceptualization, Data curation, Formal Analysis, Investigation, Methodology, Project administration, Resources, Software, Validation, Visualization, Writing–original draft, Writing–review and editing. JK: Conceptualization, Funding acquisition, Methodology, Project administration, Resources, Supervision, Validation, Writing–review and editing. WW: Data curation, Investigation, Writing–review and editing. BY: Data curation, Investigation, Writing–review and editing. BR: Resources, Supervision, Writing–review and editing.
The author(s) declare that financial support was received for the research, authorship, and/or publication of this article. Some materials and equipment used in this research were from the project (#A-2021-236) funded by Kryton Engineered Metals, Inc (Cedar Falls, Iowa) and the Center for Industrial Research and Service (CIRAS) of Iowa State University.
We would like to thank the UL Solutions team in Allentown, PA, United States, for providing crucial third-party testing expertise.
The authors declare that this study received funding from Kryton Engineered Metals, Inc. The funder was not involved in the study design, collection, analysis, interpretation of data, the writing of this article, or the decision to submit it for publication.
All claims expressed in this article are solely those of the authors and do not necessarily represent those of their affiliated organizations, or those of the publisher, the editors and the reviewers. Any product that may be evaluated in this article, or claim that may be made by its manufacturer, is not guaranteed or endorsed by the publisher.
HVAC, heating, ventilation, and air-conditioning; IES, Illuminating Engineering Society; UL, Underwriters Laboratories Inc.; UV, ultraviolet; UV-C, ultraviolet-C; UVGI, ultraviolet germicidal irradiation; NIST, National Institute of Standards and Technology.
ANSI C82.77-10: (2014). Lighting equipment - harmonic emission limits - related power quality requirements.
ASHRAE (2024). Epidemic task force filtration and disinfection ASHRAE epidemic task force ASHRAE epidemic task force—filtration and disinfection. Available at: https://www.ashrae.org/file%20library/technical%20resources/covid-19/ashrae-filtration_disinfection-c19-guidance.pdf (Accessed October 14, 2024).
Decrolux (2024). Approximate reflectance values of typical building finishes. Available at: https://decrolux.com.au/learning-centre/2018/approximate-reflectance-values-of-typical-building-finishes (Accessed July 10, 2024).
González-Lezcano, R. A. (2023). Editorial: design of efficient and healthy buildings. Front. Built Environ. 9. doi:10.3389/fbuil.2023.1210956
IES. IES LM-9, (2009). Approved method: electrical and photometric measurement of fluorescent lamps.
Keitz, H. A. E. (1971). “Light calculations and measurements,”. London: Palgrave. Philips Technical Library. doi:10.1007/978-1-349-00012-8
Li, P., Koziel, J., Zimmerman, J., Zhang, J., Cheng, T.-Y., Yim-Im, W., et al. (2021). Mitigation of airborne PRRSV transmission with UV light treatment: proof-of-concept. Agriculture 11, 259. doi:10.3390/agriculture11030259
Li, P., Koziel, J. A., Paris, R. V., Macedo, N., Zimmerman, J. J., Wrzesinski, D., et al. (2024a). Indoor air quality improvement with filtration and UV-C on mitigation of particulate matter and airborne bacteria: monitoring and modeling. J. Environ. Manag. 351, 119764. doi:10.1016/j.jenvman.2023.119764
Li, P., Koziel, J. A., Yedilbayev, B., Paris, R. V., Walz, W. B., and Ramirez, B. C. (2024b). Is line-source modeling suitable for ultraviolet light application in an air cleaner duct? Front. Built Environ. 10. doi:10.3389/fbuil.2024.1325267
Lighting Analysts, Inc. (2022). Lighting analyst. Available at: https://lightinganalysts.com/software-products/agi32/overview/(Accessed July 10, 2024).
Sabino, C. P., Sellera, F. P., Sales-Medina, D. F., Machado, R. R., Durigon, E. L., Freitas-Junior, L. H., et al. (2020). UV-C (254 nm) lethal doses for SARS-COV-2. Photodiagnosis Photodyn. Ther. 32, 101995. doi:10.1016/j.pdpdt.2020.101995
UL Verification Services (2021a). Indoor distribution test report. Allentown, PA. Report No. 14030482.01.
Keywords: AGi32 modeling, light modeling, UV irradiation, light measurement, disinfection of air
Citation: Li P, Koziel JA, Walz WB, Yedilbayev B and Ramirez BC (2024) Irradiance modeling of tubular ultraviolet light bulbs. Front. Built Environ. 10:1464027. doi: 10.3389/fbuil.2024.1464027
Received: 13 July 2024; Accepted: 29 October 2024;
Published: 13 November 2024.
Edited by:
Hasim Altan, Prince Mohammad Bin Fahd University, Saudi ArabiaReviewed by:
Sanja Stevanovic, Mathematical Institute, SerbiaCopyright © 2024 Li, Koziel, Walz, Yedilbayev and Ramirez. This is an open-access article distributed under the terms of the Creative Commons Attribution License (CC BY). The use, distribution or reproduction in other forums is permitted, provided the original author(s) and the copyright owner(s) are credited and that the original publication in this journal is cited, in accordance with accepted academic practice. No use, distribution or reproduction is permitted which does not comply with these terms.
*Correspondence: Jacek A. Koziel, amFjZWsua296aWVsQHVzZGEuZ292; Brett C. Ramirez, YnJhbWlyZXpAaWFzdGF0ZS5lZHU=
Disclaimer: All claims expressed in this article are solely those of the authors and do not necessarily represent those of their affiliated organizations, or those of the publisher, the editors and the reviewers. Any product that may be evaluated in this article or claim that may be made by its manufacturer is not guaranteed or endorsed by the publisher.
Research integrity at Frontiers

Learn more about the work of our research integrity team to safeguard the quality of each article we publish.