- 1College of Civil Engineering, Zhejiang University of Technology, Hangzhou, China
- 2The Architectural Design and Research Institute of Zhejiang University Co., Ltd., Hangzhou, China
- 3Center for Balance Architecture, Zhejiang University, Hangzhou, China
- 4Zhejiang Design Group Co., Ltd., Zhejiang University of Technology, Hangzhou, China
This article presents a study of the wind-resistance and seismic behavior of steel frame elevator structures with square hollow section (SHS) members. The study was conducted by numerical analysis, it begins by examining the semi-rigid performance of SHS T-joints (beam-column joints) under in-plane bending moment, proposes a semi-rigid connection model for the joints, and then investigates the influence of semi-rigid joint effect on the performance of the steel elevators. Finite element (FE) results showed that the semi-rigid model can predict the moment-rotation response of the beam-column joints. The results also showed that the natural vibration period of the elevator with semi-rigid joints is 20% higher than that of an elevator with rigid joints. The semi-rigid joint effect causes the lateral drift of the elevator to increase by more than 47% under wind load, causing the maximum story drift of the elevator to exceed the limit specified in the current code. The semi-rigid joint effect causes the lateral displacement of the elevator to increase by approximately 15%–30% under the seismic waves of a rare earthquake.
1 Introduction
China has an aging population, and most residential buildings in the older urban areas do not have elevators, making life inconvenient for older people. Elevators are being installed in old buildings to solve this problem. Therefore, the performance of the additional elevator structure and the impact of the added elevator on the existing building has received the attention of engineers and researchers (Ogawa et al., 2007; Han et al., 2013; Niedostatkiewicz et al., 2019). In general, elevator structures can mainly be divided into two types: reinforced concrete structures (Jiang et al., 2021) and steel structures (Chen, 2018). In contrast to a reinforced concrete elevator which is connected to the existing building, the steel structure elevator is independent of the existing building (as shown in Figure 1). The steel elevator has the advantages of light weight and fast construction, and it also has little impact on residents’ lives during construction.
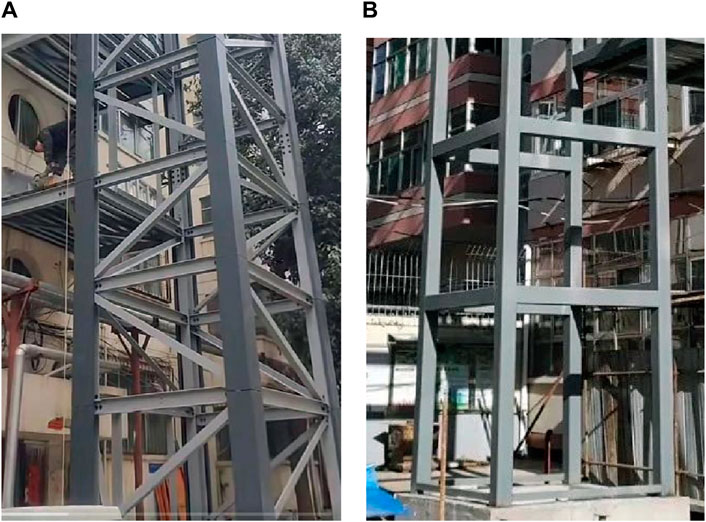
Figure 1. Examples of steel structure elevators which outside existing buildings. (A) Angle steel truss structure and (B) steel tube frame structure.
The steel tube elevator structure, which has rectangular hollow section (RHS) or square hollow section (SHS) beams directly welded to SHS columns, is a steel structure elevator widely applied in engineering practice. This elevator has the advantages of a smooth appearance and convenient installation of the envelope system. However, the strength of the joint of this elevator is relatively low, and many research results have demonstrated that the strength of the unstiffened tubular joint is usually lower than that of the adjacent beam (brace) (Mashiri and Zhao, 2004; Zhao et al., 2019a; Zhao et al., 2020; Zhao et al., 2022; Zhao et al., 2023). Although various strengthening measures (Iskander et al., 2017; Chang et al., 2020; Cheng et al., 2024; Li et al., 2024) can significantly improve the strength of the tubular joints or tubular column-H steel beam joints, the difficulty and cost of construction are increased. The beam-column joints of an elevator with RHS (SHS) members can be regarded as RHS (SHS) T-joints. When the elevator is subjected to horizontal loads such as wind or earthquake, the T-joints experience an in-plane bending moment (IPBM). Moreover, the unstiffened tubular joints show characteristic semi-rigid joints (Wang and Chen, 2005; Zhao et al., 2019b; Zhao et al., 2021), indicating that joint stiffness will influence the behavior of the tubular structures. However, few studies investigate the semi-rigid behavior of the RHS (SHS) T-joints under IPBM, and few examine the influence of joint stiffness on the overall behavior of tubular structures, such as lateral displacement and the overall stability capacity. In addition, a steel structure elevator has the characteristics of light weight and weak lateral stiffness, which may cause excessive lateral deformation under lateral wind load.
Based on an engineering example of a steel frame elevator with SHS members, this article will study the stiffness of the tubular beam-column joints (SHS T-joints). A semi-rigid model for the T-joints is established by finite element (FE) parametric analysis and regression fitting technique. Then, the semi-rigid model is implanted into the elevator structure to investigate the influence of semi-rigid joints on the wind resistance of the elevator structure. The research results can help engineers understand the performance of elevators with steel tube frame structures and semi-rigid joints.
2 Semi-rigid model for the SHS T-joints (beam-column joints) of the elevator
2.1 Finite element (FE) models
FE parametric analysis is carried out to investigate the in-plane moment-rotation (Mi-ψi) response of SHS T-joints (i.e., the beam-column joints of the elevators). The FE technique used is the same as the author’s previous FE technique verified by the RHS joint specimens (Zhao et al., 2023); that is, a shell element S4R (ABAQUS analysis user’s manual, 2012) is adopted in the FE model, and finer meshes with the size of the chord thickness are employed for the braces and chords in the joint-zone region. Both geometric nonlinearity and material nonlinearity are modeled in the FE model, where the former is accounted for using the NLGEOM option, and the latter is modeled using a metal plasticity model with von Mises yield criterion and bilinear hardening (the tangent modulus is taken as 1% of the elastic modulus). As for boundary condition and loading, the two ends of the chord are fixed, and a displacement load is applied to the brace end to simulate IPBM loading on the T-joints. The chord length (lc) and brace length (lb) should be long enough to eliminate the influence of end constraints on the joint zone. According to Lesani et al. (2014), Ma et al. (2014), and sensitivity analysis results, lc adopts 10 times the chord section height (h0), and lb adopts six times the brace section depth (h1). In addition, the welds near the brace/chord intersection are not simulated in FE models because the beneficial effects of weld geometry are counterbalanced by the adverse effects of weld residual stresses, and it is challenging to exactly determine the weld residual stresses. The FE model and the geometric parameters of typical SHS T-joints are shown in Figure 2, where the section width (b0 or b1) is equal to the section depth (h0 or h1).
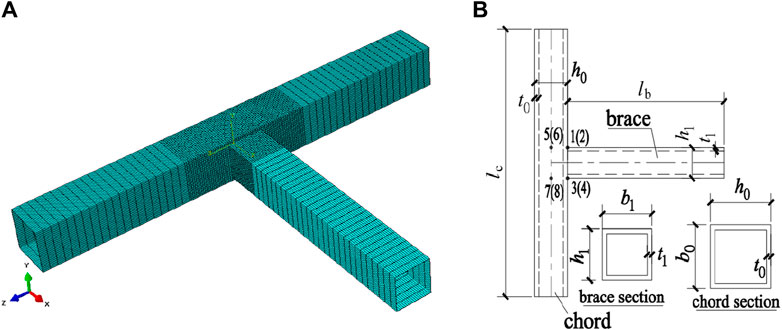
Figure 2. Representative finite element model of SHS T-joints. (A) FE model with the mesh of the T-joints and (B) geometric parameters of the T-joints.
The moment-rotation (Mi-ψi) curve of the FE results of one typical SHS T-joint is shown as a thick red curve in Figure 3. In Figure 3, the ordinate is the in-plane bending moment (Mi), which is taken as the moment at the brace/chord intersection; the abscissa is the rotation (ψi) caused by local deformation of the chord wall, defined as ψi = {(δ1 + δ2 − δ5 − δ6)/2 − (δ3 + δ4 − δ7 − δ8)/2}/(h1 − t1). Here, δ1 through δ8 are the displacements of the points 1–8 in the joint zone (as shown in Figure 2B), which is perpendicular to the chord axis, and negative displacement is defined when δi (i = 1–8) is far away from the brace end; otherwise, it is positive displacement. According to the feature of the thick red curve, a four-parameter exponential model (Yee and Melcher, 1986) can be utilized to reflect the moment-rotation (Mi-ψi) response of the SHS T-joints. The four-parameter model was first proposed by Yee and Melcher (1986) and was used to simulate the semi-rigid connection behavior (i.e., the moment-rotation response) of the beam-column bolted joints of the steel frame. The author also used this model to simulate the moment-rotation (load-local deformation) response of the circular hollow section (CHS) joints (Zhao et al., 2019c; Zhao et al., 2021). This model has the advantages of simple and clear physical meaning for the parameters, and the expression is as follows:
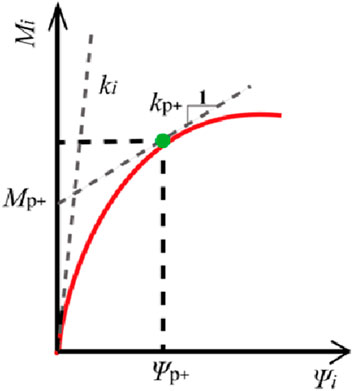
Figure 3. Moment-rotation curve of a typical SHS T-joint and the parameters of the four-parameter connection model (Ma et al., 2014).
In Equation 1, the four parameters ki, Mp, kp, and C are initial flexure stiffness, intercept moment, tangent stiffness, and curve shape coefficient, respectively; their significance is shown in Figure 3. Mp and kp are determined as the intercept and slope of the tangent line on the curve through the rotation ψp and correspond to the chord wall deformation of 0.03b0 (b0 is the chord width). Here, 0.03b0 is the deformation criterion proposed by Lu et al. (1994), who believed that the tubular joints failed when the chord wall deformation reached 0.03b0. When the joints fail, the rotation ψp tends to infinity, and Mp and kp are defined as the intercept and slope when the rotation tends to infinity, which corresponds to the meaning of these two parameters in Equation 1.
2.2 Establishing a semi-rigid model of SHS T-joints
The moment-rotation (Mi-ψi) curves of SHS T-joints are acquired by FE results, and multiple data about ki, Mp, and kp are obtained according to the method given in Figure 3. Then, single parametric analyses are performed to investigate the influence of each parameter (e.g., β) of the T-joints on every parameter (e.g., the initial stiffness ki) of the semi-rigid model. Proper fitting functions can be decided based on the results shown in Figures 4–8. In these figures, the dimensionless geometric parameters of β, γ, and τ are the brace-to-chord width ratio, the half chord width-to-thickness ratio, and the brace-to-chord thickness ratio, respectively; t0 and fy are the thickness and yield strength of the chord. The following conclusions can be drawn from Figures 4–8.
a. The results of the single parametric analysis of the five FE data with t0 = 8 mm, γ = 11.25, τ = 0.75, fy = 350 N/mm2, and β ranging from 0.4 to 0.83 are shown in Figure 4. It can be inferred that β has a significant influence on the flexural stiffness (ki and kp) and intercept moment (Mp), and the three parameters (ki, kp, and Mp) increase rapidly with the increase in β. An exponential function or power function can fit the ki-β curves, the kp-β curves, and the Mp-β curves well.
b. Five FE data points were analyzed with β = 0.83, b0 (chord width) = 180 mm, τ = 0.75, fy = 350 N/mm2, and γ ranging from 5 to 18, as shown in Figure 5. The three parameters (ki, kp, and Mp) decrease rapidly with the increase of γ, and the relationship between each parameter and γ can be approximated as a power function.
c. Five FE data points were analyzed with β = 0.83, t0 = 8 mm, γ = 11.25, fy = 350 N/mm2, and τ ranging from 0.4 to 1.0, as shown in Figure 6. Figure 6 demonstrates that τ has little influence on the three parameters (ki, kp, and Mp), and a linear function can be utilized to express the relationship between τ and each parameter.
d. Five FE data points were analyzed with β = 0.83, γ = 7.5, τ = 0.75, fy = 350 N/mm2, and t0 ranging from 4 mm to 20 mm, as shown in Figure 7. It can be found that the stiffness values (ki and kp) are proportional to the cube of chord thickness, and the intercept moment (Mp) is proportional to the square of chord thickness.
e. Five FE data points were analyzed with β = 0.83, γ = 7.5, τ = 0.75, b0 = 180 mm, and fy ranging from 200 N/mm2 to 390 N/mm2, as shown in Figure 8. It can be found that fy has little effect on the two stiffness values (ki and kp), and Mp is almost proportional to fy.
Based on the results of a single parametric analysis and after many attempts, the three parameters (ki, kp, and Mp) in the semi-rigid models for SHS T-joints under in-plane bending can be expressed as follows:
where E is the elastic modulus; c1 to c16 are the constant coefficients, which are determined by the regression analysis results of 195 data elements for (each of the three parameters ki and kp, and Mp has 65 data elements). These data are obtained from the FE results of 65 SHS T-joints, where the parameters of the T-joints are as follows: β = 0.4, 0.5, 0.7, and 0.85; γ = 7.5, 10, 15, and 18; τ = 0.4, 0.7, and 1.0; fy = 200 N/mm2; 345 N/mm2; and t0 = 6 mm, 10 mm, and 12 mm. As a result, the equations for the three parameters are as follows:
In addition, for the fourth parameter of the semi-rigid model (i.e., the curve shape coefficient C), the prediction result of the semi-rigid model is closer to that of the FE result when C is 500–2500. Therefore, C adopts 1500.
Nine FE models of SHS T-joints, from three-factor, three-level orthogonal design, are used to evaluate the semi-rigid model of SHS T-joints. In addition, the values of β, γ, and τ of the nine FE models are listed in Table 1, and the other parameters of the nine models are b0 = 180 mm, fy = 345 MPa, and E = 206 GPa, respectively. Figure 9 compares the FE results and the semi-rigid model predicting results. It can be found that the semi-rigid model is in good agreement with the FE results.
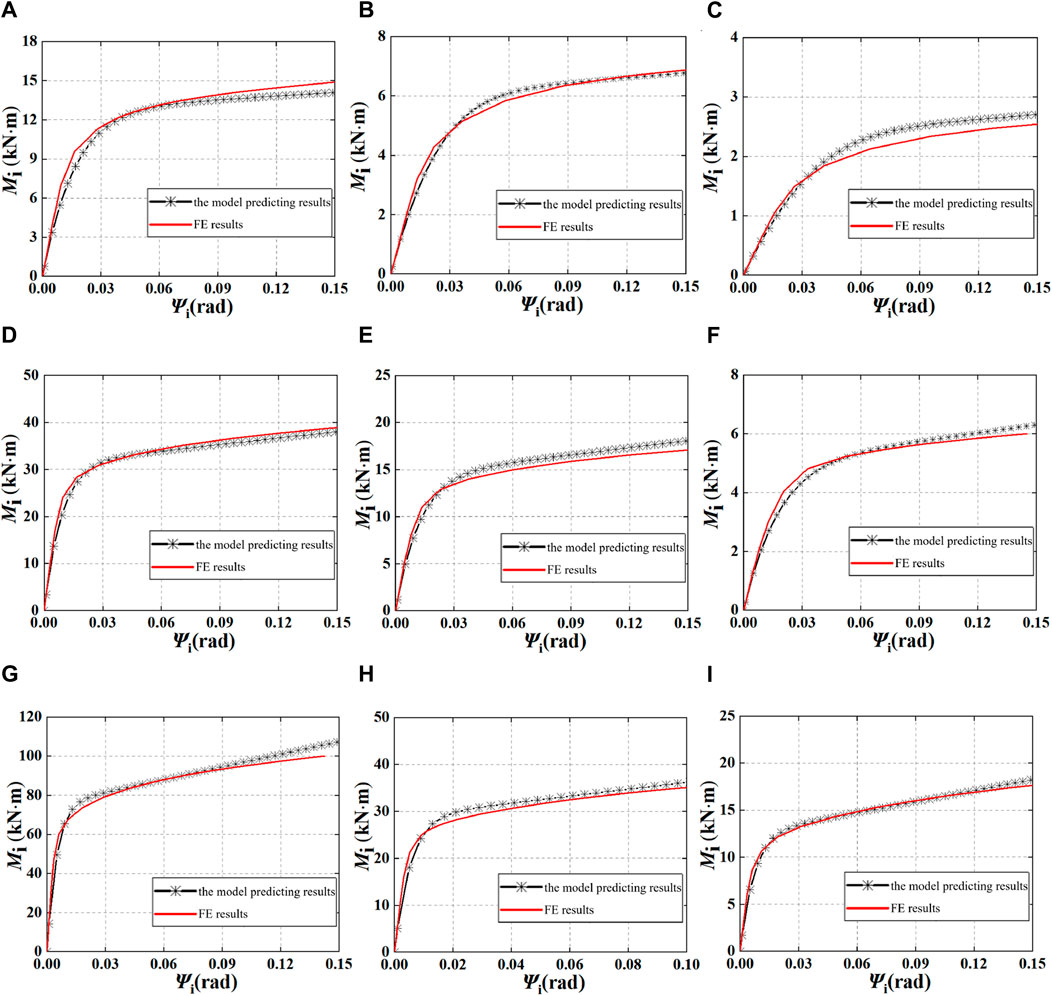
Figure 9. Comparison of FE results and semi-rigid model prediction results. (A) Comparison of FE1, (B) comparison of FE2, (C) comparison of FE3, (D) comparison of FE4, (E) comparison of FE5, (F) comparison of FE6, (G) comparison of FE7, (H) comparison of FE8, and (I) comparison of FE9.
3 Wind resistance of elevator structures
3.1 Examples of steel frame elevator structures
The influence of the semi-rigid joint effect on the seismic behavior of the steel elevator is studied using a steel elevator in an engineering application as an example. The general situation of the elevator project is as follows. The example is an elevator in a city with a 7° seismic fortification zone, the design earthquake group is I, the site category is class III, the basic wind pressure is 0.55 kN/m2, and the ground roughness is Class B. The steel elevator is located at the outside wall and near the stairwell of an existing building with seven floors, and there is a corridor platform between the steel elevator and the existing building. The height of the first floor of the elevator is 2.0 m, the heights of the second floor to the seventh floor are 2.8 m, and the height of the top floor is 1.8 m. Each floor of the elevator is connected to the existing building by two H-steel platform beams with a span of 1.2 m. The steel grade of the elevator is Q235 (nominal yield strength is 235 N/mm2). The columns and beams of the elevator adopt SHS members, with cross-section sizes of 180 × 8 mm2 and 150 × 6 mm2, respectively, and SHS beams are directly welded to SHS columns; that is, the beam-column joints are unstiffened tubular joints. The platform beam adopts an H-steel beam with a cross-section size of 194 × 150 × 6 × 9 mm4. The plane dimensions of the steel elevator and the position relationship between the elevator and the existing building are shown in Figure 10. In addition, the elevator structure is manufactured by the factory and transported to the site for installation.
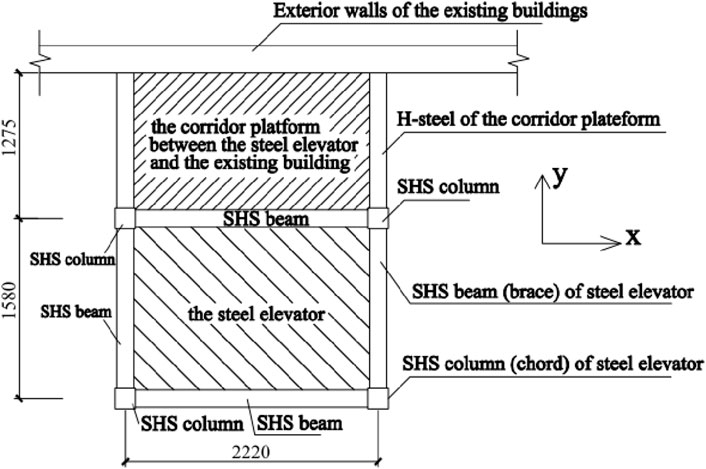
Figure 10. The plane sketch of a steel elevator with SHS beams and columns and the existing building.
3.2 Influence of semi-rigid joints on the vibration period of a steel elevator
To investigate the effect of semi-rigid joints on the vibration period of the whole steel elevator with SHS members, three FE models of the elevators with different joint types (rigid and semi-rigid) were established by the software Midas-Gen and ABAQUS. Here, the first model, FE-model 1, is established by ABAQUS with shell element S4R, and the shell element can simulate the semi-rigid joint effect. The second model, FE-model 2, is established by Midas-Gen with beam-column elements (for beams and columns) and rigid joints. The third model, FE-model 3, is established by Midas-Gen with beam-column elements and semi-rigid joints, where each beam-column joint is simulated by a flexural spring (used to connect beam and column) with the moment-rotation (Mi-ψi) response expressed by Equation 1. In addition, according to Equation 5, the initial flexural stiffness (ki) of the beam-column joint of the steel elevator is 7880 kN m/rad, which is smaller than 25 times the beamline stiffness (25EIb/lb) but larger than five times the stiffness (5EIb/lb). Here, EIb/lb (equal to 1110.3 kN m/rad) is the linear stiffness of the beam in the X-direction (see Fig. 10). This indicates that the beam-column joint is a typical semi-rigid joint defined by the EC 3 code (Design of Steel Structures, 1993). In addition, the boundary conditions of all FE models are the same, that is, the four-column feet fixed constraints.
The first six natural vibration periods (T1 to T6) of the three FE models (FE-model 1, FE-model 2, and FE-model 3) of the elevator are obtained after calculation and listed in Table 2. Table 2 shows that the period results of FE-model 1 (the refined FE model of the elevator with semi-rigid joints) are very close to those of FE-model 3 (the simplified FE model of the elevator with semi-rigid joints), but the results of both FE-model 1 and FE-model 3 are obviously larger than those of the FE-model 2 (with rigid joints). This indicates that the semi-rigid joint effect will remarkably increase the natural vibration period of the steel frame elevator structures, and the simplified FE model (i.e., FE-model 3) can accurately reflect the influence of the semi-rigid joint effect on the overall structural performance of the elevator. Therefore, the simplified FE model can be used for the subsequent investigation on the behavior of steel elevators with semi-rigid joints.

Table 2. Influence of the semi-rigid joint effect on the vibration period of a steel elevator structure (unit: S).
3.3 Influence of semi-rigid joints on the static wind-resistance behavior of a steel elevator structure
To investigate the effect of semi-rigid joints on the static wind-resistance performance of the elevator, static wind loads in the X-direction (see Figure 10) are applied to the elevator structures with rigid beam-column joints (FE-model 2) and semi-rigid beam-column joints (FE-model 3), respectively. Here, the wind load is determined according to the basic wind pressure, ground roughness class, and so on, as shown in Section 3.1. It should be noted that the lateral stiffness of the elevator structure in the X-direction is smaller than that in the Y-direction (see Figure 10), and the wind load in the Y-direction is mainly resisted by the existing buildings. Therefore, only the wind load in the X-direction is applied to investigate the effect of semi-rigid joints on the behavior of the elevator structure under a static wind load. As a result, the top displacement and maximum story drift of the elevator with rigid joints (i.e., FE-model 2) are 63.4 mm and 1/252, respectively, while those of the elevator with semi-rigid joints (i.e., FE-model 3) are 93.2 mm and 1/171 respectively. The displacement (story drift) of FE-model 3 is 48% (47%) larger than that of FE-model 2. This indicates that semi-rigid joints remarkably increase the lateral deformation of the elevator structure. In particular, the story drift of the elevator with semi-rigid joints exceeds 1/250, which is the maximum value specified in Chinese code GB 50017-2017 (GB 50017-2017, 2017). Two methods can decrease the story drift of the elevator: the first method is to add the stiffeners at the beam-column joints, which make the joints close to rigid joints; the second method is to increase the joint stiffness and the structural lateral stiffness by increasing the wall thickness (t0) of the SHS column. If t0 increased from 8 mm to 14 mm, the story drift of the FE-model 3 decreased from 1/171 to 1/251.
3.4 Influence of semi-rigid joints on the wind-vibration response of an elevator structure
Wind speed can be divided into the speed of the average wind and that of the fluctuating wind. The effect of average wind on structures is similar to a static load, while the effect of fluctuating wind on structures is a dynamic load. Due to the characteristics of a high aspect ratio, weak lateral stiffness, and light weight, it is necessary to study the wind-vibration performance of the elevator structure and then investigate the influence of joint stiffness on the wind-vibration response of the elevator.
First, the AR model (Li and Dong, 2001) (a numerical simulation method) is used to simulate the time-history of a fluctuating wind load, and the reliability of the simulation results is verified. The code for simulating the time-history of fluctuating wind speed is proposed based on the basic steps and basic formulas of the AR model proposed by Li and Dong (2001) and Shu and Zhou (2003), and the simulated speed-time curves of fluctuating wind at different heights are shown in Figure 11. Here, the relevant parameters used in the speed-time curves are as follows: the basic wind speed at a height of 10 m is 29.66 m/s, the ground roughness index is 0.15, the autoregressive order is 4, and the fluctuating wind speed spectrum adopts the Kaimal spectrum (Li and Dong, 2001; Shu and Zhou, 2003), in which the wind-vibration response is close to the actual wind-vibration response. In addition, the total duration and step length of the fluctuating wind speed are set to 300 s and 0.1 s, respectively. Figure 11 demonstrates that the wind speed at each height fluctuates steadily in the range of −30 m/s to 30 m/s, and the wind speed changes with time, which is consistent with the random stability characteristics of the fluctuating wind.
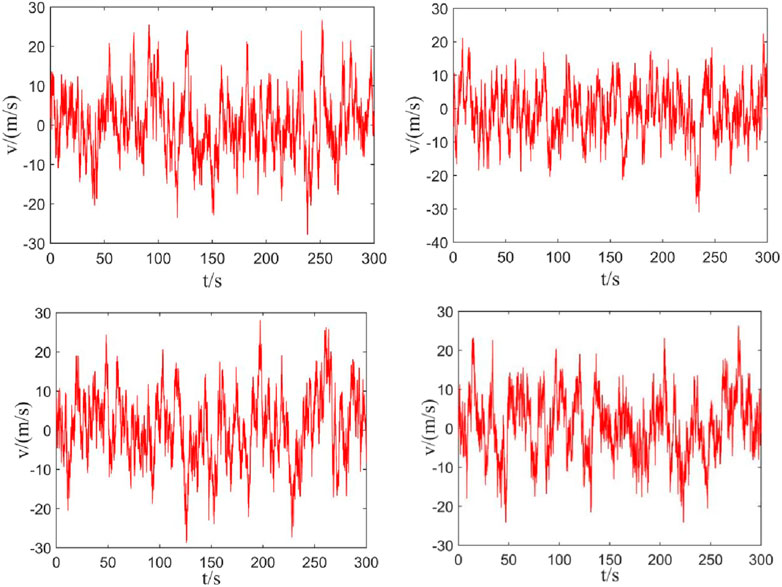
Figure 11. Speed-time curves of the fluctuating wind at different heights (left to right, top to bottom, are 11.7 m, 14.5 m, 17.3 m, and 20.1 m).
Second, the average wind speed (Va(z)) and the fluctuating wind speed (Vf(z, t)) are added to get the total wind speed (Vt (z, t)), and then Vt (z, t) is converted into the total wind load (F (z, t)), expressed as F (z, t) = Asμs{Vt (z, t)}2/1600. The wind load-time curve is obtained where Vf(z, t) is the fluctuating wind speed at a time of t and at a height of z, Va(z) is the average wind speed at a height of z, As is the wind action area at a height of z (unit: m2), and µs is the wind load shape factor.
Finally, the total load (F (z, t)) is applied to the two elevator structures with rigid joints (FE-model 2 in Table 2) and semi-rigid joints (FE-model 3 in Table 2), and the wind-vibration response of the two elevators is analyzed. The top displacement–time (Ud-t) curves of the two elevators are plotted in Figure 12. The top displacement–time curve of the elevator with semi-rigid joints is similar to that of the elevator with rigid joints, but the displacement of the former is significantly larger than that of the latter. The maximum displacement of the elevator with semi-rigid joints is 83.4 mm, and the maximum displacement of the elevator with rigid joints is only 49.1 mm, and the former is 69.8% higher than the latter. This indicates that the semi-rigid joint effect has a great influence on the wind-vibration response of the elevator structure.
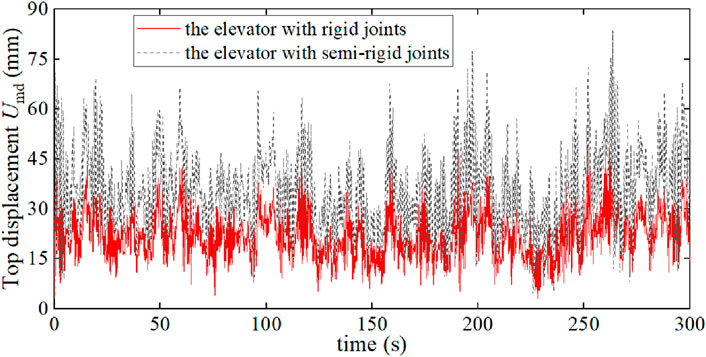
Figure 12. Comparison of the top displacement–time curve of elevators with rigid joints and semi-rigid joints.
Figure 13 shows the maximum story drift (θm) of each floor of the two elevator structures under dynamic wind load. Figure 13 shows that the largest θm of the two elevator structures appears on the 4th floor, and the θm of the elevator with semi-rigid joints is remarkably larger than that of the elevator with rigid joints. In particular, the largest θm of the elevator with semi-rigid joints is 1/173 (0.00578), which is not only larger than that of the elevator with rigid joints (about 1/278) but is also larger than 1/250 (the maximum value specified in the code GB 50017-2017 (GB 50017-2017, 2017))
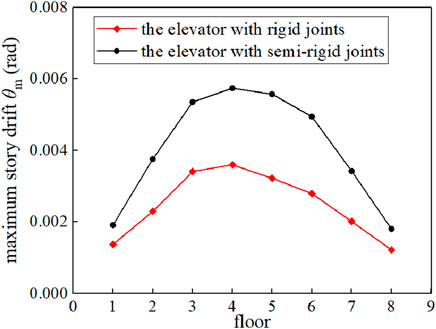
Figure 13. Comparison of the maximum story drift of each floor of an elevator with rigid joints and semi-rigid joints.
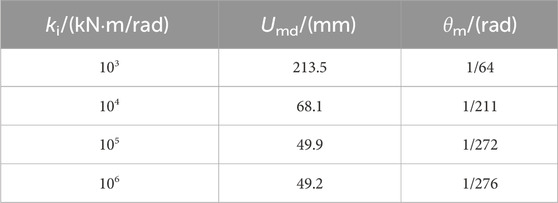
In addition, the influence of joint stiffness on the wind vibration response of the elevator structure is determined. The maximum top displacement (Umd) and the maximum story drift (θm) of the elevators with different joint stiffness (ki) are listed in Table 3. Table 3 shows that when ki increased from 103 kN⋅m/rad to 105 kN⋅m/rad, Umd decreased from 213.5 mm to 49.9 mm, and θm decreased from 1/64 to 1/272. This indicates that joint stiffness has a great influence on the lateral deformation of the whole elevator structure. However, when ki increased from 105 kN⋅m/rad to 106 kN⋅m/rad, both Umd and θm were almost unchanged. The main reason is that the beam-column joint can be taken as a rigid joint when its stiffness (ki) is greater than 25 times the beamline stiffness (i.e., 25EIb/lb = 27758 kN⋅m/rad), so it is difficult to reduce the lateral deformation of the overall elevator structure by increasing the joint stiffness (ki).
4 Effect of semi-rigid joints on the seismic behavior of elevator structures
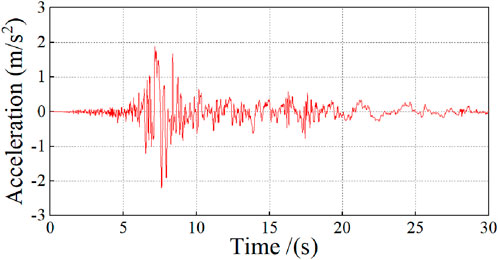
Based on the seismic fortification conditions given in Section 3.1, a natural seismic wave that simulates rare earthquakes (the acceleration–time curve is shown in Figure 14) is applied to the two elevator structures in Table 2 (i.e., FE-model 2 and FE-model 3) to investigate the influence of semi-rigid joints on the seismic behavior of the overall elevator structure, and the results are shown in Figures 15–18.
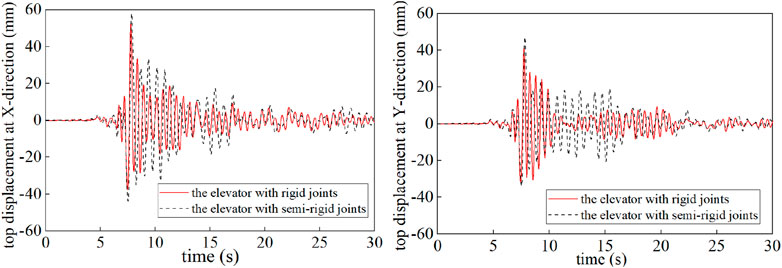
Figure 15. Comparison of top displacement-time curves of the elevators with rigid and semi-rigid joints under the wave of Figure 14.
Figure 15 shows the top displacement–time curves of the elevator structures with rigid joints and semi-rigid joints under the seismic wave of Figure 14. Figure 15 demonstrates that compared with the elevator with rigid joints, the elevator with semi-rigid joints exhibits larger top displacement; the maximum displacements at the X-direction and Y-direction are larger by approximately 12% and 15%.
Figure 16 shows the maximum story drift of each floor of the two elevators under the above seismic wave. The story drift of the elevator with rigid joints is smaller than that of the elevator with semi-rigid joints in both the X-direction and the Y-direction, especially the story drifts of the second through the sixth floors. Moreover, the maximum story drifts in the X-direction and Y-direction of the elevator with semi-rigid joints are 1/250 and 1/316, respectively. This indicates that although the semi-rigid joint effect remarkably increases the story drift of the elevator structures, the drift is still far smaller than the maximum allowable story drift (1/50) under a rare earthquake as specified in Chinese seismic design code GB 50011-2010 (GB 50011-2010, 2011).
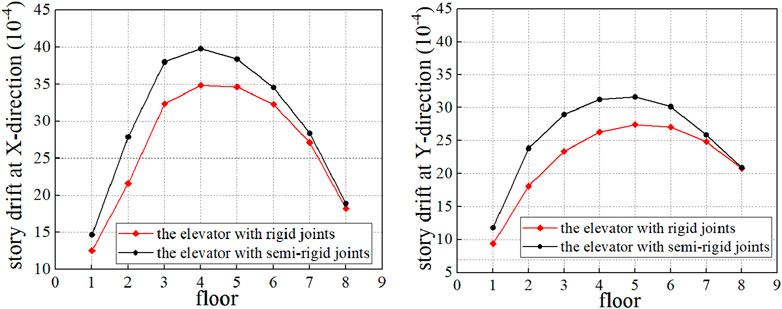
Figure 16. Comparison of the maximum story drift of elevators with rigid and semi-rigid joints under the seismic wave of Figure 14.
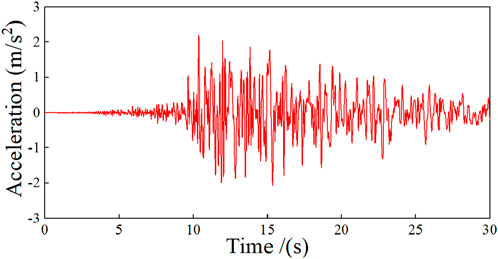
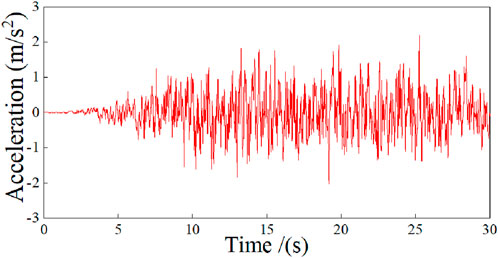
Similarly, another natural seismic wave (see Figure 17) and an artificial seismic wave (see Figure 18) are applied to the two elevators, and then the seismic behavior of the elevators is examined. The top displacement–time curves and the story drift-time curves are shown in Figure 19 and Figure 20, respectively. Figure 19 again demonstrates that the maximum top displacements of the elevator with semi-rigid joints are larger than those of the elevator with rigid joints (e.g., larger by approximately 13% under the wave of Figure 17 and larger by about 30% under the wave of Figure 18). Figure 20 again demonstrates that the floor drift of the elevator with semi-rigid joints is remarkably larger than that of the elevator with rigid joints, but the drift is still far smaller than 1/50.
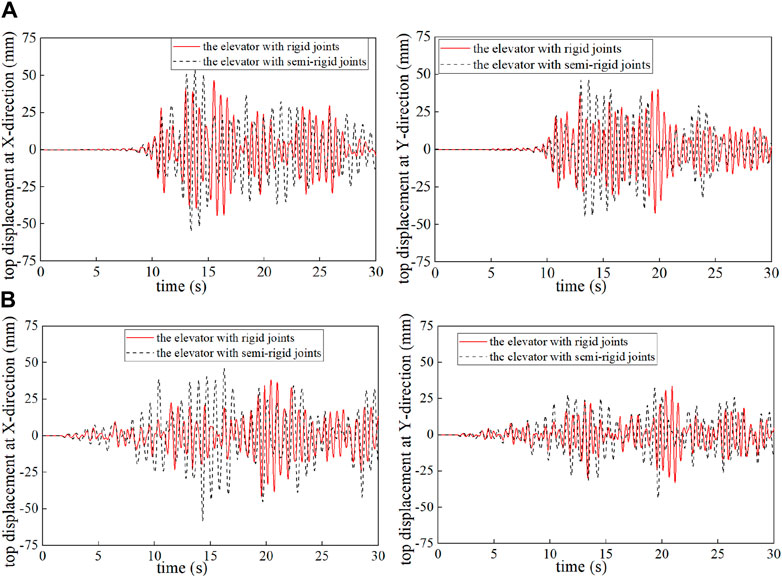
Figure 19. Top displacement–time curves of the two elevators under the seismic waves of Figures 17, 18. (A) Under the seismic wave of Figure 17 and (B) under the seismic wave of Figure 18.
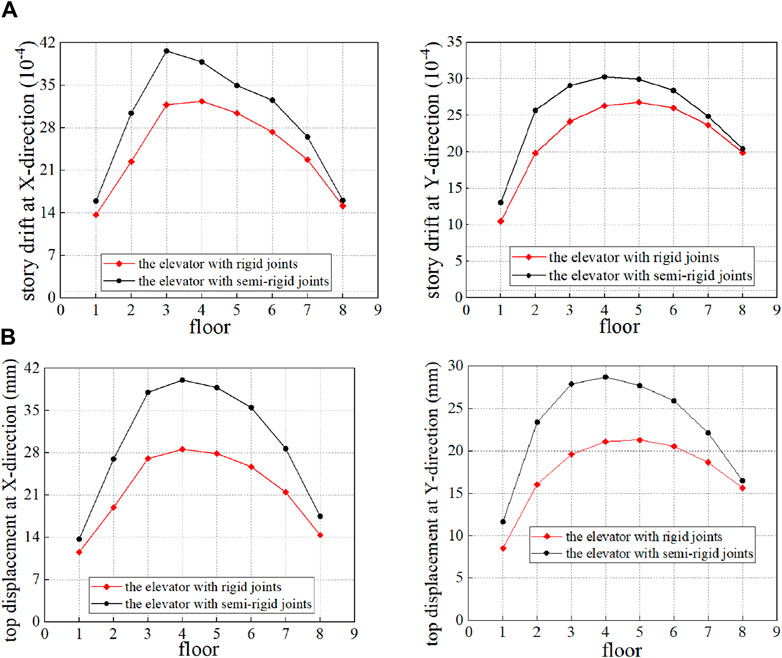
Figure 20. Maximum story drift of the two elevators under the seismic waves of Figures 17, 18. (A) Under the seismic wave of Figure 17 and (B) under the seismic wave of Figure 18.
5 Conclusion
This study investigates the semi-rigid joint performance, seismic behavior, and wind-resistance behavior of the steel frame elevator structures built with SHS members outside the existing building. The main conclusions are as follows.
1. The semi-rigid connection model of the beam-column joints of the elevator structure is established, and the model can predict the moment-rotation response from finite element results well.
2. The influence of the semi-rigid joint effect on the natural vibration period of the elevator cannot be ignored. The period of the elevator structure with semi-rigid joints is 20% higher than that of the elevator structures with ideal rigid joints.
3. The joint semi-rigid effect significantly affects the wind-resistance behavior of the elevator structure. The top displacement and maximum story drift of the elevator structure with semi-rigid joints is 47% higher than that of the elevator structures with ideal rigid joints, and the story drift of the former exceeds the maximum limit specified in the current code.
4. The time-history analysis results under three seismic waves (two natural waves and one artificial wave) show that the semi-rigid joint effect causes the lateral displacement of the elevator to increase by approximately 15%–30%. However, the maximum story drift of the elevator is still far less than the maximum limit of 1/50 stipulated in the seismic code. Hence, an elevator structure with semi-rigid joints also meets the requirements of the seismic design.
The most significant tendency observed in this study is the impact of the semi-rigid joint effect on the seismic behavior and wind resistance of an elevator structure with SHS members. The findings of this study lay the foundation for further research and exploration in several key areas related to tubular structures. This will be particularly useful for understanding the behavior of the tubular structures applied in engineering.
Data availability statement
The original contributions presented in the study are included in the article/Supplementary Material; further inquiries can be directed to the corresponding author.
Author contributions
B-DZ: conceptualization, data curation, formal analysis, funding acquisition, investigation, methodology, project administration, resources, software, supervision, validation, visualization, writing–original draft, and writing–review and editing. C-CX: conceptualization, data curation, formal analysis, funding acquisition, investigation, methodology, project administration, resources, software, supervision, validation, visualization, writing–original draft, and writing–review and editing. H-CZ: conceptualization, formal analysis, funding acquisition, investigation, project administration, resources, software, validation, visualization, writing–review and editing, data curation, methodology, supervision, and writing–original draft. R-SC: conceptualization, data curation, investigation, methodology, project administration, software, supervision, validation, and writing–review and editing. J-LW: conceptualization, data curation, formal analysis, investigation, methodology, project administration, resources, software, supervision, validation, visualization, writing–original draft, and writing–review and editing. Y-SQ: conceptualization, data curation, methodology, resources, software, validation, visualization, writing–original draft, and writing–review and editing. Z-FJ: conceptualization, data curation, formal analysis, funding acquisition, investigation, methodology, project administration, resources, software, supervision, validation, visualization, writing–original draft, and writing–review and editing.
Funding
The author(s) declare that financial support was received for the research, authorship, and/or publication of this article. This search was supported by the Natural Science Foundation of Zhejiang Province (No. LY20E080020). This research was also supported by the Engineering Research Center of the Ministry of Education for Renewable Energy Infrastructure Construction Technology.
Conflict of interest
Authors H-CZ and Z-FJ were employed by The Architectural Design and Research Institute of Zhejiang University Co., Ltd.
Author R-SC was employed by Zhejiang Design Group Co.
The remaining authors declare that the research was conducted in the absence of any commercial or financial relationships that could be construed as a potential conflict of interest.
Publisher’s note
All claims expressed in this article are solely those of the authors and do not necessarily represent those of their affiliated organizations, or those of the publisher, the editors, and the reviewers. Any product that may be evaluated in this article, or claim that may be made by its manufacturer, is not guaranteed or endorsed by the publisher.
References
Chang, H. F., Zuo, W. K., Yang, J. C., Song, X., and Huang, Y. (2020). Compressive strength of collar plate reinforced SHS T-joints: effect of geometrical parameters and chord stress ratio. J. Constr. Steel Res. 174, 106278. doi:10.1016/j.jcsr.2020.106278
Chen, J. Y. (2018). Research on optimal design of the existing building external put up steel structure elevator. Mianyang, Sichuang: Southwest university of science and technology. (In Chinese).
Cheng, X., Li, Y., An, Y., Liu, J., Zhang, R., and Liao, F. (2024). Experimental and numerical investigations of seismic performance of stepped beam-column joints with different connection forms. J. Build. Eng. 91, 109543. doi:10.1016/j.jobe.2024.109543
Design of Steel Structures (1993). Eurocode 3: design of steel structures. Part I: general rules and rules for buildings. Brussels, Belgium: European Committee for Standardization.
GB 50011-2010 (2011). Code for seismic design of buildings. Beijing: China Architecture Industry Press. (in Chinese).
GB 50017-2017 (2017). Standard for design of steel structures. Beijing: China Architecture Industry Press. (in Chinese).
Han, Q. X., Ke, S., and Cui, X. L. (2013). Public opinion survey and policy suggestions on adding elevators to old buildings-Empirical Study from Guangzhou. Adv. Mater. Res. 726, 4954–4958. doi:10.4028/www.scientific.net/amr.726-731.4954
Iskander, M. S., Shaat, A. A., Sayed-Ahmed, E. Y., and Soliman, E. A. (2017). Strengthening CHS T-joints subjected to brace axial compression using through-bolts. J. Constr. Steel Res. 128, 555–566. doi:10.1016/j.jcsr.2016.09.019
Jiang, L., Li, X. M., Jiang, L. X., Zhang, F. W., and Zheng, S. J. (2021). Shaking table tests on existing multi-story masonry residence with integrated technology of elevator retrofitting and seismic strengthening. J. Build. Struct. 42 (7), 20–29. (In Chinese). doi:10.14006/j.jzjgxb.2019.0191
Lesani, M., Bahaari, M. R., and Shokrieh, M. M. (2014). Experimental investigation of FRP-strengthened tubular T-joints under axial compressive loads. Constr. Build. Mater. 53 (2), 243–252. doi:10.1016/j.conbuildmat.2013.11.097
Li, Y., Cheng, X., An, Y., and Zhang, R. (2024). Experimental study on the seismic behavior of an innovative stepped beam-column joint. J. Constr. Steel Res. 214, 108480. doi:10.1016/j.jcsr.2024.108480
Li, Y. Q., and Dong, S. L. (2001). Random wind load simulation and computer program for large-span spatial structures. Spat. Struct. 7 (3), 3–11. (in Chinese).
Lu, L. H., Winkel, G. D., Yu, Y., and Wardenier, J. (1994). Deformation limit for the ultimate strength of hollow section joints. Tubul. Struct. Part6, 341–355.
Ma, X. X., and Chen, Y. Y. (2014). “New approach for calculating the static strength of CHS-RHS T-joint excluding the effect of chord bending,” in 7th European conference on steel and composite structures. Editors L. Raffaele, and M. M. Federico (Naples), 333–334.
Mashiri, F. R., and Zhao, X. L. (2004). Plastic mechanism analysis of welded thin-walled T-joints made up of circular braces and square chords under in-plane bending. Thin-walled Struct. 42, 759–783. doi:10.1016/j.tws.2003.12.010
Niedostatkiewicz, M., Majewski, T., and Ziółkowski, P. (2019). Design errors of the external lift shaft and their negative impact on the operation of the clinic building. EDP Sci. 284, 02006. doi:10.1051/matecconf/201928402006
Ogawa, H., Yamazaki, S., Kadowaki, K., Kobayashi, K., and Minami, S. (2007). Development of a new elevator addition system for aged residential buildings-Development of the elevator tower system integrated with stairs Part 1. AIJ J. Technol. Des. 13 (26), 715–720. doi:10.3130/aijt.13.715
Shu, X. L., and Zhou, D. (2003). AR model of Wind speed time series and its rapid implementation. Spat. Struct. 9 (4), 27–32. (in Chinese).
Wang, W., and Chen, Y. Y. (2005). Modelling and classification of tubular joint rigidity and its effect on the global response of CHS lattice girders. Struct. Eng. Mech. 21 (6), 677–698. doi:10.12989/sem.2005.21.6.677
Yee, Y. L., and Melcher, R. E. (1986). Moment-rotation curves for bolted connections. J. Struct. Eng. 112 (3), 615–635. doi:10.1061/(asce)0733-9445(1986)112:3(615)
Zhao, B. D., Fang, C., Wei, W., Cai, Y., and Zheng, Y. (2019a). Seismic performance of CHS X-connections under out-of-plane bending. J. Constr. Steel Res. 158, 591–603. doi:10.1016/j.jcsr.2019.04.019
Zhao, B. D., Ke, K., Liu, C. Q., and Hong, L. (2020). Computational model for the flexural capacity and stiffness of eccentric RHS X-connections under brace out-of-plane bending moment. ASCE's J. Struct. Eng. 146 (3), 04019227. doi:10.1061/(asce)st.1943-541x.0002507
Zhao, B. D., Li, F. L., Liu, C. Q., and Zhenzhe, H. (2022). Effect of loading patterns on in-plane flexural hysteretic performance of CHS X-connections. J. Build. Eng. 57, 104839. doi:10.1016/j.jobe.2022.104839
Zhao, B. D., Lin, C. H., Wang, R., and Lin, S. (2023). Seismic performance of rectangular hollow section X-Joints Subjected to in-plane bending moment. Buildings 13 (10), 2503. doi:10.3390/buildings13102503
Zhao, B. D., Liu, C. Q., Wu, H. D., Ge, Y., Yang, J., and Yi, Q. (2019b). Study on out-of-plane flexural stiffness of unstiffened multi-planar CHS X-joints. Eng. Struct. 188, 137–146. doi:10.1016/j.engstruct.2019.03.023
Zhao, B. D., Liu, C. Q., Yan, Z. X., Chen, X., and Cai, Y. (2019c). Semi-rigidity connection model for unstiffened CHS X-type joints subjected out-of-plane bending. Int. J. Steel Struct. 19 (3), 834–849. doi:10.1007/s13296-018-0168-x
Keywords: semi-rigid joints, steel frame elevator, square hollow section beam and square hollow section column, square hollow section T-joints, wind-resistance behavior, seismic behavior
Citation: Zhao B-D, Xu C-C, Zhu H-C, Chen R-S, Wu J-L, Qi Y-S and Jin Z-F (2024) Wind-resistance and seismic behavior of a steel frame elevator with square hollow section members and semi-rigid joints. Front. Built Environ. 10:1463663. doi: 10.3389/fbuil.2024.1463663
Received: 12 July 2024; Accepted: 07 August 2024;
Published: 23 August 2024.
Edited by:
Jiajia Shen, University of Exeter, United KingdomReviewed by:
Chengqing Liu, Southwest Jiaotong University, ChinaXin Cheng, Taiyuan University of Technology, China
Fangfang Liao, Chang’an University, China
Copyright © 2024 Zhao, Xu, Zhu, Chen, Wu, Qi and Jin. This is an open-access article distributed under the terms of the Creative Commons Attribution License (CC BY). The use, distribution or reproduction in other forums is permitted, provided the original author(s) and the copyright owner(s) are credited and that the original publication in this journal is cited, in accordance with accepted academic practice. No use, distribution or reproduction is permitted which does not comply with these terms.
*Correspondence: Hao-Chuan Zhu, emhjQHp1YWRyLmNvbQ==
 Bi-Da Zhao1
 Hao-Chuan Zhu


