 Yangyang Wu1,2†
 Haobiao Wu3,4†
 Siliang Li2
 Liqing Wu1,5Chunzi Guo2,6
 Zhonghua Zhang7
 Ruixue Fan1,4*
 Xiaodong Yang3,8Guanghong Zhou1,4,9
 Jinli Yang3,4Panli Yuan3,4Guangjie Luo1,4*
- 1School of Geography and Resources, Guizhou Education University, Guiyang, China
- 2School of Earth System Science, Tianjin University, Tianjin, China
- 3College of Ecology and Environment, Xinjiang University, Urumqi, China
- 4Guizhou Provincial Key Laboratory of Geographic State Monitoring of Watershed, Guizhou Education University, Guiyang, China
- 5School of Forestry, Guangxi University, Nanning, China
- 6Administration of Ecology and Environment of Haihe River Basin and Beihai Sea Area, Ministry of Ecology and Environment of People’s Republic of China, Tianjin, China
- 7School of Environmental and Life Sciences, Nanning Normal University, Nanning, China
- 8Department of Geography and Spatial Information Techniques, Ningbo University, Ningbo, China
- 9Guizhou River Basin Data and Application Center, China High-resolution Earth Observation System (CHEOS), Guiyang, China
The Chishui River Basin, a vital waterway in Southwest China, has experienced rapid urbanization, leading to significant ecological and environmental changes, among which the urban heat island (UHI) effect is particularly pronounced. The UHI effect not only affects the quality of life for residents but also influences urban energy consumption and climate change, underscoring the need for in-depth study of its spatial distribution and contributing factors. The unique karst topography of the region further complicates UHI research, necessitating an investigation that can inform urban planning and sustainable development strategies. This study leveraged Landsat 8 TIRS satellite remote sensing imagery to examine the land surface temperature (LST) and UHI effect in the Chishui River Basin during the summers of 2016 and 2021. Employing the Mono-window Algorithm (MWA), the research quantitatively inverted the LST and analyzed its spatial distribution and the spatiotemporal characteristics of the surface urban heat island (SUHI) effect. The findings indicated a notable increase in average summer temperatures between the 2 years, with a 1.67°C rise from 2016 to 2021. Despite this increase, there was an observed reduction in the extent of SUHI areas, suggesting potential mitigation efforts. Additionally, the study revealed that karst regions were more susceptible to forming “abnormal” heat islands due to their distinct geomorphological features. The implications of this research are critical for urban development planning and the pursuit of sustainable urbanization in the Chishui River Basin. By understanding the thermal dynamics and their relationship with urbanization and karst landscapes, policymakers and urban planners can devise strategies to minimize the adverse effects of SUHI while promoting ecological balance and environmental health. Future research should extend the temporal analysis, employ higher resolution data, compare findings with other regions, and provide a detailed examination of mitigation efforts to enhance the robustness and applicability of the conclusions, provide stronger scientific evidence for the ecological sustainability of the Chishui River Basin.
1 Introduction
From a global perspective, the accelerated urbanization process has brought numerous ecological and environmental issues, with urban heat island (UHI) effects being particularly prominent (Mannstein, 1987). The UHI not only affects the quality of life for residents but also has profound impacts on urban energy consumption and climate change (Galdies and Lau, 2020; Vujovic et al., 2021). Therefore, studying the spatial distribution characteristics and influencing factors of UHI is of great significance (Rizwan et al., 2008). The Chishui River Basin, an important river in Southwest China, has seen rapid urbanization in recent years. However, its unique karst topography makes UHI research more complex and challenging (Liao et al., 2022). Recently, the severe ecological environmental problems in this area have attracted widespread attention from scholars. They have studied the ecological conditions of the Chishui River Basin from aspects such as ecological environmental quality (Zhou et al., 2023), vegetation cover (Liu et al., 2021), ecosystem services (Luo et al., 2021), and eco-hydrology (Ge et al., 2021), but research on the UHI effect in the Chishui River Basin is relatively limited.
Currently, LST has been widely used in studies such as vegetation monitoring (Masiello et al., 2015), drought assessment (Grazia et al., 2016) and urban climate evaluation (Weng, 2009). Remote sensing technology has been applied in various fields, including ecological protection and climate change (Orusa and Mondino, 2019; Orusa and Borgogno Mondino, 2021; Viani et al., 2024). The methods for assessing UHI effects mainly include ground monitoring and remote sensing technology (Diem et al., 2024). Ground monitoring data is highly accurate but has limited coverage and high costs. In contrast, remote sensing technology has become the primary means for studying UHI due to its wide coverage, timeliness, and relatively low cost (Wang et al., 2024). Various algorithms have been developed to retrieve land surface temperature (LST) from thermal infrared data obtained by different remote sensors, including the radiative transfer equation method (Wan and Dozier, 1996; Sekertekin, 2019), single-channel algorithm (Jiménez-Muñoz et al., 2014), Mono-window Algorithm (Kwarteng and Small, 2010), split-window algorithm (Mostovoy et al., 2006; Xu, 2015), and multi-channel algorithm (Shi et al., 2021). The single-channel algorithm, applicable to all thermal infrared bands, requires fewer parameters and achieves high retrieval accuracy, making it widely used (Wang et al., 2018). The Mono-window Algorithm (MWA), derived from the single-channel algorithm, simplifies parameter requirements and improves retrieval accuracy, especially in karst regions (Wang et al., 2018).
In the Aosta Valley region of northwestern Italy, as well as in many cities in other countries, remote sensing technology has been used to study the UHI effects (Deilami et al., 2018; Orusa and Mondino, 2019; Orusa et al., 2023). These studies show that while there are common factors affecting UHI effects in different regions, such as urban layout, surface materials, and green space coverage (for example, areas with high green space coverage can reduce temperatures through shading and evaporation (Gunawardena et al., 2017; Deilami et al., 2018), the UHI effects are also significantly influenced by the unique geographical and climatic conditions of each region (Liao et al., 2022). By retrieving LST, research has shown that different terrains and land cover types significantly impact UHI (Abdullah and Barua, 2022; Liao et al., 2022). Additionally, mapping UHI is of great significance for promoting ecological sustainability. By analyzing the spatial distribution characteristics of the UHI, urban planners can identify areas most affected by the heat island effect and take measures such as increasing green space coverage and optimizing urban layout to mitigate the heat island effect (Feng et al., 2021). These measures not only help to lower urban temperatures and improve residents’ quality of life but also promote the restoration and protection of ecosystems, enhancing the environmental resilience of cities.
Given this background, the primary objective of this study is to investigate the surface urban heat island (SUHI) within the Chishui River Basin, with a focus on understanding its spatiotemporal dynamics and the influence of karst topography. To achieve this, we select the Chishui River Basin as the study area. Using Landsat 8 TIRS satellite imagery and the MWA, we quantitatively retrieve LST for the summers of 2016 and 2021 to obtain the spatial distribution of LST in the Chishui River Basin and analyze the spatiotemporal distribution characteristics of the SUHI. The main contents of the study include: 1) Retrieval of LST in the Chishui River Basin; 2) Analysis of LST changes between 2016 and 2021; 3) Exploration of the impact of karst topography on the SUHI; 4) Proposing mitigation strategies for the SUHI in the Chishui River Basin. This study aims to provide a scientific basis for urban development planning and ecological protection in the Chishui River Basin, promoting its sustainable development.
2 Materials and methods
2.1 Study area in a semiarid region
The Chishui River Basin (104°09′E to 107°10′E and 26°49′N to 28°54′N), nestled at the confluence of Yunnan, Guizhou, and Sichuan provinces, marks a transitional zone between the Yunnan-Guizhou Plateau and the Sichuan Basin. This expansive basin, which emanates from the Yudong River in Zhenxiong County, Yunnan Province, eventually merges with the Yangtze River at Hejiang County, Sichuan Province. It encompasses an area of 19,100 km2, with a main stream extending 436.5 km and maintaining an average annual discharge of 9,890 m³/s (Huang, 2003). The basin traverses through 13 counties, including regions in Yunnan, Guizhou, and Sichuan provinces as previously described (Liu et al., 2021). The Chishui River Basin boasts a sophisticated network of waterways (Figure 1), including the notable tributaries of the Xishui River, Erdao River, and Tongzi River. It stands out as an ecologically pristine river among the major tributaries of the upper Yangtze River (Xu et al., 2020), historically serving as a vital artery for the circulation of materials across Yunnan, Guizhou, and Sichuan. Notably, it is the sole primary tributary of the Yangtze River in China that lacks a cross-provincial dam power station, thus safeguarding its rich and intricate ecological system (Chen et al., 2022). Climatically, the Chishui River Basin falls within the mid-subtropical to south-subtropical zone, endowed with a warm and humid climate, an extended frost-free period, and plentiful precipitation. The region’s average annual temperature hovers around 16.3°C, with annual rainfall varying between 749 and 1,286 mm, creating an environment conducive to diverse biological activity and ecological processes.
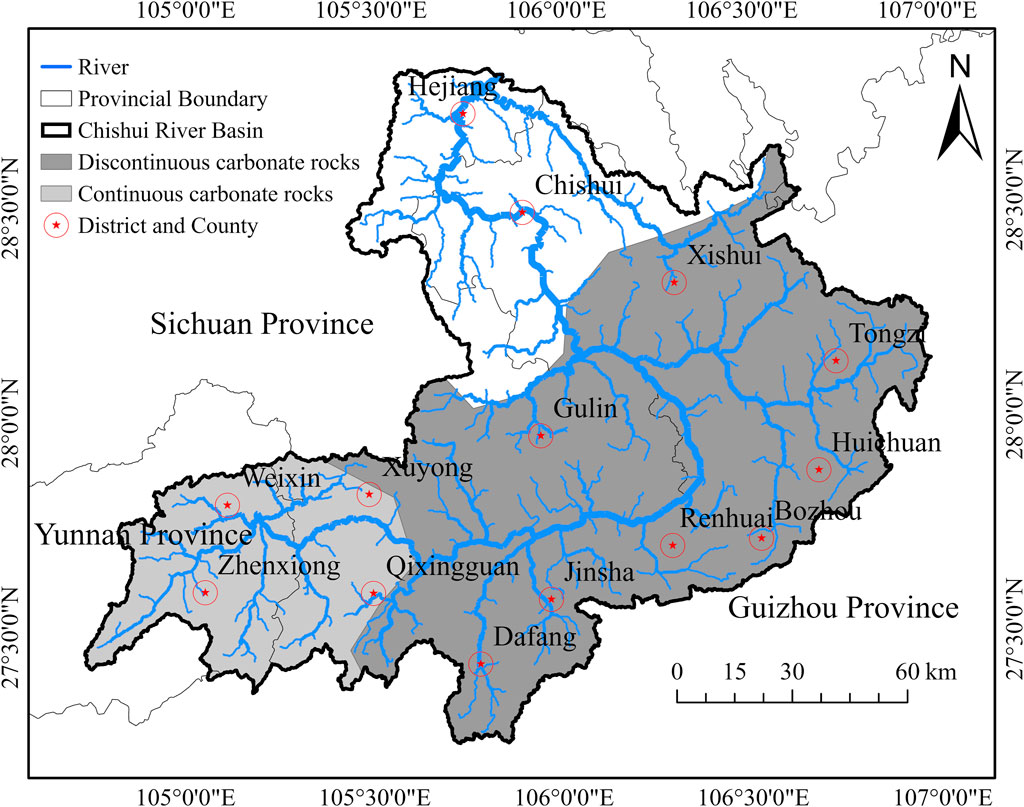
Figure 1. Overview of the Chishui River Basin EPSG:32648.
2.2 Data sources and processing
Satellite Remote Sensing Data: This study utilized two sources of remote sensing data (Table 1), both obtained from the Geospatial Data Cloud platform of the Computer Network Information Center, Chinese Academy of Sciences. The first source is four ASTER satellite GDEMV2 30 m resolution digital elevation data. These data were processed using ArcMap 10.2 software to obtain the Chishui River Basin boundary, providing an accurate study area boundary for subsequent work. The second source is four Landsat 8 remote sensing images from the summers of 2016 and 2021, which fully cover the study area and have relatively low cloud cover (Table 2). Data preprocessing included operations such as radiometric calibration, atmospheric correction, cloud detection, and cloud masking.
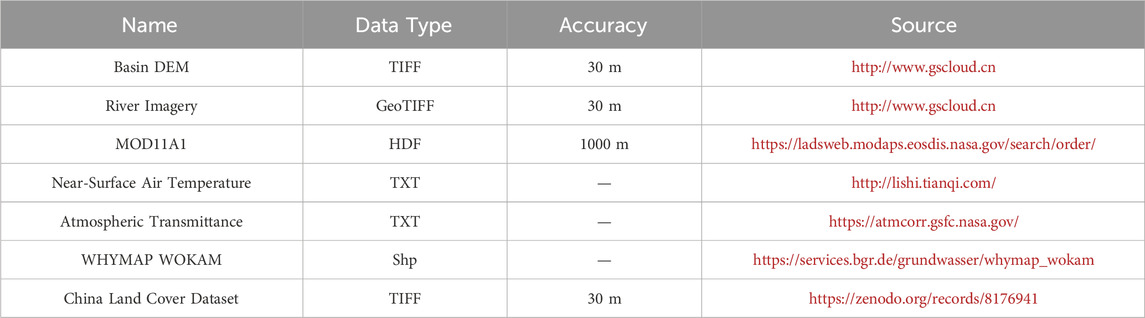
Table 1. Data sources.
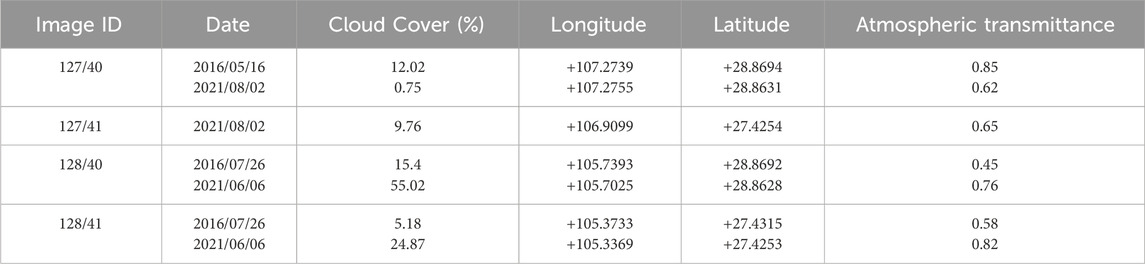
Table 2. Landsat 8 image information.
Temperature Product Data: MOD11A1 LST daily product data, corresponding to the Landsat 8 time in the study area, were obtained from NASA’s official website. With a spatial resolution of 1,000 m, the original images were reprojected to WGS 1984 UTM Zone 48 N using MRT software with the nearest neighbor method and resampled to a 100 m resolution to validate the accuracy of the subsequent LST inversion results.
Meteorological Monitoring Data and Other Information: Meteorological observation data for the summers of 2016 and 2021 were collected from 13 counties: Zhenxiong, Weixin, Xishui, Chishui, Qixingguan, Dafang, Jinsha, Renhuai, Tongzi, Hejiang, Xuyong, Gulin, and Bozhou from http://lishi.tianqi.com/. This data was used as parameters for calculating LST. Atmospheric correction parameters were obtained using the atmospheric correction parameter calculator from NASA’s official website by inputting the basic information of the images to acquire the atmospheric transmittance of each image.
Annual China Land Cover Dataset (Yang and Huang, 2021) and Weltkarte der Karstaquifere (WHYMAP WOKAM) Data: These datasets were used to investigate the reasons for the spatial distribution of the SUHI. This study utilized ENVI 5.3.1 software and ArcMap 10.2 for data processing and mapping. Figure 2 illustrates our technical roadmap, detailing the complete process from data collection and preprocessing to final analysis.
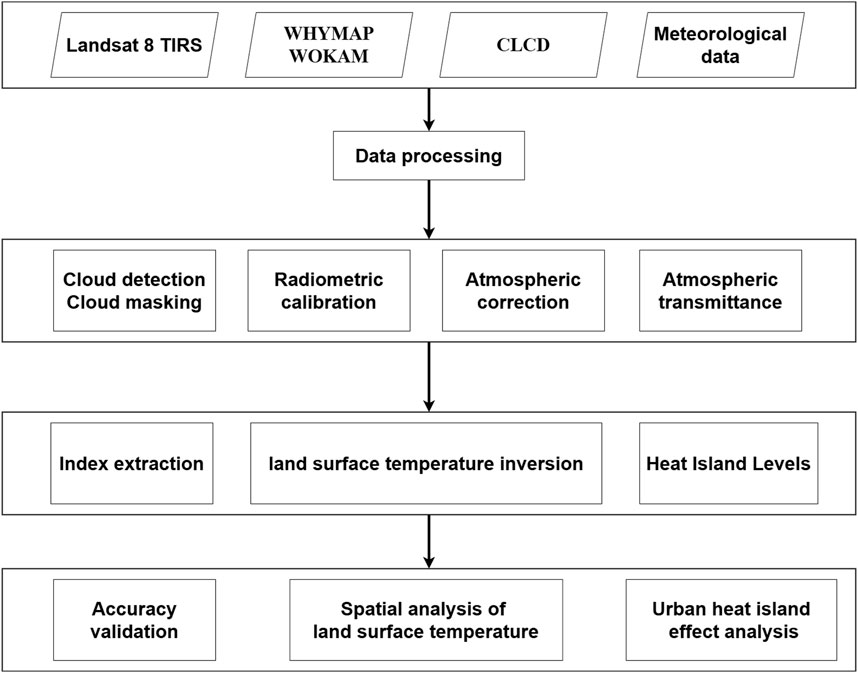
Figure 2. Technical roadmap.
2.3 Research methods
2.3.1 Mono-window Algorithm
The MWA is one of the algorithms for inverting LST. It is designed for TM remote sensing images with only one thermal infrared band (Qin et al., 2001). Compared to other commonly used LST inversion algorithms, the MWA requires fewer parameters and offers higher accuracy, making it more suitable for long-term series data from the Landsat satellite series (Hu et al., 2017). According to previous research, this algorithm is suitable for inverting LST from Landsat 8 TIRS remote sensing images and provides high accuracy (Su and Yu, 2018). The Single Channel Algorithm and MWA are more suitable for inverting LST in southern karst areas of China with high atmospheric water vapor content (Wang et al., 2018). Therefore, this study selects Landsat 8 TIRS Band 10 as the data source and uses the MWA to invert LST. The expression is:
where TS is the LST in Kelvin. When the LST is in the range of 0–70°C, a and b are constants with values
2.3.2 Calculation of relevant parameters
2.3.2.1 Surface emissivity
The emissivity values for typical land cover types of Landsat 8 TIRS Band 10 were obtained from the ASTER Spectral Library (http://speclib.jpl.nasa.gov) (Wang et al., 2018): vegetation
Water bodies:
Mixed pixels composed of buildings and vegetation:
Mixed pixels composed of vegetation and soil:
Mixed pixels composed of karst peaks vegetation and calcium carbonate rocks:
where
where
2.3.2.2 Brightness temperature calculation
where
2.3.2.3 Atmospheric transmittance
Atmospheric transmittance refers to the ratio of the radiance affected by the atmosphere to the radiance before entering the atmosphere. Variables
where
2.3.2.4 Effective mean atmospheric temperature
Empirical formulas were derived based on standard atmospheres proposed by Modtran. These formulas indicate that the effective mean atmospheric temperature
Equation 16 is used for tropical regions, Equation 17 for mid-latitude summers, and Equation 18 for mid-latitude winters. Since the study area is located at latitudes 26°49′N to 28°54′N, Equation 17 is chosen.
2.4 Cloud detection and cloud masking in remote sensing images
Constrained by various climatic and natural geographic conditions, more than half of the Earth’s surface is covered by clouds, with about 55% of land surfaces being cloud-covered (King et al., 2013). Clouds are an inevitable source of noise in remote sensing image data (Cao et al., 2020), and some images are unavoidably affected by cloud contamination, resulting in fewer data directly useable for quantitative parameter inversion (Ju and Roy, 2008). Therefore, cloud detection is an essential step in the analysis of most remote sensing image data, as it helps improve the accuracy of subsequent data inversion. The images passing over the Chishui River Basin are affected by cloud contamination to varying degrees. To improve inversion accuracy, cloud detection and cloud masking are necessary. ENVI 5.3.1 has introduced an automatic cloud detection tool that effectively supports the use of the Landsat satellite series and NPP VIIRS. Figure 3 shows a comparison of one scene’s image before and after cloud detection and masking, demonstrating significant improvements in image clarity and interpretability.
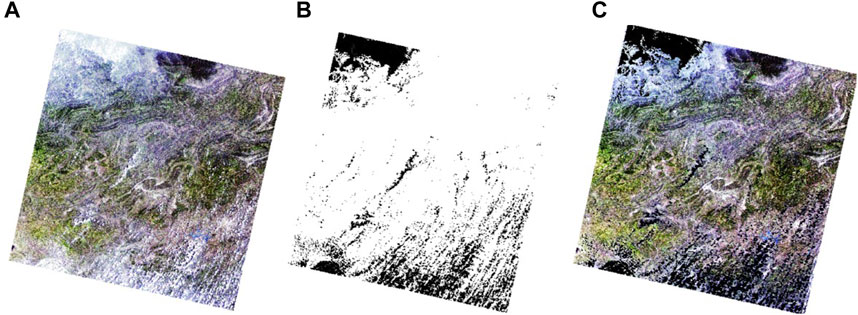
Figure 3. Cloud processing of remote sensing images. (A) Original image (B) cloud detection results (C) cloud masking results EPSG:32648.
2.5 Accuracy verification of inversion results
To verify the reliability of the LST inversion results for the Chishui River Basin using the MWA, it is necessary to validate and compare the inversion results. Previous studies have primarily used meteorological station data or ground monitoring data to validate LST inversion results. However, due to constraints in time and equipment, synchronous ground-measured LST data could not be obtained. Therefore, this study uses MODIS LST products as comparison data for verification. Given that the Landsat 8 imagery acquisition time unit is 1 day, the MOD11A1 data with a daily time resolution were selected. After excluding data with severe cloud contamination, the closest available MODIS data were selected, specifically the daytime LST products from 25 July 2016, 5 June 2021, and 3 August 2021. To facilitate comparison, the MODIS LST data was clipped using the 2021 Landsat LST results to ensure consistent spatial coverage.
2.6 Urban heat island effect evaluation method
The SUHI effect significantly increases urban temperatures, leading to more frequent hot weather in summer. Studying the SUHI effect requires a clear definition of surface heat island levels. The methods for evaluating the SUHI effect are mainly divided into the equal-interval classification method (Zhang et al., 2005) and the mean-standard deviation classification method (Jiang and Xia, 2007). The equal-interval classification method can reflect the spatial distribution of surface temperature to some extent, but it directly classifies the obtained surface temperature or normalized values rigidly, lacking objectivity in the breakpoints and the number of levels. The mean-standard deviation classification method defines heat island levels based on different combinations of the mean and standard deviation of the surface temperature, which can avoid differences brought by different time phases to some extent (Chen and Wang, 2009). Therefore, this study adopts the mean-standard deviation classification method to define the levels of SUHI (Table 3).
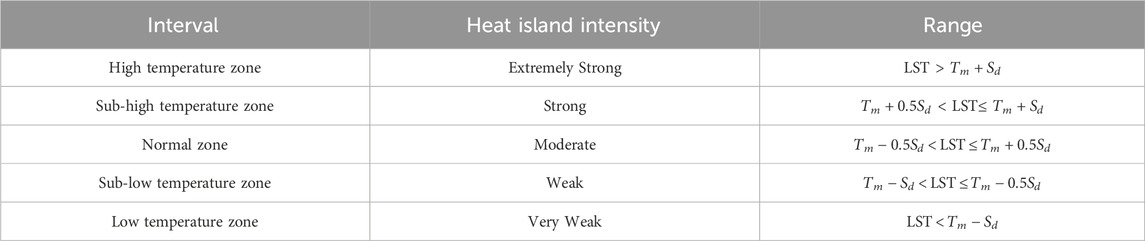
Table 3. Classification of heat island intensity levels based on mean-standard deviation.
where LST is the inverted land surface temperature,
3 Results and discussion
3.1 Land surface temperature inversion results
The LST inversion results for the summers of 2016 and 2021 in the Chishui River Basin (Figure 4). The average LST in the summer of 2016 was approximately 35.74°C, with a maximum temperature of about 60.37°C and a minimum temperature of about 16.72°C. In the summer of 2021, the average LST was about 37.41°C, with a maximum temperature of about 62.69°C and a minimum temperature of about 15.19°C. The images were acquired in Greenwich Mean Time, which translates to around noon Beijing Time. The areas with higher LST are mainly distributed on both sides of the Chishui River Basin, primarily in the built-up areas. Over the five-year period, the average temperature difference is 1.67°C. NoData values represent the empty values after cloud processing.
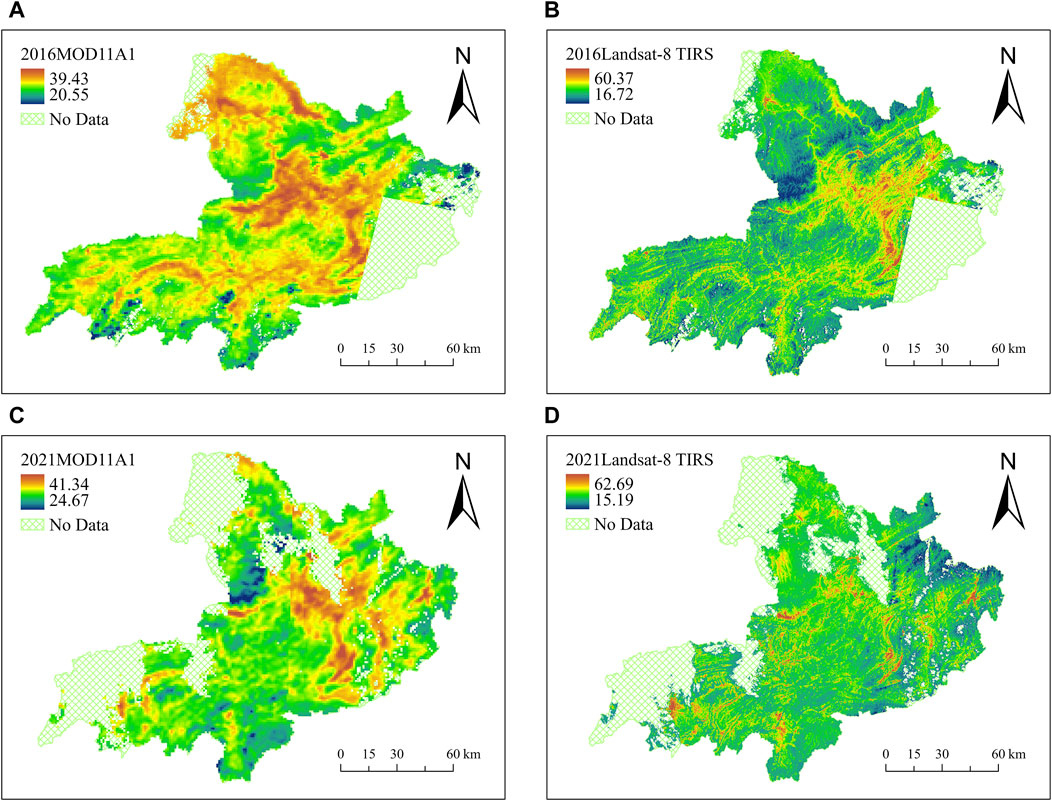
Figure 4. Heat island intensity distribution in the Chishui River Basin. (A) 2016 MOD1A1 temperature data, (B) 2016 Landsat-8 TIRS temperature data, (C) 2021 MOD1A1 temperature data, (D) 2021 Landsat-8 TIRS temperature data. EPSG:32648.
3.2 Accuracy verification of inversion results
To reasonably verify the accuracy of the LST inversion results, the MOD11A1 data were first appropriately clipped before comparison. The average temperature of MOD11A1 in 2016 was approximately 31.70°C, with a maximum temperature of 39.43°C, a minimum temperature of 20.55°C, and a standard deviation of 1.80 (Figure 4). Compared to Landsat 8 in 2016, the average difference was 4.04°C, and the standard deviation difference was 0.51. In 2021, the average temperature of MOD11A1 was approximately 33.12°C, with a maximum temperature of 41.34°C, a minimum temperature of 24.67°C, and a standard deviation of 1.64. Compared to Landsat 8 in 2021, the average difference was 4.29°C, and the standard deviation difference was 0.90. These differences are within a reasonable range, indicating that the error between Landsat 8 TIRS data and MOD11A1 data is small, and the inversion results are reliable. The analysis found that the LST inverted from Landsat 8 is generally higher than that from MOD11A1. However, in water bodies, the MOD11A1 LST is higher than the Landsat 8 inversion results. This discrepancy is due to the low resolution of MODIS, where pixels in narrow river areas cover surrounding regions, often including urban areas on both sides of the river. The Landsat 8 thermal infrared band, with a resolution of 100 m, can better distinguish small plots, effectively inverting LSTs closer to various land types. Overall, the inversion accuracy of Landsat 8 is ideal, with the main differences attributed to the different time phases and image resolutions of the two types of imagery. This indicates that high-resolution data can more precisely capture the subtle variations in LST and SUHI effects (Sobrino et al., 2012). In the future, with the availability and use of higher precision data, the analysis of LST and SUHI will receive more reliable data support (Orusa et al., 2024).
3.3 Spatial distribution and analysis of urban heat island
3.3.1 Analysis of the heat island effect in the Chishui River Basin
After removing cloud contamination, the mean - standard deviation heat island intensity distribution in Figure 5 clearly shows that most of the Chishui River Basin is in the normal temperature zone. The low-temperature zones are mainly located near the basin boundaries with high vegetation cover, while the high-temperature and sub-high-temperature zones are primarily distributed on both sides of the river. The proportion of areas covered by different heat island levels did not change significantly between the 2 years (Figure 6). However, in 2016, the areas with strong heat island intensity were mainly concentrated in the middle and lower reaches of the river. By 2021, the high-temperature and sub-high-temperature zones were more dispersed but still primarily distributed along the various branches of the river.
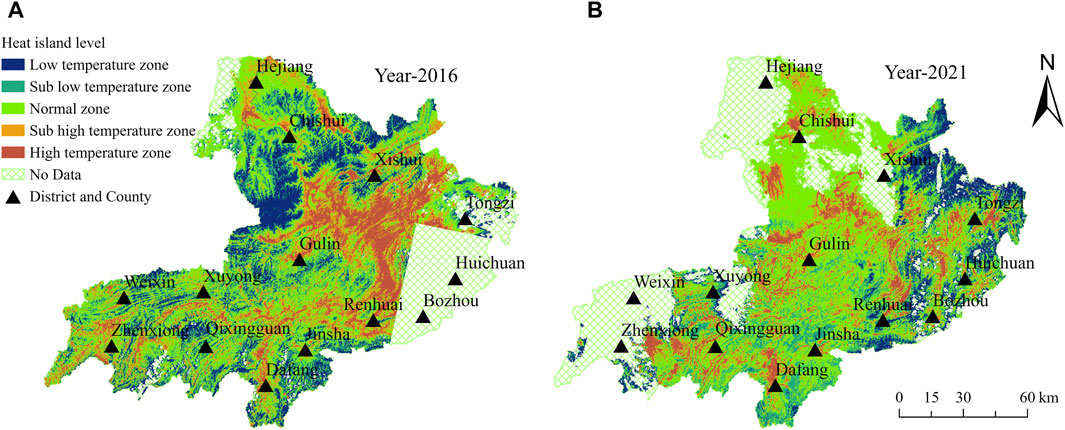
Figure 5. Comparison of land surface temperature inversion results for 2016 (A) and 2021 (B) EPSG:32648.
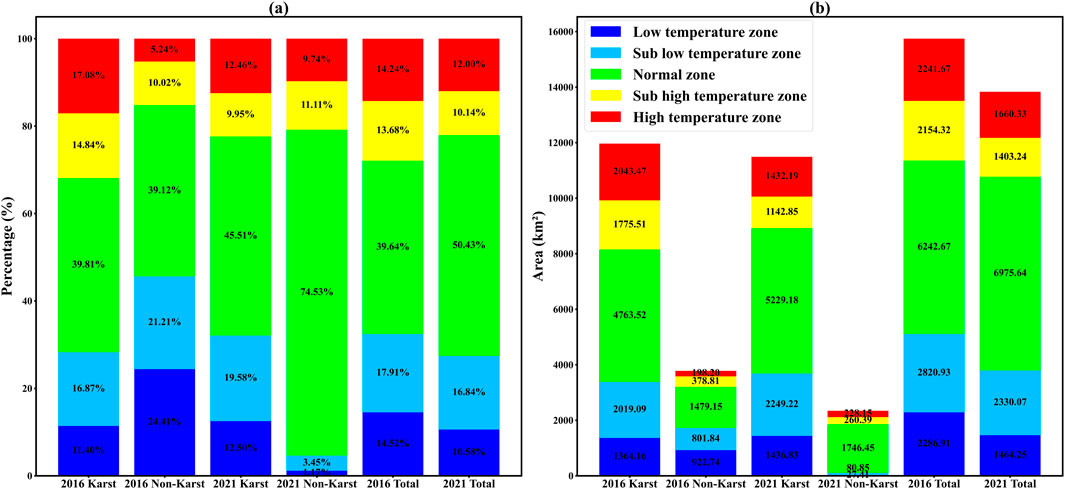
Figure 6. Area proportion of heat island levels in the Chishui River Basin. (A) Percentage of heat island levels in karst and non-karst areas of the Chishui River Basin. (B) Area of heat island levels in karst and non-karst areas of the Chishui River Basin.
The high temperatures generated in urban centers are a concrete manifestation of the SUHI effect. In 2016, the high-temperature zones in the Chishui River Basin were mainly concentrated at the junction of Xishui County, Gulin County, and Huairen County, forming a noticeable temperature difference with the surrounding areas and creating a cross-shaped heat island region. Over the 5 years, with the progress of urbanization, although the area of high-temperature zones decreased in 2021, most areas in the Chishui River Basin showed high and sub-high temperature zones. The distribution of low and sub-low temperature zones also decreased, while the area of normal temperature zones increased. During this period, both the Normalized Difference Vegetation Index (NDVI) and the Remote Sensing Ecological Index (RSEI) in the Chishui River Basin showed a significant upward trend (Zhou et al., 2023). The increase in NDVI reflects the rise in vegetation cover, while the improvement in RSEI comprehensively indicates the enhancement of the regional ecological condition, which may be an important reason for the mitigation of SUHI.
3.3.2 Conventional heat islands
In urban areas, the phenomenon where urban temperatures are higher than those in surrounding areas due to high population density and concentration of factories is known as a conventional heat island. In Figure 5, the regions with high heat island intensity in 2016 were mainly concentrated at the junction of Renhuai County, Xishui County, and Gulin County in the middle and lower reaches of the Chishui River Basin. This area has relatively flat terrain and relies on the production of high-quality liquor as a pillar industry. However, except for major distilleries like Moutai, Xijiu, and Langjiu, other factories are smaller in scale, and their technology and environmental protection facilities are not well-developed, leading to varying degrees of water and air pollution (Li et al., 2021). The sub-low temperature and low-temperature zones are mainly on both sides downstream, where high vegetation cover effectively regulates the SUHI effect. The normal temperature zones are distributed between the sub-low and sub-high temperature zones, forming a buffer zone of temperature differences.
With the joint advancement of urbanization and green development in the Chishui River Basin, by 2021, there were no large contiguous heat island areas compared to 2016 (Table 4). However, high-temperature and sub-high temperature zones showed a clear trend of spreading outward, forming dispersed filamentous shapes. Upstream areas exhibited significant changes in heat island regions, with some low-temperature and sub-low temperature zones gradually transitioning to normal temperature zones (Figure 6).

Table 4. Area distribution of heat island levels.
3.3.3 Abnormal heat islands
Analysis of the comparison results reveals that some suburban areas in the study region exhibit high and sub-high temperature phenomena (Figure 5), despite the absence of concentrated urban areas nearby. The proportion of heat island areas in the Sub-high Temperature Zone and High Temperature Zone in karst regions is higher than in non-karst regions in both 2016 and 2021 (Figure 6). High vegetation cover can effectively mitigate SUHI intensity. The middle and upper reaches of the Chishui River Basin are karst areas (Figure 1), characterized by thin soil layers, surface drought, and susceptibility to soil erosion. Sparse vegetation in karst areas can lead to easier soil erosion and the formation of rocky desertification, resulting in poor natural surface vegetation cover (Liao et al., 2022).
Moreover, the unique thermal properties of karst carbonate rocks are a significant factor in the formation of abnormal heat island effects. Studies have found that karst carbonate rocks (such as limestone and dolomite) have a lower specific heat capacity and higher thermal conductivity, making them more susceptible to heating and cooling under the same conditions compared to concrete and reinforced concrete (Cai et al., 2014; Liao et al., 2022). This characteristic causes surface temperatures in these areas to rise rapidly when exposed to solar radiation, creating localized high-temperature zones. Over the 5 years, with Furthermore, karst areas are prone to soil erosion and rocky desertification, leading to low vegetation cover and sparse natural vegetation, which further enhances the increase in surface temperature. These factors collectively contribute to the prominent presence of abnormal heat island effects in karst regions.
3.4 Factors influencing the heat island effect and mitigation strategies
3.4.1 Influencing factors
The average temperatures of different land use types in 2016 and 2021, from highest to lowest, are as follows: Impervious surfaces > Grassland > Cropland > Shrub > Forest > Water in 2016, and Impervious surfaces > Grassland > Cropland > Shrub > Water > Forest in 2021 (Figure 7). Urban buildings are typically constructed from reinforced concrete, and road surfaces are mainly covered with asphalt, bitumen, and cement, which can absorb a large amount of solar heat. Consequently, they absorb more heat than natural surfaces in suburban areas, creating differences in surface temperatures. During the day, they store more heat and cool down more slowly at night, resulting in higher surface temperatures compared to other areas (Gunawardena et al., 2017). This phenomenon not only affects the quality of life for urban residents but may also increase the use of cooling devices such as air conditioners, further exacerbating energy consumption and the heat island effect (Hwang et al., 2020).
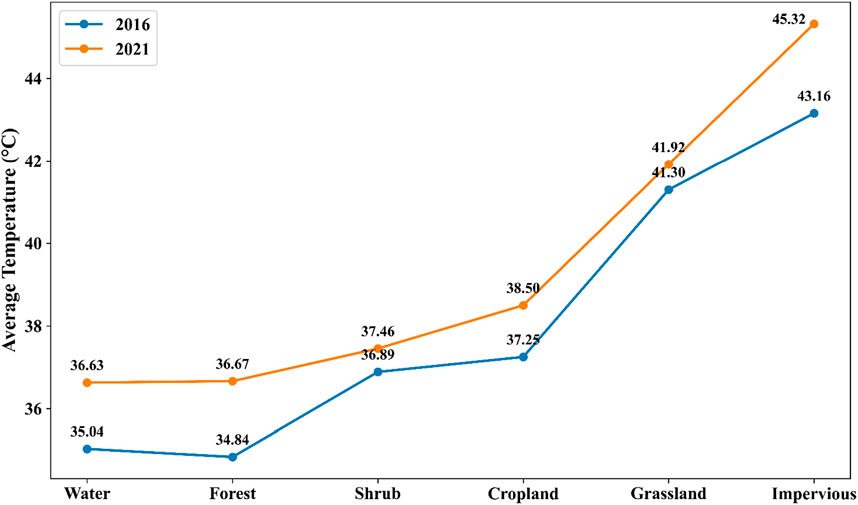
Figure 7. Average temperature by land use type in 2016 and 2021.
In contrast, natural surfaces such as water bodies and forests can effectively alleviate high temperatures due to their higher evapotranspiration and heat dissipation capabilities. This indicates that increasing the coverage of urban green spaces and water bodies is an important measure to mitigate the heat island effect (Gunawardena et al., 2017). By planning more urban parks, green belts, and water bodies, the overall temperature of the city can be significantly reduced, enhancing residents’ comfort and the ecological sustainability of the city. Additionally, improving urban construction materials and structures is also a feasible solution (Wang et al., 2021). For example, using cool materials or reflective materials instead of traditional asphalt and concrete can reduce heat absorption, thereby lowering surface temperatures. At the same time, promoting green building technologies such as green roofs and green walls can also help mitigate the heat island effect (Vujovic et al., 2021; Wang et al., 2021).
Additionally, urban topography is another factor contributing to the heat island effect. The proportion of heat island areas in karst regions is higher than in non-karst areas (Figure 6). Cities in karst regions are often surrounded by mountains, making the underlying surface rougher compared to plains. Due to the undulating terrain, many buildings in mountainous cities are constructed in valleys near rivers (Figure 1), which hinders air exchange and reduces evapotranspiration from vegetation and water bodies. Moreover, karst regions are prone to soil erosion and rocky desertification, resulting in low vegetation cover and poor urban permeability. Reduced evaporation means less heat is carried away, failing to effectively mitigate the heat island effect. These combined factors enhance the intensity of SUHI effects (Liao et al., 2022; Diem et al., 2024).
3.4.2 Mitigation strategies for the heat island effect
From the distribution of heat island intensity in the Chishui River Basin in 2016 and 2021, it can be seen that the total area proportion of high-temperature and sub-high-temperature zones has slightly decreased. In 2021, the Chishui River Basin has not experienced large contiguous UHI areas. As a crucial ecological barrier in the middle and upper reaches of the Yangtze River, protecting the pristine natural environment of the Chishui River Basin requires reasonable urban planning (Yi et al., 2021). Generally, higher building density in urban areas results in poorer air circulation with surrounding regions (Gunawardena et al., 2017). The discharge of waste, wastewater, and residues from production and daily life leads to a deteriorating ecological environment (Arnfield, 2003). Moreover, the fragile ecological environment of karst areas, characterized by soil erosion, alternating drought and floods, and poor soil fertility, exacerbates the heat island intensity.
This study suggests that to mitigate and prevent the SUHI effect in the Chishui River Basin, improvements can be made in the following four areas 1) Increase urban green spaces and vegetation coverage: Expanding parks, green roofs, and urban forests can significantly reduce land surface temperature through shading and evapotranspiration. 2) Use reflective and permeable materials: Implementing cool pavements and reflective roofing materials can reduce heat absorption, thereby lowering surface temperatures. 3) Increase urban water bodies: Creating and maintaining water bodies such as ponds and fountains can provide localized cooling effects, helping to lower surrounding surface temperatures. 4) Protect ecological environment and biodiversity: Rationally plan hydropower construction, appropriately manage rocky desertification, increase watershed water bodies and vegetation coverage, and implement sustainable development strategies.
3.5 Limitations and prospects
Although this study calculated and compared the LST and SUHI effects in the Chishui River Basin for the years 2016 and 2021, there are still some limitations. 1) Temporal Scope: The current research primarily focuses on the data from 2016 to 2021. Future research could extend the temporal analysis by including more years and seasonal data to capture long-term trends and seasonal variations more comprehensively. 2) Remote Sensing Inversion Algorithms and Cloud Coverage Handling: In this study, the single-window algorithm was utilized for remote sensing data inversion to estimate LST, and there was considerable cloud coverage. Future research should consider employing multiple remote sensing inversion algorithms and integrating various remote sensing data for a fusion analysis to enhance the reliability and robustness of the results.
4 Conclusion
With the rapid economic development in China, the urbanization speed in the Chishui River Basin region has gradually accelerated, causing changes in the regional ecological environment. The changes in the thermal environment are particularly significant, having a major impact on the Chishui River Basin. Using Landsat 8 satellite remote sensing images, this study took the Chishui River Basin as an example to conduct spatial analysis of the obtained LST inversion results. It compared the LST changes in the summers of 2016 and 2021 and analyzed the SUHI effect in the Chishui River Basin, leading to the following main findings and conclusions.
(1) The results of the LST inversion based on Qin Zhihao’s MWA effectively reflect the LST in the Chishui River Basin. The inversion accuracy improved after cloud detection and cloud masking to remove cloud-contaminated areas. The average temperature was 35.74°C in 2016, and 37.41°C in 2021, indicating good inversion accuracy and high resolution.
(2) According to the heat island intensity distribution maps for 2016 and 2021, the area proportions of the Sub-high Temperature Zone and High Temperature Zone slightly decreased. The normal temperature zone still occupies most of the Chishui River Basin, but the High Temperature Zone and Sub-high Temperature Zone are spreading outward from concentrated areas.
(3) The study found that there are both conventional heat islands and “abnormal” heat islands in the Chishui River Basin. The composition of the underlying surface influences the distribution of heat islands. Karst topography and geomorphology are prone to forming “abnormal” heat islands.
Data availability statement
The datasets presented in this study can be found in online repositories. The names of the repository/repositories and accession number(s) can be found below: http://lishi.tianqi.com/, http://www.gscloud.cn, https://atmcorr.gsfc.nasa.gov/, https://zenodo.org/records/8176941, https://services.bgr.de/grundwasser/whymap_wokam, https://ladsweb.modaps.eosdis.nasa.gov/search/order/.
Author contributions
YW: Conceptualization, Funding acquisition, Writing–original draft, Writing–review and editing. HW: Software, Visualization, Writing–original draft. SL: Conceptualization, Writing–review and editing. LW: Data curation, Software, Visualization, Writing–review and editing. CG: Formal Analysis, Supervision, Writing–review and editing. ZZ: Data curation, Software, Writing–review and editing. RF: Methodology, Project administration, Writing–review and editing. XY: Data curation, Investigation, Writing–review and editing. GZ: Formal Analysis, Funding acquisition, Investigation, Writing–review and editing. JY: Investigation, Writing–review and editing. PY: Investigation, Writing–review and editing. GL: Methodology, Project administration, Writing–review and editing.
Funding
The author(s) declare that financial support was received for the research, authorship, and/or publication of this article. This research was funded by Guizhou Provincial Science and Technology Projects [QKHJC-ZK (2022) YB334]; Guizhou Provincial Science and Technology Projects [QKHZC (2023) YB228]; Guizhou Provincial Key Project of Humanities and Social Science [QJH (2023) 23RWJD182]; Guizhou Provincial Science and Technology Projects [QKHZC (2023) YB227]; Guizhou Provincial Digital Rural Innovation Team in Higher Education [QJJ (2023) 076] and Guizhou Provincial Engineering Research Center in Higher Education [QJJ (2023) 039].
Acknowledgments
We thank the reviewers for their valuable comments. We gratefully acknowledge the design of SL and the econtributions of the co-authors. We appreciate Zhenghua Shi, Lei Gu, Shuang Huang, and Shasha Li’s suggestions for paper revision. We thank Fujun Yue and Arshad Ali’s contribution to the English revision of the manuscript.
Conflict of interest
The authors declare that the research was conducted in the absence of any commercial or financial relationships that could be construed as a potential conflict of interest.
Publisher’s note
All claims expressed in this article are solely those of the authors and do not necessarily represent those of their affiliated organizations, or those of the publisher, the editors and the reviewers. Any product that may be evaluated in this article, or claim that may be made by its manufacturer, is not guaranteed or endorsed by the publisher.
References
Abdullah, S., and Barua, D. (2022). Modeling land surface temperature with a mono-window algorithm to estimate urban heat island intensity in an expanding urban area. Environ. Process. 9, 14. doi:10.1007/s40710-021-00554-8
Arnfield, A. J. (2003). Two decades of urban climate research: a review of turbulence, exchanges of energy and water, and the urban heat island. Int. J. Climatol. 23, 1–26. doi:10.1002/joc.859
Cai, H., He, Z., Yang, D., and Deng, H. (2014). Distribution and formation of the abnormal heat island in Guiyang, southwestern China. JARS 8, 083637. doi:10.1117/1.JRS.8.083637
Cao, R., Chen, Y., Chen, J., Zhu, X., and Shen, M. (2020). Thick cloud removal in Landsat images based on autoregression of Landsat time-series data. Remote Sens. Environ. 249, 112001. doi:10.1016/j.rse.2020.112001
Chen, A., Yang, X., Guo, J., Zhang, M., Xing, X., Yang, D., et al. (2022). Dynamic of land use, landscape, and their impact on ecological quality in the northern sand-prevention belt of China. J. Environ. Manag. 317, 115351. doi:10.1016/j.jenvman.2022.115351
Chen, S., and Wang, T. (2009). Comparison analyses of equal interval method and mean-standard deviation method used to delimitate urban heat island. J. Geo-information Sci. 11, 145–150. doi:10.3724/sp.j.1047.2009.00145
Deilami, K., Kamruzzaman, Md., and Liu, Y. (2018). Urban heat island effect: a systematic review of spatio-temporal factors, data, methods, and mitigation measures. Int. J. Appl. Earth Obs. Geoinf. 67, 30–42. doi:10.1016/j.jag.2017.12.009
Diem, P. K., Nguyen, C. T., Diem, N. K., Diep, N. T. H., Thao, P. T. B., Hong, T. G., et al. (2024). Remote sensing for urban heat island research: progress, current issues, and perspectives. Remote Sens. Appl. Soc. Environ. 33, 101081. doi:10.1016/j.rsase.2023.101081
Feng, R., Wang, F., Wang, K., Wang, H., and Li, L. (2021). Urban ecological land and natural-anthropogenic environment interactively drive surface urban heat island: an urban agglomeration-level study in China. Environ. Int. 157, 106857. doi:10.1016/j.envint.2021.106857
Galdies, C., and Lau, H. S. (2020). Climate Change, Hazards and Adaptation Options. Climate Change Management. Cham: Springer, 369–388.
Ge, X., Wu, Q., Wang, Z., Gao, S., and Wang, T. (2021). Sulfur isotope and stoichiometry–based source identification of major ions and risk assessment in Chishui River Basin, southwest China. Southwest China. Water 13, 1231. doi:10.3390/w13091231
Grazia, M., Liuzzi, G., Masiello, G., Serio, C., Telesca, V., and Venafra, S. (2016). Surface parameters from SEVIRI observations through a Kalman filter approach: application and evaluation of the scheme in Southern Italy. Tethys 13, 3–10. doi:10.3369/tethys.2016.13.01
Gunawardena, K. R., Wells, M. J., and Kershaw, T. (2017). Utilising green and bluespace to mitigate urban heat island intensity. Sci. Total Environ. 584–585, 1040–1055. doi:10.1016/j.scitotenv.2017.01.158
Hu, D., Qiao, K., Wang, X., Zhao, L., and Ji, G. (2017). Comparison of three single-window algorithms for retrieving land-surface temperature with Landsat 8 TIRS data. Geomatics Inf. Sci. Wuhan Univ. 42, 869–876. doi:10.13203/j.whugis20150164
Huang, Z. (2003). On the development and conservation for the resources and ecology of Chishui river basin. Resour. Environ. Yangtze Basin. 4, 332–339. doi:10.1023/A:1022289509702
Hwang, R.-L., Lin, T.-P., and Lin, F.-Y. (2020). Evaluation and mapping of building overheating risk and air conditioning use due to the urban heat island effect. J. Build. Eng. 32, 101726. doi:10.1016/j.jobe.2020.101726
Jiang, X., and Xia, B. (2007). Spatial characteristics and dynamic simulations of urban heat environment of cities in Pearl River Delta. Acta Ecol. Sin. 27, 1461–1470.
Jiménez-Muñoz, J. C., Sobrino, J. A., Skoković, D., Mattar, C., and Cristóbal, J. (2014). Land surface temperature retrieval methods from landsat-8 thermal infrared sensor data. IEEE Geoscience Remote Sens. Lett. 11, 1840–1843. doi:10.1109/LGRS.2014.2312032
Ju, J., and Roy, D. P. (2008). The availability of cloud-free Landsat ETM+ data over the conterminous United States and globally. Remote Sens. Environ. 112, 1196–1211. doi:10.1016/j.rse.2007.08.011
King, M. D., Platnick, S., Menzel, W. P., Ackerman, S. A., and Hubanks, P. A. (2013). Spatial and temporal distribution of clouds observed by MODIS onboard the terra and aqua satellites. IEEE Trans. Geoscience Remote Sens. 51, 3826–3852. doi:10.1109/TGRS.2012.2227333
Kwarteng, A., and Small, C. (2010). Remote Sensing of Urban and Suburban Areas. New York: Springer, 267–287.
Li, J., Ouyang, Z., Liu, P., Zhao, X., Wu, R., Zhang, C., et al. (2021). Distribution and characteristics of microplastics in the basin of chishui River in Renhuai, China. Sci. Total Environ. 773, 145591. doi:10.1016/j.scitotenv.2021.145591
Liao, S., Cai, H., Tian, P., Zhang, B., and Li, Y. (2022). Combined impacts of the abnormal and urban heat island effect in Guiyang, a typical Karst Mountain City in China. Urban Clim. 41, 101014. doi:10.1016/j.uclim.2021.101014
Liu, F., Wang, J., Zhang, F., Liu, H., and Wang, J. W. (2021). Spatial organisation of fish assemblages in the Chishui River, the last free-flowing tributary of the upper Yangtze River, China. Ecol. Freshw. Fish 30, 48–60. doi:10.1111/eff.12562
Luo, R., Yang, S., Wang, Z., Zhang, T., and Gao, P. (2021). Impact and trade off analysis of land use change on spatial pattern of ecosystem services in Chishui River Basin. Environ. Sci. Pollut. Res. 29, 20234–20248. doi:10.1007/s11356-021-17188-w
Mannstein, H. (1987). Remote Sensing Applications in Meteorology and Climatology. NATO ASI Series. Dordrecht: Springer, 391–410.
Masiello, G., Serio, C., Venafra, S., Liuzzi, G., Göttsche, F., F. Trigo, I., et al. (2015). Kalman filter physical retrieval of surface emissivity and temperature from SEVIRI infrared channels: a validation and intercomparison study. Atmos. Meas. Tech. 8, 2981–2997. doi:10.5194/amt-8-2981-2015
Mostovoy, G. V., King, R. L., Reddy, K. R., Kakani, V. G., and Filippova, M. G. (2006). Statistical estimation of daily maximum and minimum air temperatures from MODIS LST data over the state of Mississippi. GIScience Remote Sens. 43, 78–110. doi:10.2747/1548-1603.43.1.78
Orusa, T., and Borgogno Mondino, E. (2021). Exploring short-term climate change effects on rangelands and broad-leaved forests by free satellite data in Aosta Valley (northwest Italy). Climate 9, 47. doi:10.3390/cli9030047
Orusa, T., and Mondino, E. B. (2019). “Landsat 8 thermal data to support urban management and planning in the climate change era: a case study in Torino area, NW Italy.” in Remote sensing technologies and applications in urban environments IV, Strasbourg, France, 133–149. doi:10.1117/12.2533110
Orusa, T., Viani, A., and Borgogno-Mondino, E. (2024). IRIDE, the euro-Italian earth observation program: overview, current progress, global expectations, and recommendations. Environ. Sci. Proc. 29, 74. doi:10.3390/ECRS2023-16839
Orusa, T., Viani, A., Moyo, B., Cammareri, D., and Borgogno-Mondino, E. (2023). Risk assessment of rising temperatures using Landsat 4–9 LST time series and Meta® population dataset: an application in Aosta Valley, NW Italy. Remote Sens. 15, 2348. doi:10.3390/rs15092348
Qin, Z., Li, W., Xu, B., and Zhang, W. (2004). Estimation method of land surface emissivity for retrieving land surface temperature from Landsat TM6 data. Adv. Mar. Sci. 9.
Qin, Z., Li, W., Zhang, M., Karnieli, A., and Berliner, P. (2003). Estimating the essential atmospheric parameters of mono-window algorithm for land surface temperature retrieval from Landsat TM6. REMOTE Sens. Forl. and Resour. 2, 37–43. doi:10.3969/j.issn.1001-070X.2003.02.010
Qin, Z., Zhang, M., Karnieli, A., and Pedro, B. (2001). Mono-window algorithm for retrieving land surface temperature from Landsat TM6 data. Acta Geogr. Sin. 56, 456–466. doi:10.11821/xb200104009
Rizwan, A. M., Dennis, L. Y. C., and Liu, C. (2008). A review on the generation, determination and mitigation of Urban Heat Island. J. Environ. Sci. 20, 120–128. doi:10.1016/S1001-0742(08)60019-4
Sekertekin, A. (2019). Validation of physical radiative transfer equation-based land surface temperature using Landsat 8 satellite imagery and SURFRAD in-situ measurements. J. Atmos. Sol.-Terr. Phys. 196, 105161. doi:10.1016/j.jastp.2019.105161
Shi, H., Xian, G., Auch, R., Gallo, K., and Zhou, Q. (2021). Urban heat island and its regional impacts using remotely sensed thermal data—a review of recent developments and methodology. Land 10, 867. doi:10.3390/land10080867
Sobrino, J. A., Oltra-Carrió, R., Sòria, G., Bianchi, R., and Paganini, M. (2012). Impact of spatial resolution and satellite overpass time on evaluation of the surface urban heat island effects. Remote Sens. Environ. Remote Sens. Urban Environ. 117, 50–56. doi:10.1016/j.rse.2011.04.042
Su, Y., and Yu, B., 2018. Spatial-temporal characteristics of urban heat island effect in hanzhong city in recent 20 Years based on mono-window algorithm. J. Northwest For. Univ. 33, 183–192. doi:10.3969/j.issn.1001-7461.2018.04.30
Viani, A., Orusa, T., Borgogno-Mondino, E., and Orusa, R. (2024). A one health google earth engine web-GIS application to evaluate and monitor water quality worldwide. Euro-Mediterr J. Environ. Integr. doi:10.1007/s41207-024-00528-w
Vujovic, S., Haddad, B., Karaky, H., Sebaibi, N., and Boutouil, M. (2021). Urban heat island: causes, consequences, and mitigation measures with emphasis on reflective and permeable pavements. CivilEng 2, 459–484. doi:10.3390/civileng2020026
Wan, Z., and Dozier, J. (1996). A generalized split-window algorithm for retrieving land-surface temperature from space. IEEE Trans. Geoscience Remote Sens. 34, 892–905. doi:10.1109/36.508406
Wang, C., Wang, Z.-H., Kaloush, K. E., and Shacat, J. (2021). Cool pavements for urban heat island mitigation: a synthetic review. Renew. Sustain. Energy Rev. 146, 111171. doi:10.1016/j.rser.2021.111171
Wang, K., Wang, X., Huang, F., and Luo, L. (2018). Comparison of land surface temperature retrieval algorithms in karst city. Remote Sens. Technol. Appl. 33, 803–810. doi:10.11873/j.issn.1004-0323.2018.5.0803
Wang, S., Xu, W., and Guo, T. (2024). Advances in thermal infrared remote sensing technology for geothermal resource detection. Remote Sens. 16, 1690. doi:10.3390/rs16101690
Wang, X., Qin, L., Nong, J., Ling, Z., and Zhu, Q. (2010). Land surface temperature retrieval with mono-window algorithm in karst city. J. Guangxi Normal Univ. Nat. Sci. Ed. 28, 10–14. doi:10.16088/j.issn.1001-6600.2010.03.008
Weng, Q. (2009). Thermal infrared remote sensing for urban climate and environmental studies: methods, applications, and trends. ISPRS J. Photogramm. Remote Sens. 64, 335–344. doi:10.1016/j.isprsjprs.2009.03.007
Xu, H., 2015. Retrieval of the reflectance and land surface temperature of the newly-launched Landsat 8 satellite. Chin. J. Geophys. 58, 741–747. doi:10.6038/cjg20150304
Xu, S., Li, S., Zhong, J., and Li, C. (2020). Spatial scale effects of the variable relationships between landscape pattern and water quality: example from an agricultural karst river basin, Southwestern China. Agric. Ecosyst. Environ. 300, 106999. doi:10.1016/j.agee.2020.106999
Yang, J., and Huang, X. (2021). The 30 m annual land cover dataset and its dynamics in China from 1990 to 2019. Earth Syst. Sci. Data 13, 3907–3925. doi:10.5194/essd-13-3907-2021
Yi, Y., Zhang, C., Zhang, G., Xing, L., Zhong, Q., Liu, J., et al. (2021). Effects of urbanization on landscape patterns in the middle reaches of the Yangtze River region. Land 10, 1025. doi:10.3390/land10101025
Zhang, Z., He, G., Xiao, R., and Wang, W. (2005). A study of the urban heat island changes of Beijing city based on remote sensing. Remote Sens. Inf. 46–48, 70.
Keywords: Landsat 8 TIRS, spatiotemporal UHI characteristics, urban planning strategies, thermal environment assessment, Chishui River Basin
Citation: Wu Y, Wu H, Li S, Wu L, Guo C, Zhang Z, Fan R, Yang X, Zhou G, Yang J, Yuan P and Luo G (2024) Integrating urban development and ecological sustainability: a study on land surface temperature and urban heat island effect in a Karst River Basin. Front. Built Environ. 10:1457347. doi: 10.3389/fbuil.2024.1457347
Received: 30 June 2024; Accepted: 08 August 2024;
Published: 22 August 2024.
Edited by:
Qiong Wu, Jilin University, ChinaReviewed by:
Tommaso Orusa, University of Turin, ItalyFengxiang Guo, Helmholtz Association of German Research Centres (HZ), Germany
Copyright © 2024 Wu, Wu, Li, Wu, Guo, Zhang, Fan, Yang, Zhou, Yang, Yuan and Luo. This is an open-access article distributed under the terms of the Creative Commons Attribution License (CC BY). The use, distribution or reproduction in other forums is permitted, provided the original author(s) and the copyright owner(s) are credited and that the original publication in this journal is cited, in accordance with accepted academic practice. No use, distribution or reproduction is permitted which does not comply with these terms.
*Correspondence: Ruixue Fan, ZmFucnVpeHVlMjAxNUAxNjMuY29t; Guangjie Luo, bHVvZ3VhbmdqaWVAZ3puYy5lZHUuY24=
†These authors have contributed equally to this work