 Job Momoh
 Olubisi Ige
 Lucy Ogbenjuwa
- Centre for Integrated Delivery of the Built Environment (IDoBe), School of Built Environment and Architecture, London South Bank University, London, United Kingdom
The development of a weighting and aggregating coefficient system used in urban sustainability assessment tools is a process that needs well-defined procedures using a series of steps, methodology, and a systematic approach in its development. The development of assessment tools has been successful in developed countries but developing countries would need to have a structured process that will assist in the development of an assessment tool that is tailored to its environs. This paper aims to understand the various weighting and aggregating coefficient systems employed in the development of sustainability assessment tools. Alongside using these findings to understand how these weighting and aggregating coefficients can be adopted in the development of sustainability assessment tools for developing countries based on their differences, advantages, and disadvantages. Qualitative Content Analysis based on a systematic review of existing literature was used in this study to understand various weighting and aggregating coefficients. It is imperative to note that this research will focus on how assessment tools are developed with a clear focus on sustainability assessment weighting and aggregating. The study also further analyses how a case study SUCCEED (Sustainable Composite Cities Environmental Evaluation and Design Tool) has benefited from the adoption of equal weighting and additive aggregation methods based on validation carried out. The findings of this research show that the selection of weighting and aggregating systems is defined by the relevance, importance, and purpose of the assessment tool. It also develops a guide/recommendations on the process utilised in the development of assessment tools for developing countries.
1 Introduction
The sustainability agenda has unrelentlessly sustained the central arena in academia, professional, and government discourse. This has resulted in the need to develop urban spaces where people can live, work, commute easily, and enjoy a better quality of life and quality of space (Roberts, 2009). The rapid urban growth and urbanisation in developing countries coupled with climatic change, rapid environmental degradation, and decay in natural and physical resources are the various reasons for the need to develop urban spaces that embed sustainability principles (Giradet, 2015). Climate change has been one of the key areas of focus that has resulted in an adverse change in rainfall, temperature, quality of air, water, and soil conditions. This can be largely linked to the high level of carbon emissions as a result of construction activities and energy usage in urban cities. The UK Green Building Council reports that the construction sector is responsible for 25% of the total UK greenhouse gas emissions that harm the environment (UKGBC, 2023). Although there have been concerns about the need to adopt sustainability within urban spaces, current practices within urban development, consequent prevalent planning and design practices as a result of economic and population increase have resulted in high consumption of non-renewable natural resources alongside waste generation, high level of pollution and increase in heat levels within cities. In today’s practice due to the emphasis on environmental sustainability current practices relate sustainable urban development to focus on energy management, waste management, and water usage reduction with little emphasis on the natural environment, and socio-cultural indicators. It is important to state most governments in developing countries have seen the relevance of sustainability and are currently applying and adopting strategies for its successful implementation (Deakin et al., 2002).
This calls for developing these spaces based on sustainability principles and attributes. However, the process of implementing these systems is seen from different perspectives, depending upon the role played by key professionals and agencies involved in the design, development, and adaptation of urban development (Lisa-Britt and Jens, 2016). Although there are no blueprints as well as a single approach to resolving this complex problem, researchers, governance, policies, and cities have a significant role in ensuring that sustainability principles are being adopted in its development. It is known that cities around the world are currently designing methods, strategies, and techniques to deal with complex problems of global change and sustainability. Among other methods, these strategies and action plans are informed by a diverse array of assessment tools that function as decision-support systems (Sharifi, 2022). Different sustainability assessment tools are designed and tailored to various developments such as city development, urban neighbourhoods (new construction and existing development), and buildings (new construction, in-use and refurbishment). There has been more emphasis placed on the development of assessment tools meant for urban spaces as sustainability can be embedded across a larger footprint in comparison to building scale (Nabiollah et al., 2015). Urban stakeholders across the globe have shown interest in developing sustainability assessments to use them in the rapid development of urban spaces (Appu, 2012). Urban sustainability assessment is defined as the methods of assessing urban spaces based on the use of urban planning actions and guiding principles which are embedded into a series of urban sustainability indicators (SIs) to improve and build sustainable urban spaces. Urban sustainability assessment is a tool that is employed to better conceptualize and define urban sustainability which encourages the revitalisation and transition of urban areas and cities to enhance livability, promote innovation, and reduce environmental impacts while maximizing economic and social co-benefits (European Environment Agency, 2023). Urban neighbourhood sustainability assessment tools are used to reflect on the overall goal of the project and the most important indicators needed to be implemented within the project. There have been various tools designed for sustainability assessment which have been in practice since the early 1990s. The UK and the United States have been at the forefront of realising smart sustainability assessment tools for building sustainable neighbourhoods. As discussed above, the most useful or well-known assessment tools include Leadership in Energy and Environmental Design (LEED), Building Establishment Environmental Assessment Method (BREEAM), CASBEE and Green Star. Other assessment tools include SUPD, IGBC Green Township, GRIHA-LD, and GBI Township (Ayyoob and Yoshiki, 2016). It is also vital to include Sustainable Development Goals which are targets for global development that were adopted in 2015 for all countries to work towards achieving by 2030 (Pablo et al., 2023).
Developing countries are currently on the verge of adopting principles used in achieving a sustainable urban future. As the urban population increases due to factors that include urban-rural migration, increase in birth rate, migration, industrialisation, and commercialisation, amongst others, there is a drastic need to adopt sustainability principles within urban spaces (Solomon et al., 2019). To understand how sustainability can be achieved, there is a need to recognise how developed countries have designed assessment tools that work within their context which can inform how developing countries can work on their assessment tool.
This research is a continuation of ongoing studies carried out by the researcher that developed SUCCEED. SUCCEED (Sustainable Composite Cities Environmental Evaluation and Design Toolkit) sustainability assessment tool was designed for developing countries with a focus on the Nigerian urban space by using questionnaires and Delphi technique (a forecasting process framework based on the results of several rounds of questionnaires sent to a panel of experts) to prioritise indicators from eight assessment tools which are LEED, BREEAM, Green Star, CASBEE, SUPD, SuBETool, Sustainable Development Goals, and Green Economy Framework. The SUCCEED tool was designed to assess the level of sustainability that a proposed or existing urban scheme has achieved (Momoh, 2016). The tool is targeted at measuring how urban neighbourhoods can be improved or upgraded based on a set of weighting systems. This set of weighting systems evaluates the performance or anticipated performance of neighbourhoods and translates that examination into an overall assessment that gives way to implementing sustainability. Also, this fixed weighting system developed will provide an economic solution as well as a long-lasting planning solution to issues within urban spaces. There are a total of 21 core categories and 105 sub-indicators and the assessment system is scored based on the amount of indicators that have been embedded into a design. This work will develop the first urban sustainability assessment tool for the Nigerian urban environment.
The main reason for this research is to study and suggest the most appropriate method of identifying the most appropriate weighting and aggregation methods in the development of a robust assessment system for developing countries. The research objectives are 1) to understand the different weighting and aggregating systems used in the development of Urban Sustainability Assessment tools. 2) compare these various methods of weighting and aggregating systems 3) review the sustainability indicators used for developing countries 4) develop an approach in selecting the most appropriate weighting and aggregating systems based on SUCCEED urban sustainability assessment tool for developing countries.
2 Methodology
2.1 Analytical framework
To understand the best most efficient weighting and coefficient methods used in the design of the SUCCEED weighting system there is a need to review and analyse different weighting and aggregation methods used in the design of sustainability indicators. It was also classified into three core areas which include: 1) Uniform weighting 2) Numbers-based weighting and 3) Professionals-based weighting. They all have different approaches to the weighting system. Uniform weighting implies that all indicators have fixed weights, Numbers-based weighting is based on numerical characteristics of the data and lastly, professionally based weighting implies that a range of experts has identified and determined a specific weighting for individual indicators (Gan et al., 2017). Aggregation methods tend to incorporate weighted components into a single complex index. Different classification schemes for aggregation methods exist. The most widely adopted aggregation techniques which are divided into various categories include a) Summative aggregation methods, and b) combined methods (Grabisch, 2009).
2.2 Literature analysis
To understand the various weighting and aggregation systems to be employed in the development of case study SUCCEED it was imperative to conduct a literature review on commonly used methods. A statistical analysis was conducted based on literature which includes journal papers, websites and manuals on sustainable urban development and urban sustainability assessment schemes (Kaur and Garg, 2019). It was also important to use Qualitative Content Analysis (QCA) based on a systematic review to select literature associated with urban sustainability assessment, weighting, and aggregation methods (Park and Cai, 2017). The Figure 1 above shows a flow diagram of systematic literature extracted and used in this study. To identify the right paper for this analysis we adopted the PRISMA flowchart (Moher et al., 2009). See Table 1 above which includes the literature search parameters and conditions involved in the review process.
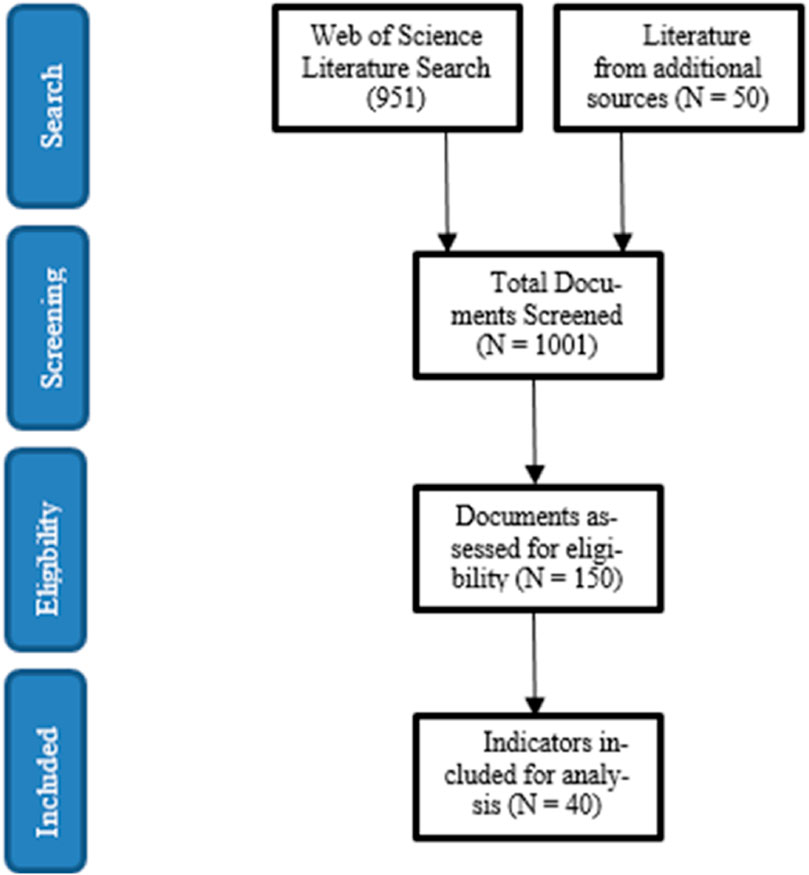
Figure 1. PRISMA flow diagram of systematic literature search and extraction of data/studies for (40) reviewed papers.
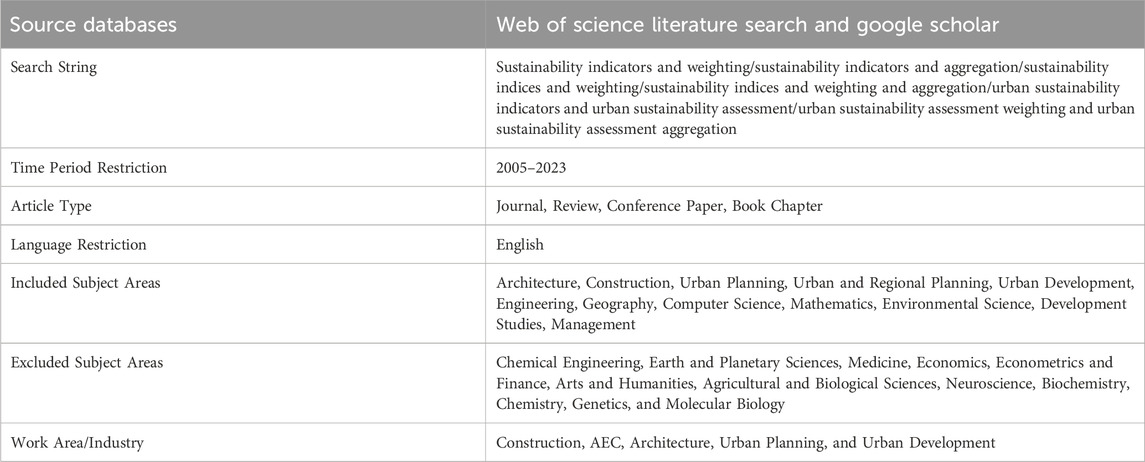
Table 1. Literature search parameters and conditions involved in the review process.
The researcher conducted various searches for papers on the Web of Science Literature search and Google Scholar (sustainability indicators and weighting/sustainability indicators and aggregation/sustainability indices and weighting/sustainability indices and weighting and aggregation). This search was carried out on the 25th of July 2023 which resulted in 951 publications. Other searches from various databases highlighted 50 documents which led to a total of 1001 publications. Titles and abstracts of these papers (n = 1001) were then filtered to remove: 1. Papers that were less cited, 2. Literature that was unrelated to the research area and c. Papers on sustainability indicators. This resulted in having a total of 150 articles which were assessed to filter and remove articles that did not include specific weighting or aggregating methods. A total of 40 articles were highlighted from this result. See Table 2 below showcasing a list of sources.
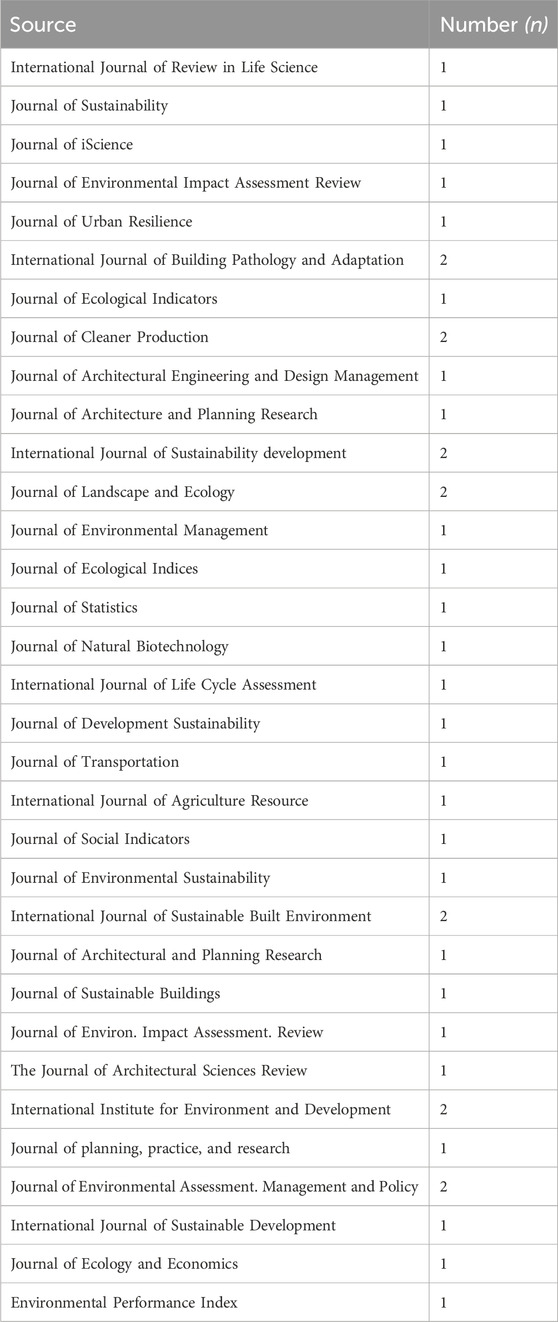
Table 2. Characteristics of systematic reviews (n =40).
2.3 Literature analysis results
Within the 40 SIs articles reviewed in this paper, 43% applied uniform weighting methods, 20% utilised number-based methods, and 23% professional-based methods. Also, for aggregation methods, most of the articles utilised a summative aggregation strategy.
3 Literature review
3.1 Sustainability indicators
3.1.1 An overview on sustainability indicators
The use of sustainability indicators (SI) is one of the prominent and most widely accepted measures in the development of assessment tools. Indicators are used to perform many functions and can be seen as a set of multi-tasking pointers in achieving or measuring desired outcomes. Indicators are used in our everyday activities; they are part of everyone’s life (Lee, 2012). The use of indicators is to monitor complicated and complex systems that need to be measured, studied, or controlled. An indicator can be clearly defined as a summary measure that provides a set of data or information about the state of a system or whether it needs changes to improve the system that is been measured (Joseph et al., 2012). The use of indicators is known to simply communicate complex information and data about its performance to an audience who desires to understand more about the building, and urban environment, or make final decisions based on that information (Alqahtany et al., 2013; Alwaer et al., 2014). Sustainability indicators adopt various key points that make up the composition of this system and its relation to sustainability within the built environment.
To envisage the complex nature of sustainability, sustainability assessment often needs the integration of various indicators to form composite indices (Wu and Wu, 2012). Hence, while selecting the most appropriate sustainability indicators and indices (SIs) is vital in the development, the specifics of SIs formulation can drastically impact the measured sustainability of urban space. The selection of the most vital indicator is very difficult and would require an iterative approach to its development (Hardi and Zdan, 1997). But most importantly the selection of an appropriate weighting and aggregation method is very tasking and would require a scientific approach in its design (Wilson and Wu, 2017). The weighting and aggregation of the sustainability indices are crucial elements in sustainability assessment and showcase the importance of different dimensions in their contribution to the sustainability performance of a system. The weights of each indicator echo the relevance of different dimensions while aggregation showcases how all weightings are summed into a grade that has been achieved at the end of the process. The weighting and aggregation methods used in SI development define whether dimensions can compensate or substitute for each other. Overall, the weights of SIs not only show the relevance of diverse indicators/dimensions in their influence on the sustainability grade attained but also identify the trade-off between these dimensions. It is then important to note that the unsuitability of the selection of weighting methods can result in SIs delivering wrong results (Huang, et al., 2015).
3.1.2 Implementing sustainability indicators for developed and developing countries
There is a need for regions and states to cooperate in a spirit of global partnership to conserve, protect and restore the health and integrity of the earth’s ecosystem. Its known fact that developed countries have acknowledged the responsibilities that they bear in the international pursuit of sustainable development in view of the pressures their societies place on the global environment (Momoh, 2016). While developing countries are in the verge of recognising and implementing the three main dimensions of sustainability. The implementation of sustainability will be based on understanding the key sustainability dimensions and indicators adopted in developed countries (Mike and Simon, 2010). Developed countries has been able to develop a robust effective planning system and governance to set up pathways to sustainable development while in developing countries, major cities still lack such systems. This is due to poor policy implementation, extreme poverty, political instability, environmental deterioration, rapid population growth, lack of awareness, lack of training, developing assessment, threat to climate change, socio-economic challenges, and technological advancement (Tim, 2011). Developed countries are in a better position to implement indicators within the three main tiers which are social, economic, and environmental indicators due to sustainable development policies, plans, and programmes. The practicality of adopting a selection of sustainability indicators to implement sustainability will be based on understanding how it has worked in developed countries and to tailor fit its application to adapt to the current challenges plagued in developing countries.
3.2 Selecting SIs in the development of the sustainability assessment tool
It is stated from various research carried out that weighting and aggregation are vital in the development of Sustainability Assessment Tools based on a series of selected sustainability indicators (Jollands, 2005). Although this research has clearly stated the various methods of carrying out weighting and aggregation techniques it further claims that the examples have advantages and disadvantages. As there are no formal systems set in place to determine when best to use a specific weighting and aggregation system it shows that there are no specific guides to tell researchers and practitioners to follow a process that guides the successful design of an assessment tool. A certain point to note is that if weighting and aggregation methods are not properly selected the end product from SIs will not successfully represent the output of the measurement of the SI.
The selection of the most appropriate weighting and aggregation technique is engrained in the characteristics of the SIs. This shows that when selecting SIs it should consider its purpose, scale, concept, influence on the outcome, and impact should be key fundamentals in the construction of Sis (Booysen, 2002). Based on best global practice when constructing SIs key parameters in their selection include defining the policy goals, selecting indicators based on a framework, selecting appropriate weighting and aggregation, suitability/robustness, testing, and measuring the success of its application. These processes work together in a homogenous system to ensure the end product (Sustainability Assessment) is being developed and suitable for the goal of the assessment. Hence when selecting the best system it is vital to take into cognisance research purposes, scales, and sustainability concepts (Singh et al., 2009). To ensure that the right set of weighting and aggregation is selected there is a need to consider initiating a multi-step decision that provides a process-oriented approach that aims to influence the decision on the best approach. These factors include the following 1) Selected SIs aim/benefits of measuring indicators 2) Establishing the size/time scale of SIs 3) Identifying weak or strong sustainability indicators 4) Measuring Sustainability Indicators.
3.2.1 Selected SIs aim/benefits
Selecting the right or most important sustainability indicator is important in the development of assessment tools or frameworks. The selection of effective indicators has become one of the main challenges for different organisations, stakeholders, architects and engineers (Husam, 2006). The use of sustainability indicators aims to develop a robust approach to measuring and assessing the indicators achieved when implementing sustainability. The rapid development of the green revolution has transformed how SI’s are been implemented as a result of the benefits seen in the implementation. Although most assessment tools do not have a holistic, integrated, multi-dimensionality of sustainability (Yudelson, 2008). The design of this assessment methodology favours an environmental perspective of sustainability instead of having indicators from the three main dimensions of sustainability. Therefore these key benefits may vary from one context to another. These benefits are currently signed by the scholars as advantages seen as a result of the implementation of SI’s. The benefits of SI and assessment tools have been documented through the years in the list below (Morelli, 2011; Reed et al., 2011).
• Setting organisations and projects triple bottom line
• Performance, reduction of impact, and meeting sustainability objectives
• Decision-making process throughout the project life cycle
• Economics throughout the project life cycle
• Increment of energy efficiency processes
• Productivity and health
• Organisation of information for the certification process and performance evaluation
• Collection, reporting/interpretation of data for stakeholders and stockholders
• Performance benchmarking
• Risk and opportunity management
• Cultural/social change
• Morale/engagement of employees and stakeholders
• Local communities and directly impacted stakeholders (Cesar and Ryan, 2015).
The benefit and use of sustainability indicators help decision-makers to be better informed about the impact of future developments based on the understanding of past experiences. Additionally, the use of sustainability provides a bases for analysis, mediation, or decision-making.
3.2.2 Establishing the size/time scale of sustainability indicators
The time scale in sustainability development is known to be uncertain and variable based on the indicator concerned. Some indicators are analysed over a long timeframe, multi-space/time sustainability and showcasing valuable information: examples are climate change and patterns of energy consumption or rate of environmental degradation. Snapshots are known to be limited to offering readings of the level of sustainability of a project at a certain time (Husam et al., 2013). It is important to recognise the importance of data normalisation functions that enable the space-time analysis of composite indicators. When analysing the timescale of sustainability indicators, it is very important to analyse two key important questions which are a) over what space (area or context) is sustainability to be achieved, and b) over what length of time will it be achieved (Simon and Stephen, 2008). On the other hand, different indicators may ideally be measured in various timeframes; as an example, energy usage in buildings is best studied over 5–10 years (longitudinal study). According to Dalman who undertook research on sustainability, space, and time, “regular observations of the number of individuals of certain species present valuable information about tendencies of overall development” (Dalman, 2002). From a global perspective, timescale is relevant in achieving Sustainable Development Goals (SDGs) to promote sustainable economic growth, advance social inclusion, and safeguard the natural environment which is used as a basis for establishing the size and time scale of sustainable indicators (Pablo et al., 2023). The size and time scale of SIs can also be used to measure wellbeing over time.
3.2.3 Identifying weak or strong sustainability indicators
The development of a sustainability assessment method is based on the weighting and aggregation method incorporated. Weak SI’s often suffer from their unrealistic and inadequate assumption of substitutability between natural capital and man-made capital while strong sustainability indicators rely on physical measures (Michael, 1998). When deciding between weak sustainability and strong sustainability indicators it is important to note that weaker indicators when determined can be substituted and compensated with the weighting and aggregation method. For example, higher values can be identified as weaker SI’s. Also for stronger indicators some SI’s found within the social and environmental dimensions cannot be replaced with indicators within the economic dimensions although some level of flexibility is allowed (Wu, 2013). Hence indicators representing strong sustainability must take into account non-compensability as well as threshold values for each indicator, above which substitutability cannot be allowed (Mori and Christodoulou, 2012). The main characteristic of weak and strong indicators is to communicate complex data or information about the performance of a design to people interested in knowing more about how the indicators interact with the design. Therefore, selecting effective indicators requires a clear conceptual basis and recognition of available data, resources, time scale, spatial, and the needs/interests of the groups or individuals involved in the selection of indicators (Becker, 2004; Alwaer et al., 2008). Weak sustainability is linked to non-declining combined stock of capital and assumes that man-made capital can be replaced with natural capital. While strong sustainability suggest that natural capital cannot be replaced by any other capital (Dietz and Neumayer, 2007). An example of classifying weak and strong indicators would be based on a population growth rate, ecological footmark, and biocapacity per capita. It can be alleged that high income started on a path of weak sustainability indicators by replacing natural capital with man-made capital. Indicators under Economic sustainability can be seen as strong in developed countries and weak in developing countries.
3.2.4 Measuring Sustainability Indicators
The use of SI’s are number based which measures to be easily quantifiable. Based on this paradigm this implies that SI’s were developed to be quantified or measured (Warhurst, 2002). SI’s are therefore developed on the theory of reductionist approach that can be measured. Atkinson et al., 2009, suggest: “to solve the problems of sustainability, it needs “numbers-not adjectives” and must be based on evidence and not public relations”. Sustainability itself is a human vision that by definition is guarded with human values and SI’s are not necessarily developed through a long process of hypothesis setting and testing intended to arrive at a deeper understanding of sustainability. Sustainability is measured appropriately by using quantitative index methods (Atkinson et al., 2009).
3.3 Different weighting methods
3.3.1 Uniform weighting method
A uniform weighting scheme is known to be the most used method in assessing various composite indicators (Nardo et al., 2005). The reason is that there is no clear position on the importance of the elements in the composite indicator. The definition of this weighting system means that all weights are equal. Uniform weighting does not assure equivalent importance and equal contribution of the indicators to the composite indicator (Saisana and Tarantola, 2002). Therefore uniform weighting can be used when all indicators are considered equally relevant or when no element of statistics or experiential evidence facilitates a different scheme. It is also known to be the easiest system and can be adopted by others (Hedvig, 2017). Popular examples that can be referenced include the Program Sustainability Assessment Tool (PSAT), Human Development Index, and City Development Index. Overall it is an easy, straightforward, and not complex method that focuses on the validity and transparency of indices using this procedure (Rowley et al., 2012; Mikulic et al., 2015).
3.3.2 Numbers-based method
The numbers-based approach is based on data that are employed through a series of calculations to collate them more in line with the studied sample. Numbers or statistical methods have a quantity allocated to increase or decrease the relevance of an item. Weight is mostly given for tests and examinations which you can relate to how sustainability assessment tools work. A weighting factor is a weight given to a data point to assign its lighter or heavier importance in a group. There are three most commonly used methods in developing weighting criteria based on statistical methods which are a) principal components analysis, b) benefit of the doubt approach, and c) regression analysis.
(a) Principal components analysis (PCA) is known as a technique used in reducing the dimensionality of such datasets, increasing interpretability but at the same time reducing data loss (Cadima and Jollife, 2009). This takes place by creating new uncorrelated variables that successively maximize variance. This method reduces the dimensionality of the indicator set and as a result is valuable when a large number of indicators need to be considered.
(b) Benefits of the doubt approach (BOD) is an application of data envelopment analysis (DEA). DEA is used to generate weights of composite indicators and this is carried out by generating BoD weights for every observed unit. The weights of indicators are revealed by the relative performance of a set of indicators that are ratio-based. Also, the benchmark is based on the highest weighted sum of a unit employing the same weight as the one to be measured (Ringner, 2008).
(c) Regression analysis (RA) is an established statistical process for assessing the relationships between a dependent variable often called outcome and one or more independent variables. When using regression analysis, weights can be achieved by discerning the relationship between a set of indicators and a single output measure (Cherchye et al., 2007). This statistical method works well when there are a high number of independent variables or indicators, and it can be utilised for validating and upgrading the applied series of weights.
3.3.3 Professional-based method
This concept is known as the participatory approach which involves a series of professional judgments and opinions and is often utilised for weights, to direct the relative importance of the indicators from the societal perspective. This approach has three common methods which include 1) budget allocation, 2) public opinion, and 3) analytic hierarchy process.
(a) Budget Allocation (BAL): The budget allocation method experts are given a budget of N points, to be circulated across several indicators whose relevance they will enhance. This method is normally carried out by expert’s opinion where each expert has extensive knowledge and experience in allocating and distributing “n” points over some indicators. This is to ensure that a proper weighting system is embedded within a given application. Based on their expert experience, indicators judged to be more important are given a larger proportion of the budget of which the indicator’s weights are measured according to the dispersal of points [30]. The budget allocation method can be classed into four major phases: 1) Selection of experts for the valuation; 2) Allocation of budget to the indicators; 3) Measurement of the weights; 4) iteration of the budget allocation until convergence is reached. It is important to note that a budget allocation system can cause serious cognitive stress to experts in scenarios where a large number of indicators are presented hence it is advised that this method is suitable for fewer numbers of indicators (EU Commission, 2022a).
(b) Public Opinion (PO): This system entails public opinion polls that are used to resolve issues linked to the public agenda. This approach is easy and inexpensive and it is known that indicators receiving high concern are allocated relatively high weights and vice versa (Van Haaster et al., 2017). It is imperative to note that this process is needed for multi-criteria decision processes and thus creates a participative and transparent environment (Munda, 2005). But one of the key concerns is that it is difficult to ask the public to allocate a hundred points to several indicators than to express concerns about the problems that the indicators represent.
(c) Analytic Hierarchy Process (AHP): The analytic hierarchy process is widely utilised in decision-making. It helps to break down the issues into a hierarchy and assures that both qualitative and quantitative aspects of a problem are introduced in the assessment process, of which opinion is systematically extracted through pairwise comparisons by asking key questions like “which indicators are important” alongside “how much”. The Likert scaling system is used to make comparisons which consist of judgments ranging from 1 to 9 (equality to more important) (EU Commission, 2023b). AHP has been widely used as a multiple-criteria decision-making tool and is a useful method for weighting sustainability indicators (Arranz-López et al., 2017). Table 3 below shows a summary of the different methods for indicator weighting which includes the category, examples, advantages, and disadvantages.
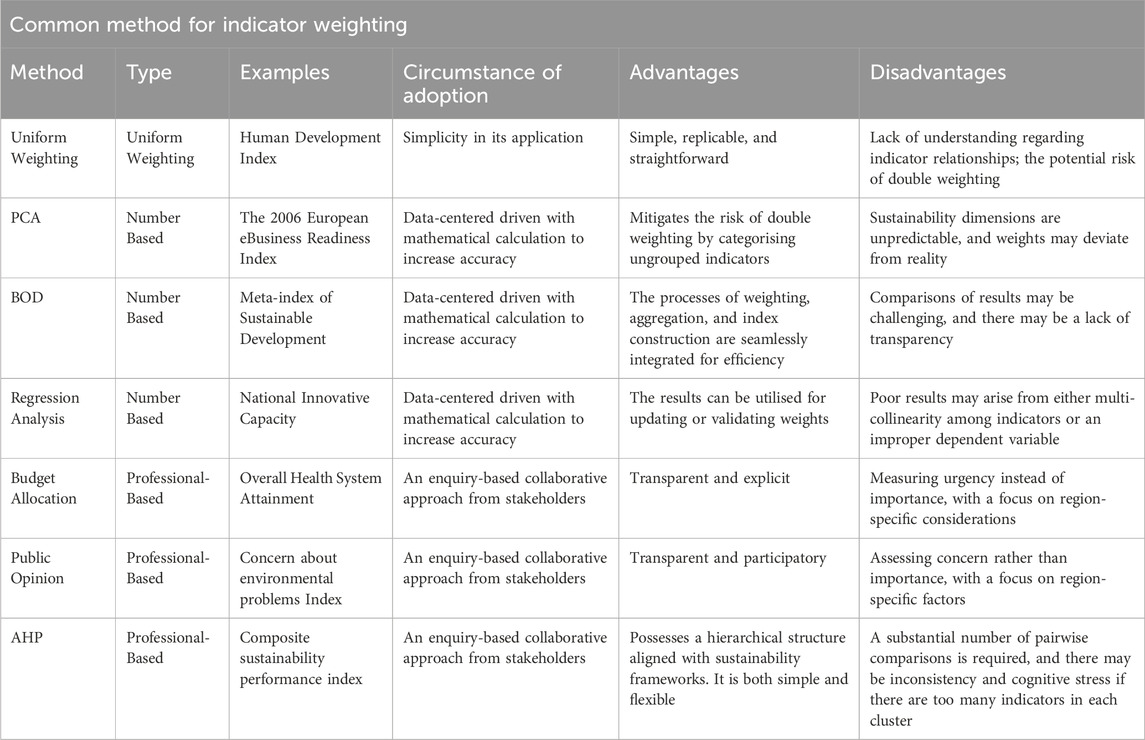
Table 3. Common methods for indicator weighting.
3.4 Aggregation methods
There are various methods used in aggregating indicators within the assessment tools. The most commonly used techniques include summative and combined aggregation methods.
3.4.1 Summative/additive aggregation method
The easiest and simplest aggregation technique is the sum of a country’s rank in each of the indicators. This method is attributed to ordinal information and employs the function that adds up sub-indicators to form a sustainability index. The reason for it being the most used method is based on its simplicity and independence from outliers. The first additive method is based on preferential independence. SIs should be equally independent when initiating using linear additive aggregation methods. This states that the contribution of every sustainability indicator can be summed up together to attain a total aggregated value. It is vital to note that there is no clash between diverse indicators (Chen and Pu, 2004). The second method is based on nominal scores for each indicator to estimate the difference between the number of indicators that are above or below an arbitrarily defined threshold around the mean. The third method is the linear summation of weighted and normalized indicators which is the most widespread additive aggregation. This method entails restrictions on the nature of indicators and interpretation of weights.
3.4.2 Combined aggregation method
Combined aggregation methods utilise multiplicative functions rather than additive functions. One of the key features of this method is how some indicators that perform poorly can be compensated with high-performing indicators hence improving the overall assessment. This system is very useful for indicators with unequal indicators (Bullen, 2013). One of the disadvantages of the geometric aggregation method is that they are not fully non-compensatory techniques that allow for trade-offs among indicators. This leads to the fact that the advantage is based on how low-performing indicators can be improved by increasing or changing the elements that led to their underperformances to improve the overall score of the system (OECD, 2008). Table 4 above showcases the common methods for indicator weighting comparing circumstance of adoption, advantages and disadvantages.
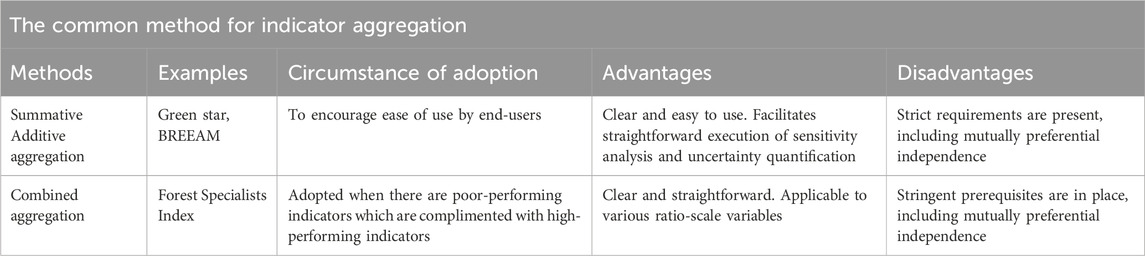
Table 4. Common methods for indicator aggregation.
4 Case study: SUCCEED assessment tool has adopted weighting and aggregation techniques in its development
4.1 SUCCEED assessment tool
Sustainable Composite Cities Environmental Evaluation and Design (SUCCEED) is a tool that was developed based on the growing need to design an assessment tool that can assess and implement sustainable urban development within the context of developing countries e.g., Nigeria. The reason for the development of SUCCEED is to meet key issues within the developing countries which include, infrastructural provision, capacity building, enquiry-based design, social exclusion, economic priorities, social priorities, and indigenous systems. The development of SUCCEED is characterised by understanding the growing international and global nature of the relationship between the environment and economy which is uncertain. Based on the understanding of the development of assessment tools, both internationally recognised and emerging accepted tools, has helped in developing a tool that is based on the context of the Nigerian region. The SUCCEED tool was designed to encourage the successful implementation of sustainability. The tool offers a comprehensive assessment that evaluates the sustainable design and performance of any major urban neighbourhood development. The SUCCEED tool will help to provide a framework that incorporates the three main dimensions of sustainability - which are sociocultural, environmental, and economic, and a fourth dimension of planning that has recently been incorporated and adapted into sustainability. The sustainability indicators used in the development were based on four main models which are LEED, BREEAM, Green Star, and CASBEE which are well-established assessment tools. Alongside SUPD, SuBETool, Sustainable Development Goal and Green Economy are emerging sustainability assessment tools that have influenced the design.
Studies have shown that there are two approaches to measuring sustainability. The first approach is through the selection of individual fields which are measured by the use of sustainability indicators while the second deals with the overall progress which aims to achieve sustainability through a combination of varieties of fields (Atkinson et al., 2009). Sustainability indicators help those involved in planning to be more informed about the impact of future developments based on assessments carried out. Also, it helps to improve the knowledge, practice, and understanding of how these indicators could influence sustainability practices by providing a basis for analysis (Balsas, 2004). The compilation of the right set of indicators for a context is a thorough process with a structured framework or consensus on what urban sustainability should be selected (Lombardi and Cooper, 2009). The rationale behind the development of SUCCEED is as follow.
(a) Address many shortcomings identified existing in the pre-existing assessment tools. This is because most existing tools are targeted at developed countries.
(b) Overcome how sustainability is been previewed in developing countries by simplifying its implementation, adoptation and assessment of urban neighbourhoods.
(c) Encourage flexibility and adoption in various developing and developed countries across the world, and for use as a foundation for other related functions
(d) Eliminate the limitations of evaluation and assessment of sustainability in developing countries by tailoring a tool to meet the needs of urban spaces.
Table 5 below showcases all the important main categories selected in the development of the SUCCEED assessment tool.
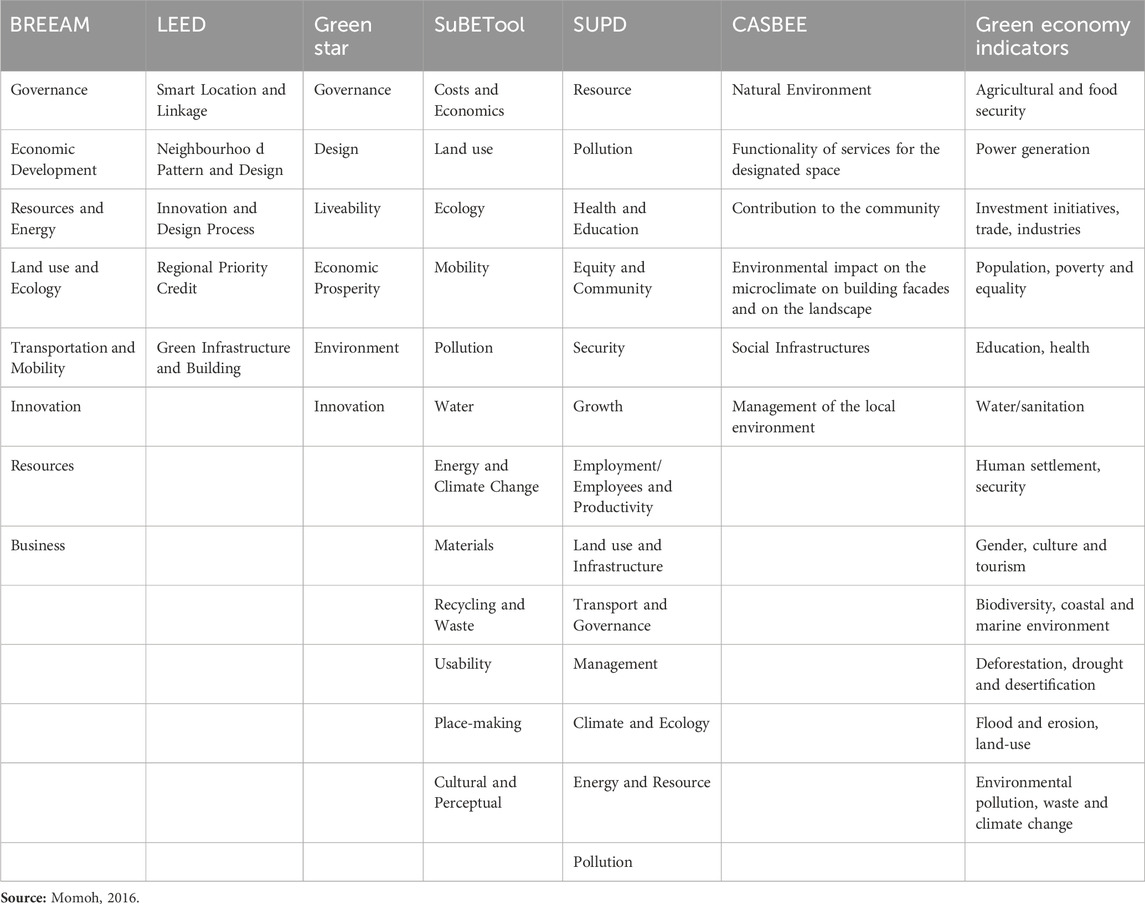
Table 5. Main core categories in BREEAM, LEED, green star, SuBETool, SUPD and CASBEE.
4.1.1 SUCCEED weighting and aggregating system
The main categories selected for the design of SUCCEED assessment tool were further divided into sub-criteria. These sub-criteria indicators are further screened through the two rounds of the Delphi method and questionnaire analysis. The sub-indicators selected were conducted using mean and standard deviation based on the equations below: Equation 1:
Both mean and standard deviation were used to validate the selection of sub-indicators based on the number of participants f) ∑f divided by the total number of responses. The mean was obtained by multiplying the value f) given to each priority of indicators that have been selected based on the Likert scale which includes 1 “not important”, 2 “some importance”, 3 “important”, 4 “very important”, 5 “extremely important”, and frequency together, and the summed-up value is divided by the total number of participants.
The standard deviation shows how much variation exists from the average. A low standard deviation indicates that the data points tend to be very close to the mean and a high standard deviation indicates that the data points are spread out over a large range of values.
This selection was also grouped under the main dimensions so that the main dimension could relate to the core categories and the core categories can then relate to the sub-categories as seen in Table 6 above. This set of grading weighting systems examines the performance or anticipated performance of an urban neighbourhood and translates that examination into an overall assessment that gives the assessment grade of an urban neighbourhood. Also, this fixed weighting system developed will provide an economic solution as well as a long-lasting planning solution to issues within urban spaces. There are a total of 105 sub-indicators and the assessment system is scored based on the amount of indicators achieved. Each indicator will have an even grade which is 1 point for 1 sub-indicator. A typical example of the grading below showcases the summation of sub-indicators for the environmental sustainability dimension in Table 7 below.
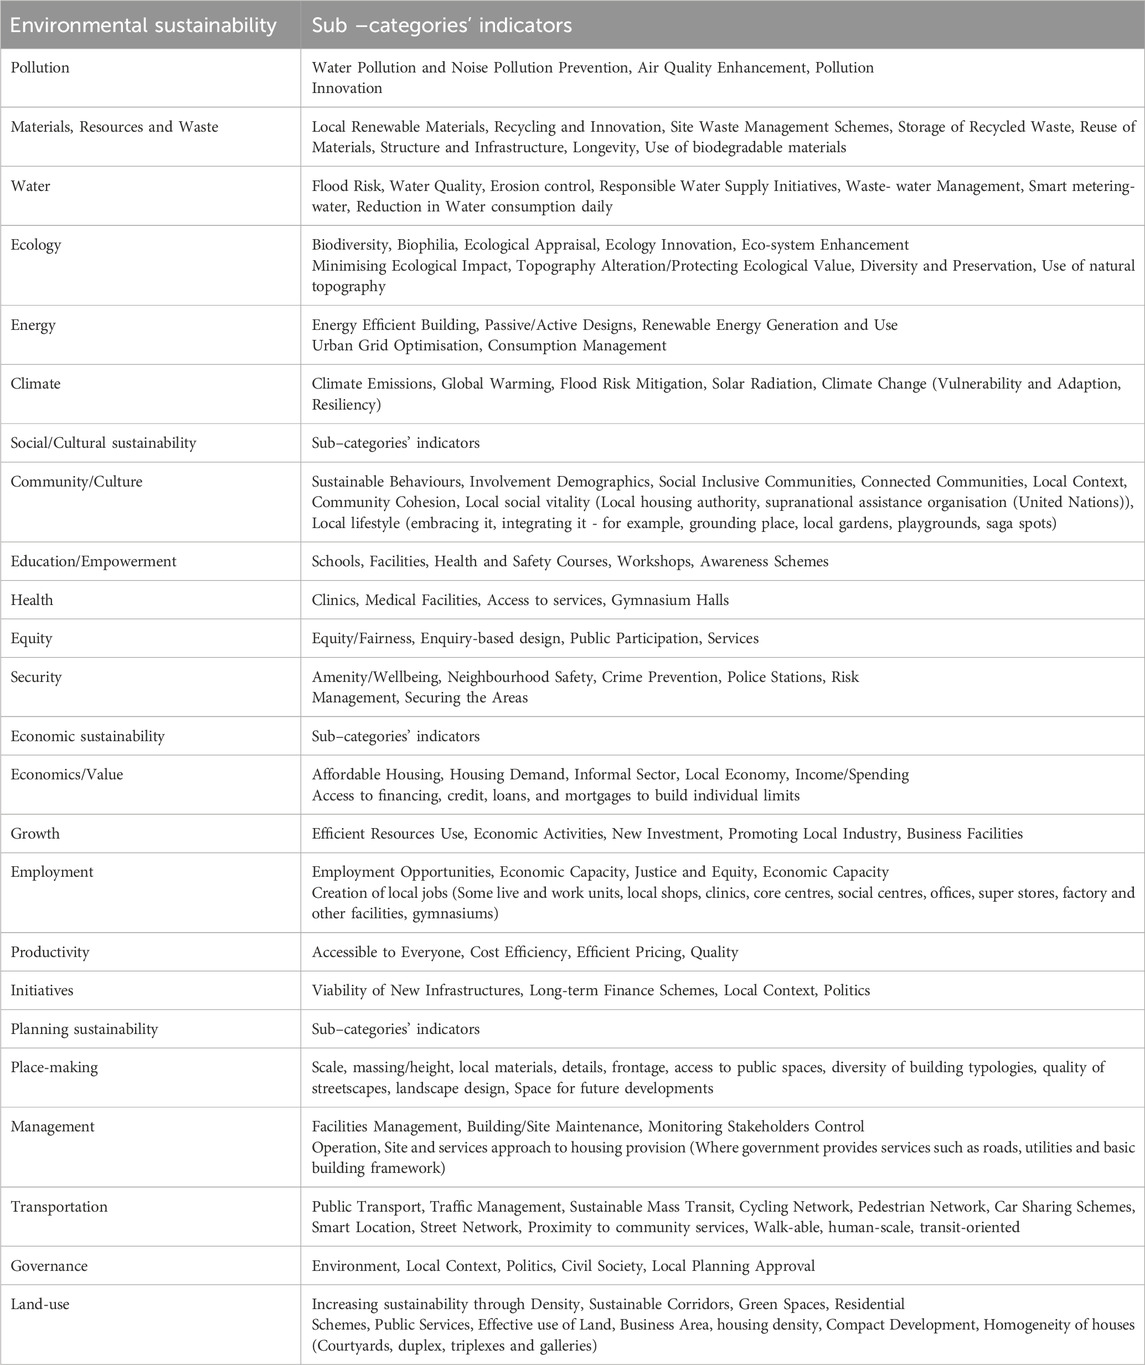
Table 6. Sub-categories indicators selected for Environmental, Social/Cultural, Economic and Planning Sustainability developed for SUCCEED (It includes 21 core categories and 105 sub-indicators).

Table 7. Typical example of assessing a core sustainability dimension.
In Table 8 the grading system begins with Level 0 which is Below Standard or Fair (0–20 sub-indicators) (0%–19%), Level 1 Insufficient or Needs Improvement (21–35 sub-indicators) (20%–39%), Level 2 Satisfactory (21–35 sub-indicators) (40%–59%), Level 3 Good (36–50 sub-indicators) (60%–69%), Level 4 Excellent (61–85 sub-indicators) (70%–89%) and lastly Level 5 Advanced or Exceeds Standards (86–105 sub-indicators) (90%–100%) see Table 8 below as reference to this explanation. The selection of the grade level is based on the total grade passed in all four core dimensions and 105 sub-indicators.
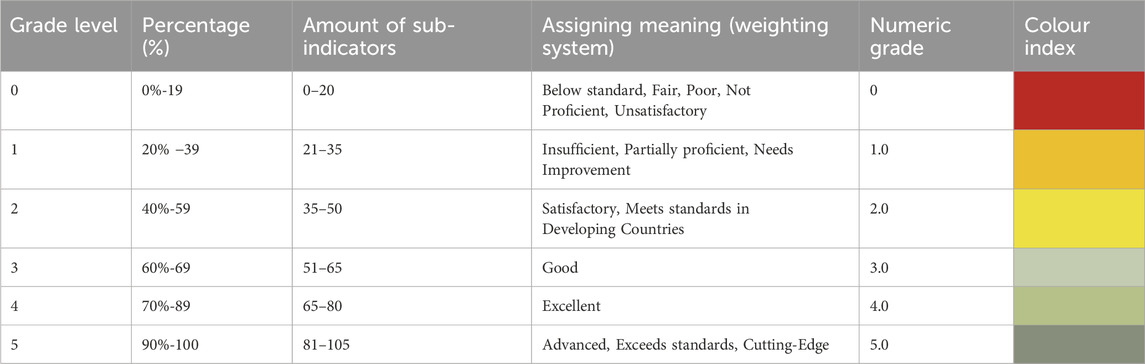
Table 8. SUCCEED Tool grading system.
5 Conclusion and discussion
Sustainable urban development can be defined as meeting the needs and aspirations of both present and future generations along both intra-generational and inter-generational timelines through policy implementation, urban design intervention, and application of sustainability assessment tools into the urban environment (Pollesch and Dale, 2015). Sustainable urban development is the main underpinning approach to achieving the United Nations Sustainable Development Goals. Assessment tools are the connection for the successful implementation of the respective SDGs. SIs are vital in assessing different levels of sustainability attained within a development which is essential in achieving the sustainability goals and targets of development (Esty et al., 2006).
This research paper complements the developed SUCCEED assessment tool as an efficient assessment method and affirms its practicality in its implementation in developing county like Nigeria. Also, due to the fact that most developing countries share similar factors and criteria the tool would be adaptable in other developing countries across the globe. The tool was developed to create and ensure that urban projects are effectively, efficiently, economically and ethically achieved. The tool was designed based on a group of experts through a collaborative process and can be used by any professional that understands the concept of sustainability assessment based on proper training. The implementation and evaluation process of the tool is important for improvements of projects, both proposed and existing. The SUCCEED system is an innovative tool and is recommended to be adopted in developing countries. Also, due to the fact that most urban spaces in developing countries are in their early stage of urban development, this creates an opportunity because the country is currently battling with urban planning problems and challenges in the sense that most of the major cities are growing exponentially.
In the design of the SUCCEED assessment tool, it is vital to note that sustainability assessment tool development requires various methods which include interviews, Delphi methods, and questionnaires to rank and select the most important SIs. The process of its design should be clear and the assessment exercise should communicate interpretable results for both professionals and non-professionals within the built environment. Based on this study it is clear that determining a weighting and aggregation method is very complex. When developing an assessment tool it is vital to select a method that would suit the aim and objectives of that assessment tool. Weighting techniques highlighted in this research include Uniform weighting, Numbers-based weighting, and Professionals-based weighting while aggregation techniques include Summative aggregation methods and combined methods. It is imperative to note that each weighting and aggregation method has its advantages and disadvantages and it should be used in various circumstances. SUCCEED assessment tool utilised both uniform weighting and summative methods in its development which has been very successful. The SIs selection was based on 4 main sustainability dimensions, 21 category indicators, and 105 sub-category indicators. In the context of developing countries where sustainability assessment is currently gaining ground, this study has developed/validated five fundamental approaches in the development of assessment tools for developing countries.
• Step 1: Define the aim/purpose of developing the sustainability assessment tool (building, city, urban scale)
• Step 2: Conduct a review of existing tools in both developed and developing regions to identify a list of SIs.
• Step 3: Validate the list through Delphi methods, focus groups, questionnaires, or any iterative methods.
• Step 4: Select the weighting and aggregation method that suits this assessment tool. It is important to use both uniform weighting and summative aggregating methods as it simplifies the complexity in the development of an assessment tool.
• Step 5: Carry out a comprehensive evaluation of the built SIs and test the tool on a developed or existing project.
The contribution to knowledge and outcome of this study has validated the importance of selecting both uniform weighting and summative aggregation methods. It was found that the indicators in SUCCEED tools contain relevant indicators that can be used in developing and resolving problems found in urban spaces in Nigeria. Recommendations for future works include the following.
• Application of SUCCEED in other projects rather than neighbourhood schemes.
• Developing software or applications for the SUCCEED Tool
• Collaboration with other closely related assessment tools
In summary, sustainability implementation can resolve most problems arising from urbanisation. The successful adaptation of this methodology could lead to a successful adaptation of sustainable urbanism and its principles (Sachs, 2015).
Author contributions
JM: Writing–original draft, Writing–review and editing. OI: Writing–review and editing. RS: Methodology, Writing–review and editing. LO: Investigation, Writing–review and editing. BY: Investigation, Writing–review and editing. YI: Investigation, Writing–review and editing.
Funding
The author(s) declare that no financial support was received for the research, authorship, and/or publication of this article.
Conflict of interest
The authors declare that the research was conducted in the absence of any commercial or financial relationships that could be construed as a potential conflict of interest.
Publisher’s note
All claims expressed in this article are solely those of the authors and do not necessarily represent those of their affiliated organizations, or those of the publisher, the editors and the reviewers. Any product that may be evaluated in this article, or claim that may be made by its manufacturer, is not guaranteed or endorsed by the publisher.
References
Alqahtany, A. M., Rezgui, Y., and Li, H. (2013). A proposed model for sustainable urban planning development for environmentally friendly communities. Archit. Eng. Des. Manag. 9 (3), 176–194. ISSN 1745-2007. doi:10.1080/17452007.2012.738042
Alwaer, H., Bickerton, R., and Kirk, R. D. (2014). Examining the components required for assessing the sustainability of communities in the UK. J. Archit. Plan. Res. (in press).
Alwaer, H., Sibley, M., and Lewis, J. (2008). Factors and priorities for assessing sustainability of regional shopping centres in the UK. J. Archit. Sci. Rev. 51 (4), 391–402. doi:10.3763/asre.2008.5143
Appu, H. (2012). Towards sustainable urban communities. J. Environ. Impact Assess. Rev. 32 (1), 165–169. doi:10.1016/j.eiar.2011.08.002
Arranz-López, A., Soria-Lara, J. A., López-Escolano, C., and Campos, Á. P. (2017). Retail Mobility Environments: a methodological framework for integrating retail activity and non-motorised accessibility in Zaragoza, Spain. J. Transp. Geogr. 58, 92–103. doi:10.1016/j.jtrangeo.2016.11.010
Atkinson, C., Yates, A., and Wyath, M. (2009). An introduction to its definition and measurement. London: BRE Press.
Ayyoob, S., and Yoshiki, Y. (2016). “Urban resilience assessment: multiple dimensions, criteria, and indicators,” in Advanced sciences and technologies for security applications (Springer International Publishing Switzerland). doi:10.1007/978-3-319-39812-9_13
Balsas, C. J. L. (2004). Measuring the livability of an urban centre: an exploratory study of key performance indicators. Plan. Pract. Res. 19 (1), 101–110. doi:10.1080/0269745042000246603
Becker, J. (2004). The shopping Centres Industry: it is important to the UK Economy. London: British Council of shopping centres.
Booysen, F. (2002). An overview and evaluation of composite indices of development. J. Soc. Indic. Res. 59, 115–151. doi:10.1023/a:1016275505152
Bullen, P. S. (2013). Handbook of means and their inequalities. Springer Science and Business Media.
Cadima, J., and Jollife, I. T. (2009). On relationship between uncentred and column-centred principal component analysis. Pak. J. Stat. 25, 474–503. doi:10.1098/rsta.2015.0202
Cesar, P., and Ryan, Y. (2015). Potential benefits of developing and implementing environmental and sustainability rating systems: making the case for the need of diversification. Int. J. Sustain. Built Environ. 4, 1–11. doi:10.1016/j.ijsbe.2014.12.003
Chen, L., and Pu, P. (2004). Survey of preference elicitation methods. Ecole politechnique federale de lausanne. Lausanne, Switzerland: EPFL.
Cherchye, L., Moesen, W., Rogge, N., and Van Puyenbroeck, T. (2007). An introduction to “benefit of the doubt” composite indicators. Indic. Res. 82 (1), 111–145. doi:10.1007/s11205-006-9029-7
Dalman, J. (2002). “Key factors and Indicators how do we use them?,” in Proceedings of sustainable building SB (2002) in Oslo (Rotterdam: In-house publishing).
Deakin, M., Curwell, S., and Lombardi, P. (2002). Sustainable urban development: the framework and directory of assessment methods. J. Environ. Assess. Manag. Policy 4 (2), 171–197. doi:10.1142/s1464333202000978
Dietz, S., and Neumayer, E. (2007). Weak and strong sustainability in the SEEA: concepts and measurement. Ecol. Econ. 61, 617–626. doi:10.1016/j.ecolecon.2006.09.007
Esty, D. C., Levy, M. M. A., Srebotnjak, T., De Sherbinin, A., Kim, C. H., and Anderson, B. (2006). Environmental performance index. New Have: Yale Centre for Environmental Law and Policy.
EU Commission (2022a). Competence centre on composite indicators and scoreboards. European commission website. Step 6: aggregating. Available at: https://knowledge4policy.ec.europa.eu/composite-indicators/10-step-guide/step-6-weighting_en (Assessed October 08, 2023).
EU Commission (2023b). Competence centre on composite indicators and scoreboards. European commission. Step 7: aggregating indicators. Available at: https://knowledge4policy.ec.europa.eu/composite-indicators/10-step-guide/step-7-aggregating-indicators_en (Assessed October 15, 2023).
European Environment Agency (EEA) (2023). Urban Sustainability:How can cities become sustainable? Available at: https://www.eea.europa.eu/themes/sustainability-transitions/urban-environment (Assessed October 19, 2023).
Gan, A., Fernandez, I., Guo, J., Wilson, M., Zhao, Y., Zhou, B., et al. (2017). When to use what: methods for weighting and aggregating sustainability indicators. Publ. J. Ecol. Indic. 81, 491–502. doi:10.1016/j.ecolind.2017.05.068
Giradet, H. (2015). “Ecopolis'- the regenerative city,” in Low carbon cities (Oxon: Routledge), 59–74.
Hardi, P., and Zdan, T. (1997). Assessing sustainable development: principles in practice. Winnipeg, Manitoba: International Institute for Sustainable Development.
Hedvig, N. (2017). Weighting methods (I) principal component analysis COIN (2017) - 15th JRC annual training on composite indicators and scoreboards 06-08/11/2017, ispra (IT) the European commission’s competence centre on composite indicators and scoreboard.
Huang, L., Wu, J., and Yan, L. (2015). Defining and measuring urban sustainability: a review of indicators. Landsc. Ecol. 30, 1175–1193. doi:10.1007/s10980-015-0208-2
Husam, A. (2006). Regional shopping centres in the UK: sustainability indicators and application of an assessment model. A PhD thesis submitted in accordance with the Requirements of the University of Liverpool for the degree of Doctor in Philosophy. Available at: http://www.jstor.org/stable/43031021.
Husam, A., Bickerton, R., and Kirk, R. D. (2013). Examining the components required for assessing the sustainability of communities in the UK. J. Archit. Plan. Res.
Jollands, N. (2005). How to aggregate sustainable development indicators: a proposed framework and its application. Int. J. Agric. Resour. Gov. Ecol. 5 (1), 18–34. doi:10.1504/ijarge.2006.008163
Joseph, F., Tarsha, E., and Herbert, F. (2012). A framework for sustainability indicators at EPA national Risk management research laboratory. U.S Environmental Protection Agency. EPA/600/R/12/6871 October 2012/www.epa.gov/org. Available at: https://www.epa.gov/sites/default/files/2014-10/documents/framework-for-sustainability-indicators-at-epa.pdf.
Kaur, H., and Garg, P. (2019). Urban sustainability assessment tools: a review. Publ. J. Clean. Prod. 210 (2019), 146–158. doi:10.1016/j.jclepro.2018.11.009
Lee, Y. (2012). “Indicators for Sustainability” How cities are monitoring and evaluating their success. Ottawa, Canada: Canadian International Development Agency.
Lisa-Britt, F., and Jens, N. (2016). Importance of actors and agency in sustainability transitions: a systematic exploration of the literature. J. Sustain. 8 (Issue 5), 476. doi:10.3390/su8050476
Lombardi, P., and Cooper, I. (2009). The challenge of the eAgora metrics: the social construction of meaningful measurements. Int. J. Sustain. Dev. 12 (2), 210–222. doi:10.1504/ijsd.2009.032778
Michael, K. (1998). “Weak and strong sustainability indicators and regional environmental resources,” in Conference Paper presented at the 38th European Regional Science Association Congress, Vienna, Aug. 28 to Sept. 1, 1998.
Mike, H., and Simon, M. (2010). Can cities shape socio-technical transitions and how would we know if they were? J. Res. policy 39 (2010), 477–485. doi:10.1016/j.respol.2010.01.020
Mikulić, J., Kožić, I., and Krešić, D. (2015). Weighting indicators of tourism sustainability: a critical note. Ecol. Indic. 48, 312–314. doi:10.1016/j.ecolind.2014.08.026
Moher, D., Liberati, A., Tetzlaff, J., and Altman, D. (2009). Preferred reporting items for systematic reviews and meta-analyses: the PRISMA statement. PLoS Med. 6 (7), e1000097. doi:10.1371/journal.pmed.1000097
Momoh, J. (2016). Sustainable urbanism and its assessment in developing countries: the Nigerian case. Unpublished PhD thesis. Nottingham, England: Nottingham Trent University.
Morelli, J. (2011). Environmental sustainability: a definition for environmental professionals. J. Environ. Sustain. 1 (Issue 1), 1–10. Article 2. doi:10.14448/jes.01.0002
Mori, K., and Christodoulou, A. (2012). Review of sustainability indices and indicators: towards a new city sustainability index (CSI). Environ. Impact Assess. Rev. 32 (1), 94–106. doi:10.1016/j.eiar.2011.06.001
Munda, G. (2005). “Measuring sustainability”: a multi-criterion framework. J. Dev. Sustain. 7 (1), 117–134. doi:10.1007/s10668-003-4713-0
Nabiollah, K., Mohammadi, M., and Fahimeh, N. (2015). Smart growth theory as one of the main paradigms of sustainable city. Int. J. Rev. Life Sci. 5 (9). JK Welfare and Pharmascope Foundation.
Nardo, M., Saisana, M., Saltelli, A., and Tarantola, S. (2005). Tools for composite indicators building. European commission, EUR 21682 EN (2005). Ispra, Italy: Institute for the Protection and Security of the Citizen.
OECD (2008). Handbook on constructing composite indicators: methodology and user guide. Ispra, Italy: OECD publishing.
Pablo, A., Daniel, B., Matthieu, B., and Marwa, B. (2023). SDG tracker: measuring progress towards the sustainable development goals. J. Our World Data. Available at: https://ourworldindata.org/sdgs.
Park, J., and Cai, H. (2017). WBS-based dynamic multi-dimensional BIM database for total construction as-built documentation. Automation Constr. 77, 15–23. doi:10.1016/j.autcon.2017.01.021
Pollesch, N., and Dale, V. (2015). Applications of aggregation theory to sustainability assessment. J. Ecol. Econ. 114, 117–127. doi:10.1016/j.ecolecon.2015.03.011
Reed, R., Wilkinson, S., and Anita, B. (2011). “A comparison of international sustainable building tools – an update,” in The 17th Annual Pacific Rim Real Estate Society Conference, Gold Coast, 16-19 January, 2011.
Ringner, M. (2008). What is principal component analysis? Nat. Biotechnolgy. 26, 303–304. doi:10.1038/nbt0308-303
Roberts, P. (2009). “Sustainable communities: policy, practice and professional development: a model for europe,” in Sustainable urban development: changing professional practice (2009). Editor S. M. Cooper I (Oxon: Routledge), 127–144.
Rowley, H. V., Peters, G. M., Lundie, S., and Moore, S. J. (2012). Aggregating sustainability indicators: beyond the weighted sum. J. Environ. Manage. 111, 24–33. doi:10.1016/j.jenvman.2012.05.004
Saisana, M., and Tarantola, S. (2002). State of the art report on current methodologies and practices for composite indicator development citeseer.
Sharifi, A. (2022). An overview and thematic analysis of research on cities and the COVID-19 pandemic: toward just, resilient, and sustainable urban planning and design. J. iSceince 25 (11), 105297. doi:10.1016/j.isci.2022.105297
Simon, B., and Stephen, M. (2008). “Sustainability indicators measuring the immeasurable” first edition published by earth scan in the UK and USA.
Singh, R. K., Murty, H., Gupta, S., and Dikshit, A. (2009). An overview of sustainability assessment methodologies. J. Ecol. Indic. 9 (2), 189–212. doi:10.1016/j.ecolind.2008.05.011
Solomon, A., Vincent, O., Dumiso, M., and Husam, A. (2019). “A review of selected neighbourhood sustainability assessment frameworks using the Bellagio STAMP,” in International journal of building pathology and adaptation, 2398–4708. United Kingdom: Emerald Publishing Leeds.
Tim, D. (2011). Sustainable urban development to 2050: complex transitions in the built environment of cities. Oxford Institute for Sustainable Development, Oxford Brookes University Retrofit. 2050 Working Paper.
UKGBC (2023). Net zero whole life carbon roadmap progress report. A pathway to net zero for the UK built environment. Available at: https://ukgbc.org/our-work/topics/whole-life-carbon-roadmap/(Accessed May 11, 2024).
Van Haaster, B., Ciroth, A., Fontes, J., Wood, R., and Ramirez, A. (2017). Development of a methodological framework for social lifecycle assessment of novel technologies. Int. J. Life Cycle Assess. 22 (3), 423–440. doi:10.1007/s11367-016-1162-1
Warhurst, A. (2002). “Sustainability indicators and sustainability performance management,” in Report to the project: mining, minerals and sustainable development (MMSD) (England: International Institute for Environment and Development (IIED) Warwick). Available at: http://www.iied.org/mmsd/mmsd_pdfs/sustainability_indicators.pdf.
Wilson, M. C., and Wu, J. (2017). The problems of weak sustainability and associated indicators. Int. J. Sustain. Dev. World Ecol. 24 (1), 44–51. doi:10.1080/13504509.2015.1136360
Wu, J. (2013). Landscape sustainability science: ecosystem services and human well-being in changing landscapes. Landsc. Ecol. 28 (6), 999–1023. doi:10.1007/s10980-013-9894-9
Wu, J., and Wu, T. (2012). Sustainability indicators and indices: an overview. Handbook of Sustainable Management. London: Imperial College Press, 65–86.
Keywords: aggregating, assessment tools, developing countries, neighbourhoods, sustainability Indicators, weighting systems, neighbourhood sustainability assessment
Citation: Momoh J, Ige O, Seidu R, Ogbenjuwa L, Young B and Ibraheem Y (2024) Urban sustainability assessment: An analysis of how weighting and aggregating coefficient system was used in the development of SUCCEED assessment tool for developing countries. Front. Built Environ. 10:1413757. doi: 10.3389/fbuil.2024.1413757
Received: 07 April 2024; Accepted: 31 May 2024;
Published: 26 June 2024.
Edited by:
Onuegbu Ugwu, Alex Ekwueme Federal University, Ndufu- Alike, NigeriaReviewed by:
Hasim Altan, Prince Mohammad Bin Fahd University, Saudi ArabiaMuhammad Afzal, Norwegian University of Science and Technology, Norway
Copyright © 2024 Momoh, Ige, Seidu, Ogbenjuwa, Young and Ibraheem. This is an open-access article distributed under the terms of the Creative Commons Attribution License (CC BY). The use, distribution or reproduction in other forums is permitted, provided the original author(s) and the copyright owner(s) are credited and that the original publication in this journal is cited, in accordance with accepted academic practice. No use, distribution or reproduction is permitted which does not comply with these terms.
*Correspondence: Job Momoh, bW9tb2hqQGxzYnUuYWMudWs=