1 Introduction
The piezocone (CPTu) dissipation test is used in geotechnical engineering and environmental engineering to characterize how the applied load from the penetrating cone is distributed between the soil and pore fluid during both penetrometer advancement and when penetration is paused. The test is performed by pausing cone penetration and monitoring excess porewater pressure () dissipation with time at discrete locations on the cone penetrometer. The soil coefficient of consolidation and hydraulic conductivity, which the CPTu dissipation test interprets, control the rate at which the porewater pressure enables stress transfer from the pore fluid to the soil skeleton.
Many commonly used CPTu dissipation interpretation methods assume that radial dissipation dominates the measured response (e.g., Teh and Houlsby, 1991; Burns and Mayne, 1998), and therefore, interpretation yields estimates for the horizontal coefficient of consolidation () and the horizontal soil permeability (). However, subsequent studies note that vertical migration contributes to the CPTu dissipation test response, including Chai et al. (2014), Agaiby and Mayne (2018), and Tsegaye (2021). In particular, Agaiby and Mayne (2018) note that the interpreted coefficient of consolidation reflects hydraulic properties in both vertical and horizontal directions and, therefore, term the interpreted value to be Therefore, may be over or underestimated depending on the soil’s vertical hydraulic conductivity () and hydraulic conductivity anisotropy (i.e., ). Although the influence of and vertical migration is recognized, no current methods for CPTu dissipation test interpretation explicitly account for these properties when interpreting CPTu dissipation tests.
Numerical investigations into porewater pressure dissipation following undrained penetration are one of the primary tools for understanding the mechanics of the CPTu dissipation test and developing and validating methods to interpret the test results. These investigations include indirect and direct approaches to simulate cone penetration. Indirect methods capture cone penetration loading as a cylindrical or spherical cavity expansion problem (e.g., Burns and Mayne, 1998; Imre et al., 2010). These are relatively simple approaches that can often capture distributions around the cone with closed-form equations; however, the full loading condition from the penetrating cone is not captured, and porewater pressure migration is limited to the radial direction only. Direct penetration models simulate the full penetration loading condition on the surrounding soil and allow porewater pressure migration to occur vertically and radially. However, continuum methods (i.e., finite element or finite difference models) must accommodate large soil deformations around the penetrating cone, or mesh entanglement and other numerical errors will occur before reaching steady-state penetration conditions. Therefore, numerical techniques must be implemented to accommodate these large deformations. Continuum direct penetration models to study CPTu dissipation tests have been performed with the strain path method (Teh and Houlsby, 1991), a smooth cone-soil interface (Abu-Farskah et al., 2003), the press-replace method (Lim et al., 2019), the ABAQUS non-linear geometry option (Ansari et al., 2014; Deng et al., 2023), arbitrary Lagrangian Eulerian (ALE) techniques (Chai et al., 2012; Mahmoodzadeh et al., 2014; Liu et al., 2022), and material point methods (Ceccato and Simonini, 2016). These previous numerical dissipation studies used simple soil models such as Mohr Coulomb or modified Cam clay that do not fully capture the response of undrained clay to cone penetration loading, as shown in Moug et al. (2019).
Of the above studies, only Abu-Farskah et al. (2003) and Lim et al. (2019) studied the role of during CPTu dissipation; the two studies yielded conflicting results. Abu-Farskah et al. (2003) found that does affect the and dissipation responses comparing simulations of and ; while Lim et al. (2019) found no effect of on the dissipation curve. This study addresses the knowledge gap regarding the contribution of vertical porewater pressure dissipation when interpreting by elucidating the role of on CPTu dissipation tests and how should be considered for interpretation.
This study uses a direct, axisymmetric cone penetration model, ALE techniques, and an advanced constitutive model to investigate soil-water interactions during CPTu dissipation. The direct axisymmetric cone penetration model is implemented in the finite difference program FLAC and accommodates large deformations around the penetrating cone with a user-implemented ALE algorithm. An advanced elastoplastic bounding surface constitutive model, MIT-S1 (Pestana and Whittle, 1999), is calibrated for Boston blue clay (BBC) to capture anisotropic saturated clay behavior. This numerical model, specifically the combination of a large deformation direct penetration simulation and the use of a complex anisotropic soil model, differs from previous numerical studies of CPTu dissipation since it uses a direct penetration model that can capture the full loading condition around the penetrating cone, and can capture the anisotropic shear strength behavior and shear-induced of saturated clay. Therefore, this numerical study is a step forward to improve theoretical understanding of piezocone dissipation tests in saturated clay. This study investigates the role of and during piezocone dissipation tests. Specifically, this study examines how affects the dissipation responses at the cone tip ( position) and the cone shoulder ( position) to suggest an approach to estimate and that accounts for vertical migration. CPTu dissipation following undrained penetration is examined for BBC with ranging from 1 to 10. Simulations are performed for undrained penetration in saturated clay with OCR of 1, 2, and 4 to investigate if stress history affects the role of during CPTu dissipation tests.
2 Axisymmetric piezocone penetration and dissipation model
A direct axisymmetric cone penetration model with ALE to accommodate large deformations was used to simulate CPTu dissipation following steady-state undrained penetration in clay. The simulations were performed using the explicit finite difference program FLAC 8.0 (Fast Lagrangian Analysis of Continua; Itasca 2016) with the MIT-S1 constitutive model (Pestana and Whittle, 1999; Pestana et al., 2002) calibrated for BBC. Penetration was simulated with initial OCR of 1, 2, and 4.
2.1 Piezocone dissipation model
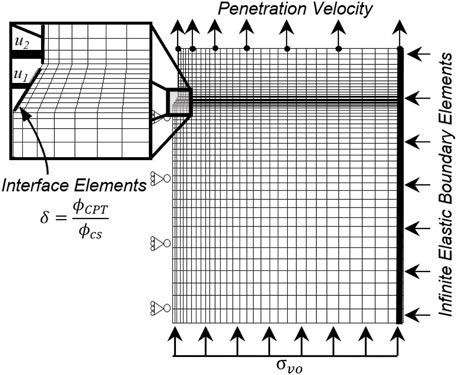
The axisymmetric model geometry simulates steady-state penetration at one depth in the soil column for a standard 10 cm2 cone as shown in Figure 1. The model is initialized with stress and material properties for the “wished-in-place” condition at the depth of interest in the soil column. Cone geometry and conditions between the cone and soil are captured with Mohr-Coulomb interface elements that obey the Mohr-Coulomb friction condition. The interface coefficient of friction () was set at 0.8, where 0.0 would represent a perfectly smooth cone and 1.0 would represent a perfectly rough cone. The stiffnesses of the shear and normal springs in these interface elements were set large enough that they had negligible effects on the solution (Itasca, 2016).
The penetration boundary conditions are specified for soil flowing upwards relative to a stationary cone; soil conceptually flows into the bottom of the model and exits at the top of the model. The in-situ vertical stress is applied across the bottom boundary, where this boundary is sufficiently far from the penetrating cone’s zone of influence that the in-situ stress condition prevails. The right radial boundary is represented with an infinite elastic boundary condition and is sufficiently far from the penetrating cone to avoid boundary effects (Moug, 2017). The model dimensions are 37 cone diameters in the radial direction, 37 cone diameters below the cone tip, and 5 cone diameters above the cone shoulder. The cone penetration velocity is applied to all gridpoints across the top boundary, with adjustments made to the gridpoint adjacent to the cone shaft to accommodate friction at the soil-shaft interface. Penetration is then simulated until steady-state penetration resistance, and steady-state stress and conditions around the penetrating cone are reached; for this work, steady-state stress and distributions were considered to be achieved after 30 cone diameters of simulated penetration, which is consistent with Lu et al. (2004). Piezocone dissipation is simulated by first bringing the simulated penetration velocity to zero, then re-assigning hydraulic properties and monitoring over the simulated time.
Groundwater seepage boundary conditions for simulated dissipation were a combination of no-flow, fixed porewater pressure, and leaky boundaries. A no-flow condition was assigned at the axisymmetric boundary (x = 0). In-situ static porewater pressures were fixed at the far radial boundary and the bottom horizontal boundary; these boundaries were far enough from the penetrating cone that conditions prevailed. A leaky boundary was implemented at the top of the model to allow seepage flow across the boundary. The leaky boundary is assigned by assuming that the distance to was the distance to the top of the water table and assuming a constant over this distance.
2.2 ALE for large deformations cone penetration
Large deformations during simulated penetration are addressed with a user-implemented ALE algorithm that performs rezoning and remapping operations throughout simulated penetration (Moug et al., 2019). The user-defined ALE algorithm is coupled with FLAC’s large deformation Lagrangian formulation to allow full penetration simulations and implementation with the MIT-S1 constitutive model. The ALE algorithm is implemented by simulating penetration for a time interval with FLAC’s standard Lagrangian deformation formulation. The rezoning step takes place before significant deformation of the model zones occurs; the rezoning step resets the model geometry to the “undeformed” or original condition. The Eulerian remapping step then maps the model properties from the deformed model zones onto the undeformed model zones; this step is implemented in FLAC through a user-defined language according to the approach in Pember and Anderson (2001) and adapted for FLAC as described in Moug (2017). The Lagrangian, rezoning, and Eulerian remapping steps are continued in succession until steady-state cone penetration conditions are reached.
2.3 MIT-S1 Boston Blue clay calibration
The MIT-S1 constitutive model is a bounding surface plasticity model that can capture soil behavior from sedimentary clays to clean sands (Pestana and Whittle, 1999; Pestana et al., 2002). Jaeger (2012) initially implemented the version of MIT-S1 used in this study, with some minor modifications to the model. Additional modifications to the MIT-S1 implementation for the penetration model in FLAC are described in Moug (2017). Cone penetration and piezocone dissipation are simulated using the MIT-S1 model to accurately capture the effects of anisotropic on the cone penetration problem, including the distribution; Moug et al. (2019) demonstrated the role of anisotropy on cone penetration tip resistance, stress distribution, and distribution.
2.4 Hydraulic properties
The soil-water properties assigned to the FLAC model aimed to capture CPTu dissipation following undrained penetration. The fluid bulk modulus () was assigned to be at least 10 times larger than the soil skeleton bulk modulus or equal to kPa, whichever was smaller. This was numerically advantageous since it results in an incompressible relative to the soil skeleton without compromising numerical efficiency as a large can result in a small dynamic timestep and long simulation times. The model remained completely saturated throughout penetration and dissipation simulations.
The and values during cone penetration were assigned to capture a completely undrained penetration response according to the normalized penetration velocity (DeJong and Randolph, 2012). and values during CPTu dissipation were coupled to the mechanical response through the House (2012) relationship:
where this log-linear relationship between and void ratio () was estimated with constant rate of strain consolidation tests on reconstituted BBC. represents the hydraulic conductivity at the void ratio , and represents the hydraulic conductivity at the void ratio . Similar relationships between and have been characterized by other researchers (e.g., Taylor, 1948; Dunn and Mitchell, 1984), however, the relationship in Eq. 1 was used for this study since it is specific to BBC. This relationship was incorporated into the CPTu dissipation simulations where and were updated throughout the simulations in response to simulated changes in .
Simulated dissipation tests were performed for a range of values where the lowest assigned hydraulic conductivities were and the highest assigned hydraulic conductivities were . These values of and are at least an order of magnitude higher than typical values for clayey soils (Kulhawy and Mayne, 1990). These higher-than-typical values allowed this study to be performed without having exceedingly long simulation times due to low values. The values were found not to compromise the objectives of this study, as discussed in the following section.
2.5 Model validation
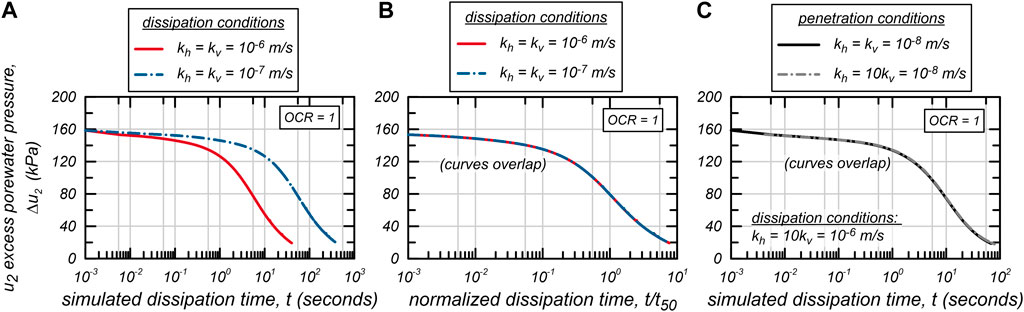
Dissipation was simulated with different and values from the same steady-state undrained penetration simulation for each OCR. This approach assumes that simulated dissipation patterns depend on the initial distribution and anisotropy during dissipation. Additionally, the approach assumes that dissipation is not affected by values during penetration if undrained conditions prevail. Therefore, CPTu dissipation curves shift in time proportionally to changes to when dissipation is simulated from the same initial state and with the same . This assumption is validated in Figures 2A, B. Figure 2A compares the resulting dissipation curves for and as dissipation versus simulated time. Figure 2B compares the same curves as dissipation versus simulated time normalized by the time to 50% dissipation () and shows that the curves normalize to an identical curve. Therefore, the assumption that patterns during CPTu dissipation tests and the shape of CPTu curves are not affected by magnitude during dissipation is reasonable for this study.
The assumption that the initial distribution is unaffected if undrained penetration is simulated is further examined in Figure 2C. The figure shows two dissipation curves. One dissipation curve was simulated following steady-state penetration in soil with m/s, and the other following steady-state penetration in soil with m/s. Dissipation for both cases was simulated with m/s. The resulting dissipation curves in Figure 2C are identical and validate the assumption that dissipation patterns are unaffected by / during penetration provided and are small enough for undrained conditions to exist.
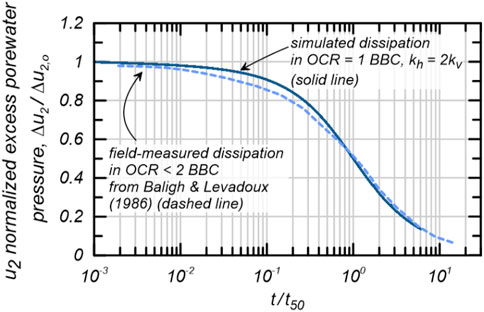
The CPTu simulations are further validated by comparing simulated results against a CPTu dissipation test performed in a BBC deposit. Figure 3 includes the published CPTu dissipation data from Baligh and Levadoux (1986) for BBC with an OCR less than 2 compared with simulated CPTu dissipation in BBC with OCR = 1. The tests are plotted as versus to normalize the curves for stress conditions and values. The close agreement indicates that the simulated CPTu dissipation tests in BBC can be used to study CPTu dissipation tests in normal clay.
3 Results of simulated piezocone dissipation
Dissipation following undrained steady-state cone penetration was simulated for BBC with OCR = 1, 2, and 4. The initial total vertical stress () and porewater pressure () for each case were 200 kPa and 100 kPa, respectively. Initial horizontal effective stress () was established based on OCR and lateral at rest coefficient of effective stress () for the MIT-S1 BBC calibration; values were 0.50, 0.60, and 0.80, for OCR = 1, 2, and 4, respectively. Dissipation was simulated for the initial conditions: m/s, m/s, m/s, m/s, and m/s. As discussed above, and were updated throughout dissipation and coupled to the mechanical soil response.
3.1 Simulated dissipation at u1 and u2 positions
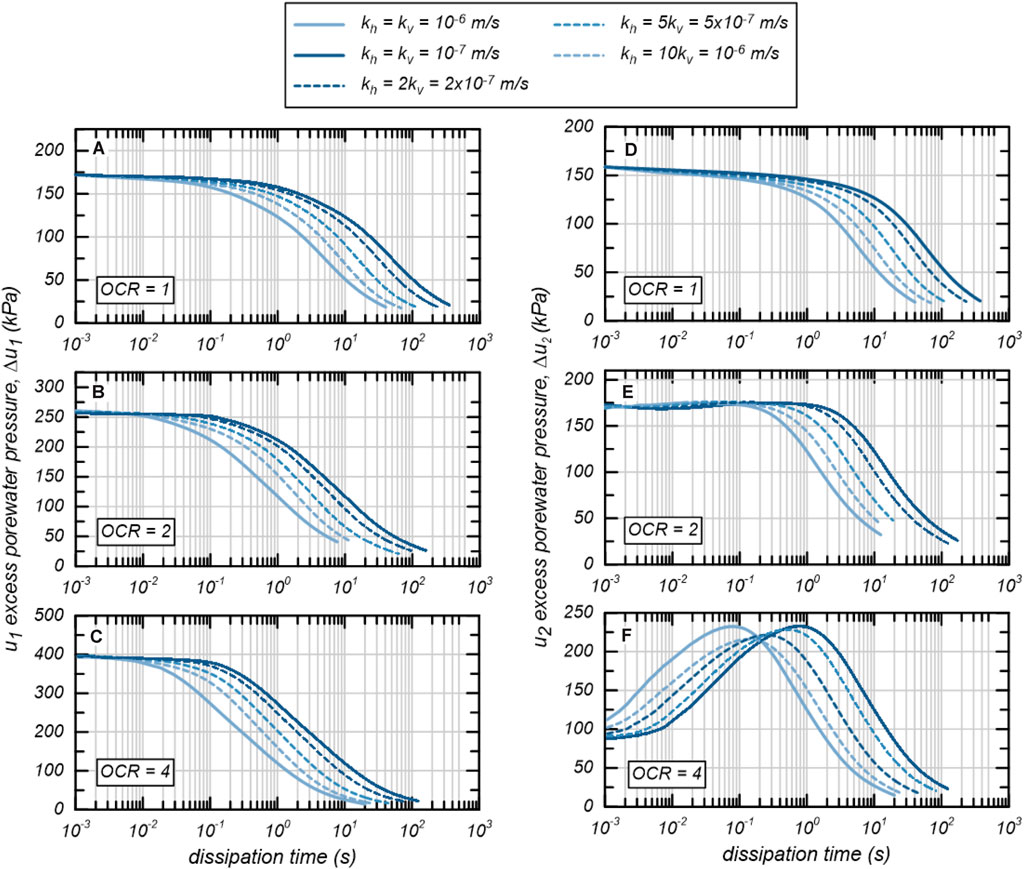
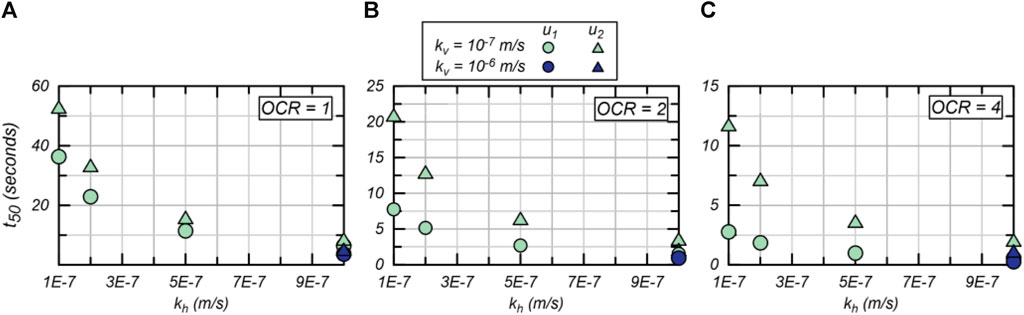
Dissipation over time was examined at the and positions. The dissipation curves show monotonic responses for all OCR conditions (Figures 4A–C), while the simulated dissipation curves result in monotonic or non-monotonic responses depending on initial OCR (Figures 4D–F). This is consistent with published CPTu tests where monotonic responses prevail at the position regardless of whether a monotonic or non-monotonic response is observed at the position (e.g., Chen and Mayne, 1994; Sully et al., 1999; Finke et al., 2001). The simulated results show a monotonic dissipation response for OCR = 1, which is consistent with most piezocone dissipation tests following undrained penetration in normally consolidated soils (e.g., Burns and Mayne, 1998). The simulated results for OCR = 2 show a slightly non-monotonic response where the difference between and is about 5 kPa for all simulated dissipation scenarios. The results for OCR = 4 show a strongly non-monotonic response where the difference between and is about 130–150 kPa. This is consistent with published dissipation traces in varying OCR conditions, including those published by Chai et al. (2014), that show a stronger non-monotonic response as OCR increases.
The non-monotonic response for OCR = 4 is affected by , where decreases as the ratio increases. Specifically, with is about 10% larger than for . These results indicate that vertical migration does affect the response, however, vertical migration is likely not the driving mechanism of non-monotonic dissipation responses since vertical migration is slightly suppressed for the case compared to the isotropic case.
Dissipation rates do increase as increases and is kept constant, as is expected. However, increases in dissipation rate, represented by , are less than the increase in . is the time to 50% dissipation from the or values at the start of the dissipation test and are directly related to the coefficient to consolidation in many common CPTu test interpretation methods (e.g., Teh and Houlsby, 1991; Agaiby and Mayne, 2018). Figure 5 plots the values for both and dissipation from the results in Figure 4 versus model-assigned values. For the non-monotonic responses for OCR = 4, the is the time to reach 50% of the peak from the time that the dissipation curve reaches its peak according to the Sully et al. (1999) correction. This correction for the non-monotonic tests results in a very small change to due to dissipation trends occurring over a log-time scale, and the results of this study are insensitive to this correction. The results show that increases of from conditions do not result in directly proportional changes to at either the or positions, indicating that and dissipation tests respond to both and .
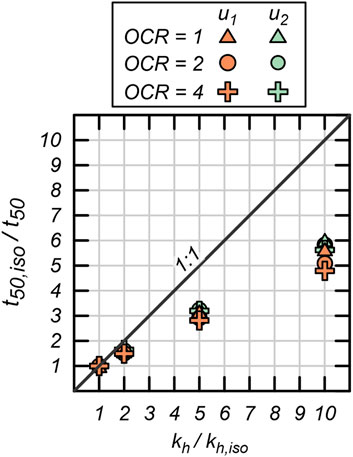
The contribution of vertical to reach for isotropic conditions () is about 40%–44% for the response and 43%–51% for the response. These values are interpreted from Figure 6, which plots the ratio of from ( to the for anisotropic conditions () against . The 1:1 line on Figure 6 represents where would plot if and increased isotropically. The values of vertical contribution are approximated by assuming that is dominated by horizontal migration for the conditions. For example, with OCR = 1 the for m/s is 40% smaller than the would be for conditions at the position, and 44% at the position. The contribution of vertical increases as OCR increases; these increases are addressed in detail in the discussion section below. The slightly greater contribution of vertical at the position is attributed to the gradients in the initial distribution during undrained cone penetration, which are discussed in the next section.
3.2 Excess porewater pressure distribution during piezocone dissipation
The distribution during undrained cone penetration and during dissipation is examined in this section. The distributions provide additional evidence that vertical migration contributes to and dissipation responses and should be considered for dissipation test interpretation, and that non-monotonic test responses are primarily due to horizontal migration.
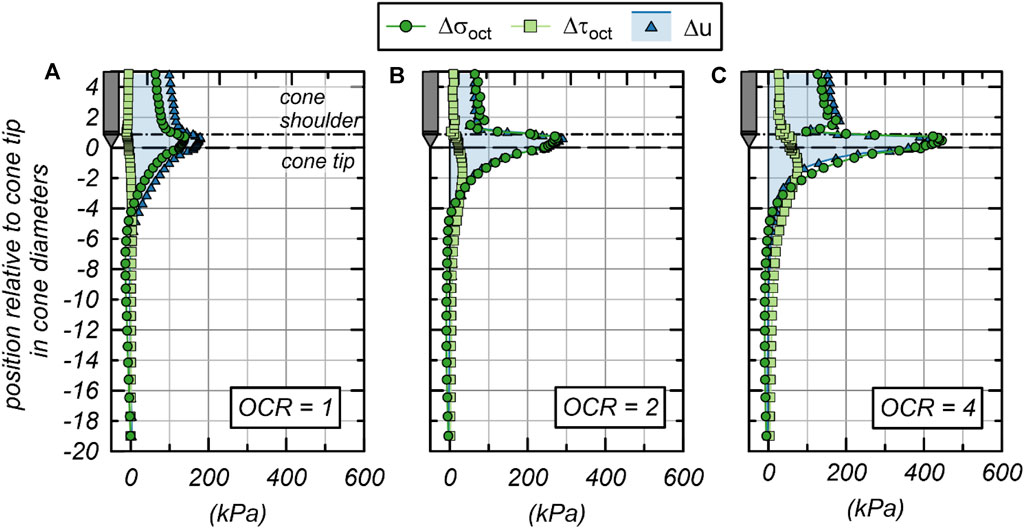
The field during undrained penetration is induced by a combination of changes in normal and shear stresses from initial static conditions that are dependent on OCR (e.g., Burns and Mayne, 1998; Krage and DeJong, 2016). This section examines how changes in octahedral normal total stress () and octahedral shear stress () relate to for the three initial conditions with OCR = 1, 2, and 4.
Figure 7 plots the steady-state undrained penetration profiles of , , and as soil transitions from initial conditions ahead of the penetrating cone, to the penetrating cone face, and then to the cone shaft. These profiles show that strongly relates to , and that large unloading from the cone face to the cone shoulder corresponds to differences between and . There is some contribution to from depending on OCR, though it is less than the contribution of . For OCR = 1, = 159 kPa and = 111 kPa at the position and = 172 kPa and = 132 at the position; therefore, causes an overall increase in . With OCR = 2, = 172 kPa and = 165 kPa at the position and = 262 kPa and = 261 kPa; therefore, there is minimal change in due to , which is consistent with constitutive behavior of OCR = 2 clay in shear loading. For OCR = 4, = 81 kPa and = 148 kPa at with position and = 407 kPa and = 422 kPa; there is a reduction in due to up to 2.5 cone diameters ahead of the cone tip, but the reduction is small compared to induced by . Figure 7 also shows that the position is in a transition area between the cone face and cone shaft; therefore, may not fully reflect loading conditions on either the cone face or cone shaft. This effect of this transition between the cone tip and cone shaft on the dissipation response is examined in Lim et al. (2019).
The decrease in from the cone face to the cone shoulder in Figure 7 possibly drives some vertical migration during dissipation from the cone tip to the cone shoulder. As OCR increases, the difference between and increases which causes a larger gradient between the cone face and cone shoulder. Between the and positions, reduces by about 8% for OCR = 1 from 172 kPa at to 159 kPa at ; 34% for OCR = 2 from 262 kPa at to 172 kPa at ; and 80% for OCR = 4 from 407 kPa at to 81 kPa at . This may relate to a more strongly non-monotonic dissipation response as OCR increases. Similarly, the gradient downward from the cone tip increases as OCR increases, which is consistent with the larger role of vertical migration at the position and as OCR increases.
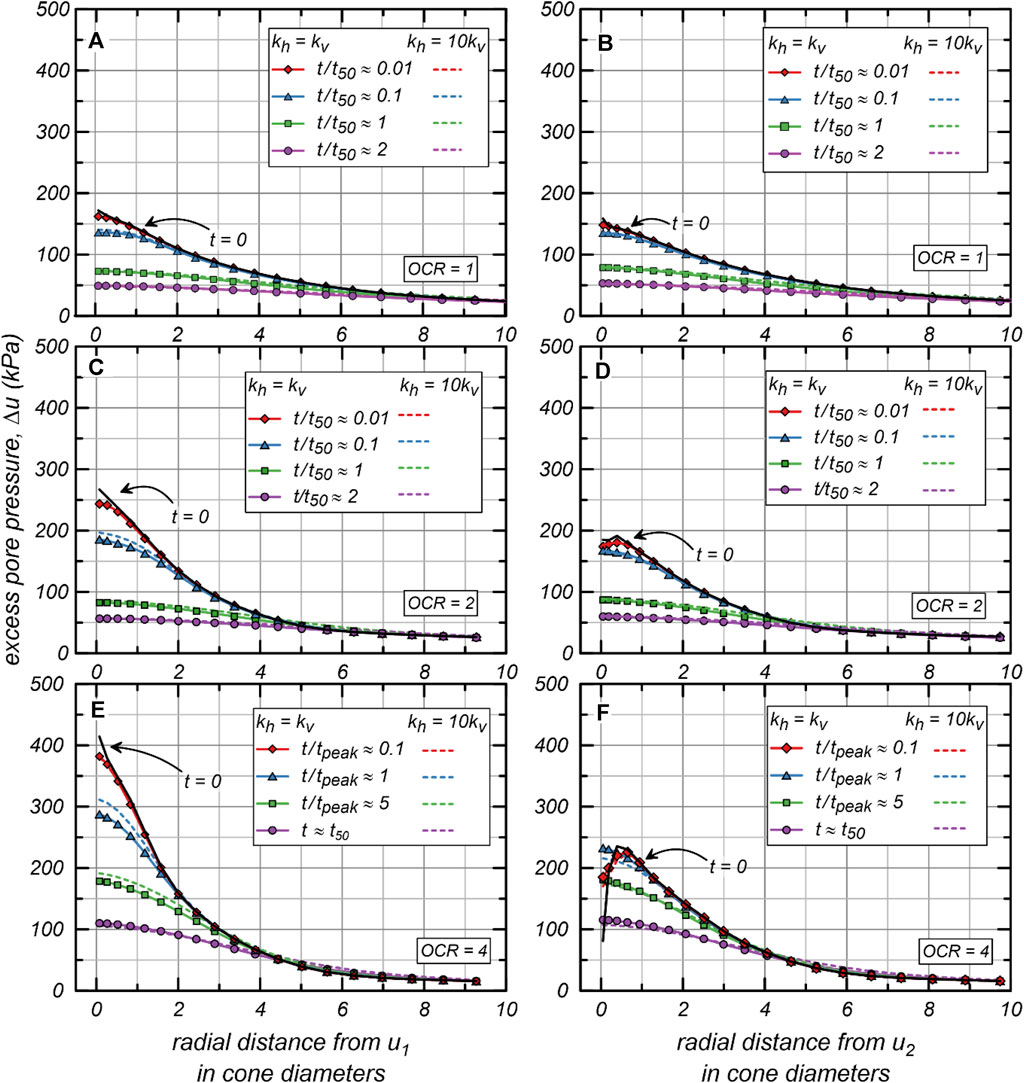
Radial distributions at steady state penetration conditions () and during simulated dissipation from and positions are plotted in Figure 8. Distributions for and m/s are presented to compare the soil response with isotropic and strongly anisotropic . Distributions are plotted for times relative to determined at the position for OCR = 1 and 2 and for the strongly non-monotonic response of OCR = 4. This provides insight into how soil response differs between monotonic and non-monotonic dissipation tests. Since the response of OCR = 2 is slightly non-monotonic, the distributions at are not considered for radial distributions. Distributions are plotted over a radial distance of 10 cone diameters from the simulated penetrometer, which is smaller than the influence zone but allowed examination of conditions near the penetrometer. For all OCR values, the initial distributions from the position are monotonic and remain so throughout dissipation (Figures 8A, C, E). The radial distribution from the position is initially monotonic and remains so throughout dissipation for OCR = 1 (Figure 8B). The radial distribution from for OCR is initially slightly non-monotonic with = 172 kPa and the maximum u in the distribution equal to 192 kPa; the distribution becomes monotonic by for OCR = 2 (Figure 8D) with = 167 kPa for both = 1 and 10. The radial u distribution from is initially non-monotonic for OCR = 4 with = 81 kPa and the maximum u equal to 235 kPa (Figure 8F); the distribution becomes monotonic by at which time = 232 kPa for and 216 kPa for .
The results in Figure 8 show that there are small differences in radial distributions between the and cases that are attributable to different contributions of vertical and horizontal migration. For OCR = 1 and 2, at is slightly larger at the cone face for the case ( = 74 kPa and 86 kPa for OCR = 1 and 2, respectively) than the case ( = 72 kPa and 82 kPa for OCR = 1 and 2, respectively); this is likely due to more vertical dissipation leading to lower for the isotropic case.
The OCR = 4 radial distributions for , , , and are shown in Figures 8E, F. These distributions indicate that both radial migration towards the position and vertical migration from the cone face to the cone shoulder contribute to the simulated non-monotonic responses. The initial distribution from the position is non-monotonic with the maximum value of 235 kPa generated at about 0.6 cone diameters from position. The distributions remain non-monotonic until , indicating that some radial redistribution towards the position contributes to the non-monotonic response. At and there are notable differences between the and cases, specifically, adjacent to the cone is larger at and smaller at for the case ( = 232 kPa and = 287 kPa at = 181 kPa and = 179 at ) compared to the case ( = 216 kPa and = 311 kPa at = 174 kPa and = 191 at ), which may be due to a larger contribution of vertical migration from the cone face to the cone shoulder for the isotropic case than for the anisotropic case.
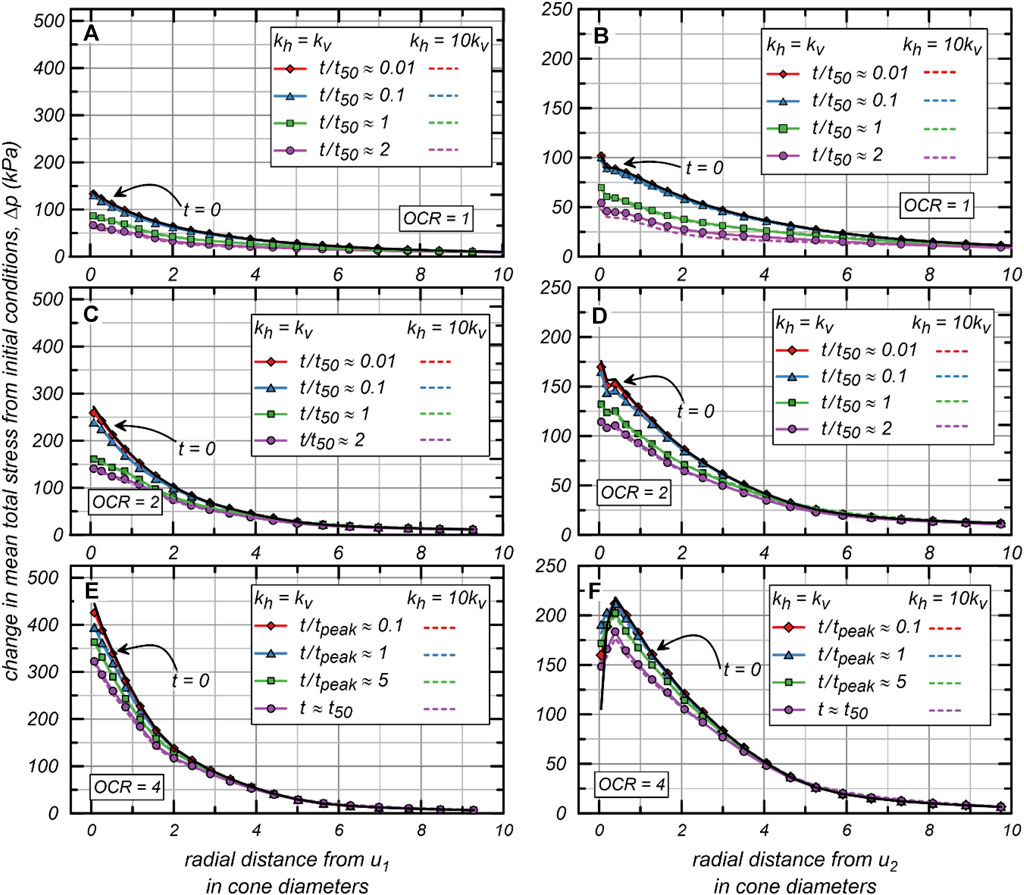
3.3 Mean total and effective stress during piezocone dissipation
Radial distributions of change in mean total stress from initial conditions () (plotted in Figure 9) show dependence on OCR and little dependence on . Mean total stress () unloading between the cone face and cone shoulder is evident in radial distributions and the magnitude of unloading increases as OCR increases, which is consistent with distributions in Figure 7. For OCR = 1 and OCR = 2, notable changes in distribution do not occur until ; at and there is an overall decrease in as soil consolidates around the penetrometer. Between the initial conditions and for OCR = 1, adjacent to the cone decreases from 101 kPa to 52 kPa at and from 137 kPa to 67 kPa at . Between the initial conditions and for OCR = 2, adjacent to the cone decreases from 176 kPa to 114 kPa at and from 272 kPa to 141 kPa at . For OCR = 4, changes in distribution primarily occur when . The radial distributions from for OCR = 4 (Figure 9F) are non-monotonic throughout dissipation with the distribution becoming less non-monotonic during dissipation. The initial at the position is 105 kPa with a maximum value of 248 in the radial distribution, by at the position is 148 kPa with a maximum value of 184 in the radial distribution. The non-monotonic distribution may be due to combined unloading from the cone face to cone shoulder and friction at the cone-soil interface. At the position for OCR = 1, the initial is 445 kPa and decreases to 323 kPa by .
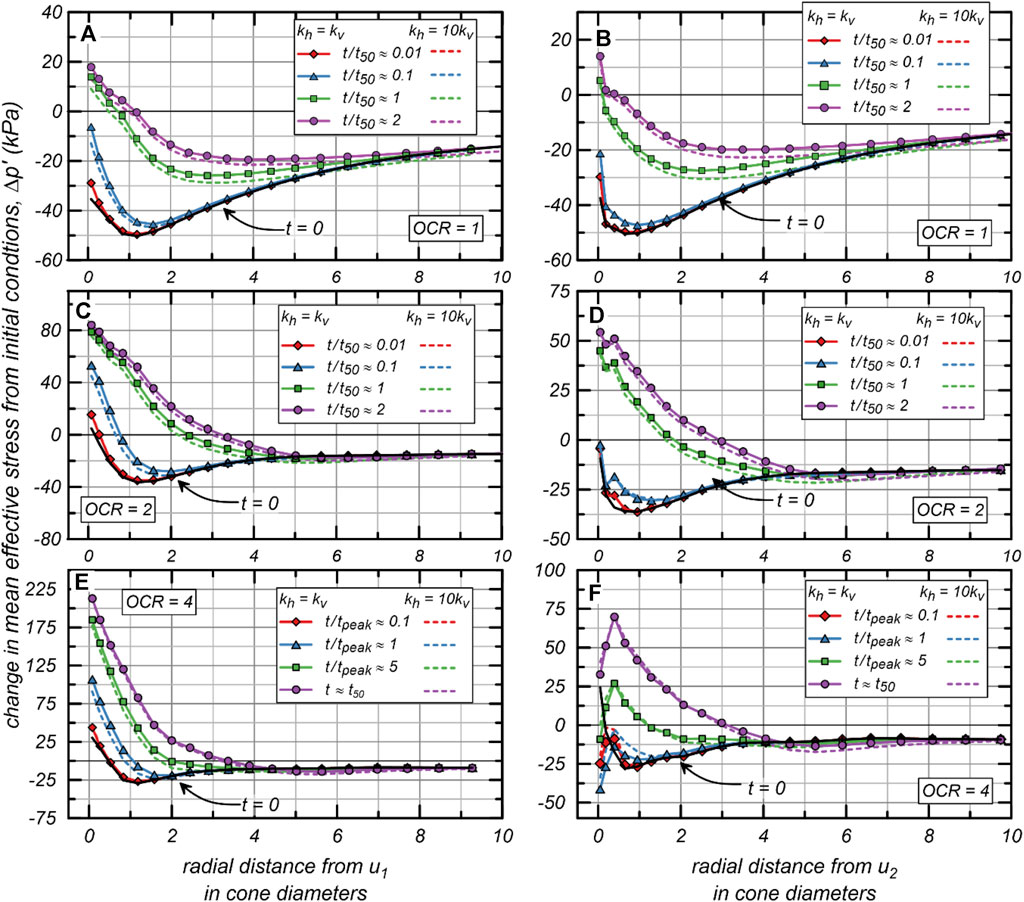
The radial distributions of change in mean effective stress from initial conditions () are plotted in Figure 10; these distributions are directly related to the distributions in and in Figures 8, 9, respectively. Therefore, the values during dissipation are affected by in the same way that distributions are affected by . Overall, radial distributions increase during consolidation around the piezocone and result in larger mean effective stress () near the cone than the initial conditions, this is consistent with loading from the penetrometer transferring from the pore fluid to the soil skeleton during dissipation and consolidation. This effect is stronger with increasing OCR, which leads to larger as OCR increases. For instance, the maximum from the position at is 5.2 kPa for OCR = 1, 45 kPa for OCR = 2, and 70 kPa for OCR = 4; and the maximum from the position at is 14 kPa for OCR = 1, 79 kPa for OCR = 2, and 213 kPa for OCR = 4. at some distances remains lower than the initial conditions for all OCRs; however, it is expected that continues to increase as dissipation continues past .
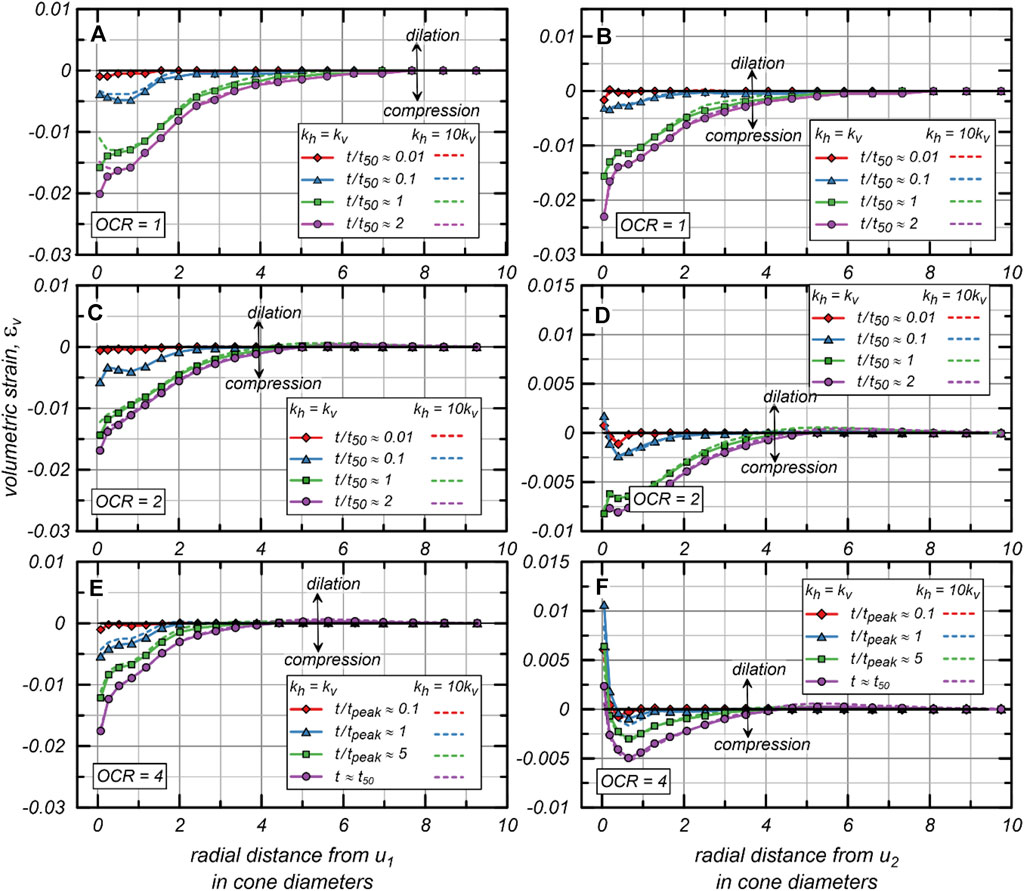
3.4 Volumetric strain during piezocone dissipation
The radial distributions, plotted in Figure 11, show responses that primarily depend on OCR, with little difference attributed to . Since dissipation tests were simulated following undrained penetration conditions, the distribution at is zero for all cases. Distributions from the position for all OCRs show similar contractive values adjacent to the cone face at . The similar values of at near the position for all OCRs (−0.016 for OCR = 1, −0.014 for OCR = 2, and = 0.017 for OCR = 4) is attributed to compensating effects of larger and greater soil stiffness as OCR increases. The simulated response for OCR = 1 is contractive from the position; there is little change in at = 0.01, and then develops to −0.003 adjacent to the cone by and −0.016 for . This is consistent with the response for OCR = 1 in Figure 9 where there is little change in distributions when is less than For both the OCR = 2 and OCR = 4 simulations, the simulated response close to the position is initially dilative with = 0.0017 for OCR = 2 at and = 0.011 for OCR = 4 at , which is consistent with the slightly non-monotonic response of OCR = 2, the strongly non-monotonic response for OCR = 4, and supports some radial re-distribution towards the position at early times (Figures 8D, F). Dilation dominates the response adjacent to the position for OCR = 4 throughout dissipation, however the dilation response is limited to less than 0.5 cone diameters from the position and at further distances the response is compressive. The role of anisotropy on the response is small and is consistent with the small differences in distributions between the and cases.
4 Discussion
Numerical simulations of CPTu dissipation using large deformation methods allow investigation of generation and dissipation as a system response to loading conditions imposed by the penetration cone, clay behavior, and hydraulic properties of the soil. This numerical study shows that at both the and positions, and for OCR 1, 2, and 4, vertical does have a contribution to the dissipation response for soils with isotropic or slightly anisotropic hydraulic conductivity. This finding is contrary to early CPTu dissipation test analysis, which assumed that due to natural soil anisotropy and induced gradients, was dominant in the horizontal direction. However, this study supports the assertion by Agaiby and Mayne (2018) that the coefficient of consolidation estimated from CPTu tests should be represented as to reflect dissipation in both the horizontal and vertical directions.
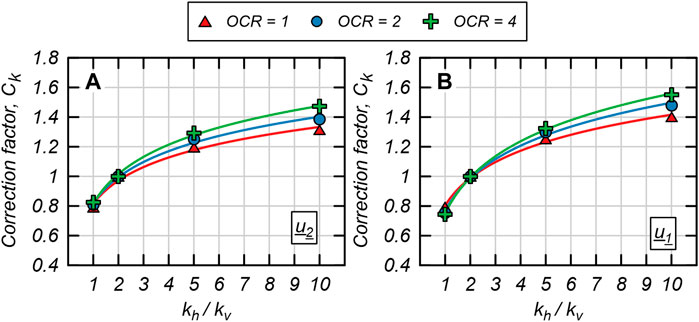
Based on the simulated values in Figure 5, corrections to to estimate are develop in Figure 12 and presented below, where:
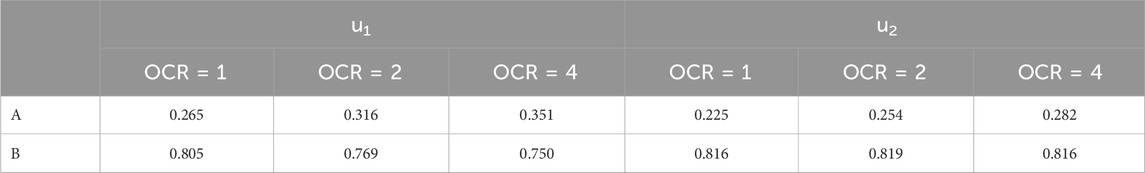
is a suggested correction factor to account for when interpreting . The factors A and B are fit to the simulated results for and dissipation and OCR = 1, 2, and 4. The suggested values of A and B at these OCR values are summarized in Table 1. For OCR values between those listed in Table 1, it would be reasonable to interpolate between A and B values.
The approach is intended for use with CPTu interpretation methods that are based on estimation of (e.g., Teh and Houlsby, 1991; Agaiby and Mayne, 2018) and for normal clays with OCR 1 to 4. Use of this approach outside of these conditions and soil type requires further study and validation.
The values are based on , which would be estimated from either hydrogeologic studies, laboratory testing, or knowledge of the depositional environment (e.g., Leroueil and Jamiolkowski 1991). represents the assumed baseline anisotropy conditions from which CPTu dissipation test interpretation methods were initially developed and validated, and therefore little adjustment is needed (i.e., . This assumption is based on Teh and Houlsby (1991) who report little difference between dissipation curves once ; Sully et al. (1999) who evaluated the proposed non-monotonic test correction to with soils with from 1 to 3 (i.e., isotropic to slightly anisotropic). As increases, at the and positions will increase since there is limited dissipation in the vertical direction, and the interpreted will decrease. Therefore, as the soil becomes more hydraulically anisotropic, increases to reflect the decreasing contribution of vertical .
differs slightly between and CPTu dissipation curves, as shown in Figures 12A, B, respectively, and OCR values. The range is slightly larger for dissipation, ranging from 0.75 to 1.55, compared to dissipation, which ranges from 0.79 to 1.47. This is consistent with the previous observation that vertical dissipation is more dominant in the cone tip area due to hydraulic gradients vertically down from the cone tip and between the cone tip and the cone shaft. The range of also increases as OCR increases, which indicates that vertical becomes more important as OCR increases, potentially due to increasing gradients.
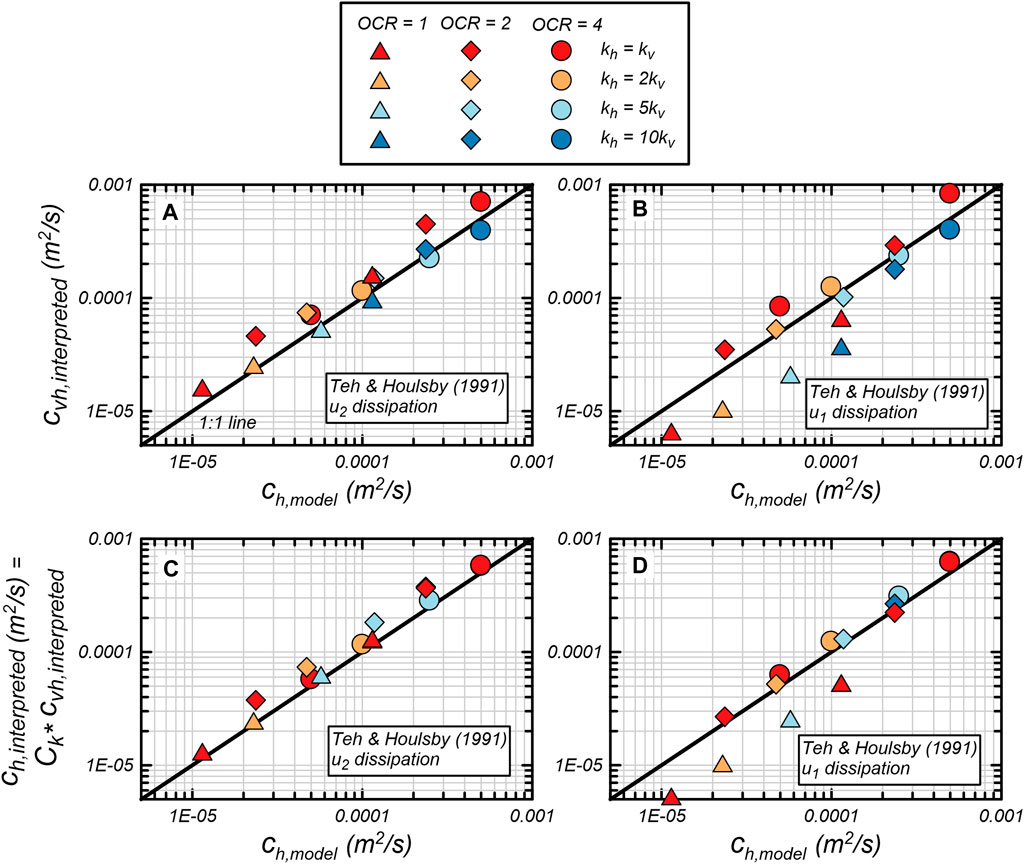
The interpretation of and from the simulated dissipation curves (termed and , respectively) are shown in Figure 13. The values are found from the simulated (Figure 5) using the Teh and Houlsby (1991) interpretation approach:
is the time factor for 50% dissipation; at the position it is equal to 0.069 and at the position it is equal to 0.245. is the cone radius, which was 18 cm in the model. is the soil rigidity index, which is the ratio of soil shear modulus to undrained shear strength. The values are 115, 148, and 111 for OCR = 1, 2, and 4, respectively. The values were determined from single element undrained isotropic consolidation triaxial compression simulations. Although Teh and Houlsby (1991) designate the interpretation to be , this study uses in Eq. 4 following the confirmation that vertical contributes to the CPTu dissipation response.
The values at the and positions are compared to the model-assigned values () in Figures 13A, B, respectively. There is generally strong agreement between and across OCR and values, providing further support that CPTu dissipation is reasonably captured by the cone penetration and dissipation model, with general scatter around the 1:1 lines. The values are applied to values in Figures 13C, D with Eq. 2 to estimate . As expected, there is less scatter for Figures 13C, D than in Figures 13A, B when is not applied.
5 Conclusion
CPTu dissipation simulations were performed in saturated clay with a direct axisymmetric cone penetration model to examine test interpretation methods, and how dissipation is affected by OCR and . Simulations were performed with the MIT-S1 constitutive model calibrated for BBC with OCR = 1, 2, and 4. The simulated dissipation tests showed monotonic responses for all OCR values. The simulated dissipation tests showed a monotonic response for OCR = 1, a slightly non-monotonic response for OCR = 2, and a strongly non-monotonic response for OCR = 4.
This study examined simulated migration during dissipation. The results showed that migration occurs in both the vertical and radial directions. Contribution of vertical migration to CPTu dissipation tests is shown by 1) increased time to at both the and position when is reduced but remains the same and 2) reduced for non-monotonic dissipation tests as increases. Vertical migration may be driven by a gradient between the cone face and cone shaft that is induced by normal stress unloading and shear stress. This gradient was present for all OCR simulations and increased as OCR increased, which is notable since higher OCR is associated with stronger non-monotonic dissipation responses. Non-monotonic responses were also associated with initially non-monotonic radial distribution from the position, indicating that radial migration may also contribute to non-monotonic dissipation responses. Future research efforts will map migration around the piezocone to relate migration to initial distribution and recorded dissipation curves.
The role of hydraulic conductivity anisotropy and vertical migration is incorporated into dissipation test interpretation with a correction factor, termed , based on prior knowledge of . The correction factor is applied to the value interpreted from CPTu dissipation tests to estimate . The correction factor is based on changes in with hydraulic conductivity anisotropy, and therefore, is appropriate for use with -based interpretation methods such as Teh and Houlsby (1991) or Agaiby and Mayne (2018) and for normal clays that are normally consolidated to moderately overconsolidated (i.e., OCR = 1–4).
Data availability statement
The raw data supporting the conclusion of this article will be made available by the authors, without undue reservation.
Author contributions
DM: Investigation, Methodology, Supervision, Writing–original draft. AH: Data curation, Investigation, Writing–review and editing. JD: Conceptualization, Writing–review and editing.
Funding
The author(s) declare that financial support was received for the research, authorship, and/or publication of this article. Funding for this research was provided by the National Science Foundation (award CMMI-1927557). Any opinions, findings, and conclusions or recommendations expressed in this material are those of the authors and do not necessarily reflect the views of the agency.
Conflict of interest
The authors declare that the research was conducted in the absence of any commercial or financial relationships that could be construed as a potential conflict of interest.
Publisher’s note
All claims expressed in this article are solely those of the authors and do not necessarily represent those of their affiliated organizations, or those of the publisher, the editors and the reviewers. Any product that may be evaluated in this article, or claim that may be made by its manufacturer, is not guaranteed or endorsed by the publisher.
References
Abu-Farsakh, M., Tumay, M., and Voyiadjis, G. (2003). Numerical parametric study of piezocone penetration test in clays. Int. J. Geomech. 3 (2), 170–181.
CrossRef Full Text | Google Scholar
Agaiby, S. S., and Mayne, P. W. (2018). Interpretation of piezocone penetration and dissipation tests in sensitive leda clay at gloucester test site. Can. Geotech. J. 55, 1781–1794. doi:10.1139/cgj-2017-0388
CrossRef Full Text | Google Scholar
Ansari, Y., Merifield, R., and Sheng, D. (2014). A piezocone dissipation test interpretation method for hydraulic conductivity of soft clays. Soils Found. 54 (6), 1104–1116. doi:10.1016/j.sandf.2014.11.006
CrossRef Full Text | Google Scholar
Baligh, M. M., and Levadoux, J. N. (1986). Consolidation after undrained piezocone penetration. II: interpretation. J. Geotech. Eng. 112 (7), 727–745. doi:10.1061/(asce)0733-9410(1986)112:7(727)
CrossRef Full Text | Google Scholar
Burns, S., and Mayne, P. (1998). Monotonic and dilatory pore-pressure decay during piezocone tests in clay. Can. Geotech. J. 35 (6), 1063–1073. doi:10.1139/t98-062
CrossRef Full Text | Google Scholar
Ceccato, F., and Simonini, P. (2016). Numerical study of partially drained penetration and pore pressure dissipation in piezocone test. Acta Geotech. 12, 195–209. doi:10.1007/s11440-016-0448-6
CrossRef Full Text | Google Scholar
Chai, J., Sheng, D., Carter, J. P., and Zhu, H. (2012). Coefficient of consolidation from non-standard piezocone dissipation curves. Comput. Geotechnics 41, 13–22. doi:10.1016/j.compgeo.2011.11.005
CrossRef Full Text | Google Scholar
Chai, J. C., Hossain, M. J., Carter, J., and Shen, S. L. (2014). Cone penetration-induced pore pressure distribution and dissipation. Comput. Geotechnics 57, 105–113. doi:10.1016/j.compgeo.2014.01.008
CrossRef Full Text | Google Scholar
Chen, B. S. Y., and Mayne, P. W. (1994) Profiling the OCR of clays by piezocone tests. Rep. No. CEEGEO-94 1.
Google Scholar
DeJong, J. T., and Randolph, M. (2012). Influence of partial consolidation during cone penetration on estimated soil behavior type and pore pressure dissipation measurements. J. Geotech. Geoenviron. 138 (7), 777–788. doi:10.1061/(asce)gt.1943-5606.0000646
CrossRef Full Text | Google Scholar
Deng, S., Zhang, Y., Han, J., Tian, Z., and Liu, T. (2023). An analytical study on penetration and pore pressure dissipation of piezocone test in typical normally and over-consolidated silty clays. Appl. Sci. 13, 3797. doi:10.3390/app13063797
CrossRef Full Text | Google Scholar
Dunn, R. J., and Mitchell, J. K. (1984). Fluid conductivity testing of fine-grained soils. J. Geotech. Eng. 110 (11), 1648–1665. doi:10.1061/(asce)0733-9410(1984)110:11(1648)
CrossRef Full Text | Google Scholar
Finke, K. A., Mayne, P. W., and Klopp, R. A. (2001). Piezocone penetration testing in Atlantic Piedmont residuum. J. Geotech. Geoenviron. 127 (1), 48–54. doi:10.1061/(asce)1090-0241(2001)127:1(48)
CrossRef Full Text | Google Scholar
House, R. D. (2012). “A comparison of the behavior of intact and resedimented Boston blue clay (BBC),” (Cambridge: Department of Civil and Environmental Engineering, Massachusetts Institute of Technology). PhD Thesis.
Google Scholar
Imre, E., Rózsa, P., Bates, L., and Fityus, S. (2010). Evaluation of monotonic and non-monotonic dissipation test results. Comput. Geotechnics 37, 885–904. doi:10.1016/j.compgeo.2010.07.008
CrossRef Full Text | Google Scholar
Itasca (2016) FLAC version 8.0. Minneapolis, Minnesota: Itasca Consulting Group Inc.
Google Scholar
Jaeger, R. A. (2012). “Numerical and experimental study on cone penetration in sands and intermediate soils,” (Davis: Department of Civil and Environmental Engineering, University of California). PhD Thesis.
Google Scholar
Krage, C. P., and DeJong, J. T. (2016). Influence of drainage conditions during cone penetration on the estimation of engineering properties and liquefaction potential of silty and sandy soils. J. Geotech. Geoenviron. 142 (11), 04016059. doi:10.1061/(asce)gt.1943-5606.0001543
CrossRef Full Text | Google Scholar
Kulhawy, F. H., and Mayne, P. W. (1990). “Manual on estimating soil properties for foundation design,” in No. EPRI-EL-6800. Electric power research inst., palo alto, CA (USA) (Ithaca, NY (USA): Cornell Univ.).
Google Scholar
Leroueil, S., and Hight, D. W. (2003). Behaviour and properties of natural soils and soft rocks. Characterisation and engineering properties of natural soils 1, 29–254.
Google Scholar
Lim, X. Y., Tan, S. A., and Phoon, K. (2019). Interpretation of horizontal permeability from piezocone dissipation tests in soft clays. Comput. Geotechnics 107, 189–200. doi:10.1016/j.compgeo.2018.12.001
CrossRef Full Text | Google Scholar
Liu, K., Wang, D., and Zheng, J. (2022). Determination of the coefficient of consolidation by piezocone tests under partially drained conditions. Geotechnique, 1–11. doi:10.1680/jgeot.22.00064
CrossRef Full Text | Google Scholar
Lu, Q., Randolph, M. F., Hu, Y., and Bugarski, I. C. (2004). A numerical study of cone penetration in clay. Geotechnique 54 (4), 257–267. doi:10.1680/geot.2004.54.4.257
CrossRef Full Text | Google Scholar
Mahmoodzadeh, H., Randolph, M. F., and Wang, D. (2014). Numerical simulation of piezocone dissipation test in clays. Geotechnique 64 (8), 657–666. doi:10.1680/geot.14.p.011
CrossRef Full Text | Google Scholar
Moug, D. M. (2017). “Axisymmetric cone penetration model for sands and clays,” (Davis: Department of Civil and Environmental Engineering, University of California). PhD Thesis.
Google Scholar
Moug, D. M., Boulanger, R. W., DeJong, J. T., and Jaeger, R. A. (2019). Axisymmetric simulations of cone penetration in saturated clay. J. Geotech. Geoenviron. 145 (4). doi:10.1061/(ASCE)GT.1943-5606.0002024
CrossRef Full Text | Google Scholar
Pember, R., and Anderson, R. (2001). Comparison of direct Eulerian Godunov and Lagrange plus remap artificial viscosity schemes. In 15th AIAA Computational Fluid Dynamics Conference, 2644.
CrossRef Full Text | Google Scholar
Pestana, J. M., and Whittle, A. J. (1999). Formulation of a unified constitutive model for clays and sands. Int. J. Numer. Anal. Meth. Geomech. 23 (12), 1215–1243. doi:10.1002/(sici)1096-9853(199910)23:12<1215::aid-nag29>3.0.co;2-f
CrossRef Full Text | Google Scholar
Pestana, J. M., Whittle, A. J., and Gens, A. (2002). Evaluation of a constitutive model for clays and sands: Part II – clay behaviour. Int. J. Numer. Anal. Mater. Geomech. 26 (11), 1123–1146. doi:10.1002/nag.238
CrossRef Full Text | Google Scholar
Sully, J. P., Robertson, P. K., Campanella, R. G., and Woeller, D. J. (1999). An approach to evaluation of field CPTU dissipation data in overconsolidated fine-grained soils. Can. Geotech. J. 36 (2), 369–381. doi:10.1139/cgj-36-2-369
CrossRef Full Text | Google Scholar
Taylor, D. W. (1948) Fundamentals of soil mechanics. New York: John Wiley and Sons.
Google Scholar
Teh, C., and Houlsby, G. (1991). An analytical study of the cone penetration test in clay. Geotechnique 41 (1), 17–34. doi:10.1680/geot.1991.41.1.17
CrossRef Full Text | Google Scholar
Tsegaye, A. B. (2021). “Consolidation coefficient from cone penetration-based dissipation tests,” in Proceedings of the 6th International Conference on Geotechnical and Geophysical Site Characterization, Budapest, Hungary, 07-09-2020 to 11-09-2020.
Google Scholar
 Diane Moug
 Andrew Huffman1