 Corrado Altomare
 Xavier Gironella
 Andrea Marzeddu
 Manuel Viñes Recasens
 Cesar Mösso
 Joaquim Sospedra
95% of researchers rate our articles as excellent or good
Learn more about the work of our research integrity team to safeguard the quality of each article we publish.
Find out more
ORIGINAL RESEARCH article
Front. Built Environ. , 30 May 2024
Sec. Coastal and Offshore Engineering
Volume 10 - 2024 | https://doi.org/10.3389/fbuil.2024.1372906
In January 2020, the footbridge connecting the seaward platform of the Pont del Petroli pier to Badalona beach collapsed due to the severe sea storm named Gloria. Approximately 15 m of the footbridge fell into the sea as a result of prolonged wave action and strong impacts. To understand the complex interaction between waves and structures that led to the pier’s collapse during the storm, a composite modelling approach was developed. The loads on each pier element were initially evaluated using the meshless DualSPHysics code, which employs the Smoothed Particle Hydrodynamics (SPH) method. This evaluation was conducted under severe wave conditions analogous to those experienced during the storm. Numerical models informed the design of an experimental campaign carried out at the Maritime Engineering Laboratory of Universitat Politècnica de Catalunya—BarcelonaTech, using the CIEM large-scale wave flume facility in Barcelona, Spain. Post-storm bathymetric surveys revealed significant alterations in the seabed profile near the affected infrastructure, including sediment deposition and a reduction in water depth from 10 m to 8 m. Consequently, it was anticipated that wave transformation and breaking in the vicinity of the structure would be substantially affected. To explore this phenomenon, various extreme wave impacts were experimentally simulated using focused wave groups. The physical model findings unveiled the forces that the pier endured during the storm Gloria. The results indicate that wave phases influence individual waves, with waves that are biased and asymmetric experiencing higher peaks than those focused on the crest. This insight helps to explain the structural failure of the footbridge during the storm and underscores the importance of considering wave phase impacts in the design and assessment of coastal infrastructure. The combined numerical and experimental approach provides a comprehensive understanding of the forces at play, contributing valuable knowledge to the field of coastal engineering and infrastructure resilience.
Coastal engineers have extensively studied wave forces acting on exposed jetties to comprehend the impacts of sea waves on such pier/wharf structures (Balomenos and Padgett, 2018), where the term ‘pier’ refers to a berthing structure that extends out into the water orthogonal or diagonal to the shore, whereas ‘wharf’ refers to a berthing structure that runs parallel to the shore. Given the increasing concern over climate change and rising sea levels, it is crucial to comprehend their impacts to adapt and develop resilient structures. In this study, a composite-modelling approach has been employed to characterise the complex non-linear wave-structure interaction and understand the hydrodynamic conditions that contributed to the footbridge and supporting piles’ breakdown at a pier structure. This approach involved a combination of numerical modelling, large scale physical model tests and bathymetric surveys. The case study concerns the Pont del Petroli pier, located in Badalona, north of Barcelona, Spain. The pier is situated on a variable seabed and is exposed to the impact of breaking waves. The pier showed notable damages after the winter storm Gloria (Amores et al., 2020). Some of the most damages occurred to the front platform and the seaward footbridge girder of the Pont del Petroli. Moreover, the storm caused substantial alterations in the underlying bathymetry around the pier, leading to the deposition of sand and a decrease in water depth from around 10–8 m. Significant waves with heights of over 8.5 m were recorded in deep water conditions, with wind speeds of up to 100 km/h and a maximum storm duration of nearly 2 days. The front platform, the girder of the footbridge and supporting piles further to the sea of Pont del Petroli were badly damaged. Due to the lack of specific measurements of local sea conditions, local estimates of maximum wave heights greater than 7 m (pier clearance is about 6 m above mean sea level) were only possible from photos and videos. Altomare et al. (2020) presented a preliminary analysis of the pier response under wave breaking conditions. The study used the numerical modelling to aid in designing an experimental campaign in a large-scale wave flume. The results of the campaign are thoroughly described and analysed in the present work. Altomare et al. (2020) also offered a first insight into the primary failure mechanisms causing the observed damage. The objective of this work is to provide a detailed analysis of the forces exerted on the pier platform for different wave conditions and initial still water levels. The measured forces will be compared with design loads to deepen the understanding of the wave conditions that may have led to the pier failure.
Several and diverse approaches can be found in literature aiming at characterising wave loadings on jetties. Analytical or semi-empirical formulas (Kaplan, 1992; McConnell et al., 2003) typically consider wave characteristics, such as wave height, period, and water depth, along with geometrical features to estimate wave forces on exposed jetties. These formulas provide quick estimates of wave loads on jetties, but may have limitations in accurately capturing complex wave interactions. Semi-empirical formulas, in particular, are based on field observations and experimental data using scaled-down models of the jetty that are subjected to various wave conditions in wave flumes or wave basins. Cuomo et al. (2007) carried out physical model tests of a jetty with piles at model scale equal to 1/25. The structural model consisted of a jetty deck on a down-standing frame of cross and transverse girders. Regular non-breaking waves propagating on horizontal bottom were tested. The jetty had load cells on the deck and there were pressure sensors on the seaward girder. The authors proposed expressions for impulsive and quasi-static wave forces where forces are made dimensionless through the use of the significant wave height Hs, and identify linear trends between dimensionless forces and (ηmax-cl)/htoe, where ηmax is the maximum water surface elevation, cl is the deck clearance, htoe is the water depth at the toe of the structure. Similarly, in the work of Gaeta et al. (2012) the modelled jetty consisted essentially of a rectangular plate attached to a heavy reticular steel frame. The model scale was 1:4 with fixed bottom. Authors analysed the effects on wave loading due to the presence of small ventings, concluding that they do not significantly affect the loads for low clearance values, while they seem to have a slight influence on the maximum forces at the bay deck for the higher values of the wave impact phase (Θ = (ηmax-cl)/ηmax > 0.5), as the wave hits the soffit with greater vertical velocity, the mixture of air-water can rapidly escape upward through the holes. In the work of Fang et al. (2021) focused waves were employed to represent extreme events, highlighting the differences between slamming and quasi-static forces. The researchers assessed the deficiencies in coastal bridges concerning the absence of connection between the superstructure and substructure using a 1:25 scale model with a horizontal bottom. The interaction between breaking and broken waves resulted in intricate and forceful situations for elevated structures, primarily due to non-linearity. The slamming forces, known for their extremely high frequencies, were determined to be directly proportional to the maximum focused wave amplitude (ηmax), exhibiting a quadratic relationship. On the other hand, the total vertical force was also proportional to the maximum focused wave amplitude, but in this case, the relationship was linear. Regarding the slamming forces on the platform deck, interesting results can be found in Bea et al. (2001): the authors analysed the different force components, namely, the buoyancy force, the slamming force, the drag force, the lift force and the inertia force. The peak of the slamming force significantly exceeded the peak of the slowly varying wave inundation force (drag + inertia forces). This force history pattern highlighted the dominance of the slamming force during the initial impact, indicating its critical role in the wave-structure interaction phenomenon. However, due to the lack of a systematic and comprehensive analysis of forces induced by breaking waves on jetties, the present work implements a methodology that includes focused wave groups (Tromans et al., 1991; Whittaker et al., 2016; 2017; 2018) and applies experimental modelling to assess the forces induces by breaking wave on the pier elements.
The article is organized as follows. A brief description of the focused wave group theory is reported in Section 2. Section 3 presents the case study of Pont del Petroli, including information on the damages and bathymetrical changes caused by the storm Gloria. Section 4 presents the results of numerical modelling for wave propagation and transformation, which aim to characterize the local wave conditions. Section 5 outlines the experimental model setup, while section 6 presents the experimental results. Sections 7, 8 contain the discussions and conclusions, respectively.
Hughes and Thornton (2016) and Whittaker et al. (2018) highlighted the significance of taking into account individual wave properties to achieve precise structural design of coastal defences. Lindgren (1970) showed that the shape of a large event (wave) comprises both deterministic and random components, with the former one dominating for events large relative to the underlying process (sea state).
In the field of offshore engineering, the so-called NewWave approach was introduced by Tromans et al. (1991) as a compact and focused wave group, designed specifically for engineering purposes. The NewWave theory establishes a correlation between the expected form of a large wave in a linear sea state and the bulk qualities of the sea state. It relies on the intensive statistical analysis of extremes for linear, Gaussian processes. The NewWave approach provides an attractive alternative to designing structures that are exposed to extreme events where survival is a crucial concern. Including short-duration focused wave groups in the design approach may provide a complement to long-duration irregular wave tests and lead to various advantages (Jonathan and Taylor, 1997). Benefits also involve an increase in repeatability, the ability to evaluate model and scale effects, improved measurement possibilities, and better resolution of models used for examining significant wave interactions. Another benefit is that wave absorption is unnecessary due to the compact nature of focused wave groups. The use of NewWave focused wave groups has become a topic of growing interest in coastal engineering applications. Their impact on run-up and the flow kinematics on flat beaches has been studied by researchers (Borthwick et al., 2006; Whittaker et al., 2017). The use of NewWave focused wave groups has also become a tool in coastal response studies, including physical wave overtopping experiments on seawalls carried out by Hunt-Raby et al. (2011) and Hofland et al. (2014). The validity of using focused wave groups for WSI problems was previously demonstrated by Whittaker et al. (2016, 2018). They suggested that it is possible to replicate extreme coastal responses within a specific sea state using just a single incident wave group.
The NewWave focused wave approach describes the most probable shape of a large wave in a given sea state. This theoretical focus location controls dispersion of the wave group as it shoals and breaks during propagation. A focus location close to the structure means that the focus wave group energy reaches the structure in a compact, maximized, form. Although this method was initially designed to produce and disperse short wave groups on a flat seabed, it has now been adjusted in this study to accommodate waves that become shallow and break near a particular structure. To accomplish this adaptation, the focus point was used to regulate the distribution of the wave group while it experiences shallower depth and breaking during propagation. Whittaker et al. (2017) indicated that even in shallow water, the NewWave theory is still useful, signifying that the linear frequency dispersion is still the primary mechanism despite the growing impact of nonlinear effects generated by bathymetry alterations. Choosing the location of the focus point is crucial in guaranteeing that the energy of the wave group reaches the structure in an effective, compact, or maximised manner, particularly when the focus point is closer to the stricture. Then, a NewWave-type focused wave group comprising N infinitesimal wave components is given by:
where Sηη is the power spectral density, ϕ is the phase of the wave group at focus, t is time, σ is the standard deviation of the sea state (with an associated variance σ2 = ∑Sηη(ωi)Δω in this discretised form) and ki is the wavenumber of the ith wave component with angular frequency ωi and related to it by the linear dispersion relation ω2 = gk tanh (kh), g is the acceleration due to gravity, h is the water depth, and x is the horizontal distance. All wave components come into phase at the focus location xf and focus time tf to form a large wave with a linear focus amplitude equal to AN. The amplitude AN can be linked to the probability of an event occurring in a particular sea state for a specific number of waves. The occurrence probabilities of a focused wave group with given linear amplitude may be obtained by assuming the Rayleigh distribution:
being therefore AN the ‘1 in N’ wave amplitude for a sea state with a variance σ2. It is important at this point to clarify the difference between the phase of each Fourier component and the overall shape of the focused wave group. A single component of an irregular sea state would have the form cos (kix-ωit + ϕi), where ϕi is the phase of each wave component randomly chosen from a uniform phase distribution on (0, 2π). However, in formulating a focused wave group this phase is not random, and can be expressed in terms of the phase of the entire wave group in the form ϕi = -kixf + ωitf + Φ. Hence, the frequency-independent phase of all the wave components Φ is distinct from the focusing of the group; this phase determines the position of the individual waves within this group. A full range of focusing behaviours can be allowed by introducing the phase angle Φ of the group at focus (e.g., crest, trough, otherwise), while the energy concentration within the group is independent of the value of Φ. However, the wave shape can affect its breaking patterns and therefore the impacts exerted on the structure. Thus, a crest-focused (Φ = 0°), trough-focused (Φ = 180°) and up- and downcrossing events can be defined, all with the same envelope.
To improve the approach and propose additional support to the NewWave theory, it is important to analyze extreme events by looking closely at the dynamics of the waves and their interaction with the structures. In this context, and following the study of Zhang et al. (2020) and Guimaraes et al. (2015), to obtain a valid significant wave height value, the numerical modeling Simulated WAves till SHore (SWASH) model has been used as it preserves the nonlinearity of the wave propagation and at the moment of breaking. Additionally, to achieve reliable results, it has been done other simulations with SWASH nesting the results provided by the third-generation model Simulated WAves Nearshore (SWAN) in deeper waters. On one hand, SWAN is a nearshore wave model that uses implicit numerical schemes to predict different wave statistics. SWAN model predicts precisely nearshore wave processes such as refraction, non-linear wave interactions, depth-induced breaking, white capping, and shoaling. In this case, as we simulate with a stationary mode, the SWAN model is capable of solving the balance equation, which can help in reducing computing times (Umesh and Behera, 2021).
On the other hand, SWASH model allows describing all the mentioned phenomena as nonlinear equations derived from the Navier-Stokes equations, as follows (Zijlema et al., 2011):
Where t is the time, ζ(x, y, t) is the sea surface elevation (SSH) measured from the initial water level, d (x, y) is the water depth, h is the total water depth which can be obtained from the relation h = ζ + d, u (x, y, t) and v (x, y, t) are the x and y velocity components of the water flow. The parameter q equals the value of non-hydrostatic pressure which in turn is a function of (x, y, z, t), the variable g is the gravitational acceleration, cf is the bottom friction coefficient, and finally, the horizontal turbulence stress terms are determined by the parameters (τxx, τyy, τxy, τyx).
Moreover, the composition of both SWAN and SWASH simulations is because SWAN generates accurate shallow water spectral wave conditions that could be implemented in the SWASH model (Ryu et al., 2020). Alari (2013), describes the two-dimensional wave action density spectrum whereas the evolution of the action density N is governed by the time-dependent wave action balance equation. In Cartesian coordinates, this equation is expressed as follows:
Where the first term is the local change rate of action density, the second term describes the propagation of wave energy in a two-dimensional geographical space, where
The Pont del Petroli was constructed in 1965 by the CAMPSA company and served as a mooring facility for oil tankers for nearly 25 years. The pier was out of use by the year 1990. However, after undergoing restoration work between 2003 and 2009, the pier is now regarded as an essential historical asset along the coast of Catalonia. The jetty has a structural type of girder bridge, with a total length of 240 m and a width of 3.20 m. The bridge is supported by 16 groups of separate piles. A trapezoidal head connects each group of pylons to the π-shaped longitudinal girder. The distance between the heads is 15 m (Figure 1). Each group of piles consists of two elements, except for two groups consisting of four piles. At sea, the pier ends with a platform of 9.75 m × 6.75 m built in reinforced concrete. The same material was used for the footbridge structure (i.e., girders), each 15 m long. All piles are tubular metal profiles with an internal diameter of 368 mm and a thickness of 12 mm. A further 20 piles are placed to support the pier platform. The pier has a nominal clearance of 6 m calculated with respect to the average water level.
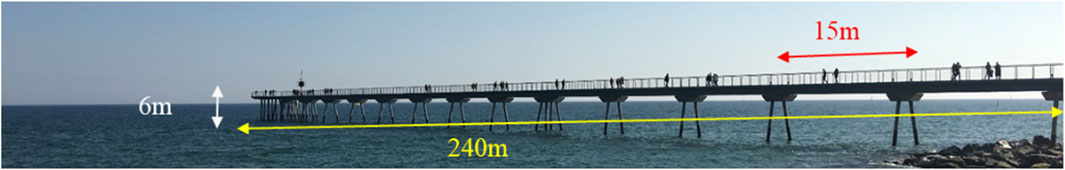
Figure 1. Pont del Petroli (and main dimensions) before being damaged by Storm Gloria.
In general, the structure appears quite solid and is statically indeterminate. However, there are some details to consider that could already show possible structural weaknesses. The girders forming the footbridge were not fixed but simply supported at the heads: rotations and eventually vertical movements induced by wave action are possible. However, these scenarios were not considered during the original design of the pier, where attention was only paid to the vertical and horizontal static loads possibly induced by ships impacting the pier during the berthing operation. Most likely, given the original bathymetry and predicted wave weather at the time, any possibility of waves impacting the platform, pile heads and gangway was ruled out. As for the piles, they were probably designed only to prevent buckling, given the forces exerted in docking ships. Consequently, its slender shape meant that inertia and drag forces could be considered negligible. The design loads for each structural element are reported below, as taken from the design report (Table 1). They referred only to vertical loads caused by static and accidental actions (includes only those mentioned). The possible actions of the waves, exerted horizontally or vertically (that is, uplift), have not been taken into account. Here we refer only to pile groups comprising two piles. The piles are sunk about 6 m into the sand, resulting in a lateral resistance expressed as a horizontal end load of 333.4 kN (Table 1).
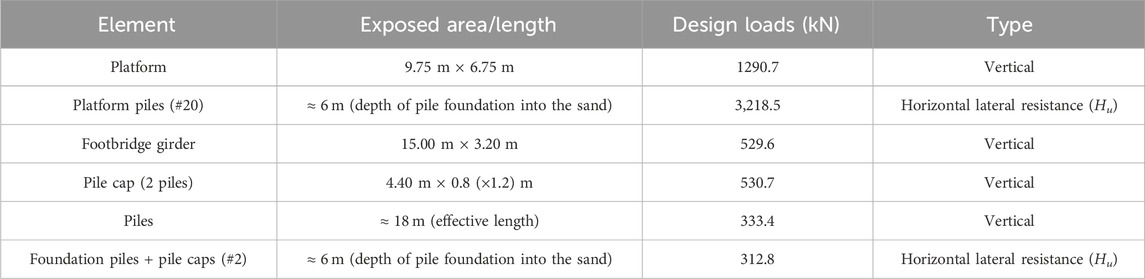
Table 1. Main characteristics of the Pont del Petroli pier elements.
Between the 19th and 23rd of January 2020, the coast of Badalona was subjected to the effects of the Gloria storm, and associated with it an episode of extreme intensity and long-lasting maritime storm, which would end up having a major impact on the beaches and coastal infrastructures, in particular the Pont del Petroli. The continued action of the waves on the structure of the Pont del Petroli, and specifically on its final platform, ended up producing a series of severe damages, the magnitude and consequences of which had not been documented to have occurred previously since its construction in 1965. During the storm Gloria, both the pier measuring station (meteorological station and webcam) and the wave buoy located in front of the Port of Barcelona (Barcelona II buoy, point coordinates: 2.20°E–41.32°N) were not in service (Figure 2, upper image). The first due to the failure of the dock’s electrical installation on the morning of January 21, and the second due to the fact that it stopped recording in the morning of January 20, just when the wave climate was still in a growth phase. So it became quite difficult to be able to determine what kind of waves caused the damage and when they happened.
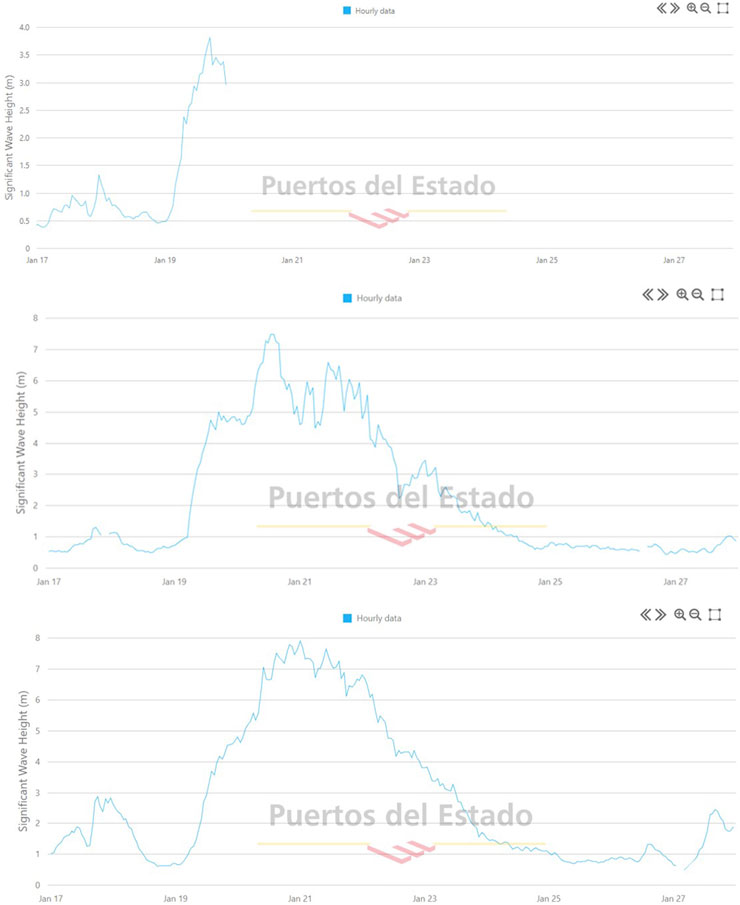
Figure 2. Record significant wave height (Hs) of the of the Barcelona buoy (upper image), Tarragona buoy (middle image) and Cap Begur buoy (lower image) (Source: Puertos del Estado).
The available information is limited and obtained indirectly. For example, on the morning of the 21st, and as can be seen in the last image recorded by the pier webcam, damage was already visible in the area of the final platform of the pier. However, most of the damage suffered occurred between the afternoon of the 21st and the morning of the 22nd, coinciding with the peak of the storm, at least according to the information available on the Tarragona buoy (Point coordinates: 1.47°E–40.69°N), see Figure 2, middle image, and the Cap Begur (Point coordinates: 3.65°E–41.90°N), see Figure 2, bottom image swell buoy (Figure 2, lower image), the only one on the entire Catalan coast above Tarragona that was in operation during the event. The pier platform coordinates are 2.24°E–41.44°N. Wave heights ranging from 3.5 to 6 m were observed under severe storm conditions, specifically in a situation of completely broken seas with different directions of propagation. It is important to note that these observations were made visually.
The climatic information of the waves was contrasted with the results published by Puertos del Estado and available in different places known as SIMAR points. This deals with modeled data inferred through numerical models of swell, wind, and sea level. The SIMAR series arise from the concatenation of the two large sets of simulated wave data that Ports de l’Estat has traditionally had: SIMAR-44 and WANA. The SIMAR database has multiple data points near the Barcelona coast and for this study, the SIMAR point 2111137 was chosen (Point coordinates: 2.25°E–41.42°N), to compare and validate with different statistics the propagations made by SWAN as it is the nearest point to the Pont del Petroli. The main wave parameters provided by this SIMAR point are the spectral wave height Hm0, peak period Tp and mean direction θm (de Swart et al., 2020).
Sapiega et al. (2023) describe the importance of calibrating the SWAN model on extreme wave conditions in verified zones. In this case, the time series of the significant wave height estimated during the Gloria exceeds the value of 6 m. Therefore, maximum wave heights of around 11 m could have spread to the foot of the Pont del Petroli, affected by shoaling and breaking.
Analysis of the plans of the original Pont del Petroli jetty project revealed that the structure was designed on a beach profile of 1/20–1/25 with the deepest location about 12 m below sea level medium of the water and corresponding to the foundation of the piles supporting the frontal platform of the pier. However, the surveys carried out during the last 20 years showed drastic changes related to both the depth of the water and the slope of the bottom (Altomare et al., 2020). The water depth measured at the toe of the platform after Storm Gloria was about 8 m, or 4 m less than the water depth indicated in the structural design. The post-Gloria bathymetric profile has been used therefore for further numerical and experimental modelling.
In the absence of direct wave measurements at Pont del Petroli during the Gloria storm, a nested numerical modelling approach was used to obtain a range of wave height variations, which is essential for experimental testing and design of coastal infrastructure. Since the Barcelona II buoy was not operational during that period (see Figure 2), the data recorded by the Tarragona deep water buoy were analysed. The buoy recorded the 20th of January of 2020 at 13:00 p.m., a maximum significant wave height value of 7.49 m during the storm.
Five simulations were conducted, three of them using the non-linear shallow water equation-based model SWASH in order to calibrate the SWASH model by comparing it with the simulations that were conducted in the pysical model at the CIEM (Zijlema et al., 2011; Suzuki et al., 2023). For the remaining two simulations, a nesting was performed between the phase-averaged SWAN model (Booij et al., 1999) and SWASH, to propagate the storm Gloria. The combination of both models allows for obtaining precise and high-resolution values with lower computational costs. SWAN enables large wave propagation domains to be spanned with very low computational costs. On the other hand, SWASH is built on an explicit second-order finite difference method that strictly conserves mass and momentum. It allows accurate computation of wave-breaking processes and the resulting mass impulse of water. This facilitates the computation of wave propagation, taking into account various factors such as interactions with currents, structures, dissipation due to the seabed, wave run-up, and more.
For the simulations with SWAN, version 41.31AB has been used, while for the simulations with SWASH, version 9.01A has been employed. Although the model setup has been utilized using Cartesian coordinates defined by distances measured in meters and represented by X and Y coordinates, the computational grid of SWAN is bounded between latitudes 41.48° N and 41.31° N and longitudes 2.42° E and 2.18° E (Figure 3 middle), while the smaller grid is delimited between latitudes 41.44° N - 41.43° N and longitudes 2.25° E − 2.24° E (Figure 3 right). In the case of the SWASH simulations, the main difference between the first three simulations and the last two ones, lies in the mesh rotation parameter, which does not need to be rotated. That is, for the nested simulations, the x-axis of the SWASH domain should be placed perpendicular to the coast, while the y-axis needs to be parallel to the coast.
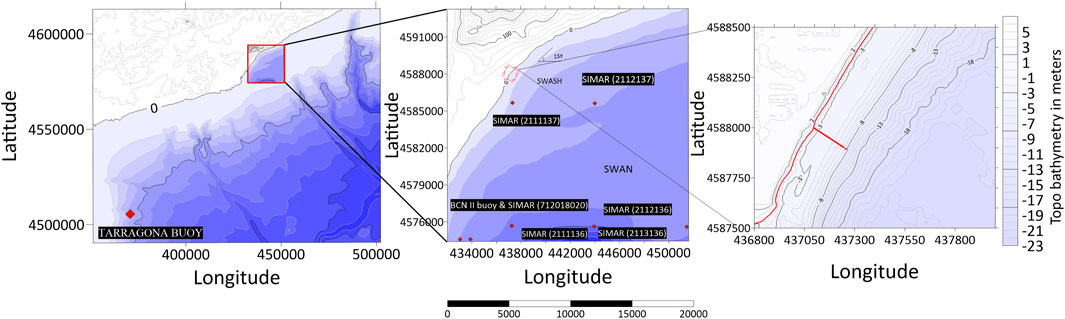
Figure 3. Used bathymetries to carry out SWAN (left and middle) and SWASH models (Right).
The topo-bathymetry of the study area is one of the main inputs needed to carry out both simulations. For the SWAN simulation, which requires a larger domain with lower resolution (280 × 200 m), data has been downloaded from The General Bathymetry Chart of the Oceans (GEBCO). However, for modeling with SWASH, which requires high-resolution bathymetry, it has been obtained from the Metropolitan Area of Barcelona (AMB) and have a 5 m resolution. In the case of the SWASH model domain, not only bathymetry values were obtained but also topography values. This was done because SWASH allows for optimal calculation of run-up and wave transformation up to the shoreline by incorporating both bathymetric and topographic data.
The initial three simulations involved several storms, which kept the wave direction constant and consistent. By keeping the wave direction constant in these simulations, we can observe more closely the effects of peak period and wave height on wave propagation. In all simulations, the wave main direction was 90°. The significant wave height and peak period for the first, second, and third simulation respectively are: [5.00 m, 11.07 s], [4.70 m, 12.65 s] and [6.50 m, 11.61 s].
The last two simulations aimed to resemble the Gloria storm conditions, we use for the first one (i.e. simulation 4) the values obtained from the Tarragona deep buoy on January 20 at 13:00 p.m. while the last one (i.e. simulation 5) is forced under future climate conditions, namely, a sea level rise. The increase of the sea level rise been extracted from the NOAA data repository, where various scenarios approximate the rise in sea level (MSL). Considering different projections for the year 2,100, an increase of 0.75 m is expected in the SSP3-7.0 scenario, and 0.85 m in the SSP5-8.5 scenario. Therefore, it has been chosen to increase the MSL by 0.8 m in the simulations. On one hand, SSP3-7.0 corresponds to a medium-high reference scenario characterized by particularly high CO2 emissions, including notable aerosol emissions. On the other hand, the SSP5-8.5 scenario represents the highest reference scenario (IPCC, 2023). The SWAN simulations were performed in 2D and stationary mode; the spectrum was discretized into 74 equidistant directions and 75 frequencies ranging from 0.0521 Hz to 0.5 Hz and through segments spanning the entire domain. Initial boundary conditions were set constant with a significant wave height of 7.49 m, a peak period of 11.12 s, and a direction of 77° (Hoque et al., 2020). Physical processes such as wave-bottom friction, triad interactions, and wave breaking were modelled using default coefficients. Wave-bottom friction allows the dissipation of the wave energy, considering parameters such as orbital velocity at the bottom, wave frequency, and bottom friction coefficient. As it has been seen, SWAN generates boundary conditions for the SWASH model in the form of files containing spectrum information (by default, the model is based on the JONSWAP spectrum). For that reason, in order to visualize and validate if all five simulations have been performed correctly, three control points have been selected to obtain results. The first one is located at the same coordinates as the SIMAR point which allows us to validate the SWAN simulations (Section 3.2). The next two points that allow us to validate SWASH simulations (Figure 4) are at the eastern boundary condition of the grid, and right at the end of the Pont del Petroli.
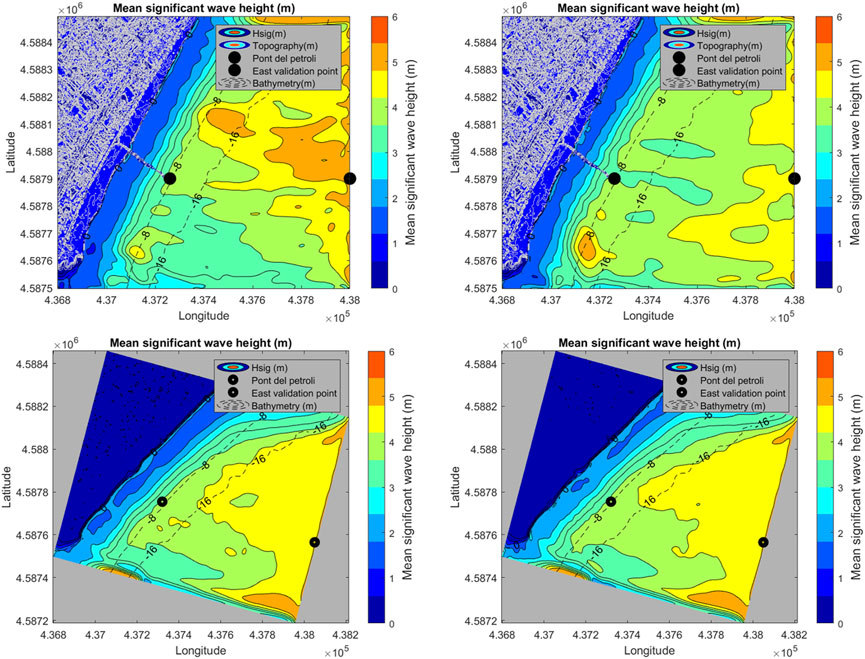
Figure 4. Upper images: results for the variable Hs (significant wave height) from validation simulations 1 (left) and simulation 2 (right); lower images: nested simulation of Hs with SWAN and SWASH without an increase o MSL (left) and with an increase of MSL (right).
The upper images in Figure 4 show the results of SWASH simulations one and two regarding significant wave height after 40 min. The black point located in the middle of the graph is one validation point that represents the position of the end of the Pont del Petroli (Point coordinates: 2.24°E 41.44°N), which is the main interest point. Additionally, the second black point corresponds to the validation point that has been applied to check if the boundary conditions are correct (Point coordinates: 2.25°E 41.44°N). On analyzing both illustrations, the higher initial wave height at the eastern boundary can be observed. This is expected as the imposed initial conditions reflected the same. The second simulation (Figure 4, up-right) — exhibiting slightly lower initial Hs but a much longer peak period—dissipates less energy, leading to higher propagated wave heights in the area of the Pont del Petroli. After completing these simulations, the third simulation has been performed and analysed where the significant wave height exceeds 6 m.
Before focusing on the wave height in the final section of the Pont del Petroli, it is interesting to note how the whole simulation has been propagated between SWAN and SWASH. It is important to remark that the boundary conditions for the SWAN model (Hs = 7.49, Tp = 11.12 and Dir = 77°) that have been used are from January 20th at 13:00 p.m. and come from the Tarragona deep buoy that is far from the calculation grid. This fact means that there may be a certain degree of uncertainty in terms of wave height, period and direction. The point performed to validate the simulation with SWAN and the nesting with SWASH shows the result that occurred on the same day and time as the value of the SIMAR Point 211137. To carry out a good comparison between both values, various statistical parameters have been used to quantify the performance of the simulation model. In this study, three widely used statistical parameters are presented: the Root Mean Square Error (RMSE), the Mean Absolute Error (MAE) and the Mean Percentage Relative Error (MAPE) (Chai and Draxler, 2014).
RMSE is a measure of the difference between the simulated values and the actual values, while the MAE which is a measure similar to RMSE, but instead of calculating the square root of the squares of the differences, it simply takes the absolute value of the differences and averages them and MAPE that calculates the average percentage error between the simulated values and the actual values (Kim and Kim, 2016). Calculated values of RMSE, MAE and MAPE are respectively equal to 0.71 m, 0.71 m and 14.9%. This difference is mainly due to the fact that the value of the initial condition imposed is an overestimated value because the measurement point is in reality far from the studied domain. Thus, the degree of uncertainty would be reduced if measured Hs values were closer to the study area. It is also important to take into account that due to the computational cost a stationary simulation has been used without taking into account the wind action, which may cause even more variation of Hs. Both nested-model simulations have been plotted to check that the nesting has been performed correctly (Figure 4, lower images). After analyzing both propagations, it can be observed that, as a general rule, the waves at the eastern boundary of the grid propagate correctly. However, the waves at the southern boundary are reflected, resulting in some areas where the wave dissipates more energy and others where it dissipates less. Therefore, the Pont del Petroli is located near the center of the grid, as this reduces the error. When comparing the simulations between the SWASH model and those conducted using the nested models, it is generally observed that there is more energy dissipation in the simulations carried out using SWAN and SWASH. After analyzing the propagations across the computational domain, it is necessary to observe the other control points that were marked at the beginning of the simulations (Section 4.2.1). These points facilitate comparing various propagations and observing the time series to ascertain if it is significant or if there is a loss of statistical significance.
SWASH provides values of significant wave height (Hs) and root-mean-square wave height (Hrms). Maximum wave height (Hmax) can be assessed either from the zero-crossing analysis of the water surface elevation time series provided by the model at the location of interest, or based on the method proposed by Longuet-Higgins (1952) based on the number of simulated waves. According to Longuet-Higgins (1952), the calculation to approximate the value of maximum wave height, now that we have the exact number of simulated waves, follows Eq. 10:
Although it is intuitive to expect a higher significant wave height during the Gloria storm when the sea level increases, a transect perpendicular to the coast was carried out to better understand this increase. This transect shows various results regarding the significant wave height and maximum wave height. Finally, the different time series of wave heights obtained through the sea surface elevation are compared simultaneously, and the results confirm a higher wave height during the storm with an 80 cm increase in the mean sea level (Figure 5).
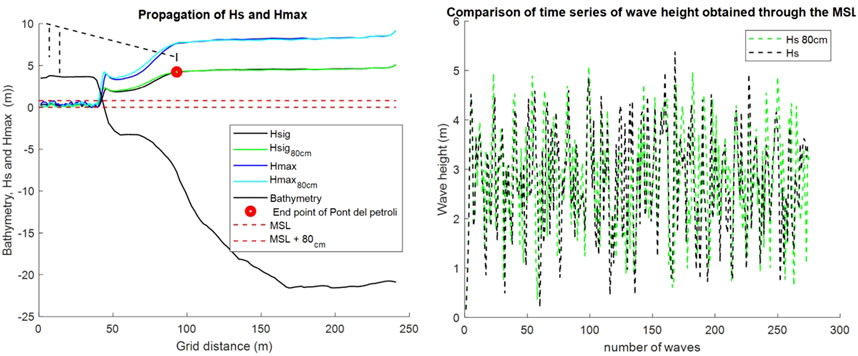
Figure 5. Perpendicular transect (Left) and comparison of both time series (Right).
The data analysis shows that wave behaviour is influenced by the rise in mean sea level, which is evident on the sea surface and in the wave height, given the close relationship of these variables. However, in all simulations, maximum wave heights exceeding 7 m have occurred, resulting in waves that might reach the pier platform and overtop it, as also confirmed by visual observations during the Gloria storm.
To gain a better vision, Table 2 shows firstly, the initial boundary values (Hinit) imposed in all simulations. Secondly, the main results that the different simulations have obtained once we get the Hs at the validation point at the Pont del Petroli, and thirdly, the results using the (Longuet-Higgins, 1952) formulation, and the value obtained using the Goda criterion, i.e., Hmax ≈ 1.8Hs (Goda, 1985).
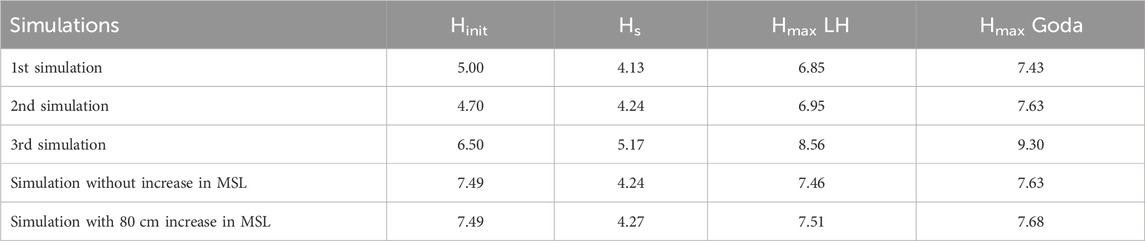
Table 2. Comparative table with the best approximation of Hmax at the validation point in the Pont del Petroli
Physical model tests were carried out in the CIEM wave flume, at the Marine Engineering Laboratory (LIM) of the Univeristat Politècnica de Catalunya–BarcelonaTech (UPC). CIEM is one of the research infrastructures belonging to the Singular Scientific Technical Infrastructure (ICTS) distributed by MARHIS (https://www.ictsmarhis.com/en). The CIEM wave flume operates at scales between 1:2 to 1:20 and has a length of 100 m, width of 3 m, and water depth of up to 3 m. The use of large scales makes it possible to reduce the effects of experimenting with prototypes. The combined and controlled generation of waves is achieved by means of a wedge-type wave generator, particularly indicated for the generation of waves in intermediate water conditions. The wave generator is able to reproduce waves up to 1.6 m highly depending on the draft and the period of the conditions to be reproduced. A 1:10 scale model was used. The model is made of steel, except for the plates that form the cover of the platform and walkway, which are made of plywood (Figure 6). The platform starts at x = 54.01 m, with x = 0 m being the position of the wave generator at rest. The beach, starting at approximately x = 32 m, is sand (d50 = 0.25 mm) with a narrow grain size distribution (d10 = 0.154 mm and d90 = 0.372 mm) and a measured sedimentation velocity (ws) of 0.034 m/s. The elevation of the water surface along the channel and the loadings on the pier were measured. For the elevation of the water surface, the following sensors were used: nine acoustic transducers (AWG), 10 resistive sensors (WG) and 10 pressure transducers (PPT). The sensors used to measure the loads were: 4 S-Girder load cells for the measurement of vertical forces at the corners of the platform, two single point load cells for the measurement of horizontal forces at the front of the platform, one single point load cell for the measurement of horizontal forces at the first pile cap, three pressure transducers on the deck. The sampling rate for surface elevation measurements (AWG, WG, and PPT) is 40 Hz, while 2,400 Hz is used for load cells and pressure sensors. All details about the experimental setup and measurements are reported in Altomare et al. (2021).
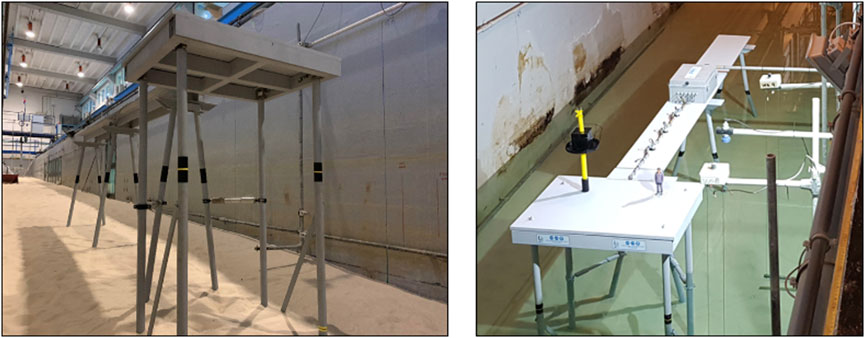
Figure 6. Views of the scale model of the Pont del Petroli installed in the CIEM wave channel.
The range of wave height has been chosen based on the outcomes of the SWAN/SWASH simulations as described in Section 4, but extending them further to consider events with larger wave height and higher return periods. Focused wave groups were generated instead of random sea states, by means of the NewWave theory. In total, 221 focused-wave group tests have been conducted. The range of target wave conditions is summarized as follows (expressed at model and prototype scales into parenthesis): significant wave height at the wave generation, Hs = 0.47–0.65 m (4.7–6.5 m); peak period, Tp = 3.50–4.00 s (11.07–12.65 s); target maximum wave height at focus location, Hmax = 0.65m–1.11 m (6.5–11.1 m); distance from focus to wave generator xf, from 48.16 to 55.1 m, measured from the wavemaker position at rest and corresponding to a range between −11.00 m to +58.50 m in prototype measured respect to the platform (negative means that the focus has been forced after the platform, positive means that the focus is before it); phase at focus, ϕ = 0°–270°; water depth at the wave generator, d = 2.435–2.520 m (24.35–25.20 m); water depth at the tip of the jetty, dtoe = 0.815–0.900 m (8.15–9.00 m); clear distance from the pier, cl = 0.415m–0.500 m (4.15-5.00 m). The values of the water depth at the toe of the structure are intended to represent the effect of rising water levels due to future climate change scenarios. Considering the lowest mean current level (8.15 m on prototype scale), depths of +0.35 m and +0.85 m were analysed, corresponding to the RCP4.5 and RCP8.5 scenarios that are widely used in most climate change studies. The first scenario assumes that there is a considerable increase in awareness regarding the impact of climate change. Moreover, it assumes that active international policies are implemented to reduce emissions. The RCP8.5 scenario represents the worst-case scenario and could be realised if major emitting countries do not adopt aggressive mitigation policies or if actions such as intensive deforestation of large forested areas continue. Therefore, the increase in sea-level from 0.815 m (8.15 m to prototype) to 0.90 m (9.0 m to prototype) corresponds to the RCP8.5 scenario projected for the year 2,100.
Focused wave groups have been generated to simulate a diverse set of extreme wave conditions at the structural tip. This was required due to the limited knowledge of the Gloria storm in the location where the Pont del Petroli is situated. A feasible range of extreme wave impacts on the structural parts of the pier could be reconstructed by changing the focus point and focus phase. The ranges of local wave conditions measured at 0.45 m before the platform toe exhibits maximum wave heights ranging between 0.55 m and 1.05 m (in model scale). An example of the values of maximum wave height, maximum crest and set-up along the experimental channel is shown in Figure 7.
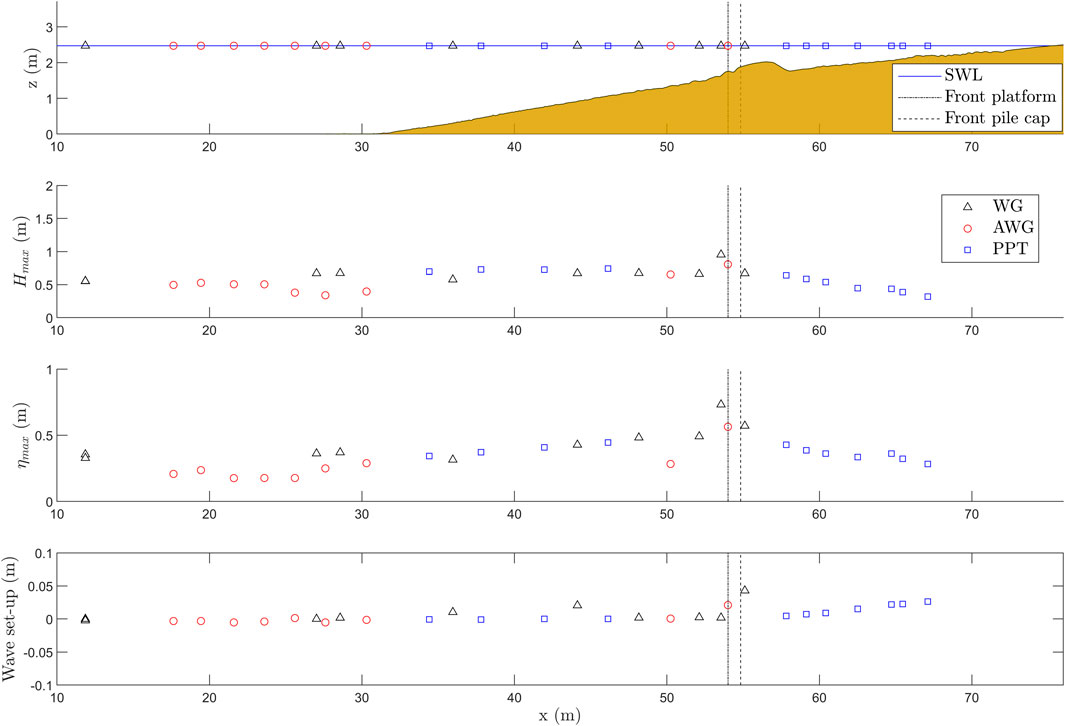
Figure 7. Position of sensors along CIEM (red circle = AWG, blue square = PT, black triangle = WG), maximum wave height, maximum crest and wave setup values along the CIEM flume. The distance x is measured from the wedge-type wavemaker at rest. Hydrodynamic characteristics: Hs = 5.0, Tp = 11.61 s, Φ = 180°, dtoe = 8.5 m and xf = 50.24 m.
The position of the platform and head is marked by the vertical black lines. The crest and maximum wave height rise a few meters before the structure and then decrease, which demonstrates a typical trend of shoaling and subsequent breaking. All tested cases at the CIEM exhibit similar progressions, indicating an essential phenomenon of wave shoaling immediately before reaching the structure and subsequent breaking at the base of or on the structure. This behaviour is confirmed by the Gloria images and indicates that breaking and impulsive waves were accountable for the structural collapse of the Pont del Petroli.
The present study examines solely the forces measured on the pier platform. The forces measured at the pile cap are not discussed. For more information on this matter, readers can refer to Altomare et al. (2021). The largest horizontal force (Fx,platform) and vertical force (Fz,platform) measured on the platform, are equal to 3,174.4 kN and 3,252.8 kN respectively, quantities expressed in prototype scale. It is worthy to notice that these values do not correspond to the same testcase, corresponding the former to the case to the lowest value of wave height at wave generation (i.e. 0.47 m) for dtoe = 0.85m of and the latter to a case with the lowest clearance and largest value of wave height at wave generation (i.e. 0.65 m). Figure 8 displays an example time series data captured by sensors WG8, WG9, and AWG7 located adjacent to the platform with corresponding model scales at x = 53.55 m, x = 54.00 m, and x = 55.12 m from the wavemaker. The force time series for each image appears synchronized (horizontally and vertically on the platform). All quantities expressed in model scale. The case shown corresponds to prototype wave conditions Hs = 5.0, Tp = 11.61s and htoe = 8.5m, while Φ is 180° xf is 37.7 m, corresponding to a distance between focus location and wave generation of 50.24 m in model scale. In general, due to considerable noise, we use the time series captured by the WG8 sensor to represent wave information at the toe of the structure. The selected scenario has a focus phase of Φ = 180°, leading theoretically to a wave trough being enhanced more than the wave crest. Although, in this case, sharp crests are noticed, due to the wave shoaling. This scenario can occur during a real sea state where two extremely high waves move within the same group and form a deep, intervening trough. In this specific instance, we noticed that the initial crest that reaches the platform generates the maximum vertical force, while the maximum horizontal force occurs precisely when the second crest reaches it. This is an extraordinary example of non-simultaneity of forces that could occur in reality.
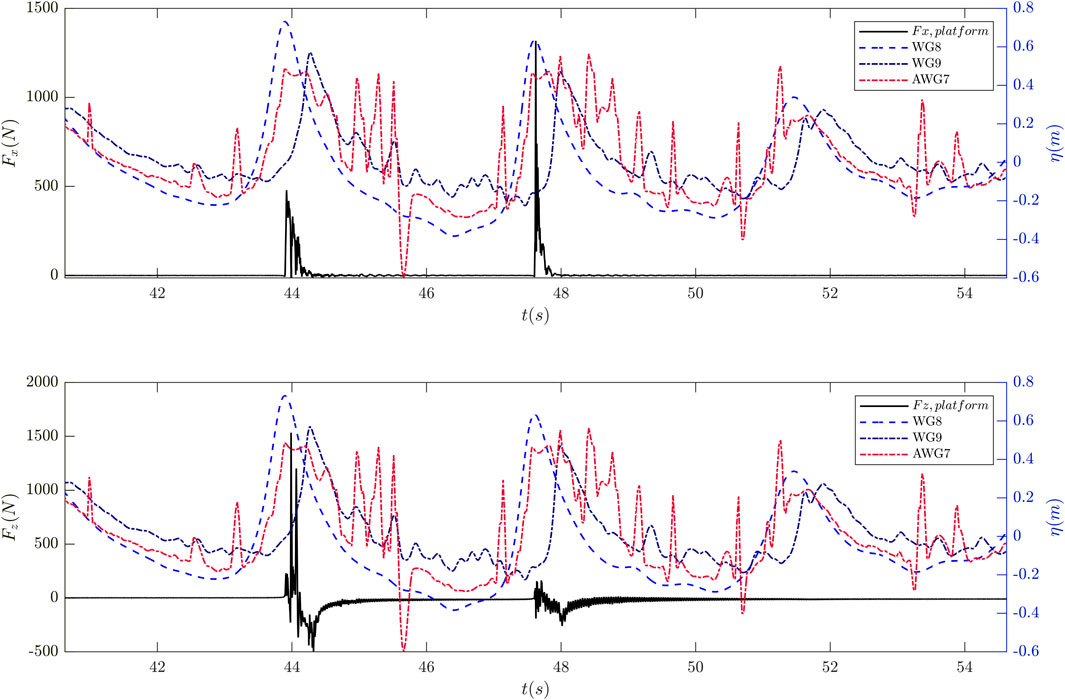
Figure 8. Example of time series of free surface to three sensors near the model and of forces (quantities in model scale).
To analyze how the load exerted could cause the structural failure of one of the jetty elements, the measured forces have been compared with the design loads. For vertical impacts on the platform, the design load of 1290.7 kN was used (Table 1). For the horizontal loads on the platform, the lateral resistance of the soil has been used, assuming that it is equal and equally distributed among the 20 pylons that support the platform for a total value of 3,748.5 kN (Hu = 160.9 kN per pile). The damage observed after the Gloria storm suggests that the structural resistance of the concrete elements (platform, pile caps, girders) was not exceeded, while it is likely that the entire pile + cap system failed (Altomare et al., 2021). The calculated horizontal forces on the platform have been added to the forces calculated on the six piles supporting the front of the platform. The impact on the 20 piles is not simultaneous, and it is assumed that when the wave reaches the front of the platform, only the pylons directly below the front are affected. The direct forces on the piles, however, were not measured in the physical channel, so they have been calculated using the Morison equation for breaking waves, as described in Goda et al. (1966). The calculation is based on the local wave conditions at x = 53.55 m, assuming that the measured wave height and crest elevation are equal to the breaking wave height and crest elevation, as required when applying the method of Goda et al. (1966). The non-dimensional values thus calculated are shown in Figure 9 for
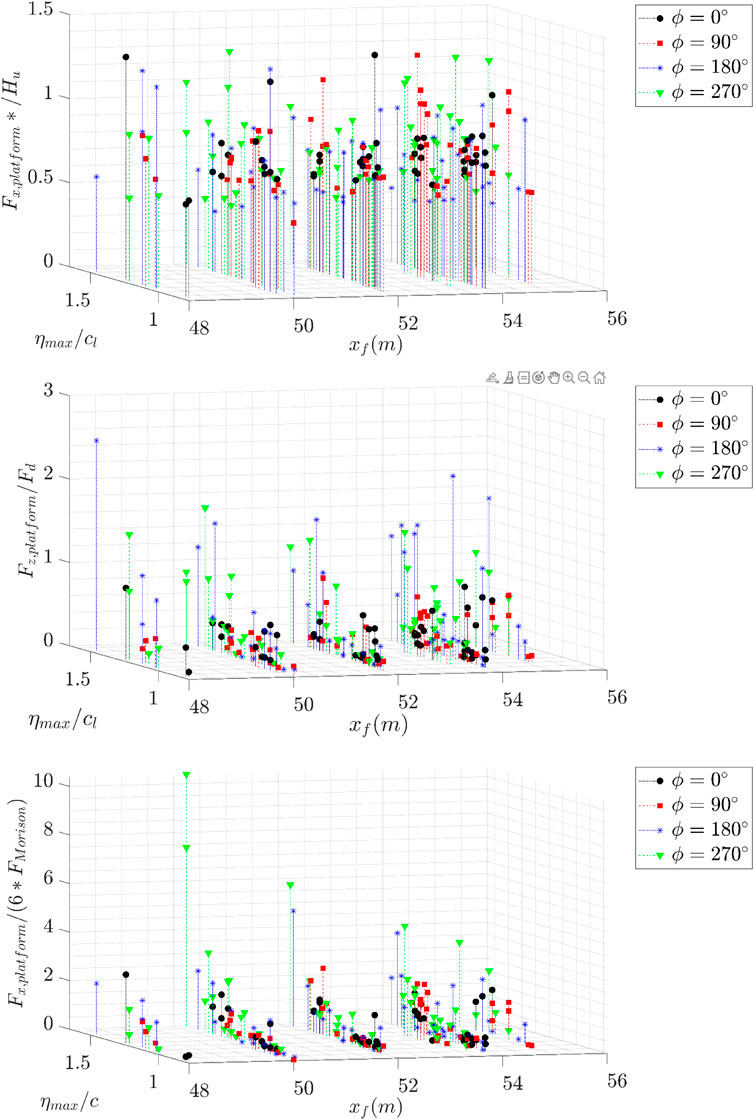
Figure 9. Dependence of the non-dimensional forces on the platform with the location of the focus, the phase, and the relationship between the maximum elevation of the crest and clearance: horizontal (upper image) and vertical force (central image) and ratio between the horizontal force platform and the force calculated on the six front pylons (lower image).
The relationship between the horizontal force measured on the platform and the forces calculated on the six front piles which are assumed to be subject to the same impact is shown in Figure 9 (lower image): it is clearly seen that an increase in the crest (elevation of the surface) corresponds to an increase in the force on the platform with respect to the force calculated on the piles. The energy of higher waves is distributed between the platform, the piles and a portion is transmitted over the platform as the waves pass by. The impact of lower waves on the platform is less as compared to the piles, where the impact is more proportional to the wave height. Structural stability must consider that the moment generated by the two forces is not the same due to the significant difference in the arm, where the arm of the direct force on the platform is always greater than the arm of the forces on the piles, though further details are not mentioned here.
It is worth reminding that the range of wave conditions has been carefully chosen to encompass the conditions that resulted in the failure during storm Gloria. It is noteworthy that the exact wave conditions in Badalona at that time were unclear and had to be reconstructed by means of wave propagation modelling (see Section 4). This has allowed exercising caution and examining the impact of severe waves that may have occurred or may occur in the future as a result of climate change and sea-level rise scenarios. To this end, the variation of force for three different water levels is analysed in this section, considering the effect of the focus phase on the forces. For that, a wave height of 0.47 m (4.7 m in prototype) is considered as an example.
Figure 10 shows the variation of horizontal and vertical forces on the platform for three different values of clearance (i.e., different water level). In general, it can be observed that the largest forces are shown for phases equal to 90° or 270°, that is, for waves that are asymmetric and possibly biased due to the non-linear transformation of the wave by shoaling. This fact is confirmed by the global analysis of the entire dataset (Figure 11).
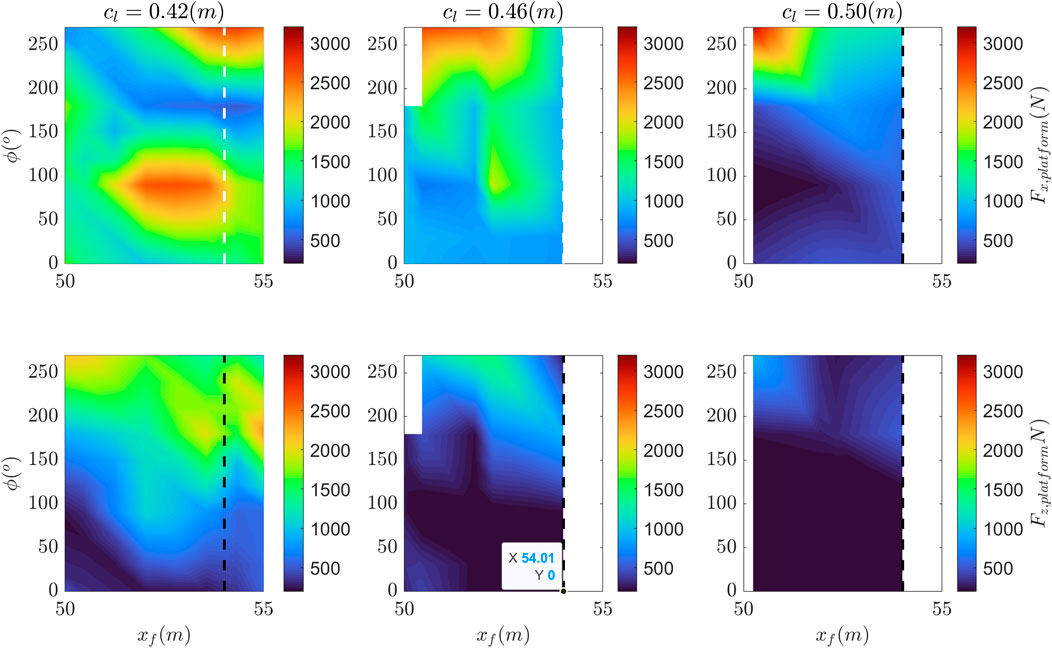
Figure 10. Dependence of the horizontal and vertical forces of the platform (upper and lower image respectively) on the phase and location of the focus for a clearance of 0.42, 0.46 and 0.50 m and significant offshore wave height of 0.47 m (values at model scale).
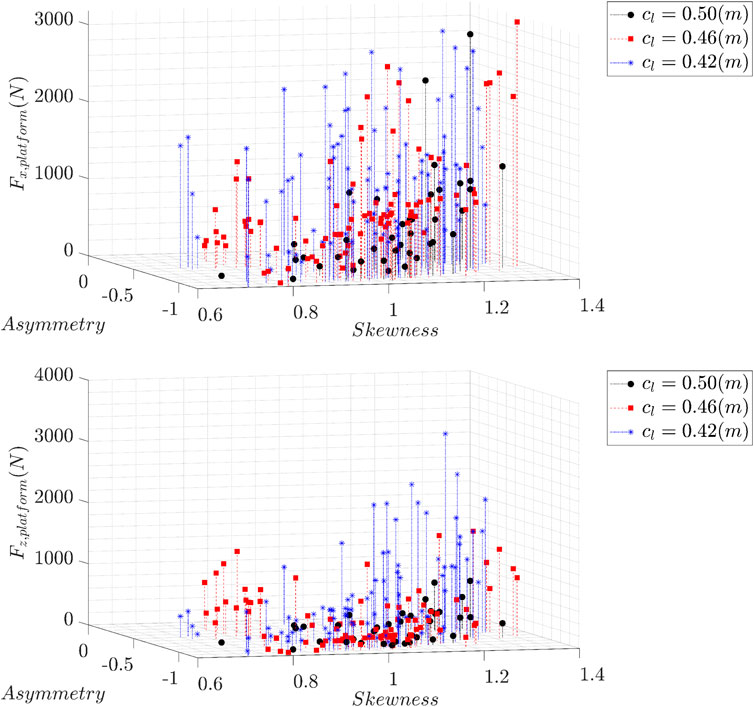
Figure 11. Variation of horizontal (upper image) and vertical forces (lower image) on the platform as a function of clearance, wave asymmetry and skewness (i.e., skewed wave).
In general, highly non-linear and asymmetric waves exert significant forces on the platform. Probably the shape of the wave is dominating the breaking mechanism of the waves and their impulsiveness. For the lowest clearance (i.e., the greatest water depth) the largest vertical forces are observed, as expected. Although horizontal forces seem to maximise between 52.00 m and 55.11 m for the lowest clearance, the situation is different for vertical forces, where no clear influence of the focus point location can be observed. For the largest clearance, i.e., the lowest water depths at the toe, the focus points with the highest force values are situated away from the structure. Waves break before reaching the structure because of the shallow water depth. Focus points closer to the pier platform (x ≥ 52.00 m) have already experienced wave breaking. The significance of the focus point location is closely linked to the local water depth and the possible starting of the highest waves in the focused wave group. In general, the largest forces are displayed for phases equivalent to 90° or 270°, which are waves that are asymmetric and potentially skewed by the non-linear transformation of the wave due to shoaling. This is confirmed by the global analysis of the entire dataset (Figure 11). Highly non-linear and asymmetric waves generally apply considerable forces on the platform. It is possible that the wave form is controlling the breaking mechanism of the waves and their impulsiveness. As anticipated, the largest vertical forces are observed for the lowest clearance (i.e., the deepest water).
An example of a scatter plot matrix is displayed in Figure 12, where the vertical force measured on the platform is plotted along with other parameters that are directly or indirectly related to the wave conditions. Scatter plot matrices are used to visually explore the potential correlations between variables. In this case, the search was for correlations between force values and several variables like the depth at the toe of the structure htoe, wave asymmetry, wave skewness, and the value of the wave crest elevation at the toe of the structure. Analysing the results of the scatter plot matrix of the horizontal force (omitted here), no obvious correlations are observed between the force values and other parameters. As noted before, skewness seems to play a significant role: for more skewed waves, the impacts seem to be higher. The results of the vertical forces show that an envelope can be clearly defined in the correlation between Fz,platform and htoe which demonstrates that when the water level rises, the force increases. This was evident from the analysis carried out in Figure 11. A rise in the water level corresponds to a lower clearance value, leading to higher mass of water uplifting the platform.
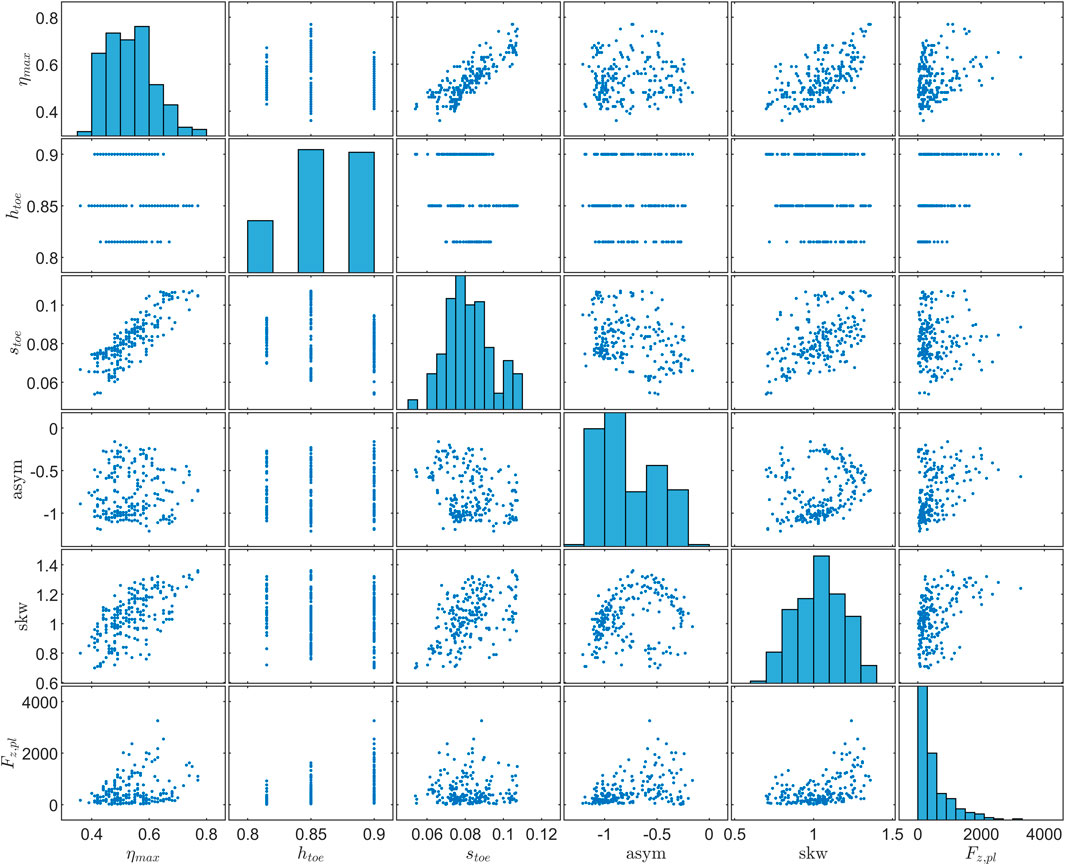
Figure 12. Scatter plot matrix of the vertical force on the platform.
For irregular waves, only one water depth was used, namely, 8.5 m (scaled to the prototype size) at the platform’s toe, for wave heights ranging from 4.7 to 5.25 m and peak periods from 11.61 to 12.65 m. Eight tests were conducted. The force peaks extracted from each test were combined into a dataset for irregular waves. This resulted in 160 horizontal force peaks and 95 vertical force peaks. Subsequently, the dataset of focused wave tests was scanned to identify all cases with hydrodynamic characteristics similar to the investigated irregular waves. The dataset contained 92 records. The Peak Over Threshold (POT) method was employed to identify all force maxima in a large dataset. These peaks were characterized by relatively low force values when compared to the irregular ones.
The POT analysis identified 72 and 39 peaks for horizontal and vertical forces for focused wave tests, respectively. As a threshold value for the application of the POT, a value of
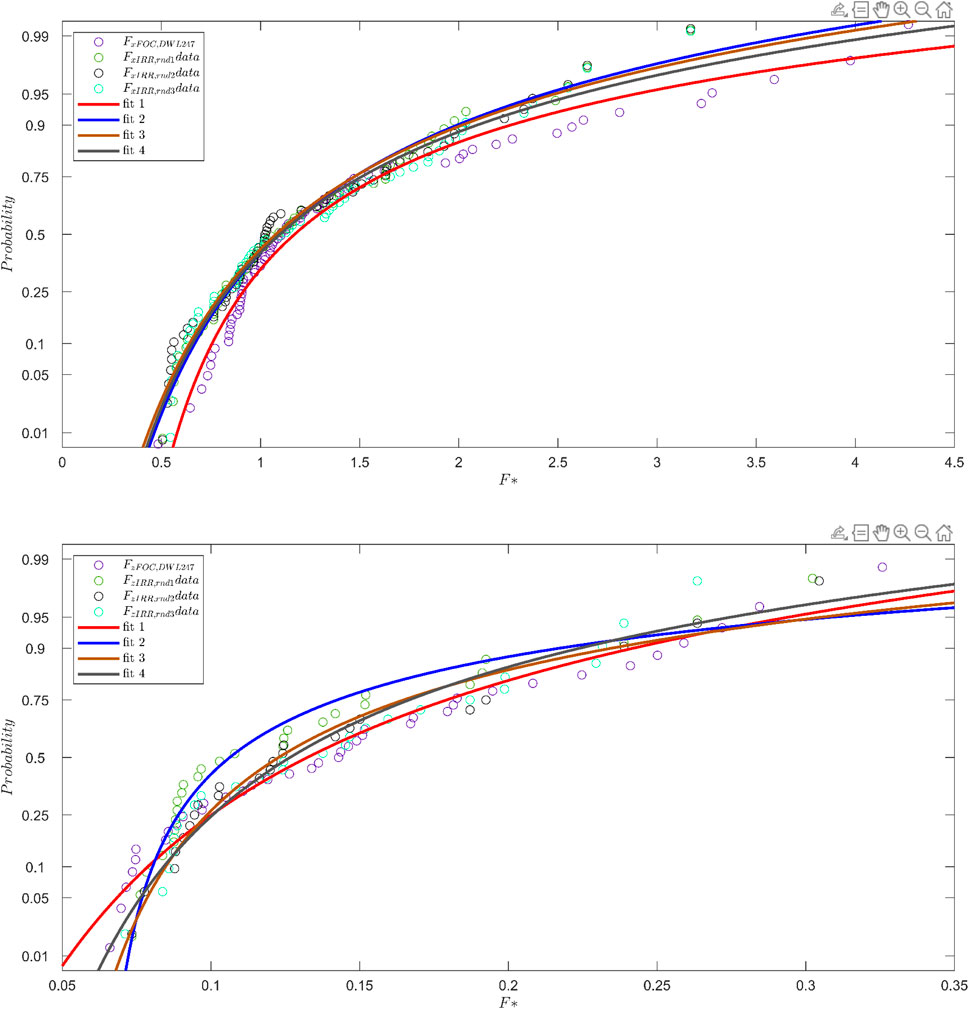
Figure 13. Horizontal (upper image) and vertical forces (lower image): GEV Distribution of irregular data samples and all focus waves by depth at generation of 2.47 m (depth at foot of 8.5 m at prototype scale). Forces on horizontal axes are dimensionless, scaled by exposed structural area and maximum wave height.
The present work discusses the analysis of forces and structural failure in a jetty element, particularly focusing on comparing measured forces with design loads and understanding the impact of wave conditions. A composite modeling approach, incorporating both numerical and experimental methods, was employed to investigate the interaction between sea waves and the Pont del Petroli jetty in Badalona, Spain. In this study, the main outcomes from the experimental campaign are presented. The study aimed to simulate the hydrodynamic conditions experienced during the Gloria storm in January 2020, which caused substantial damage to a section of the pier. The models, utilizing numerical wave propagation, field observations, and physical tests in a large-scale wave flume (CIEM at LIM/UPC), were crucial for assessing design loads for the pier’s reconstruction. Given the lack of direct wave measurements during the storm at the Pont del Petroli location, a nested numerical modeling strategy was utilized to estimate a range of wave height variations.
SWAN and SWASH models were employed, resulting in an anticipated significant wave height between four and 5.1 m in the numerical simulations, with maximum waves reaching up to 9 m. During the experimental campaign, over 200 tests were conducted, simulating diverse extreme wave impacts on the pier. Maximum wave heights, ranging from 6.5 to 11.1 m at the structural toe (upscaled to prototype conditions), were measured. Water depth values at the structural head platform toe, ranging from 8.15 to 9.00 m, were tested to consider potential climate change scenarios, with the latter representing a sea level rise of 0.85 m under the RCP 8.5 projection. The following conclusions can be drawn.
1. Comparison with design loads: Horizontal and vertical forces on the pier platform exceeded 3,000 kN due to extreme waves. For vertical impacts on the platform, the measured forces were compared to the design load of 1290.7 kN. Horizontal loads on the platform were assessed based on the lateral resistance of the soil, assuming equal distribution among 20 piles. The total lateral resistance was considered as 3,748.5 kN.
2. Structural failure assessment: damages after the Gloria storm suggested that the concrete elements (platform, pile caps, girders) did not exceed their structural resistance, but the entire pile + cap system likely failed. Calculated horizontal forces on the platform were added to forces on six piles supporting the front, assuming the impact on all 20 piles is not simultaneous.
3. Wave phase significance and asymmetry effects: examining the variation of forces on the platform for three different water levels, the results indicated that asymmetric and possibly biased waves, particularly those with phases at 90° or 270°, exhibited the largest forces. This suggests the influence of non-linear wave transformation by shoaling. In particular, results showed that asymmetric waves (Φ = 90° and Φ = 270°) had severe effects, particularly for horizontal forces on the platform. High vertical forces were observed for Φ = 270° and Φ = 180°, indicating waves with a deeper trough. Larger values of ηmax/cl were associated with greater vertical forces. The overall dataset analysis confirmed that highly non-linear and asymmetric waves exerted significant forces, possibly influenced by the wave shape controlling breaking mechanisms and impulsiveness.
4. Effects of the local water depth and focus location: For different water levels, the largest vertical forces were observed for the lowest clearance, correlating with deeper water. The crucial role of focus point location was highlighted, with waves breaking before reaching the structure in shallower water, influencing force distribution. While horizontal forces demonstrated a clear influence of the focus point location, vertical forces exhibited no distinct pattern.
5. Comparison with random wave time series: irregular wave tests were conducted at a platform toe water depth of 8.5 m, with varying wave heights (4.7–5.25 m) and peak periods (11.61–12.65 m). To compare force distributions between focused and irregular waves, three random samples from the irregular wave dataset were selected. The Generalized Extreme Value (GEV) distribution emerged as the best fit for the data, revealing a resemblance in force distributions between focused and irregular waves. Notably, horizontal forces displayed a more prominent similarity, with dimensionless values scaled by maximum wave height and exposed structure area.
In summary, the analysis underscores the significance of wave conditions and their non-linear characteristics, emphasizing the potential impact of asymmetric and skewed waves on the platform. The study provides insights into the forces exerted on coastal structures under varying water levels and wave phases, offering valuable information for understanding and mitigating potential risks, especially in the context of climate change and sea-level rise. Although our experimental findings offer valuable insights, it is important to acknowledge certain limitations when comparing them to real-world, in situ conditions, particularly in light of the impacts observed during the Gloria storm. Firstly, our experimental setup took place in a wave flume, which restricted the generation of only long-crested waves. This limitation excludes considerations for wave directionality and precludes the accurate representation of wave energy dispersion, which could significantly influence coastal processes. Additionally, our experimental framework does not fully replicate the sediment transport dynamics along the Badalona coast within a 2D or quasi-3D environment. Our study provides insight into certain aspects of structural response, but it cannot fully capture the complexity and nuances of real-world scenarios. Finally, fatigue of the pier has not been analysis, since compact and short-duration focused wave groups have been employed and the model has been scaled geometrically but not its mechanical properties.
The datasets presented in this study can be found in online repositories. The names of the repository/repositories and accession number(s) can be found below: https://upcommons.upc.edu/handle/2117/342638.
CA: Conceptualization, Formal Analysis, Funding acquisition, Methodology, Visualization, Writing–original draft, Writing–review and editing. XG: Conceptualization, Formal Analysis, Investigation, Methodology, Writing–original draft, Writing–review and editing. AM: Data curation, Investigation, Writing–original draft, Writing–review and editing. MV: Investigation, Software, Writing–original draft, Writing–review and editing. CM: Investigation, Resources, Writing–original draft, Writing–review and editing. JS: Conceptualization, Investigation, Resources, Software, Writing–original draft, Writing–review and editing.
The author(s) declare that financial support was received for the research, authorship, and/or publication of this article. The experimental campaign was partially funded by European Union’s Horizon 2020 research and innovation programme under the Marie Sklodowska-Curie grant agreement No: 792370. CA acknowledges funding from the Spanish government and the European Social Found (ESF) under the programme “Ramón y Cajal 2020” (RYC 2020-030197-I/AEI/10.13039/501100011033) and within the project GLORIA PID 2020-115030RJ-I00 “Adquirir conocimientos sobre el riesgo de rebase para las zonas costeras urbanizadas” (MCIN/AEI/10.13039/501100011033).
The authors acknowledge Gregori Muñoz-Ramos from Badalona City Council for providing all necessary support.
The authors declare that the research was conducted in the absence of any commercial or financial relationships that could be construed as a potential conflict of interest.
The author(s) declared that they were an editorial board member of Frontiers, at the time of submission. This had no impact on the peer review process and the final decision.
All claims expressed in this article are solely those of the authors and do not necessarily represent those of their affiliated organizations, or those of the publisher, the editors and the reviewers. Any product that may be evaluated in this article, or claim that may be made by its manufacturer, is not guaranteed or endorsed by the publisher.
The Supplementary Material for this article can be found online at: https://www.frontiersin.org/articles/10.3389/fbuil.2024.1372906/full#supplementary-material
Alari, V. (2013) Multi-scale wind wave modeling in the baltic sea. PhD diss. Tallinn University of Technology.
Altomare, C., Cobos, X. G., and Iglesias, J. S. (2021) Durcwave - ciem. doi:10.5821/DATA-2117-342638-1
Altomare, C., Tafuni, A., Domínguez, J. M., Crespo, A. J. C., Gironella, X., and Sospedra, J. (2020). Sph simulations of real sea waves impacting a large-scale structure. J. Mar. Sci. Eng. 8, 826. doi:10.3390/jmse8100826
Amores, A., Marcos, M., Carrió, D. S., and Gómez-Pujol, L. (2020). Coastal impacts of storm gloria (january 2020) over the north-western mediterranean. Nat. Hazards Earth Syst. Sci. 20, 1955–1968. doi:10.5194/nhess-20-1955-2020
Balomenos, G. P., and Padgett, J. E. (2018). Fragility analysis of pile-supported wharves and piers exposed to storm surge and waves. J. Waterw. Port, Coast. Ocean Eng. 144, 04017046. doi:10.1061/(ASCE)WW.1943-5460.0000436
Bea, R. G., Iversen, R., and Xu, T. (2001). Wave-in-deck forces on offshore platforms. J. Offshore Mech. Arct. Engineering-transactions Asme 123, 10–21. doi:10.1115/1.1342160
Booij, N., Ris, R. C., and Holthuijsen, L. H. (1999). A third-generation wave model for coastal regions: 1. model description and validation. J. Geophys. Res. Oceans 104, 7649–7666. doi:10.1029/98JC02622
Borthwick, A. G., Hunt, A. C., Feng, T., Taylor, P. H., and Stansby, P. K. (2006). Flow kinematics of focused wave groups on a plane beach in the u.k. coastal research facility. Coast. Eng. 53, 1033–1044. doi:10.1016/j.coastaleng.2006.06.007
Chai, T., and Draxler, R. R. (2014). Root mean square error (rmse) or mean absolute error (mae)? – arguments against avoiding rmse in the literature. Geosci. Model Dev. 7, 1247–1250. doi:10.5194/gmd-7-1247-2014
Cuomo, G., Tirindelli, M., and Allsop, W. (2007). Wave-in-deck loads on exposed jetties. Coast. Eng. 54, 657–679. doi:10.1016/j.coastaleng.2007.01.010
de Swart, R., Ribas, F., Calvete, D., Kroon, A., and Orfila, A. (2020). Optimal estimations of directional wave conditions for nearshore field studies. Cont. Shelf Res. 196, 104071. doi:10.1016/j.csr.2020.104071
Fang, Q., Liu, J., Hong, R., Guo, A., and Li, H. (2021). Experimental investigation of focused wave action on coastal bridges with box girder. Coast. Eng. 165, 103857. doi:10.1016/j.coastaleng.2021.103857
Gaeta, M. G., Martinelli, L., and Lamberti, A. (2012). Uplift forces on wave exposed jetties: scale comparison and effect of venting. Coast. Eng. Proc. 1, 34. structures. doi:10.9753/icce.v33.structures.34
Goda, Y. (1985) Random seas and design of maritime structures (WORLD SCIENTIFIC). 3. doi:10.1142/7425
Goda, Y., Haranaka, S., and Kitahata, M. (1966) Study of impulsive breaking wave forces on pilones (Rep. Port Harb. Res. Inst. Jpn.).
Guimaraes, P. V., Farina, L., Toldo, E., Diaz-Hernandez, G., and Akhmatskaya, E. (2015). Numerical simulation of extreme wave runup during storm events in tramanda ĺ beach, rio grande do sul, brazil. Coast. Eng. 95, 171–180. doi:10.1016/j.coastaleng.2014.10.008
Hofland, B., Wenneker, I., and Steeg, P. V. (2014). Short test durations for wave overtopping experiments. Conf. Pap., 1–10.
Hoque, M. A., Perrie, W., and Solomon, S. M. (2020). Application of swan model for storm generated wave simulation in the canadian beaufort sea. J. Ocean Eng. Sci. 5, 19–34. doi:10.1016/j.joes.2019.07.003
Hughes, S. A., and Thornton, C. I. (2016). Estimation of time-varying discharge and cumulative volume in individual overtopping waves. Coast. Eng. 117, 191–204. doi:10.1016/j.coastaleng.2016.08.006
Hunt-Raby, A. C., Borthwick, A. G., Stansby, P. K., and Taylor, P. H. (2011). Experimental measurement of focused wave group and solitary wave overtopping. J. Hydraulic Res. 49, 450–464. doi:10.1080/00221686.2010.542616
IPCC (2023) Ocean, cryosphere and sea level change. Cambridge University Press, 1211–1362. doi:10.1017/9781009157896.011
Jonathan, P., and Taylor, P. H. (1997). On irregular, nonlinear waves in a spread sea. J. Offshore Mech. Arct. Eng. 119, 37–41. doi:10.1115/1.2829043
Kaplan, P. (1992). Wave impact forces on offshore structures: Re-examination and new interpretations. All Days OTC Offshore Technol. Conf. OTC–6814–MS. doi:10.4043/6814-MS
Kim, S., and Kim, H. (2016). A new metric of absolute percentage error for intermittent demand forecasts. Int. J. Forecast. 32, 669–679. doi:10.1016/j.ijforecast.2015.12.003
Lindgren, G. (1970). Some properties of a normal process near a local maximum. Ann. Math. Statistics 41, 1870–1883. doi:10.1214/aoms/1177696688
Longuet-Higgins, M. (1952). On the statistical distribution of the heights of sea waves. J. Mar. Res. XI, 245–265.
McConnell, K., Allsop, N., Cuomo, G., and Cruickshank, I. (2003) New guidance for wave forces on jetties in exposed locations. Copedec Vi, 1–20.
Ryu, K. H., Shin, C. H., Jeong, W.-M., and Baek, W.-D. (2020) “Applicability of swash model for wave field data reproduction in namhangjin coastal area,” in APAC 2019. Editors N. Trung Viet, D. Xiping, and T. Thanh Tung (Singapore: Springer), 945–951.
Sapiega, P., Zalewska, T., and Struzik, P. (2023). Application of swan model for wave forecasting in the southern baltic sea supplemented with measurement and satellite data. Environ. Model. Softw. 163, 105624. doi:10.1016/j.envsoft.2023.105624
Suzuki, T., Altomare, C., Willems, M., and Dan, S. (2023). Non-hydrostatic modelling of coastal flooding in port environments. J. Mar. Sci. Eng. 11, 575. doi:10.3390/jmse11030575
Tromans, P. S., Anaturk, A. R., and Hagemeijer, P. (1991). “A new model for the kinematics of large ocean waves-application as a design wave,” in All days of international ocean and polar engineering conference, isope–I–91–154.
Umesh, P., and Behera, M. R. (2021). On the improvements in nearshore wave height predictions using nested swan-swash modelling in the eastern coastal waters of india. Ocean Eng. 236, 109550. doi:10.1016/j.oceaneng.2021.109550
Whittaker, C., Fitzgerald, C., Raby, A., Taylor, P., Orszaghova, J., and Borthwick, A. (2017). Optimisation of focused wave group runup on a plane beach. Coast. Eng. 121, 44–55. doi:10.1016/j.coastaleng.2016.12.001
Whittaker, C. N., Fitzgerald, C. J., Raby, A. C., Taylor, P. H., and Borthwick, A. G. (2018). Extreme coastal responses using focused wave groups: overtopping and horizontal forces exerted on an inclined seawall. Coast. Eng. 140, 292–305. doi:10.1016/j.coastaleng.2018.08.004
Whittaker, C. N., Raby, A. C., Fitzgerald, C. J., and Taylor, P. H. (2016). The average shape of large waves in the coastal zone. Coast. Eng. 114, 253–264. doi:10.1016/j.coastaleng.2016.04.009
Zhang, N., Zhang, Q., Wang, K.-H., Zou, G., Jiang, X., Yang, A., et al. (2020). Numerical simulation of wave overtopping on breakwater with an armor layer of accropode using swash model. Water 12, 386. doi:10.3390/w12020386
Keywords: focus wave group, experimental modelling, pier, wave breaking, wave impact
Citation: Altomare C, Gironella X, Marzeddu A, Viñes Recasens M, Mösso C and Sospedra J (2024) Impact of focused wave groups on pier structures: a case study of severe breaking waves at Pont del Petroli during storm Gloria. Front. Built Environ. 10:1372906. doi: 10.3389/fbuil.2024.1372906
Received: 18 January 2024; Accepted: 07 May 2024;
Published: 30 May 2024.
Edited by:
Sara Mizar Formentin, University of Bologna, ItalyReviewed by:
Krisna Pawitan, Princeton University, United StatesCopyright © 2024 Altomare, Gironella, Marzeddu, Viñes Recasens, Mösso and Sospedra. This is an open-access article distributed under the terms of the Creative Commons Attribution License (CC BY). The use, distribution or reproduction in other forums is permitted, provided the original author(s) and the copyright owner(s) are credited and that the original publication in this journal is cited, in accordance with accepted academic practice. No use, distribution or reproduction is permitted which does not comply with these terms.
*Correspondence: Corrado Altomare, Y29ycmFkby5hbHRvbWFyZUB1cGMuZWR1
Disclaimer: All claims expressed in this article are solely those of the authors and do not necessarily represent those of their affiliated organizations, or those of the publisher, the editors and the reviewers. Any product that may be evaluated in this article or claim that may be made by its manufacturer is not guaranteed or endorsed by the publisher.
Research integrity at Frontiers
Learn more about the work of our research integrity team to safeguard the quality of each article we publish.