 Katsuichiro Goda
 Jack Williams
 Raffaele De Risi
 Ignasio Ngoma
94% of researchers rate our articles as excellent or good
Learn more about the work of our research integrity team to safeguard the quality of each article we publish.
Find out more
ORIGINAL RESEARCH article
Front. Built Environ., 23 January 2024
Sec. Earthquake Engineering
Volume 10 - 2024 | https://doi.org/10.3389/fbuil.2024.1333576
This article is part of the Research TopicSeismic Risk Reduction in Developing Countries, Volume IIView all articles
This study presents the most recent development of a nationwide earthquake risk model for non-engineered masonry buildings in Malawi. Due to its location within the East African Rift, Malawi experienced several moderate earthquakes that caused seismic damage and loss. Recently, a new probabilistic seismic hazard model has been developed by considering fault-based seismic sources, in addition to conventional areal sources. The most recent 2018 national census data provide accurate exposure information for Malawian people and their assets at detailed spatial resolutions. To develop seismic fragility functions that are applicable to Malawian housing stocks, building surveys and experimental tests of local construction materials have been conducted. By integrating these new developments of seismic hazard, exposure, and vulnerability modules, a quantitative seismic building collapse risk model for Malawi is developed on a national scale. For the rapid computation of seismic risk curves at individual locations, an efficient statistical approach for approximating the upper tail distribution of a seismic hazard curve is implemented. Using this technique, a seismic risk curve for a single location can be obtained in a few seconds, thereby, this can be easily expanded to the whole country with reasonable computational times. The results from this new quantitative assessment tool for seismic impact will provide a sound basis for risk-based disaster mitigation policies in Malawi.
Risk-informed decision-making is the key to allocating and using resources for disaster risk management efficiently. For low-to-middle-income countries exposed to earthquakes, quantitative seismic risk decision-support tools are not readily accessible. This is particularly important for Eastern African countries, where available seismic data and models are lacking, building and population exposure models are incomplete, and seismic vulnerability models directly applicable to local buildings are not developed. In this regard, the Global Earthquake Model (GEM) Foundation (https://www.globalquakemodel.org/gem) has contributed significantly by developing open-source seismic hazard and risk models worldwide. However, their models are not sufficiently detailed to capture country-specific characteristics of seismic hazard, exposure, and vulnerability (Poggi et al., 2017).
Malawi is one of the least developed countries in Eastern Africa. It is located within a −900 km long segment of the western branch of the East African Rift, hosting earthquakes with moderate moment magnitudes (Mw) (e.g., 1989 Mw 6.3 Salima earthquake and 2009 Mw 6.0 Karonga sequence). The areas along Lake Malawi and Shire River are surrounded by border and intra-basin faults with geomorphic evidence for surface rupturing Mw 6.5 to 7.8 late Quaternary earthquakes (e.g., Flannery and Rosendahl, 1990; Jackson and Blenkinsop, 1997; Hodge et al., 2020; Shillington et al., 2020; Wedmore et al., 2020). The population in Malawi is concentrated in these areas with active seismicity (e.g., Blantyre, Zomba, Salima, Mzuzu, and Karonga), except for the capital city Lilongwe. More people migrate to urban areas (e.g., urban population percentages have increased from 14.8% in 2000, 16.0% in 2010, to 19.3% in 2023; https://www.worldometers.info/world-population/malawi-population/), and the number of informal settlements has increased in areas surrounding Lilongwe, Blantyre, Mzuzu, and Zomba (National Statistical Office of Malawi, 2018). The most prevalent construction type is low-rise masonry buildings which are not seismically resistant (Bureau TNM, 2016). Due to high seismic vulnerability under moderate shaking conditions (e.g., peak ground acceleration (PGA) less than 0.2 g), the occurrence of moderate-to-large earthquakes can be very destructive to the country. Although seismic risk profiles have been evaluated by international agencies, such as World Bank and GEM Foundation, detailed seismic risk assessments that incorporate country-specific hazard-exposure-vulnerability information have not been conducted for Malawi.
Over the last decade, significant improvements have been made to characterize seismic hazard and quantify seismic risk in Malawi. After the occurrence of the 2010 Karonga earthquake (Biggs et al., 2010), the first-generation fault-based probabilistic seismic hazard analysis (PSHA) model was developed by Hodge et al. (2015) and was subsequently extended to probabilistic seismic risk analysis (Goda et al., 2016). These early investigations were aimed at regional assessments of seismic hazard and risk in Malawi but lacked detailed characterizations of seismic sources other than seven major border faults and were not based on local exposure-vulnerability data/models. To gather more local data related to seismic hazard (e.g., topographical data to identify surface features of faults and geodetic data) and seismic risk (e.g., local population and building inventory data and local construction material data), the PREPARE (enhancing PREParedness for East African countries through seismic Resilience Engineering) project was launched and conducted between 2016 and 2022. The main outcomes from the PREPARE project includes new geodetic data to constrain the rate of rift extension in Malawi (Wedmore et al., 2021), new active fault and seismogenic databases for Malawi (Williams et al., 2022a; Williams et al., 2022b), and a new PSHA model that takes into account fault-based seismic sources, in addition to conventional areal sources (Williams et al., 2023). The most recent 2018 national census data, together with a series of local building surveys (Kloukinas et al., 2020), provide more accurate exposure information for Malawian people and their assets at detailed spatial resolutions (Goda et al., 2022). From seismic fragility assessment viewpoints, experimental tests of local construction materials and wall panels have been conducted (Kloukinas et al., 2019; Voyagaki et al., 2020), and new seismic vulnerability functions have been derived by analyzing failure mechanisms of the main building components (Novelli et al., 2021) and by performing numerical simulations of building behavior under seismic loading (Giordano et al., 2021).
Building upon the above-mentioned refinements on seismic hazard, exposure, and vulnerability modules, this study presents a new nationwide earthquake risk model for non-engineered masonry buildings in Malawi. The focus is given to the collapse of masonry buildings by reflecting local features of the current building stock. For the rapid computation of building collapse risk curves at individual locations, an efficient statistical approach for approximating the upper tail distribution of a seismic hazard curve, which can be considered as an improvement of a power function approximation proposed by Cornell et al., 2000, is implemented. Using this technique, a seismic risk curve for a single location can be obtained very quickly (typically, less than a few seconds, depending on the length of simulations that are required to obtain stable collapse risk assessment results), thereby, this can be easily expanded to the whole country with reasonable computational times. The results from this new quantitative decision-support tool will provide a sound basis for science-based and risk-informed policies for disaster preparedness in Malawi. To facilitate the uptake of the developed building collapse risk assessment tool and the obtained results, the data and MATLAB codes are included in the Supplementary Material.
A quantitative seismic risk assessment for non-engineered masonry buildings in Malawi can be carried out by combining a seismic hazard module, building exposure module, and seismic vulnerability module and by considering uncertainties associated with these modules. Such risk assessments are often performed by generating stochastic event sets, simulating shaking intensity values for individual events, and evaluating seismic damage severities for a building portfolio of interest (Mitchell-Wallace et al., 2017). For a full probabilistic seismic risk assessment over a wide area, the computational resources required become critical. To circumvent this challenge, a seismic hazard curve, which is a plot of the seismic hazard parameter (e.g., PGA and spectral acceleration) as a function of annual frequency of exceedance, is approximated by a surrogate statistical model. This facilitates the quantitative seismic risk evaluations at numerous building locations. A computational procedure of the quantitative seismic risk assessment is shown in Figure 1 for the case of Malawi. Explanations of the model components are provided in the following subsections by focusing on the overall procedure; details of the respective model components can be found in relevant articles that are dedicated to the specific topics.
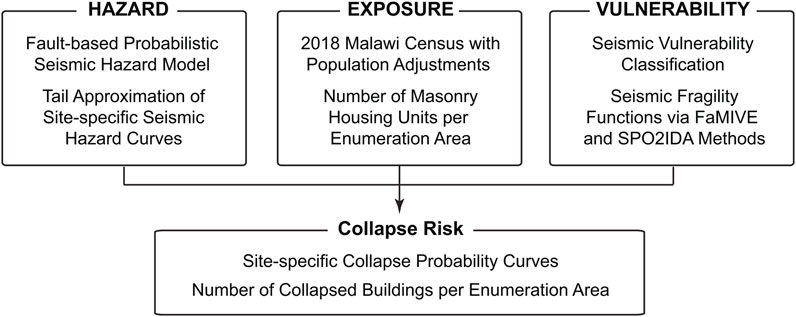
FIGURE 1. Seismic risk assessment procedure for masonry buildings in Malawi.
Malawi is located in East Africa (Figure 2A). A 900-km long section of the western branch of the East African Rift traverses across Malawi from north to south. An instrumental earthquake catalog of Malawi shows higher seismicity along the East African Rift. To characterize continental level seismicity, Poggi et al. (2017) used this catalog to develop an areal seismic source model for East African Rift. In their model, a single source zone covers the active seismic areas of Malawi (i.e., from Lake Malawi to Shire River Basin), without recognizing local geological features, such as the Livingstone Fault, the Bilila-Mtakataka Fault, and the Thyolo Fault (Flannery and Rosendahl, 1990; Jackson and Blenkinsop, 1997; Wedmore et al., 2020).
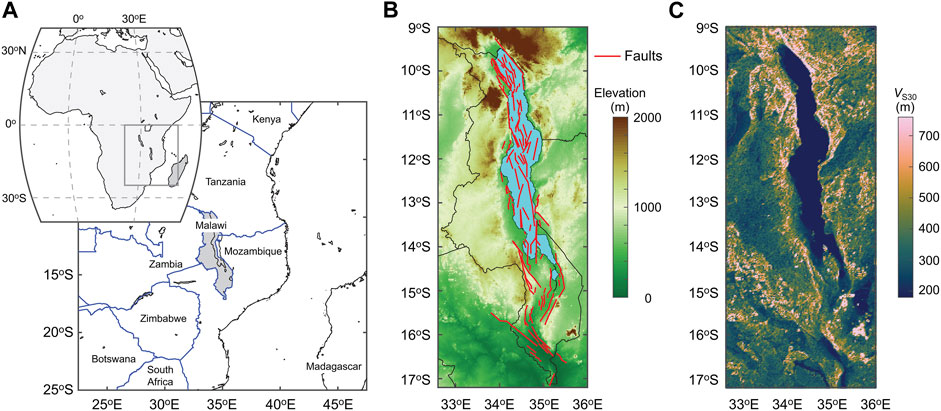
FIGURE 2. (A) Maps of Africa and eastern African counties around Malawi (shaded grey), (B) Digital elevation model and finite fault sources for Malawi (Williams et al., 2022b). (C) VS30 map based on Wald and Allen (2007).
The most recent PSHA model for Malawi considers fault sources collated within the Malawi Seismogenic Source Model (MSSM; Williams et al., 2022b; Williams et al., 2023), in addition to the areal sources delineated by Poggi et al. (2017). Slip rates are assigned to the MSSM sources based on geodetic (Wedmore et al., 2021) and seismic reflection data from Lake Malawi (Shillington et al., 2020), and the magnitudes of earthquakes along these faults are inferred from empirical fault scaling (Leonard, 2010). The considered fault sources are shown in Figure 2B; the faults are concentrated near Lake Malawi and some border and intra-basin faults are inland. To reflect aleatory uncertainty in the MSSM sources down-dip extent and how geometric segmentation influences earthquake occurrence, five source models are generated by considering the direct use of the MSSM and four magnitude-frequency distributions (truncated exponential and characteristic models) with two different hypotheses regarding fault width. In total, the five source models are implemented in a logic tree.
Another key element of the PSHA model for Malawi is the selection of ground motion models. Since country-specific ground motion models are not available in Malawi (Holmgren et al., 2023), four ground motion models (Atkinson and Adams, 2013; Akkar et al., 2014; Boore et al., 2014; Chiou and Youngs, 2014) are adopted from other seismic regions and implemented in the logic tree. The model by Atkinson and Adams (2013) is for the stable continental region; the model by Akkar et al. (2014) is from the European SHARE project; and the models by Boore et al. (2014) and Chiou and Youngs (2014) are from the NGA-West2 project. These four models are regarded to be equally applicable. Due to the unavailability of local site condition information (e.g., measured near-surface shear wave velocity profiles) for the whole Malawi, the USGS’s global VS30 data (Wald and Allen, 2007) are adopted to reflect the first-order site amplifications in the ground motion intensity estimation. The VS30 map for Malawi is shown in Figure 2C.
By combining 20 logic tree branches (i.e., 5 source models and 4 ground motion models) and taking PGA as a representative ground motion parameter (note: this choice is consistent with seismic fragility functions for non-engineered masonry structures; Novelli et al., 2021), Williams et al. (2023) generated stochastic event catalogs for 10 million years, evaluated site-specific seismic hazard curves, and produced probabilistic seismic hazard maps at multiple return periods. The maps presented in Williams et al. (2023) were generated for a 0.2° by 0.2° latitude-longitude grid. However, to allow results with higher spatial resolution and a better integration with exposure and vulnerability data in Malawi, in this study, we recalculated the hazard maps for a 0.1° grid. Figure 3 shows the seismic hazard maps of Malawi in terms of PGA for the return periods of 100, 500, and 1,000 years. The displayed PGA maps are the mean of the 20 logic tree estimates. The current national seismic hazard map in Malawi is based on PGA specified at the return period of 1,000 years, while global/regional seismic hazard studies (e.g., Poggi et al., 2017) mainly consider the return period of 500 years. Therefore, the three return periods considered in Figure 3 are relevant from practical viewpoints. At the return period of 100 years, the influence of the fault sources is not obvious (Figure 3A). With the increase of the return period, high seismic hazard areas, e.g., near Karonga in northern Malawi and near Blantyre and Zomba in southern Malawi, are more highlighted in Figures 3B,C. To appreciate the effects of the epistemic and aleatory uncertainty of the hazard components (i.e., seismic source models and ground motion models), 20 PGA maps for the return period of 1,000 years are shown in Figure 4. The results clearly demonstrate large variability of the seismic hazard estimates due to the seismic source models and ground motion models (see Williams et al. (2023) for further discussions).
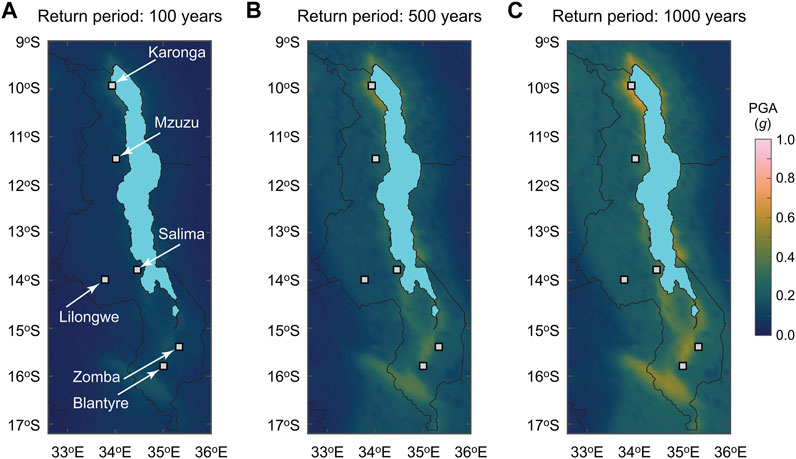
FIGURE 3. Seismic hazard maps of Malawi in terms of peak ground acceleration for the return periods of (A) 100 years, (B) 500 years, and (C) 1,000 years. The seismic hazard values are adjusted for average shear wave velocities based on Wald and Allen (2007).
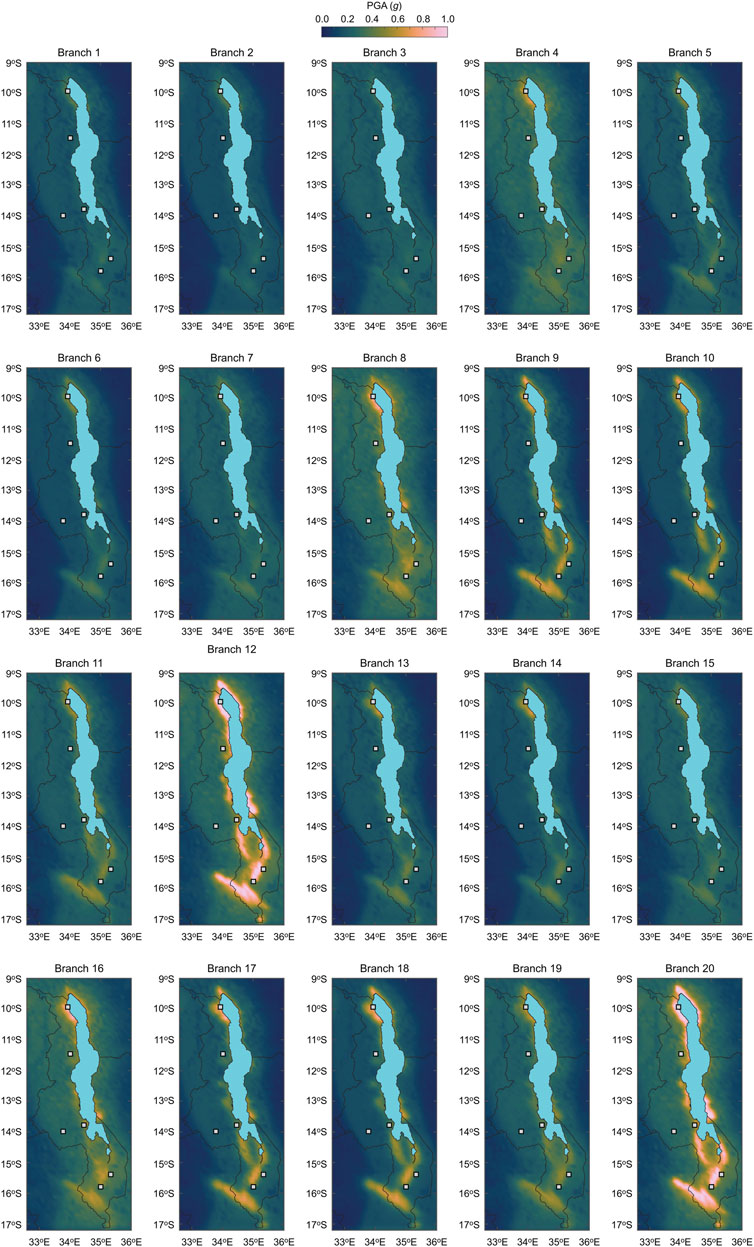
FIGURE 4. Seismic hazard maps of Malawi in terms of peak ground acceleration for the return period of 1,000 years by considering 20 logic tree branches.
The calculations of the full PSHA results require significant computational resources. To facilitate the collapse risk calculations of Malawian masonry buildings on a national scale, the upper-tail approximation of the PSHA results by utilizing the extracted seismic hazard values at the nine return period levels (i.e., 100, 200, 500, 750, 1,000, 2,000, 2,500, 5,000, and 10,000 years) for individual locations. For each location, the extracted PGA data are plotted on different probability papers and the most suitable probability distribution is identified through the least squares fitting. In this study, four candidate distributions, i.e., lognormal, Gumbel, Frechet, and Weibull, are considered. The horizontal and vertical plotting positions (x and y, respectively) of the lognormal, Gumbel, Frechet, and Weibull distributions are summarized in the second column of Table 1. To select the most suitable model among the four candidates, the linear correlation coefficient between the values from PSHA and the fitted model is used. Once the best-fitting model is identified (i.e., probability distribution as well as intercept and slope of the fitted linear line y = c1 + c2 × x), samples of the annual maximum PGA at a given site can be generated from the formulae in the third column of Table 1.
TABLE 1. Plotting positions and simulation formulas for different probability distributions.
Figure 5A shows the correlation coefficients between the extracted PSHA data and the fitted upper tail approximation models at 2,905 locations (grid spacing of 0.1°). On the other hand, Figure 5B shows the selected distribution types of the best-fitting upper tail approximation models. The minimum correlation coefficients are above 0.999 at all locations. The best-fitting models are either Weibull or lognormal distribution. Using the simulation formulae (Table 1), the annual maximum PGA samples can be generated rapidly, and the simulated PGA values can be used for probabilistic seismic risk analysis.
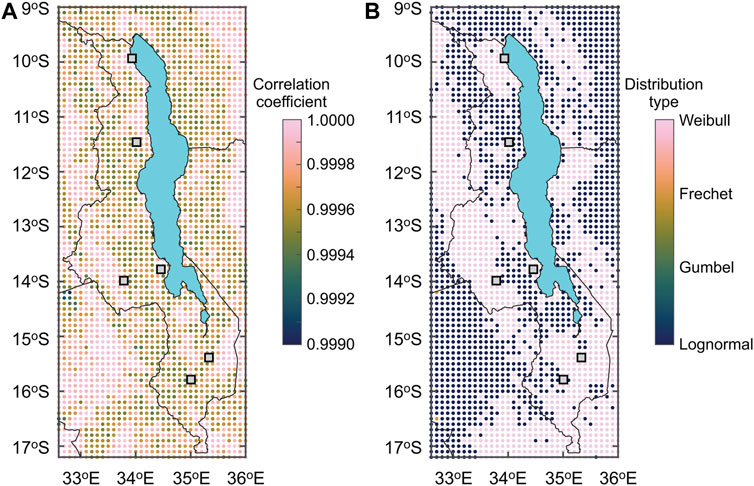
FIGURE 5. (A) Correlation coefficient of the probabilistic seismic hazard data and the fitted upper tail approximation models. (B) Distribution type of the best-fitting upper tail approximation models.
Housing construction in Malawi has a crucial influence in determining the socioeconomic and financial impacts of earthquakes (and other natural hazards). Houses in local communities are one of the most vulnerable elements for a variety of reasons: 1) poor quality of construction materials, 2) poor and variable construction practice, and 3) lack of building design and construction provisions. Although practical guidelines for constructing safer houses are available (e.g., Bureau TNM, 2016), the uptake and adoption of such practices are not prevalent and slow.
The Malawi census serves as a main reliable source of information on the population and residential buildings in Malawi (National Statistical Office of Malawi, 2018). In the census, existing dwellings are divided into three categories: (a) permanent (made of burnt clay bricks and iron sheet roofs), (b) semi-permanent (made of unburnt clay bricks and thatched roofs), and (c) traditional (made of rammed earth, daub and wattle or timber walls and lightweight thatched roofs). Out of 4,805,431 housing units listed in the 2018 census, 41.1% are permanent, 23.0% are semi-permanent, and 35.9% are traditional. 97% of the census surveyed dwellings can be considered as low-rise unreinforced constructions, consisting of owner/family occupied (85%), rented (12%), and institutional or other types (3%). The finest spatial administrative units of the census-based building data are enumeration areas. In this study, the enumeration areas are used for the spatial data resolutions of the seismic risk assessments. For each enumeration area, the numbers of permanent, semi-permanent, and traditional housing units are obtained by relating district-level information and enumeration area-level information. Figures 6A,B show maps of the population and masonry housing units at 18,714 enumeration areas. The numbers are adjusted for Year 2023 from Year 2018 by multiplying a factor of 1.192 (https://www.worldometers.info/world-population/malawi-population/).
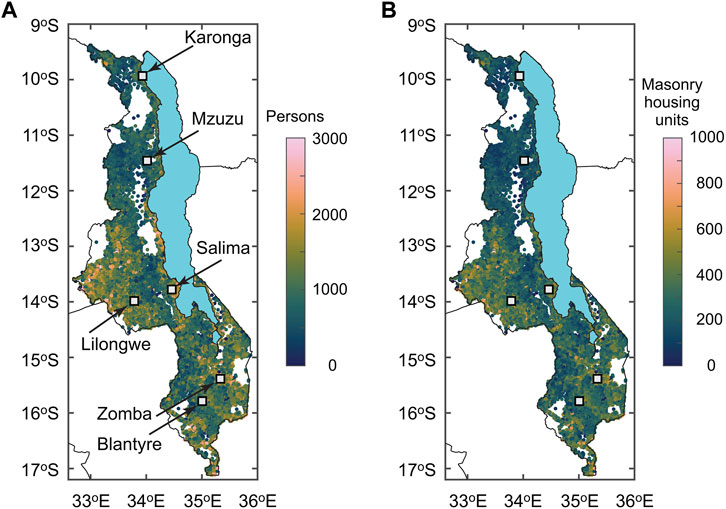
FIGURE 6. (A) Population map and (B) masonry housing unit map based on Malawi census enumeration areas. The numbers are adjusted for Year 2023.
Unreinforced masonry buildings in Malawi are vulnerable to seismic loading. As part of the PREPARE project, Kloukinas et al. (2020) conducted local building surveys in southern Malawi. A series of in situ and laboratory tests were conducted to measure the strengths of local construction materials in Malawi (Kloukinas et al., 2019) and to evaluate the in-plane and out-of-plane strengths of masonry wall panels (Voyagaki et al., 2020). These experimental investigations indicated low strength values of locally-sourced construction materials (both bricks and mortar), compared to typical strength values reported in the literature for the same construction type, and significant variability of material strengths due to construction conditions. Based on the gathered local data from the surveys and laboratory tests and detailed geometrical and structural features of Malawian masonry buildings, Novelli et al. (2021) applied the Failure Mechanism Identification and Vulnerability Evaluation (FaMIVE) method (D’Ayala and Speranza, 2003) to 646 surveyed façades to assess critical failure modes (e.g., gable failure, out-of-plane failure, strip failure, and in-plane failure). The experimental results were also useful for developing finite-element models of Malawian masonry buildings to evaluate the stability of unreinforced masonry buildings under seismic excitations (Giordano et al., 2021).
The seismic fragility functions developed by Novelli et al. (2021) distinguish buildings based on the geometric and structural features and associate them with three vulnerability classes: A (poor-quality construction), B (medium-quality construction), and C (high-quality construction). Typical buildings that are classified as the vulnerability classes A, B, and C are shown in Figures 7A–C, respectively. Buildings with vulnerability class A are made of mud mortar combined with fired bricks of poor fabric quality and unfired bricks from poor to high fabric quality and have smaller building footprints than a typical floor plan of 8 m × 6 m (Figure 7A). Buildings with vulnerability class B are made of fired bricks characterized from poor to a good quality fabric and have weak connections between walls due to the presence of mud mortar in these houses (Figure 7B). Buildings with vulnerability class C are made of fired bricks from poor to good quality fabric and cement mortar with the presence of strengthening elements (e.g., ring beams) and have larger floor plans than a typical plan of 8 m × 6 m (Figure 7C).
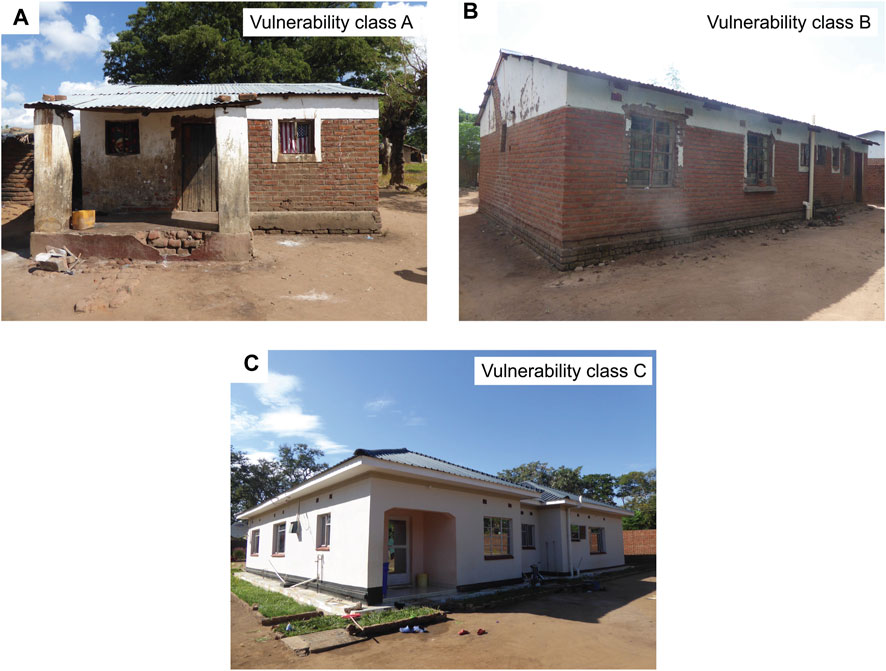
FIGURE 7. Photos of typical masonry houses in Malawi with (A) seismic vulnerability class A, (B) seismic vulnerability class A, and (C) seismic vulnerability class (C).
In developing seismic fragility functions of non-engineered masonry buildings in Malawi, three types of ultimate (collapse) behavior are considered in terms of static pushover (SPO) curves (i.e., post-yield part of a force-displacement curve). To capture the variable structural configurations of actual buildings in Malawi, an SPO curve is obtained for each surveyed wall/façade using the measured building geometry (Novelli et al., 2021) and the material strength data from the in situ and laboratory tests (Kloukinas et al., 2019; Voyagaki et al., 2020). The SPO curves are derived by assuming that the structural behavior of façades may be governed by geometric instability (D’Ayala and Paganoni, 2011), limited ductility (Lagomarsino, 2015), and strength degradation (Tomazevic, 2007). The geometric instability behavior and the strength degradation behavior consider three branches of an SPO curve (with different definitions of the control points of the SPO curve), whereas the limited ductility behavior considers two branches of an SPO curve without a plateau in the pushover curve. The SPO curves are obtained for all surveyed façades by considering three ultimate behavioral patterns (reflecting the variability of the geometrical structural features). Subsequently, the SPO2IDA tool (Vamvatsikos and Cornell, 2006) is employed to convert SPO curves to incremental dynamic analysis (IDA) curves. The IDA curves are then used to derive seismic fragility curves for nine combinations of building vulnerability classes (A, B, and C) and failure modes (geometric instability, limited ductility, and strength degradation).
The collapse fragility functions for the vulnerability classes A, B, and C by considering geometric instability, limited ductility, and strength degradation as ultimate behavior are shown in Figures 8A–C, respectively. The input seismic intensity parameter for these collapse fragility functions is PGA, and the form of the collapse fragility function is the lognormal distribution. For the same ultimate behavior, buildings with the seismic vulnerability class A are more vulnerable (i.e., positioned towards the left-hand side of the figure), followed by those with the seismic vulnerability classes B and C. The order of seismic vulnerability is consistent with the building survey classifications. When the collapse fragility functions for different ultimate behavior are compared, those with limited ductility are more vulnerable than those with geometric instability or strength degradation. It is also important to mention that the collapse limit state that is predicted through the seismic fragility functions shown in Figure 8 is for a building façade, and this may not coincide with the complete destruction of a house.
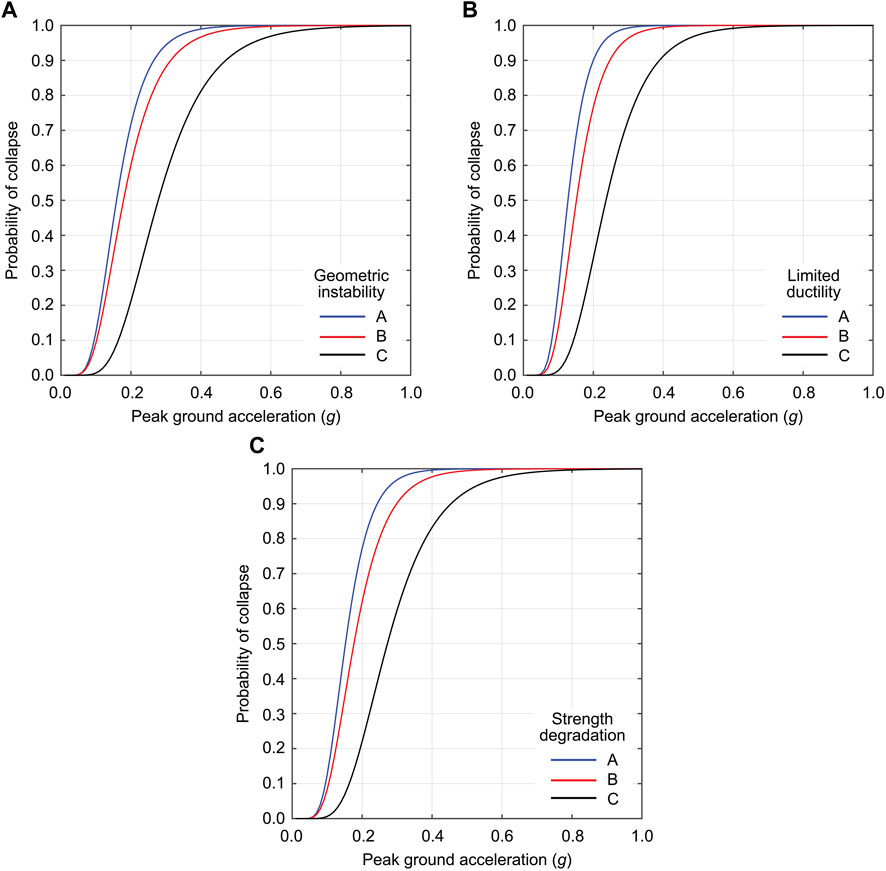
FIGURE 8. Collapse fragility functions for the vulnerability classes A, B, and C based on different ultimate behavior in terms of static pushover curves: (A) geometric instability, (B) limited ductility, and (C) strength degradation.
The final task of the exposure-vulnerability modules is to assign seismic fragility functions (Figure 8) to the census building data, which are specified as permanent, semi-permanent, and traditional. The association of the collapse fragility functions and the census housing categories is conducted by reflecting local knowledge and experiences gained through the building surveys and experiments conducted in Malawi (Kloukinas et al., 2020; Novelli et al., 2021). In this study, FaMIVE-based collapse fragility functions with the vulnerability classes A, B, and C (Figures 8A–C) are assigned to traditional, semi-permanent, and permanent buildings, respectively. For each vulnerability class, there are three possible ultimate behavioral patterns (i.e., geometrical instability, limited ductility, and strength degradation). The different ultimate behavior is considered to be equally likely.
With the site-specific seismic hazard curves in terms of the annual maximum PGA (Section 2.1) and the building collapse fragility functions (Section 2.3) for the census-based building inventory of masonry houses (Section 2.2), a building collapse risk curve for each building class (i.e., permanent, semi-permanent, and traditional) can be derived via Monte Carlo methods by implementing the following simulation steps for each building location and type:
Step 1:. Set the number of simulations N (e.g., 1 million samples with each representing a 1-year period).
Step 2:. Extract the PSHA results for a site of interest (i.e., PGA values at the nine return period levels) and perform the upper tail approximation of a seismic hazard curve. Then, simulate N realizations of the annual maximum PGA.
Step 3:. For individual annual maximum PGA values, evaluate the collapse probability of a building. Uncertainty associated with the ultimate SPO curve behavior can be accounted for by choosing one of the three seismic fragility functions for the suitable seismic vulnerability class according to the assigned weights. Specifically, for a given PGA value, the collapse probability can be obtained for the selected seismic fragility function. A standard uniform random number is generated and compared with the obtained collapse probability to determine whether the building is in the collapse damage state.
Step 4:. Post-processing of the results from Step 3 can be presented as the collapse probability risk curve or a collapse probability map for a selected return period.
When the numbers for individual building classes are available (e.g., Figure 6), the results can be used to calculate the number of collapsed buildings at each location (e.g., enumeration area) from the binomial distribution B (n,p) (i.e., the number of trials n corresponds to the number of buildings and the event probability p corresponds to the collapse probability), and these results can also be visualized in a map format. When the building cost information is available, the collapse risk assessment can be extended to seismic loss estimation, thereby facilitating the financial seismic risk analysis (note: this is outside of the current study’s scope; see Giordano et al., 2023). It is important to emphasize that the collapse simulation based on the upper tail approximation is very fast because a full implementation of site-specific PSHA is circumvented. This allows the simulations of the building collapse risk over a large spatial region.
Moreover, using similar quantitative seismic risk analysis methods, retrospective seismic risk assessments have been conducted by focusing on the 1989 Salima earthquake (Kloukinas et al., 2020) and the 2009 Karonga earthquake (Goda et al., 2022). In these investigations, predicted earthquake risks in terms of damaged buildings were compared with the reported earthquake damage from these historical events. The results indicated that the predicted and reported earthquake damage extents overlap, but the uncertainties associated with the predicted and reported damage estimates are significant. For instance, seismic hazard information was lacking, exposure information was incomplete, while the damage extent might have been underreported. Therefore, such retrospective assessments were insightful but not conclusive, and the results of the retrospective analyses must be interpreted carefully.
Seismic hazard assessments in Malawi depend significantly on the fault source models and the ground motion models. Williams et al. (2023) considered 20 branches in the logic tree to capture uncertainty (Figure 4). This uncertainty can be propagated to the building collapse risk assessments. To demonstrate the collapse risk assessment of masonry buildings at specific locations, Karonga and Salima are chosen (Figure 6A). Among the major cities in Malawi, Karonga has the highest seismic hazard due to the proximity to local faults (including the St. Mary Fault which hosted the 2009 sequence; Biggs et al., 2010; Macheyeki et al., 2009; Figure 2B) and the Livingstone Fault. Salima has a moderate seismic hazard and experienced the Mw 6.3 earthquake in 1989 (Gupta and Malomo, 1989). Figures 9A,B show the seismic hazard curves for Karonga and Salima. In the figures, seismic hazard curves for the 20 branches and the weighted average are shown. The effects of epistemic uncertainty are significant at these locations. For instance, the PGA values at the return period of 1,000 years for Karonga (Figure 9A) range from 0.4 g to 1.0 g.
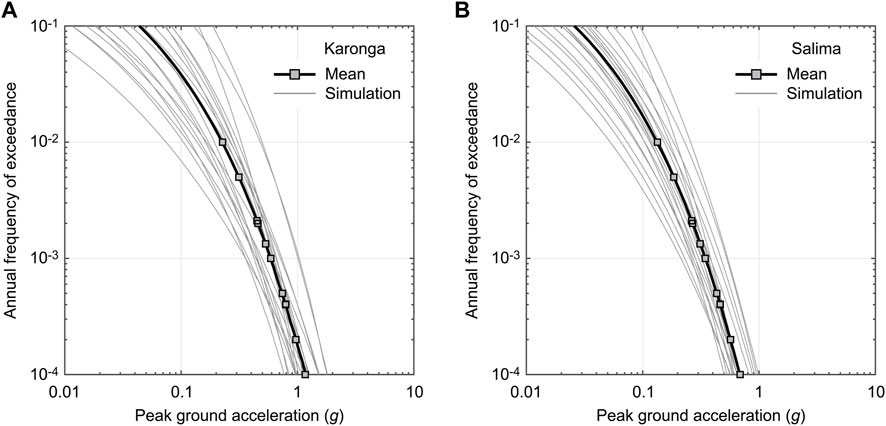
FIGURE 9. Seismic hazard curves for (A) Karonga and (B) Salima. The mean and 20 logic tree branches are shown for each location.
By considering individual 20 seismic hazard curves for each location, the building collapse risk curves for a permanent house are evaluated and the results are shown in Figure 10. To assess the effects of the ultimate behavior of SPO curves, three cases are considered (i.e., strength degradation, geometric instability, and limited ductility). In both Karonga and Salima, due to the proximity to several local faults (Figure 2B), the influence of the fault-based seismic hazard characterization is more significant than that of the ultimate collapse behavior. The individual collapse risk curves tend to increase rapidly at certain return period levels. This is due to the brittle nature of unreinforced masonry building failures in Malawi, represented by relatively steep slopes of the seismic fragility functions (Figure 8). Furthermore, Figure 11 compares the building collapse risk curves for permanent, semi-permanent, and traditional houses at Karonga and Salima considering different ultimate behavior (note: the variability due to hazard uncertainty is suppressed by considering the weighted average case). The results show the variations of the collapse risk curves for different house types (permanent versus semi-permanent versus traditional) and for different ultimate collapse behavioral patterns. The former corresponds to the differences of the collapse fragility functions for the vulnerability classes A, B, and C (Figure 8). It can be observed that the building classifications according to the vulnerability classes have significant impacts on the collapse risk curves. Overall, it is important to account for influences from seismic hazard uncertainty and seismic vulnerability uncertainty in the final building collapse risk assessments.
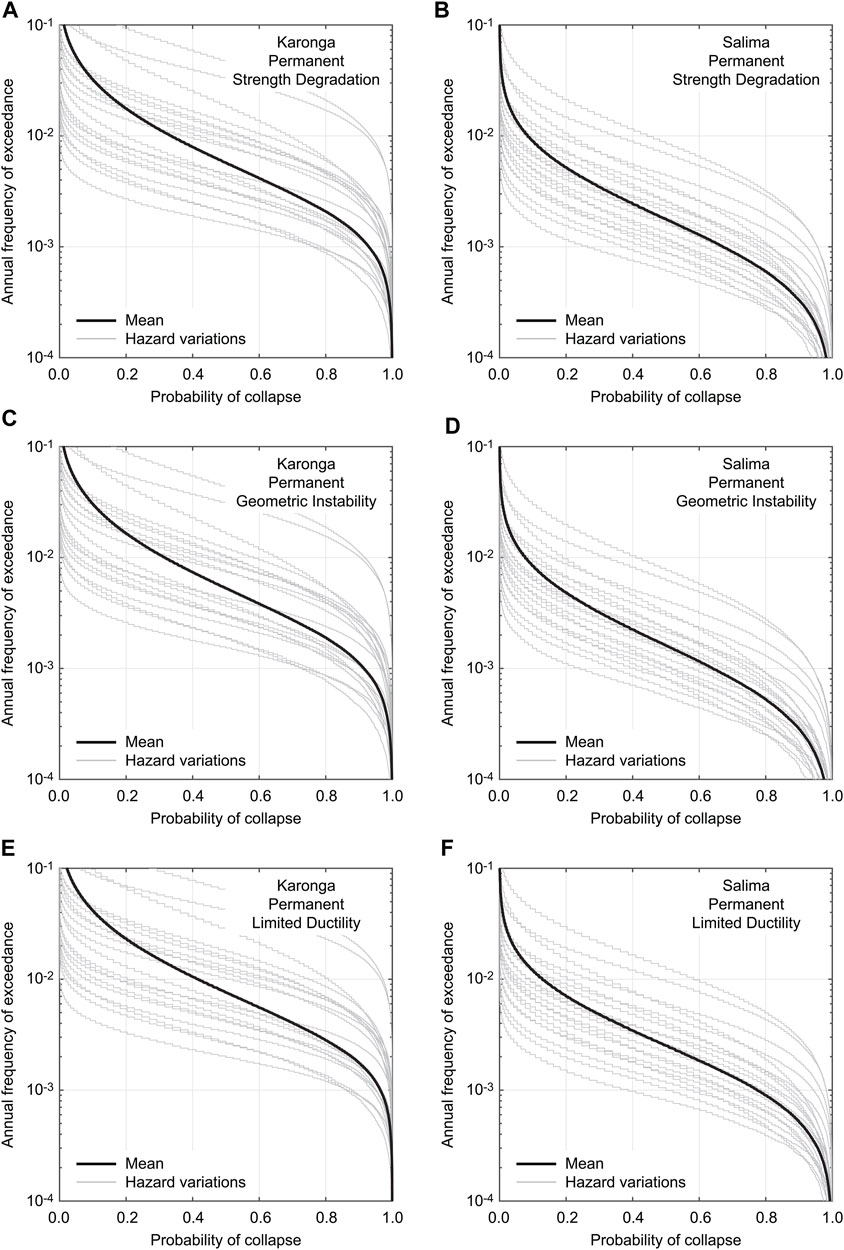
FIGURE 10. Building collapse risk curves for a permanent house at Karonga and Salima considering different ultimate behavior: (A, B) Strength degradation, (C, D) geometric instability, and (E, F) limited ductility.
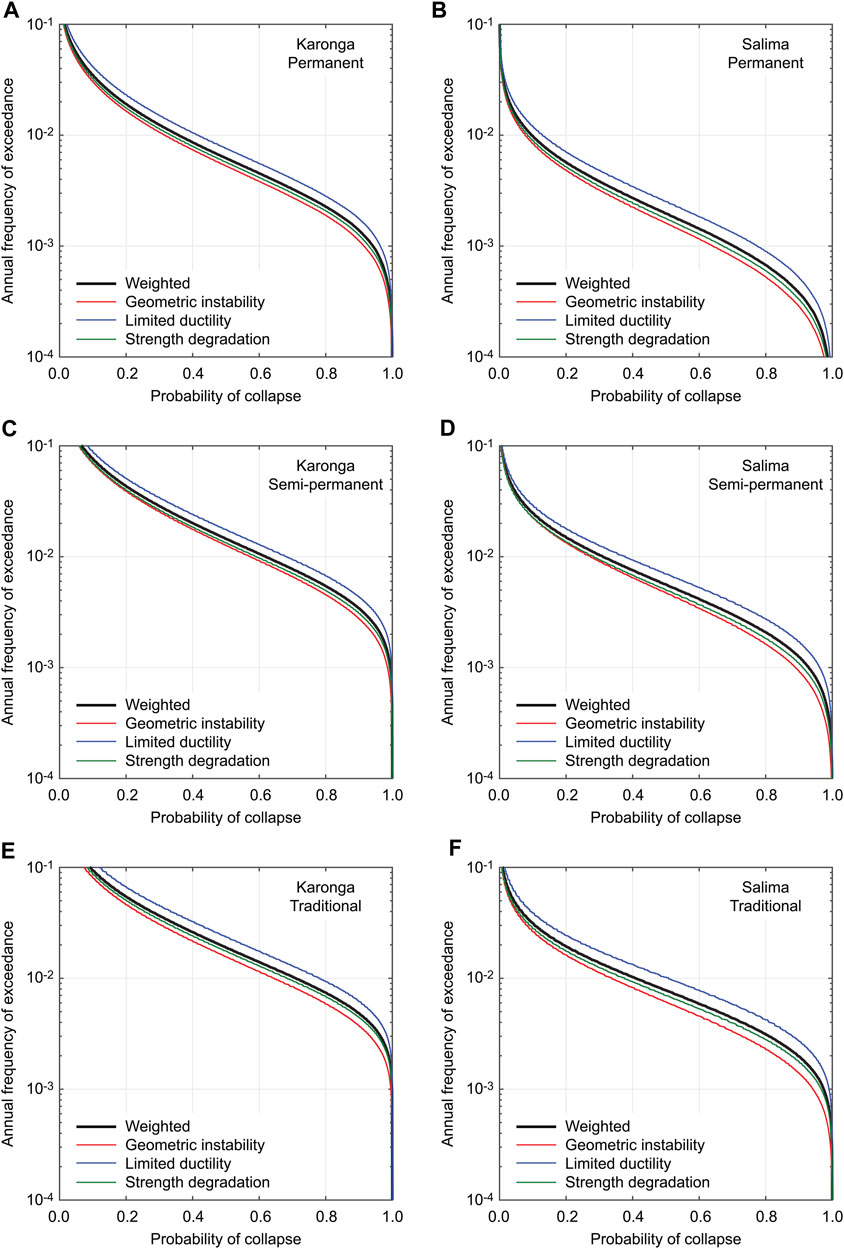
FIGURE 11. Building collapse risk curves for (A, B) permanent, (C, D) semi-permanent, and (E, F) traditional houses at Karonga and Salima considering different ultimate behavior.
By repeating the collapse risk assessments for three types of masonry houses (i.e., permanent, semi-permanent, and traditional) at the 2,905 grid locations, national level collapse risk assessments can be carried out. Figures 12A–C, Figures 12D–F, and Figures 12G–I show the collapse probability maps corresponding to the return periods of 100, 500, and 1,000 years for permanent, semi-permanent, and traditional houses, respectively. The PGA maps for the return periods of 100, 500 and 1,000 years are shown in Figures 3A–C, respectively. The seismic hazard inputs are based on the equally weighted cases and the seismic fragility functions consider three ultimate behavioral patterns of SPO curves. The collapse risk maps shown in Figure 12 are useful for appreciating the relative collapse risks for different building classes (permanent, semi-permanent, and traditional) and for different seismic hazard levels. It can be observed that the collapse risks for permanent houses that are away from Lake Malawi (e.g., near Lilongwe) are generally low, even for the long return period levels, whereas those near Karonga and north/south of Blantyre and Zomba are associated with relatively large collapse risks. With the increase of the seismic vulnerability from the class C (permanent) to A (traditional), the high collapse risks prevail over a wide region near Lake Malawi and along Shire River in southern Malawi. These high collapse risks can be understood by comparing the corresponding PGA maps (Figure 3) and the collapse fragility functions (Figure 8). Due to the anticipated poor seismic performance of semi-permanent and traditional houses in Malawi (which are mainly made of low-quality bricks with mud mortar and are not equipped with strengthening structural elements, such as ring beams and wall buttresses), the probability of building collapse increases rapidly when houses are subjected to PGA ≈0.15 g or greater. At the seismic hazard level of 500 to 1,000 years, most masonry houses are at high risks of structural collapse. The relative collapse risk information, such as Figure 12, is useful for identifying the risky areas within a country and for seismic design and strengthening purposes.
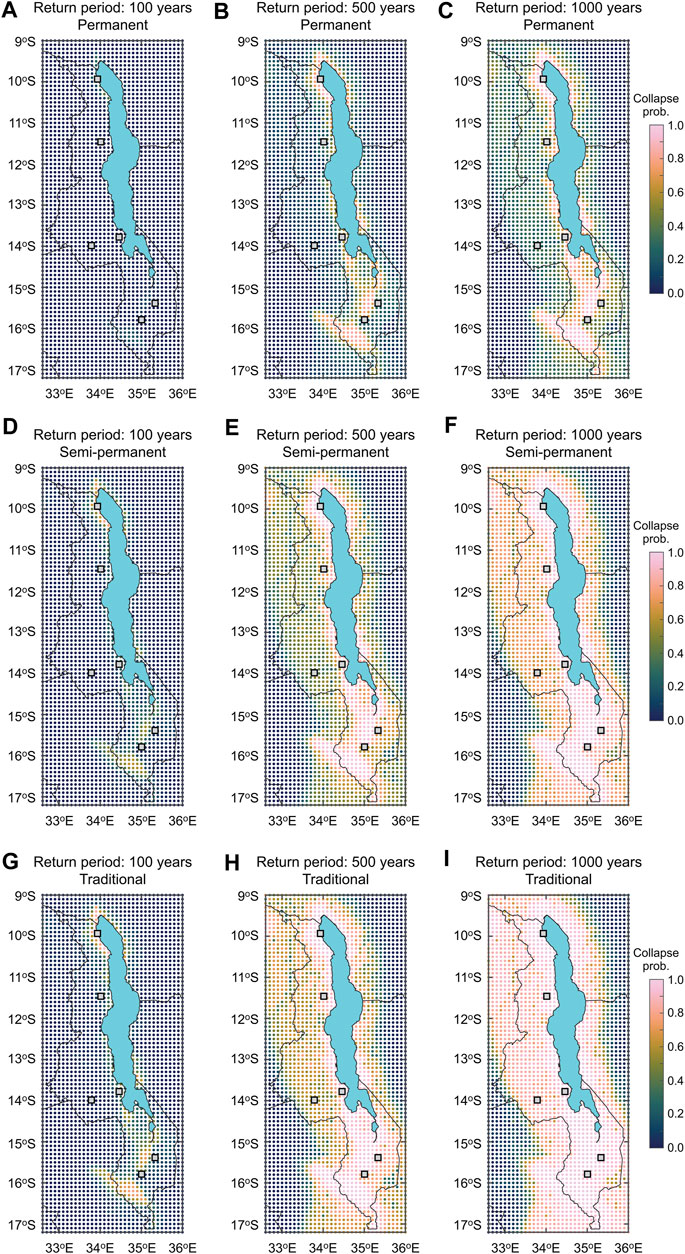
FIGURE 12. Collapse probability maps of (A–C) permanent, (D–F) semi-permanent, and (G–I) traditional houses corresponding to the return periods of 100, 500 and 1,000 years.
With the detailed exposure models of unreinforced masonry buildings in Malawi (Figure 6B), the number of collapsed buildings can be evaluated for each building type (permanent, semi-permanent, and traditional) by simulating the samples from the binomial distribution (Section 2.4). Such building collapse count maps of permanent, semi-permanent, and traditional houses corresponding to the return periods of 100, 500 and 1,000 years are shown in Figure 13. Because the numbers of permanent, semi-permanent, and traditional houses in individual enumeration areas are different and the spatial distribution of enumeration areas is not uniform, the results of the building collapse counts are rearranged at a 0.01° grid. This changes the number of spatial data points from 18,714 to 15,740. As baseline, the total number of permanent, semi-permanent, and traditional houses at the 15,740 grid points is shown in Figures 13A, E, I, respectively. The baseline building exposure data show that more permanent houses exist in southern Malawi (note: there are concentrations of permanent houses near major urban areas, such as Lilongwe, Mzuzu, and Karonga). On the other hand, many traditional houses exist in central Malawi near Lilongwe. The building collapse count maps show that the collapse risks for permanent houses are greater in southern Malawi due to the larger number of existing permanent houses and the relatively high seismic hazard in this region. The collapse risks for semi-permanent houses are concentrated south of Lake Malawi (e.g., Mangochi) and along the western coast of Lake Malawi. The collapse risks for traditional houses are higher in the surrounding regions of Lilongwe and Salima in central Malawi and near the southern boundary in Shire River Basin (where the Thyolo Fault is located). This type of collapse risk mapping quantifies how many buildings may be at risk and thus may be more relevant to emergency managers and policymakers.
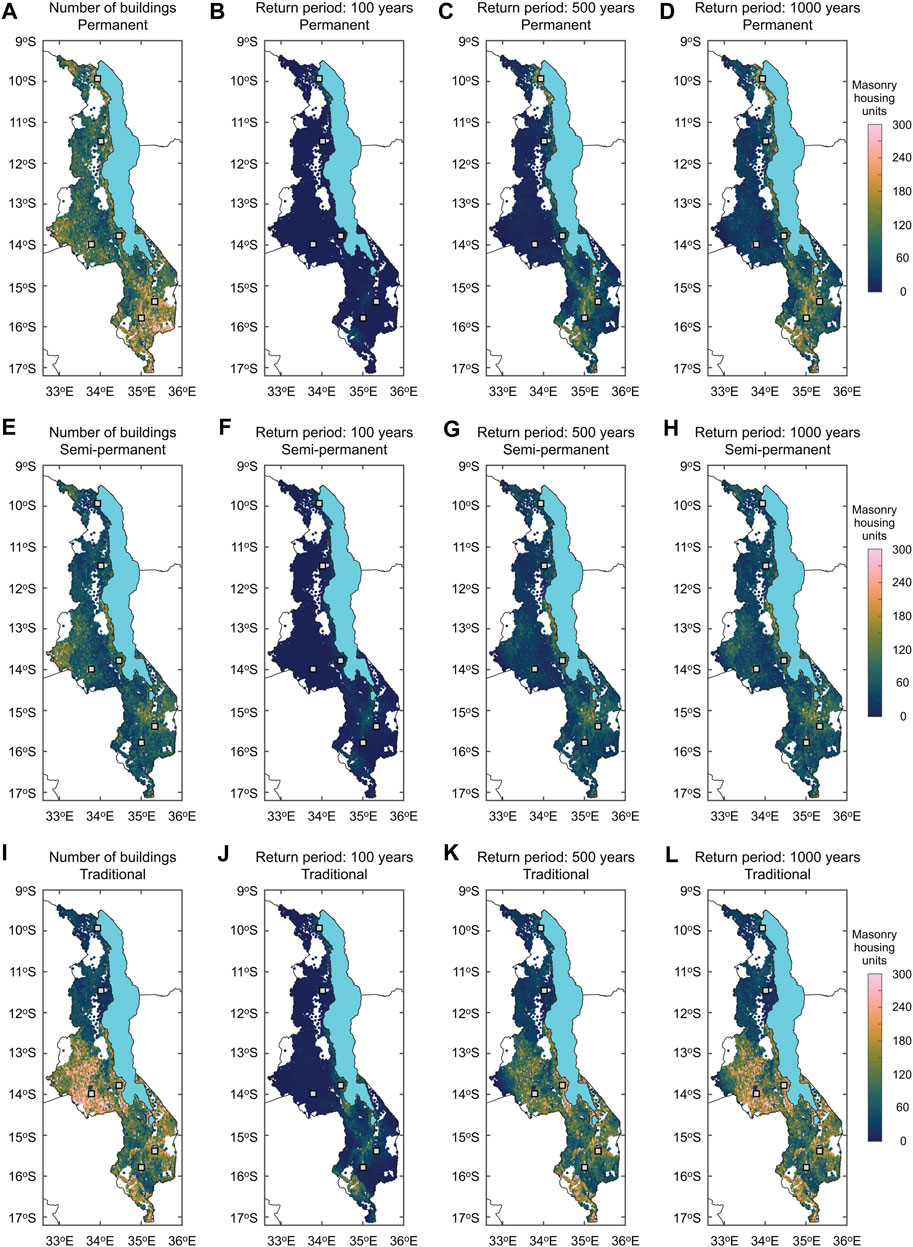
FIGURE 13. Building collapse count maps of (B–D) permanent, (F–H) semi-permanent, and (J–L) traditional houses corresponding to the return periods of 100, 500 and 1,000 years. Maps of the numbers of permanent, semi-permanent, and traditional buildings are shown in (A), (E), and (I).
This study developed a nationwide seismic collapse risk assessment tool and obtained results for non-engineered masonry houses in Malawi. The new seismic risk model incorporated the latest seismic hazard characterization of active faults in the southern segment of the East African Rift and country-specific collapse fragility functions that are applicable to Malawian masonry constructions. The fault-based seismic hazard model reflects the current understanding of the fault sources and ground motion intensities for Malawi and represent their uncertainties using 20 logic tree branches in the seismic hazard model. On the other hand, the bespoke collapse fragility functions for Malawi have been derived based on local building surveys, experimental tests of local construction materials, and plausible failure mechanisms of the main load-bearing structural elements of the Malawian houses. Overall, the new quantitative seismic risk model constitutes the significant improvements, compared to those without Malawi-specific hazard-exposure-vulnerability models, as typically done by international organizations. This calls for more fault-based seismic hazard models and local seismic vulnerability data to be collected elsewhere within the East African Rift’s Western Branch, where seismic risk is still typically evaluated using areal-based seismogenic sources (e.g., Poggi et al., 2017) and international reference models for building characteristics (e.g., WHE-PAGER classifications).
The seismic risk results were facilitated by the upper tail approximations of seismic hazard curves. For each building type and location, the collapse risk curves were derived by reflecting possible seismic hazard and vulnerability characteristics. Furthermore, the upper tail approximation method allowed the fast evaluations of building collapse risks at the national level, thereby informing emergency managers and seismic engineers of relative seismic risks in Malawi and of possible benefits of seismic strengthening (e.g., a change from the vulnerability class A to the vulnerability class C). On the other hand, the building collapse count maps provides emergency managers and policymakers with total risk exposure to the current building stock. The developed tools can also quantify epistemic uncertainty associated with the seismic hazard (e.g., seismic source models and ground motion models) and the building exposure-vulnerability (e.g., classification of buildings with respect to seismic vulnerability classes and ultimate building capacities).
To facilitate the uptake of the new seismic hazard and risk assessment tools for Malawi, the computer codes and the obtained results (e.g., building collapse probability maps) are made available in the Supplementary Material section. The dissemination of the quantitative seismic risk decision-support tools is one of the goals of the PREPARE project.
The datasets presented in this study can be found in online repositories. The names of the repository/repositories and accession number(s) can be found in the article/Supplementary Material.
KG: Conceptualization, Data curation, Formal Analysis, Funding acquisition, Investigation, Methodology, Project administration, Resources, Software, Validation, Visualization, Writing–original draft, Writing–review and editing. JW: Conceptualization, Data curation, Formal Analysis, Investigation, Methodology, Software, Validation, Visualization, Writing–original draft, Writing–review and editing. RD: Conceptualization, Data curation, Formal Analysis, Investigation, Methodology, Software, Validation, Visualization, Writing–original draft, Writing–review and editing. IN: Conceptualization, Investigation, Validation, Writing–review and editing.
The author(s) declare financial support was received for the research, authorship, and/or publication of this article. This study is supported by the Canada Research Chair program (950-232015) and the NSERC Discovery Grant (RGPIN-2019-05898). The seismic hazard calculations were performed using the computational facilities of the Advanced Computing Research Centre, University of Bristol http://www.bris.ac.uk/acrc/.
The authors declare that the research was conducted in the absence of any commercial or financial relationships that could be construed as a potential conflict of interest.
The author(s) declared that they were an editorial board member of Frontiers, at the time of submission. This had no impact on the peer review process and the final decision.
All claims expressed in this article are solely those of the authors and do not necessarily represent those of their affiliated organizations, or those of the publisher, the editors and the reviewers. Any product that may be evaluated in this article, or claim that may be made by its manufacturer, is not guaranteed or endorsed by the publisher.
The Supplementary Material for this article can be found online at: https://www.frontiersin.org/articles/10.3389/fbuil.2024.1333576/full#supplementary-material
Akkar, S., Sandıkkaya, M. A., and Bommer, J. J. (2014). Empirical ground-motion models for point- and extended-source crustal earthquake scenarios in Europe and the Middle East. Bull. Earthq. Eng. 12, 359–387. doi:10.1007/s10518-013-9461-4
Atkinson, G. M., and Adams, J. (2013). Ground motion prediction equations for application to the 2015 Canadian national seismic hazard maps. Can. J. Civ. Eng. 40, 988–998. doi:10.1139/cjce-2012-0544
Biggs, J., Nissen, E., Craig, T., Jackson, J., and Robinson, D. P. (2010). Breaking up the hanging wall of a rift-border fault: the 2009 Karonga earthquakes, Malawi. Geophys. Res. Lett. 37, L11305. doi:10.1029/2010gl043179
Boore, D. M., Stewart, J. P., Seyhan, E., and Atkinson, G. M. (2014). NGA-West2 equations for predicting PGA, PGV, and 5% damped PSA for shallow crustal earthquakes. Earthq. Spectra 30, 1057–1085. doi:10.1193/070113eqs184m
Bureau TNM (2016). Safer house construction guidelines. Available at: https://issuu.com/saferconstructionguidelines/docs/no-crocini.
Chiou, B. S. J., and Youngs, R. R. (2014). Update of the Chiou and Youngs NGA model for the average horizontal component of peak ground motion and response spectra. Earthq. Spectra 30, 1117–1153. doi:10.1193/072813eqs219m
Cornell, C. A., Jalayer, F., Hamburger, R. O., and Foutch, D. A. (2002). Probabilistic basis for 2000 SAC Federal Emergency Management Agency steel moment frame guidelines. J. Struct. Eng. 128, 526–533. doi:10.1061/(asce)0733-9445(2002)128:4(526)
D’Ayala, D., and Paganoni, S. (2011). Assessment and analysis of damage in L’Aquila historic city centre after 6th April 2009. Bull. Earthq. Eng. 9, 81–104. doi:10.1007/s10518-010-9224-4
D’Ayala, D., and Speranza, E. (2003). Definition of collapse mechanisms and seismic vulnerability of historic masonry buildings. Earthq. Spectra 19, 479–509. doi:10.1193/1.1599896
Flannery, J. W., and Rosendahl, B. R. (1990). The seismic stratigraphy of Lake Malawi, Africa: implications for interpreting geological processes in lacustrine rifts. J. Afr. Earth Sci. (and the Middle East) 10, 519–548. doi:10.1016/0899-5362(90)90104-m
Giordano, N., De Risi, R., Macdonald, J., Goda, K., Kafodya, I., and Ngoma, I. (2023). Implications of building code enforcement and urban expansion on future earthquake loss in East Africa: case study – Blantyre, Malawi. Natural Hazards 117, 1083–1104. doi:10.1007/s11069-023-05895-1
Giordano, N., De Risi, R., Voyagaki, E., Kloukinas, P., Novelli, V., Kafodya, I., et al. (2021). Seismic fragility models for typical non-engineered URM residential buildings in Malawi. Structures 32, 2266–2278. doi:10.1016/j.istruc.2021.03.118
Goda, K., Gibson, E. D., Smith, H. R., Biggs, J., and Hodge, M. (2016). Seismic risk assessment of urban and rural settlements around Lake Malawi. Frontiers in Built Environment 2. doi:10.3389/fbuil.2016.00030
Goda, K., Novelli, V., De Risi, R., Kloukinas, P., Giordano, N., Macdonald, J., et al. (2022). Scenario-based earthquake risk assessment for central-southern Malawi: the case of the Bilila-Mtakataka fault. International Journal of Disaster Risk Reduction 67, 102655. doi:10.1016/j.ijdrr.2021.102655
Gupta, H. K., and Malomo, S. (1995). The Malawi earthquake of March 10, 1989: report of field survey. Seismological Research Letters 66, 20–27. doi:10.1785/gssrl.66.1.20
Hodge, M., Biggs, J., Fagereng, Å., Mdala, H., Wedmore, L. N. J., and Williams, J. N. (2020). Evidence from high-resolution topography for multiple earthquakes on high slip-to-length fault scarps: the Bilila-Mtakataka fault, Malawi. Tectonics 39, e2019TC005933. doi:10.1029/2019tc005933
Hodge, M., Biggs, J., Goda, K., and Aspinall, W. (2015). Assessing infrequent large earthquakes using geomorphology and geodesy: the Malawi Rift. Natural Hazards 76, 1781–1806. doi:10.1007/s11069-014-1572-y
Holmgren, J. M., Werner, M. J., Goda, K., Villani, M., Silva, V., Chindandali, P., et al. (2023). A relocated earthquake catalog and ground motion database for the southern East African rift system. Earthquake Spectra 39, 1911–1929. doi:10.1177/87552930231173450
Jackson, J., and Blenkinsop, T. (1997). The Bilila-Mtakataka fault in Malawi: an active, 100-km long, normal fault segment in thick seismogenic crust. Tectonics 16, 137–150. doi:10.1029/96tc02494
Kloukinas, P., Kafodya, I., Ngoma, I., Novelli, V., Macdonald, J., and Goda, K. (2019). “Strength of materials and masonry structures in Malawi,” in Proceedings of the 7th International Conference on Structural Engineering, Mechanics and Computation (SEMC), Cape Town, South Africa, September 2019.
Kloukinas, P., Kafodya, I., Ngoma, I., Novelli, V., Macdonald, J., and Goda, K. (2020). A building classification scheme of housing stock in Malawi for earthquake risk assessment. Journal of Housing and the Built Environment 35, 507–537. doi:10.1007/s10901-019-09697-5
Lagomarsino, S. (2015). Seismic assessment of rocking masonry structures. Bulletin of Earthquake Engineering 13, 97–128. doi:10.1007/s10518-014-9609-x
Leonard, M. (2010). Earthquake fault scaling: self-consistent relating of rupture length, width, average displacement, and moment release. Bulletin of the Seismological Society of America 100, 1971–1988. doi:10.1785/0120090189
Macheyeki, A. S., Mdala, H., Chapola, L. S., Manhiça, V. J., Chisambi, J., Feitio, P., et al. (2015). Active fault mapping in Karonga-Malawi after the December 19, 2009 Ms 6.2 seismic event. Journal of African Earth Sciences 102, 233–246. doi:10.1016/j.jafrearsci.2014.10.010
Mitchell-Wallace, K., Jones, M., Hillier, J., and Foote, M. (2017). Natural catastrophe risk management and modelling: a practitioner's guide. Hoboken, New Jersey: Wiley-Blackwell.
National Statistical Office of Malawi (2018). Population and housing census. Available at: http://www.nsomalawi.mw/index.php%3Foption%3Dcom_content%26view%3Darticle%26id%3D226:2018-malawi-population-and-housing-census%26catid%E2%80%89%3D%E2%80%898:reports%26Itemid%E2%80%89%3D%E2%80%896.
Novelli, V. I., De Risi, R., Ngoma, I., Kafodya, I., Kloukinas, P., Macdonald, J., et al. (2021). Fragility curves for non-engineered masonry buildings in developing countries derived from real data based on structural surveys and laboratory tests. Soft Computing 25, 6113–6138. doi:10.1007/s00500-021-05603-w
Poggi, V., Durrheim, R., Mavonga Tuluka, G., Weatherill, G., Gee, R., Pagani, M., et al. (2017). Assessing seismic hazard of the East African rift: a pilot study from GEM and AfricaArray. Bulletin of Earthquake Engineering 15, 4499–4529. doi:10.1007/s10518-017-0152-4
Shillington, D. J., Scholz, C. A., Chindandali, P. R., Gaherty, J. B., Accardo, N. J., Onyango, E., et al. (2020). Controls on rift faulting in the north basin of the Malawi (nyasa) rift, East Africa. Tectonics 39, e2019TC005633. doi:10.1029/2019tc005633
Tomazevic, M. (2007). Damage as a measure for earthquake-resistant design of masonry structures: slovenian experienceThis article is one of a selection of papers published in this Special Issue on Masonry. Canadian Journal of Civil Engineering 34, 1403–1412. doi:10.1139/l07-128
Vamvatsikos, D., and Cornell, C. A. (2006). Direct estimation of the seismic demand and capacity of oscillators with multi-linear static pushovers through IDA. Earthquake Engineering & Structural Dynamics 35, 1097–1117. doi:10.1002/eqe.573
Voyagaki, E., Kloukinas, P., Novelli, V., De Risi, R., Kafodya, I., Ngoma, I., et al. (2020). “Masonry panel testing in Malawi,” in Proceedings of the 17th World Conference on Earthquake Engineering, Sendai, Japan, October 2020.
Wald, D. J., and Allen, T. I. (2007). Topographic slope as a proxy for seismic site conditions and amplification. Bulletin of the Seismological Society of America 97, 1379–1395. doi:10.1785/0120060267
Wedmore, L. N. J., Biggs, J., Floyd, M., Fagereng, Å., Mdala, H., Chindandali, P., et al. (2021). Geodetic constraints on cratonic microplates and broad strain during rifting of thick southern African lithosphere. Geophysical Research Letters 48, e2021GL093785. doi:10.1029/2021gl093785
Wedmore, L. N. J., Biggs, J., Williams, J. N., Fagereng, Å., Dulanya, Z., Mphepo, F., et al. (2020). Active fault scarps in southern Malawi and their implications for the distribution of strain in incipient continental rifts. Tectonics 39, e2019TC005834. doi:10.1029/2019tc005834
Williams, J. N., Wedmore, L. N., Scholz, C. A., Kolawole, F., Wright, L. J., Shillington, D. J., et al. (2022b). The Malawi active fault database: an onshore-offshore database for regional assessment of seismic hazard and tectonic evolution. Geochemistry, Geophysics, Geosystems 23, e2022GC010425. doi:10.1029/2022gc010425
Williams, J. N., Wedmore, L. N. J., Fagereng, A., Werner, M., Mdala, H., Shillington, D., et al. (2022a). Geologic and geodetic constraints on the magnitude and frequency of earthquakes along Malawi’s active faults: the Malawi Seismogenic Source Model (MSSM). Natural Hazards and Earth System Sciences 22, 3607–3639. doi:10.5194/nhess-22-3607-2022
Williams, J. N., Werner, M. J., Goda, K., Wedmore, L. N. J., De Risi, R., Biggs, J., et al. (2023). Fault-based probabilistic seismic hazard analysis in regions with low strain rates and a thick seismogenic layer: a case study from Malawi. Geophysical Journal International 233, 2172–2207. doi:10.1093/gji/ggad060
Keywords: building collapse risk, masonry structure, unreinforced, seismic hazard, risk management, Malawi
Citation: Goda K, Williams J, De Risi R and Ngoma I (2024) Probabilistic seismic collapse risk assessment of non-engineered masonry buildings in Malawi. Front. Built Environ. 10:1333576. doi: 10.3389/fbuil.2024.1333576
Received: 05 November 2023; Accepted: 08 January 2024;
Published: 23 January 2024.
Edited by:
Stefano Silvestri, University of Bologna, ItalyReviewed by:
Carmine Galasso, University College London, United KingdomCopyright © 2024 Goda, Williams, De Risi and Ngoma. This is an open-access article distributed under the terms of the Creative Commons Attribution License (CC BY). The use, distribution or reproduction in other forums is permitted, provided the original author(s) and the copyright owner(s) are credited and that the original publication in this journal is cited, in accordance with accepted academic practice. No use, distribution or reproduction is permitted which does not comply with these terms.
*Correspondence: Katsuichiro Goda, a2dvZGEyQHV3by5jYQ==
Disclaimer: All claims expressed in this article are solely those of the authors and do not necessarily represent those of their affiliated organizations, or those of the publisher, the editors and the reviewers. Any product that may be evaluated in this article or claim that may be made by its manufacturer is not guaranteed or endorsed by the publisher.
Research integrity at Frontiers
Learn more about the work of our research integrity team to safeguard the quality of each article we publish.