 Md. Manik Mia
 Sabarethinam Kameshwar
- Department of Civil and Environmental Engineering, Louisiana State University, Baton Rouge, LA, United States
Information on bridge condition rating is critical to make decisions regarding rehabilitation or replacement of bridges. Currently, bridge components’ condition ratings are evaluated manually using inspection reports. Markov chain and Petri net models are most commonly used for predicting future values of bridge parameters, however, applicability of these models for a regional or statewide portfolio of bridges may be limited. The existing data based models have low prediction accuracy. Hence, a data and machine learning based approach is presented herein for predicting the future condition values of major components—deck, superstructure and substructure—in a portfolio of bridges with an objective to develop a more accurate approach. National Bridge Inventory (NBI) was used to get information on current and past bridge components’ condition from year 1992–2019 along with other parameters such as ownership, maintenance responsibility and age. After selecting important parameters, this data was used to train three RUSBoost based random forest models for predicting future values of deck, superstructure, and substructure conditions, respectively. The prediction accuracy of the developed models were found above 93%, thereby addressing the limitation of poor prediction accuracy of the existing studies. Additionally, the uncertainties associated with the random forest based predictions were quantified at the regional level and for individual bridges. On-system concrete pre-cast slab units and steel I-beam bridges in Louisiana were selected to demonstrate the proposed approach and predict bridge components condition ratings for years 2020 and 2021.
1 Introduction
Almost 40% of all bridges in the United States are at least 50 years old and 9.1% are considered as structurally deficient (ASCE, 2017). As a result, maintenance of these bridges has become a great challenge for federal, state and local governments. Therefore, to identify needs for maintenance, rehabilitation and replacement of bridges, transportation agencies collect data on bridge condition. Generally, all bridges located on public roads with length more than 20 feet (6.1 m) are inspected at least once in every 2 years (Pallepogu, 2022) and data on 116 National Bridge Inventory (NBI) items are reported annually. The National Bridge Inspection Standards (NBISs) that were implemented by Federal Highway Administration in 1968 (Lichtenstein, 1993) forms the basis of bridge inspection in the United States. As a part of these inspections, three major bridge components--deck, superstructure and substructure-- are assessed and rated by bridge inspectors. These NBI condition ratings are measured on a scale of 0–9 as per the NBI coding guide. These condition ratings serve as inputs for load posting decisions and resources allocation for the short and long term management of bridges.
A review of existing literature reveals that numerous studies have been conducted worldwide in predicting bridge condition ratings. Some researchers developed models to predict condition ratings for the bridge CoRe elements (deck, superstructure, substructure and culvert), and some developed models that predicted ratings of the bridges. Previous research included models using traditional statistical analysis, Markov chain, fuzzy logic, logistic regression, neural network, ensemble learning algorithm. Markov chain has been commonly used to predict future condition rating of bridge structural components (Jiang et al., 1988; Norris and Norris, 1998; Morcous, 2006; Fernando et al., 2013; Hong et al., 2013; Le and Andrews, 2013; Wellalage et al., 2015; Jamalipour et al., 2017; Mohammed Abdelkader et al., 2019; Goyal et al., 2020; Srikanth and Arockiasamy, 2020). Markov chains are state-based models where the future state of a stochastic variable is only dependent on its present state and are relatively easy to construct with fast solutions (Le and Andrews, 2015). However, Markov chains have some drawbacks such as: a) high quality deterioration data is needed to develop transition probability matrices and b) assumptions on constant deterioration rates that are not feasible. These drawbacks have been addressed by several methods, e.g., semi-Markov models have been used for predicting future condition of bridge components (Kleiner, 2001; Mishalani and Madanat, 2002; Yang et al., 2009; Sobanjo et al., 2010; Mašović and Hajdin, 2014; Fang and Sun, 2019; Furtado and Ribeiro, 2023). Such semi-Markov models use a Weibull distribution for modeling the residence time in different states in order to model increasing deterioration rates. However, this approach experiences an exponentially increasing number of model states as the model complexity increased (Andrews, 2013). More recently, Collins (2023) developed a framework utilizing state based Markov chain, time based Weibull and Mechanistic based models to predict future condition of bridge components. Their multiple-model approach showed good accuracy, however, only 3 years data (2008–2010) were used from the NBI database for the development of proposed deterioration modeling. Another method that addressed the drawbacks of Markov chain model is Petri nets known as PT nets which offers a flexible and efficient method to model deterioration and maintenance processes. Le et al. (2017) used Petri nets to model condition states of bridges with variable deterioration rates incorporating effects of bridge inspection, maintenance and correlated component performance. However, their proposed approach was limited to railway bridge only. There are some other studies available on Petri nets (Yianni et al., 2017; Dean et al., 2018; Fecarotti and Andrews, 2020; Calvert et al., 2021; Ferreira et al., 2022), but applicability of this method for a regional and statewide portfolio of bridges may be limited.
Numerous studies have modeled the deterioration rates of bridge components’ using machine learning. Contreras-Nieto et al. (2018) used logistic regression, decision trees, gradient boosting, support vector machine and neural network to predict deficiency of bridge superstructure. Logistic regression was reported to be the most effective model; however, their research was limited to steel superstructure. Assaad and El-adaway (2020) used artificial neural networks (ANNs) and k-nearest neighbors to evaluate and predict current bridge deck deterioration conditions. Neural network model was reported to be the most accurate with an accuracy of 91.44%. However, their model was limited to bridge deck only. Similarly, a convolutional neural network (CNN) was developed by Liu and Zhang (2020) to predict future condition of bridge deck, superstructure and substructure component with prediction accuracy of about 85%. Martinez et al. (2020) compared different classification models (k-nearest neighbors (k-NN), decision trees (DTs), linear regression (LR), artificial neural networks (ANNs), deep learning neural networks (DLNs) to predict Bridge Condition Index (BCI) for the bridges in Ontario, Canada. From their study, decision tree model was found most accurate model for the prediction of BCI. More recently, Rajkumar et al. (2023) developed an autoencoder-random forest model (AE-RF) to predict the condition rating of bridge components, however, the prediction accuracy were 79%, 78% and 77% for deck, superstructure and substructure condition ratings, respectively.
Researchers also used NBI data to assess current condition of bridge components’ for better management of bridges (Kim and Yoon, 2010; Bektas et al., 2013; Bektaş, 2017; Saeed et al., 2017). Bektas et al. (2013) developed a new methodology to estimate NBI condition ratings from element condition data using classification and regression trees (CARTs). However, R2 values from their study were low (approximately 0.40) and the predicted condition rating values always remained above 5 on a scale varying from 0 to 10 (Bektaş, 2017). The low R2 values were due to the severe skewness in the NBI data as bridges with poor condition rating only constitute a tiny fraction of NBI database (Contreras-Nieto et al., 2018). Therefore, better models are needed to predict bridge condition rating considering this deficiency and skewness in the NBI database. Li and Song (2022) developed an ensemble based model to predict bridge deck defect condition. Six ensemble learning models (Random Forest, Extra Tree, AdaBoost, GBDT, XGBoost, and LightGBM) were developed and superstructure condition was reported to be the most important factor for deck defect prediction. Although they extensively investigated the use of ensemble learning methods, it was limited to bridge deck. Similarly, Rashidi Nasab and Elzarka (2023) also used several machine learning models to predict bridge deck deterioration and found ensemble methods, such as random forests, to have the highest accuracy. However, they did not predict the future condition of other bridge components. Alipour et al. (2017) used random forests to identify load posted bridges using NBI data, but they did not predict the future condition ratings of bridges.
The above discussion shows that several studies have assessed the future condition of bridge components. Some researchers used Commonly Recognized (CoRe) data and developed machine learning models, however, CoRe data are not publicly available. Hence, the available approach in existing studies have limitations to use since state level CoRe data may not be available to other state agencies. Furthermore, there are limited studies that predict the future values of condition ratings of all the three major bridge components (deck, super-structure, and sub-structure), and the prediction accuracy of these studies were low. So, there is a scope to improve the prediction accuracy. Furthermore, none of the existing studies have assessed the uncertainties associated with their predictions, which is important to make decisions, especially using machine learning models.
Therefore, the objective of this study is to develop a data and machine learning based approach to predict future values of deck, superstructure and substructure condition ratings for next year using publicly available NBI data. The reason for using publicly available data were twofold. 1) Use of publicly available data facilitates regional level application of the methodology without needing to gather additional information on bridges; thereby reducing the effort to apply the proposed model. Moreover, additional information on bridges may not always be available for all bridges in a region since agencies are not always mandated to record additional data, beyond what is reported in public datasets. 2) Use of non-public data, which may be specific to a state, can limit the applicability of the proposed approach to other states and regions. Therefore, publicly available data was used in this study. Herein, RUSBoost based random forest models were developed. RUSBoost algorithm is well suited to handle highly imbalanced data (Blackard and Dean, 1999; Seiffert et al., 2010; Mounce et al., 2017; Kinoshita et al., 2020; Park and Mun, 2023) which is the case of NBI database. Furthermore, herein, uncertainties associated with the prediction of the data-based models was also quantified. Herein, on-system concrete pre-cast slab units (COPCSS) and steel I-beam (CONIBM) bridges in Louisiana were selected to demonstrate the applicability of the proposed approach. COPCSS was selected as a representation of concrete slab bridges and CONIBM for steel beam bridges. In Section 2, the methodology for data collection and preparation, feature selection and model development are presented. Section 3 shows the application of the proposed approach with COPCSS and CONIBM on-system Louisiana bridges. In Section 4, the prediction uncertainties at portfolio and bridge level were analyzed corresponding to years 2020 and 2021. Finally, Section 5 presents the conclusions.
2 Methodology
This section used ON-system, i.e., bridges maintained by state department of transportation, COPCSS and CONIBM bridges in Louisiana to describe the proposed methodology to develop models that can predict the future values of bridge components’ condition ratings. Herein, a machine learning based approach was used for predicting future values of bridge components’. It is important to note here that data collected from National Bridge Inventory (NBI) database were highly imbalanced and skewed. In this research, the condition ratings that need to be estimated were discrete variables, i.e., poor, fair and good. Nevertheless, these discrete variables were converted to numeric values of 0, 1 and 2, respectively, and linear regression was tried but its performance, measured by accuracy, was poor since it is better suited for continuous outputs and not discrete data. So, multinomial logistic regression model was tried, which is an extension of binary logistic regression. Like logistic regression, multinomial logistic regression uses maximum likelihood estimation to maximize the overall accuracy. However, this approach does not work well if the data are highly imbalanced (Maalouf and Siddiqi, 2014; Zhang et al., 2022) because the resulting models will tend to be biased to the majority class. Regular random forest model was also tried; however, the testing accuracy was not good enough due to the high skewness in data. Previous researchers (Blackard and Dean, 1999; Seiffert et al. 2008; Seiffert et al., 2010; Mounce et al., 2017; Kinoshita et al., 2020; Malek et al., 2022; Park and Mun, 2023) have mentioned the effectiveness of RUSBoost based random forest models to handle highly imbalanced data. RUSBoost uses a combination of RUS (random under sampling) and the standard boosting procedure AdaBoost in order to better model the minority class by under sampling the majority class data points. Hence, three RUSBoost based separate random forest models were developed to predict the future values of deck, superstructure and substructure condition ratings using bridge data from the National Bridge Inventory. The following explains the steps involved in the development of RUSBoost based random forest models and quantification of the uncertainties associated with the predictions.
2.1 Data preparation
Figure 1 illustrates the steps for data preparation followed in this study. Data on bridges in Louisiana were collected from the NBI database from years 1992–2019 resulting in 303723 bridges records, i.e., data points. Since “ON” system bridges maintained by Louisiana department of transportation and development (LADOTD) were considered in this study, preliminary filtering (first diamond box in Figure 1) resulted in 196004 “ON” service bridge data points. Currently, visual inspection technique is most commonly used for the condition rating of bridges in United States where bridge inspectors gather a large amount of information and define the condition rating of bridge elements. Thus, bridge data is prone to numerous human errors. For instance, some bridges were found missing and not consistent through 1992 to 2019. As a result, only bridges that had data for all the years from 1992 to 2019 were used for the RUSBoost based random forest development. Any bridges that were missing in any year from 1992 to 2019 were discarded. Also, during pre-processing, it was found that some bridges did not have any records on bridge components condition ratings. Hence, bridges that had missing data in the bridge components’ condition ratings and year of construction were discarded as well. After these pre-processing steps, concrete pre-cast slab units (COPCSS) and steel I-beam (CONIBM) bridges in Louisiana were selected to demonstrate the applicability of the proposed approach. So, the filtering (second diamond box 2 in Figure 1) resulted in 20597 COPCSS and 4460 CONIBM bridge data records/points. Herein, a data point represents a bridge in a particular year. National Bridge Inventory (NBI) consists 116 items, however, some items such as bridge name, bridge identification number, traffic safety features, etc. have no relevance to condition ratings. Thus, these parameters were discarded initially based on judgements. After that, feature selection was carried out and significant parameters were selected which can be found in Section 2.2. Data on the remaining relevant parameters collected from NBI were further processed/filtered, if necessary, for use in the machine learning based approach (refer to “Filtering needed?” box of Figure 1). For instance, NBI condition ratings for deck, superstructure and substructure were rated on a scale of 0–9 according to the specifications in the Recording and Coding Guide (FHWA, 1995). For analysis, these ratings were recategorized as poor (<5), fair (=5) and good (>5) following the recommendation of the AASHTO Manual for Bridge Inspection (AASHTO, 2018). Functional classifications (NBI item 26) categorizes bridges as rural or urban based on the location of roadway and it was labelled as arterial road, collector road, or a local road. Kind of Highway was not originally in NBI and defined in this study using Functional classification (Item 26) and categorized as Roads, State and Interstate. Maintenance responsibility (NBI item 21), which originally consisted of 29 categories, was recategorized as federal, state, local and other. Similarly, design loads were labelled as heavy, light and other. Scour critical ratings (NBI Item 113) were labelled from 0 to 9 based on severity. In case of age, 2019 NBI data set was used as a starting point for the analysis. So, age of a bridge was calculated as
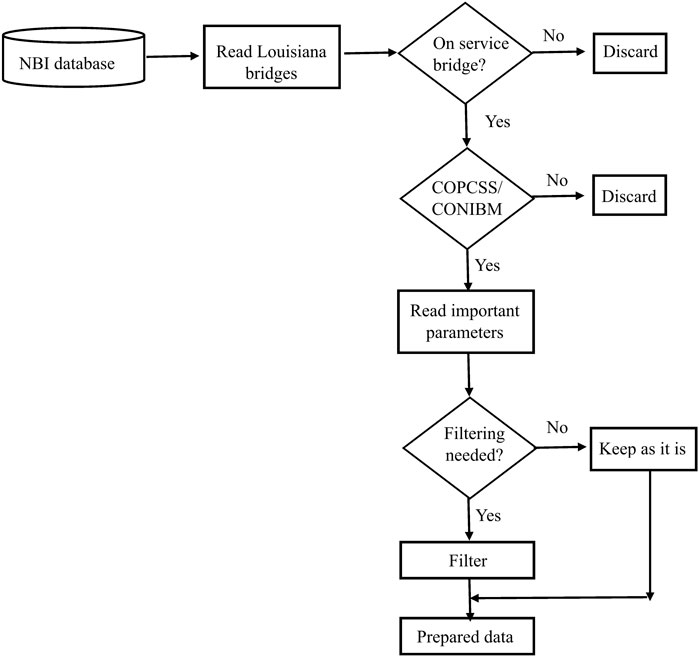
FIGURE 1. Approach for preparing dataset.
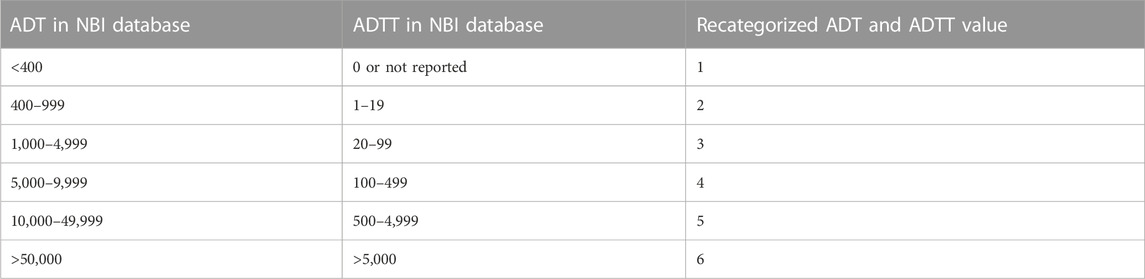
TABLE 1. Recategorized ADT and ADTT values (Hearn, 2014).
In addition, log (ADT) and sine of skew angle were created as these gave better performance than the original attributes (Alipour et al., 2017). Also, to represent the climate at a bridge’s location, its “climatic zone” was added as another attribute based on NOAA’s climatic divisions in Louisiana. Thus, data from 1992–2019 were collected to use in development of RUSBoost based random forest models.
Finally, to facilitate the use of machine learning techniques, categorical variables such as functional classification, kind of highway, maintenance responsibility, base highway network, historical significance, bridge median, structure flared, service type—42A, traffic direction, scour and climate zone were replaced using dummy coding (Daly et al., 2016).
2.2 Feature selection
Feature selection was a significant step in this study since the prepared dataset from NBI has many variables and features. Selecting most significant features would reduce the overall complexity of the final model (refer to “Important feature selection” in Figure 2). Random forest has become a useful feature selection algorithm that can handle datasets with a large number of variables (Chen et al., 2020) and was used herein. A random forest is a machine learning technique that utilizes ensemble learning where many classifiers are combined to provide solutions to a complex problem. A random forest algorithm consists of many decision trees and a prediction is obtained by taking the average or mean of the output from various trees. It relies on various decision tress and every decision tree consists of decision nodes, leaf nodes and a root node. To train a decision tree in random forest, first, a root node is created containing all training data points. The root node is then split in to two children nodes based on one of the input variables (bridge parameters such as condition ratings, geometry, age, etc.) and a corresponding threshold value. All data points which are less than the split variable’s value will be in left child node while in right child node, the split variable’s value will be larger than the threshold value. The threshold and split variable are selected based on maximum reduction in cost function. In next step, each of the child nodes are considered as root nodes and splits are further continued. This process continues until the nodes can no longer be split because of the restrictions on minimum node size (minimum data points in the node) or tree depth (number of splits) or the split does not lead to a significant reduction in the cost function. Feature importance is determined by combining the decrease in cost when a node is split using a feature and the probability of reaching that node. Higher reduction in cost or higher probability of reaching the node signifies higher importance of the feature. These importance values from each decision trees are aggregated to get feature importance value.
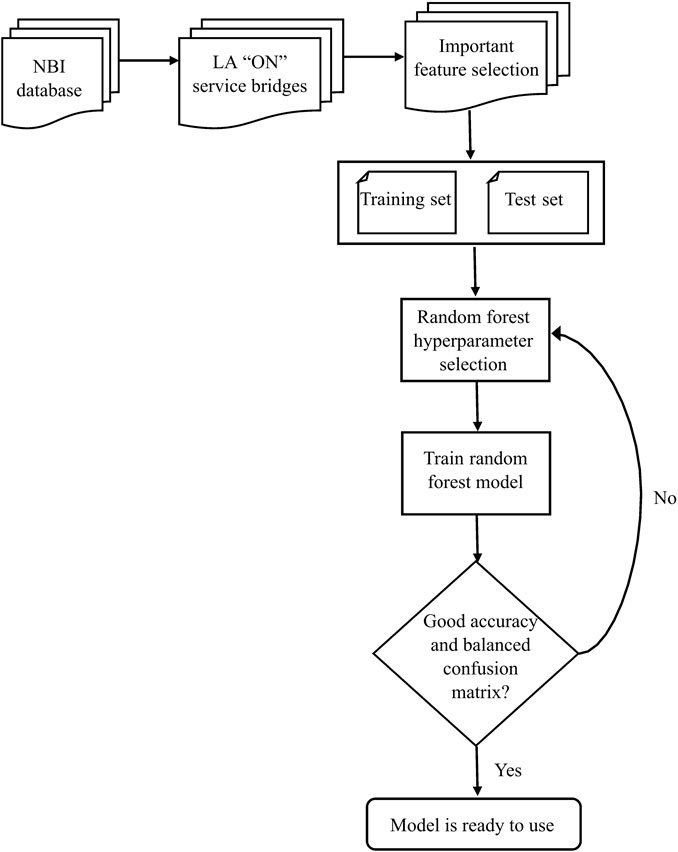
FIGURE 2. Flowchart for random forest model development.
Following these steps, important features were selected and are shown in Table 2. In addition to these parameters, inventory and operating rating were also found as important features but were not included herein since the values of these parameters in the future cannot be ascertained preventing machine learning models from predicting longer term future condition ratings. The data on the features in Table 2 were collected for years 1992–2019 from NBI database. During data preparation, the component condition rating (e.g., for deck) that will be predicted was labelled as output and corresponding data from the preceding year was considered to be the input. This process was followed for years 1992–2019. Similar procedure was carried out for superstructure and substructure condition rating prediction. Details of model development are discussed in Section 2.3.
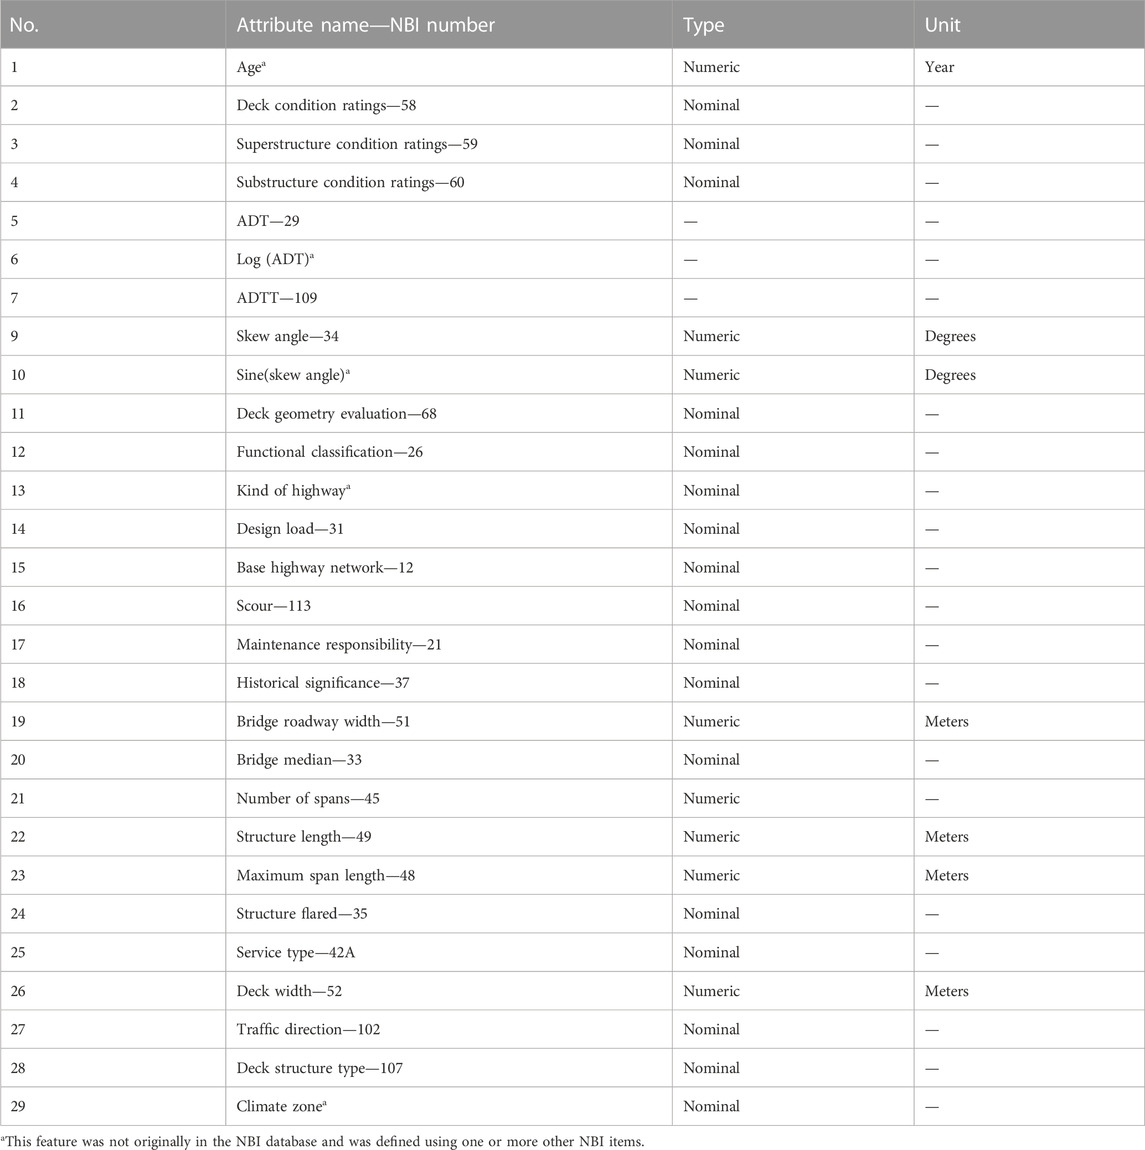
TABLE 2. Important features from NBI database.
2.3 Model development and accuracy
As mentioned earlier, due to the large number of bridges, a data based approach was selected in this study to predict future values of bridge components’ condition ratings. Herein, three RUSBoost based random forest models were developed separately to predict future values of deck, superstructure and substructure condition ratings. These models were trained using the dataset discussed in Section 2.1. 85% of total data was randomly chosen to train the model and remaining 15% data was used to test the model (“Training Set” and “Test Set” in Figure 2). The required parameters in a random forest model such as learning cycles, type of weak learners, weights, learning rate and cost (refer to “Random forest hyperparameter selection” in Figure 2) were selected using trial and error to ensure a balanced confusion matrix (Kohavi and Provost, 1998) with high accuracy and shown in Table 3. The diamond box in Figure 2 represents that unless good accuracy and balanced confusion matrix were achieved, the hyper parameters were varied to get an expected model. In Table 3, cost matrix is a square matrix, where
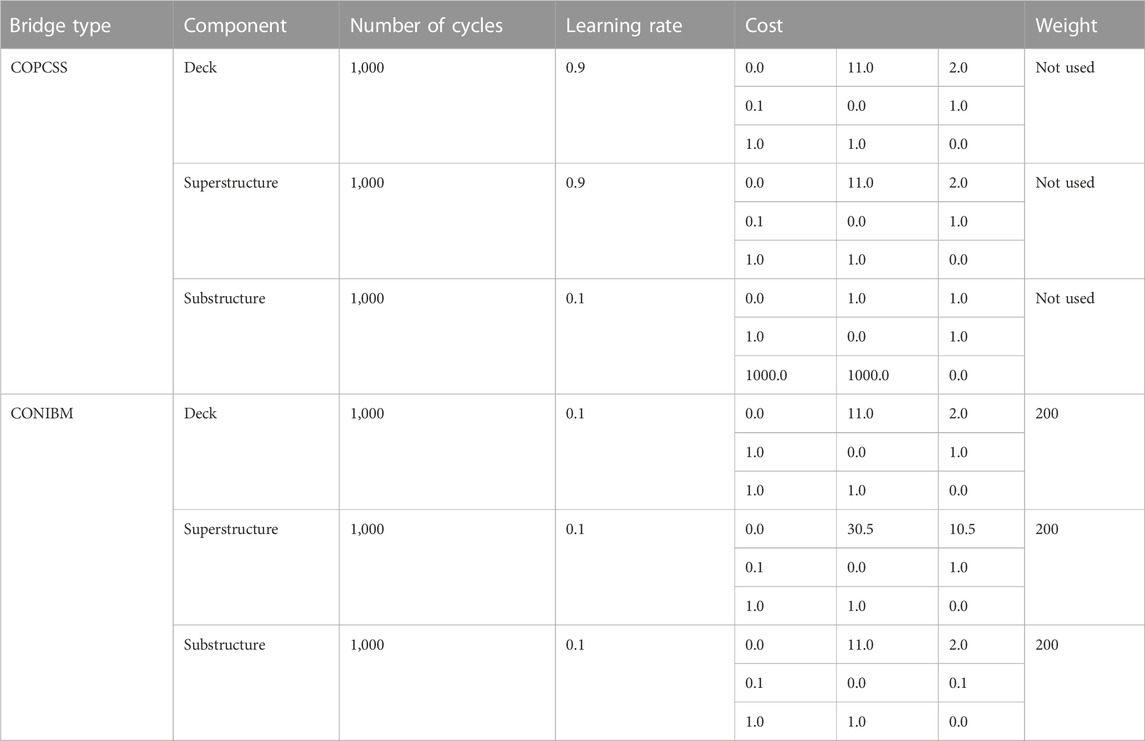
TABLE 3. Hyper-parameters used in random forest models.
A confusion matrix is a tabular summary showing the number of correct and incorrect predictions by a classifier. It is important to note that in multiclass classification problems, accuracy might not be sufficient to identify the best predictive model as a model with high accuracy could have imbalanced predictions. A good predictive model should have a balanced confusion matrix with minimal off–diagonal values since these off–diagonal values represent false positive or false negative predictions. Table 4 shows a confusion matrix obtained in this study for deck condition rating prediction for COPCSS bridges.
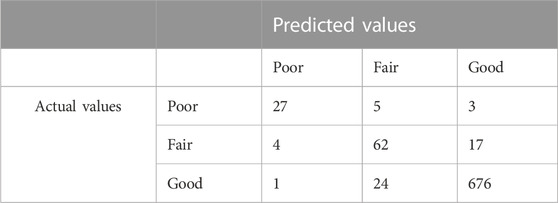
TABLE 4. Typical confusion matrix (Deck condition rating—COPCSS).
Furthermore, in case of imbalanced datasets, as is the case in this study, the model could be biased to the class with the greatest number of observations. As a result, the model can be considered to be acceptable if a balanced confusion matrix with high accuracy is achieved. The use of a confusion matrix as an evaluation criteria has also been suggested for highly imbalanced datasets (Suresh, 2021). As can be seen from Table 4, the confusion matrix is balanced because the developed random forest model overestimated the condition for 25 bridges while underestimated it for 29 bridges. Overestimation implies that the bridge was actually poor but was predicted as fair/good by the model and vice versa for underestimation. Herein, 15% test data was used to check the model’s accuracy and develop the confusion matrix.
As mentioned earlier that the data collected from NBI database were highly imbalanced. For instance, while preparing the random forest model for estimating deck condition rating for COPCSS bridges, about 2.14% and 2.98% of bridges were rated to be in poor and fair condition, respectively. On the other hand, about 94.89% of bridges were rated to be in good condition. Due to this imbalance in the data, RUSBoost based random forest algorithm was used in this study to handle high imbalance in data. Figure 2 shows the flowchart of the process used in this study to develop the random forest models to predict future values of condition ratings of deck, superstructure and substructure.
Table 5 shows the prediction accuracy for the selected on-system concrete pre-cast slab units (COPCSS) and steel I-beam (CONIBM) bridges in Louisiana. The random forest models were highly accurate and there was small difference between the testing and training accuracy, which highlighted that the random forest models were able to learn the trends that influence the following year’s condition ratings. However, for substructure condition rating in COPCSS bridges, the training accuracy was similar to that of other models, but its testing accuracy was relatively lower. Nevertheless, the model was able to predict the following year’s sub-structure condition ratings well. Lower test accuracy for sub-structure condition rating prediction model can be attributed to higher levels of uncertainty in the condition ratings because several parts of the sub-structure are not easily accessible during bridge inspections. Similar observation was observed for deck components in case of CONIBM. However, all three models were found to predict future values of components’ condition ratings reasonably well. Hence, it can be inferred that the developed models were able to predict future condition rating values of individual bridges accurately.
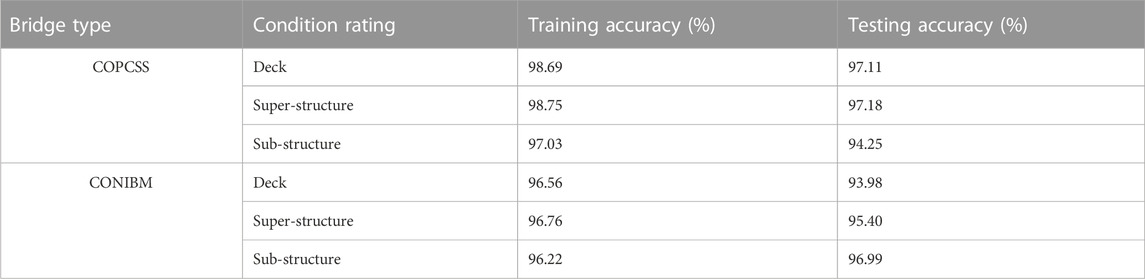
TABLE 5. Prediction accuracy for COPCSS and CONIBM bridges.
To understand the influence of different features on condition ratings of bridge components’, a feature importance study was conducted using the developed random forest models. It is important to note here that Table 2 shows important features list obtained by feature selection study and not from developed random forest models. Among 29 features shown in Table 2, five most important features were selected after doing feature importance investigation from each developed random forest models and listed here together: deck condition ratings, superstructure condition ratings, substructure condition ratings, age, number of spans, bridge roadway width and climatic zone. Age is significant since as the bridge gets older, the bridge components will be deteriorating more. The condition rating of deck, superstructure and substructure are also important since future values of bridge components’ condition depends on the current condition rating values. For roadway width, during discussions with officials from Louisiana Department of Transportation and Development, it was found that some bridges with narrow width were associated with older designs which were more susceptible to load posting. Number of spans can influence the condition rating values as a bridge having more spans can lead to more loads and will deteriorate faster compared to a bridge having less spans. Finally, significance of climatic zone can be explained since a bridge located in a bad weather will damage more compared to that in an excellent weather condition.
2.4 Estimating uncertainties in predictions
For decision making based on the estimates obtained from the RUSBoost based random forest models, in addition to accuracy, an understanding of the uncertainties associated with the predictions is essential. To this end, the effect of bootstrap uncertainty in the estimates of number of bridges with different component condition ratings was estimated first. For this purpose, for each of the three condition ratings, 100 random forest models were trained with different initial seed (all other hyper-parameters were un-altered) to estimate the uncertainty associated with the predictions obtained from the random forest models. The number of bridges with good, fair, and poor component condition ratings were determined using the 100 random forest models. Based on the results from the set of 100 random forest models, mean and standard deviation of the number of bridges with different component condition ratings was quantified. This analysis quantified the uncertainty in aggregated results obtained from the random forest models.
These aggregate uncertainty analysis results do not provide a good understanding of the uncertainties associated with the predictions for individual bridges. Therefore, to further understand the uncertainties associated with predictions for individual bridges, the set of 100 random forest models developed using different bootstrap samples were used to predict the condition ratings of the bridge components. Therefore, for each component in all the bridges, 100 predictions for the condition ratings were obtained. The number of times the models correctly predicted condition ratings was divided by the total number of simulations (i.e., 100) to obtain the probability of correctly determining the condition state of a bridge component. This process was repeated for all components and all bridges in a particular bridge class (such as COPCSS). Details on application of this process for uncertainty quantification are discussed in Section 4.
3 Application
The RUSBoost based random forest models developed using the above mentioned approach were used to predict future values of deck, superstructure and substructure condition ratings for years 2020 and 2021. For the prediction corresponding to year 2020, actual condition rating values and other attributes from the year 2019 were used as the predictors. Similarly, actual condition rating values for 2020 collected from NBI database were used as inputs to obtain condition ratings for 2021. Herein, ADT was not changed; so ADT corresponding to 2019 was used to make predictions for years 2020 and 2021. Also, random forest models implicitly considered maintenance as the data used to train random forest models included maintenance performed on the bridges from 1992 to 2019. Accuracy of these models for individual bridges is shown in Table 5. In this section, the accuracy of the results aggregated from individual bridges is explored to understand the performance of the random forest models at a regional level. These aggregated results on the total number of bridges in various condition ratings could facilitate decisions on resource allocation and maintenance scheduling. Figure 3 compares the predictions against the actual number of bridges in each of the three condition states for each of the three components of COPCSS for years 2020 and 2021. Herein, the results were obtained by aggregating the predictions made by the random forest models for individual bridges.
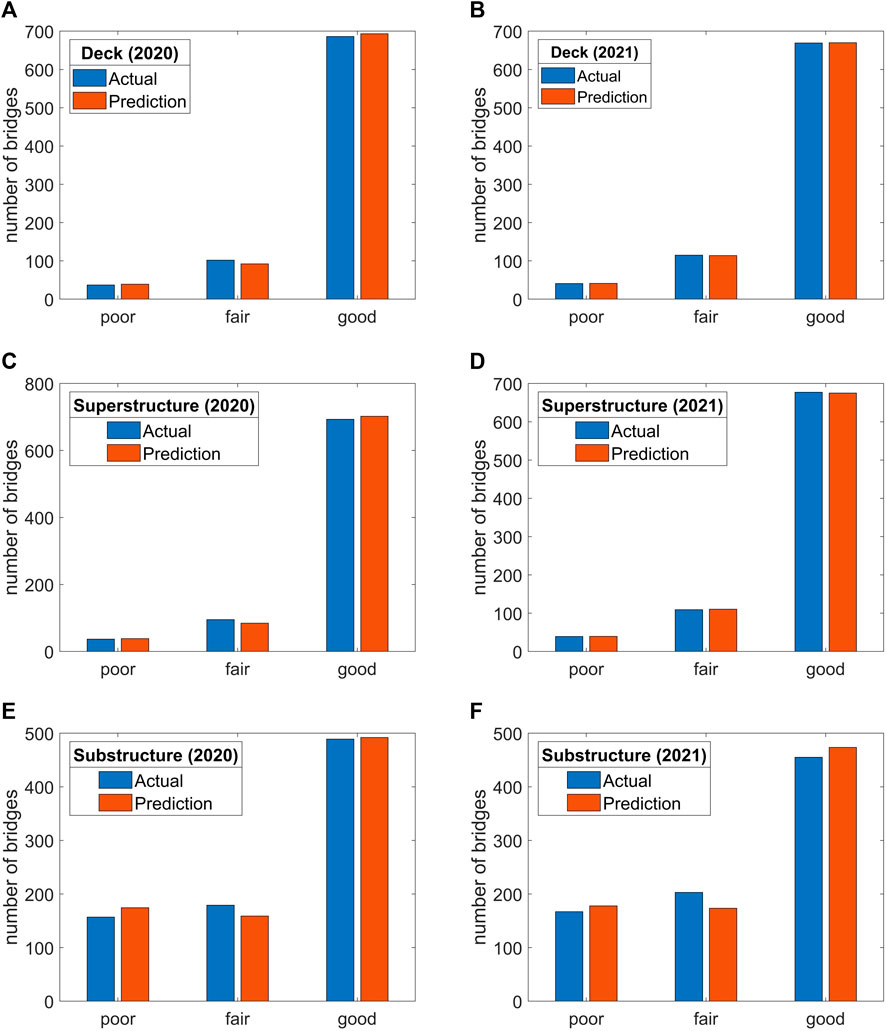
FIGURE 3. Future condition ratings for COPCSS bridge: (A) DCR of 2020; (B) DCR of 2021; (C) SupCR of 2020; (D) SupCR of 2021; (E) SubCR of 2020; (F) SubCR of 2021.
In Figure 3, DCR, SupCR and SubCR represent deck, superstructure and substructure condition ratings, respectively. From Figure 3, it can be seen that the aggregated results from the random forest models were able to predict the total number of bridges in each condition rating reasonably well for years 2020 and 2021. In 2020, for COPCSS bridges, the actual number of bridges with poor, fair and good deck condition ratings were 37, 102 and 686, respectively. The results obtained by aggregating the predictions made by the random forest models for individual bridges resulted in 39, 92 and 693 bridges in poor, fair, and good condition, respectively. In the next year’s data from the NBI database, four additional bridges had a poor deck condition rating, resulting in a total of 41 bridges with poor deck condition rating. The random forest model was able to capture this increase as 41 bridges were predicted to have poor deck condition based on the aggregated results from individual bridges. In 2021, 115 bridge decks were actually rated as fair and 669 bridges as good condition while the results obtained using the random forest models estimates 113 bridges in fair and 669 bridges in good condition, respectively, for 2021. In case of superstructure condition rating, actual number of bridges with poor, fair and good condition ratings were 37, 95 and 693, respectively. The estimates obtained by aggregating the results from the random forest models were 97%, 88% and 99% accurate for the prediction of poor, fair and good condition ratings in 2020 while in 2021, these were 100%, 99.1% and 99.7% accurate, respectively. For substructure condition rating, the accuracy of the estimates derived by aggregating the results for individual bridges obtained from the random forest models was found to be lower in 2020 for poor and fair condition ratings, i.e., 89.2% and 88.8%, respectively. However, the accuracy for estimating the number of bridges with good condition rating in both years 2020 and 2021 was above 99% for the substructure. Overall, for all three components, the random forest models facilitated estimation of bridges with good condition ratings most accurately (above 99%) since there were more bridges with good condition rating in NBI database. So, the models were trained better than poor and fair condition ratings, which is reflected by comparison of training and testing accuracies in Table 5.
Similar trend was observed for CONIBM bridge as well. In 2020, the actual number of bridges with poor, fair and good deck condition ratings were 29, 36 and 167, respectively. Correspondingly, the accuracy of prediction obtained by aggregating the results from the random forest models for the year of 2020 were 90%, 97% and 99%. The prediction accuracy for the year of 2021 was slightly lower than 2020 for deck condition rating, but still higher than 90%. Akin to the observations of COPCSS, random forest models estimated most accurately for good condition rating for CONIBM bridge as well. However, the prediction accuracy obtained by aggregating results from random forest models for CONIBM bridge was slightly lower compared to COPCSS bridge. This reduction might be due to the lower number of CONIBM bridges, which resulted in fewer training data. However, for both COPCSS and CONIBM, the developed models were found to predict future condition rating values accurately at regional level as well.
4 Uncertainty quantification
The results from Table 5 and Figure 3 highlight the high accuracy of the random forest models developed herein at an individual bridge level and at the regional level. Herein, results of the uncertainty quantification are presented. First, uncertainty in the aggregated results from the random forest models is analyzed. The results for CONIBM and COPCSS bridges are presented in Table 6 which lists the future estimates of the number of bridges with components in different condition ratings obtained from 100 simulations along with actual data from NBI database and standard deviation values associated with the predictions at regional level.
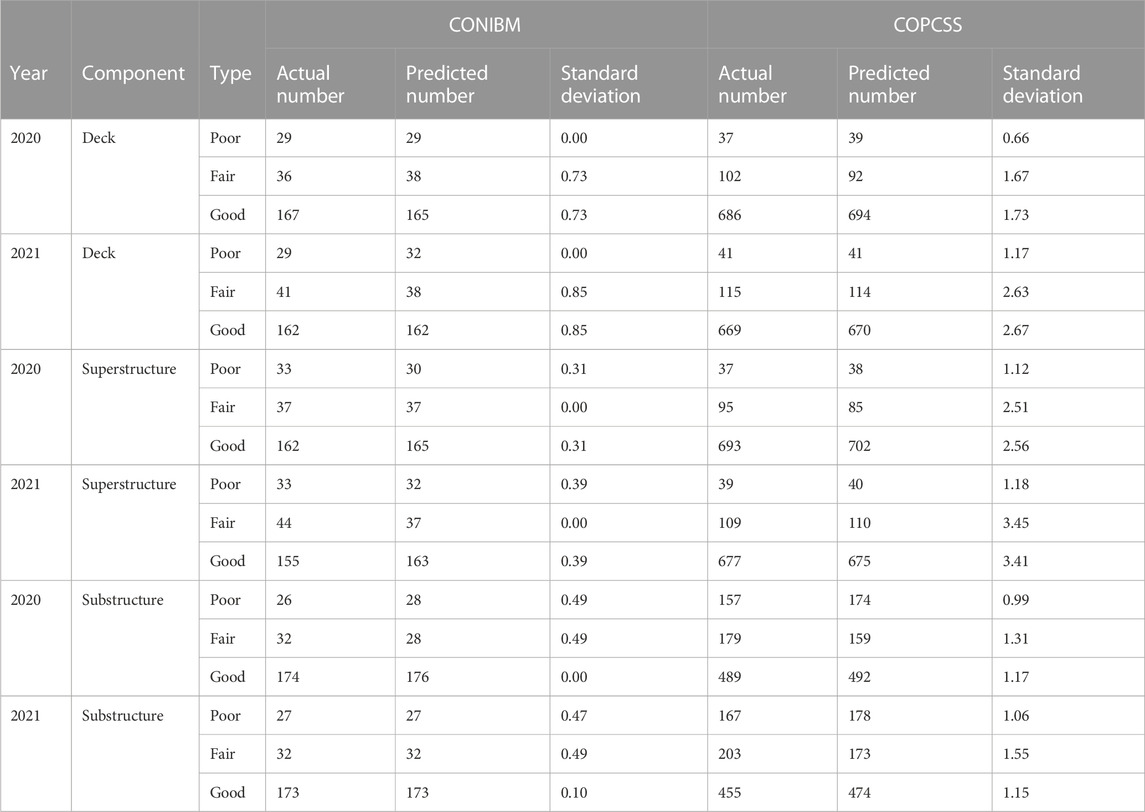
TABLE 6. Future condition rating values.
The random forest models developed in this study were used to predict future values of deck, superstructure and substructure condition ratings of an individual bridge and the results were aggregated to predict the total number of bridges in each condition rating. This step was repeated 100 times to propagate the bootstrap uncertainty associated with random first model creation. Thus, 100 aggregated predictions were obtained from 100 random forest models. Mean and standard deviation were then calculated using the 100 aggregated predictions obtained from the random forest models. Table 6 also indicates that uncertainties associated with the number of bridges with components in different condition ratings are small where the coefficient of variance up to 0.0221 for CONIBM bridge and 0.0314 for COPCSS bridge were observed. These low coefficient of variation values indicate that for the random forest models developed herein, one simulation is enough for the prediction of future values.
The above discussion on accuracy and uncertainty was focused on aggregated results obtained from the random forest models. Therefore, next, uncertainty in the predictions for individual bridges was analyzed using the approach presented in Section 2.4. Figure 4 shows the histogram of the probability of correctly determining poor condition rating for all COPCSS bridges in 2020. Figure 5 shows similar results for fair condition rating for COPCSS bridges.
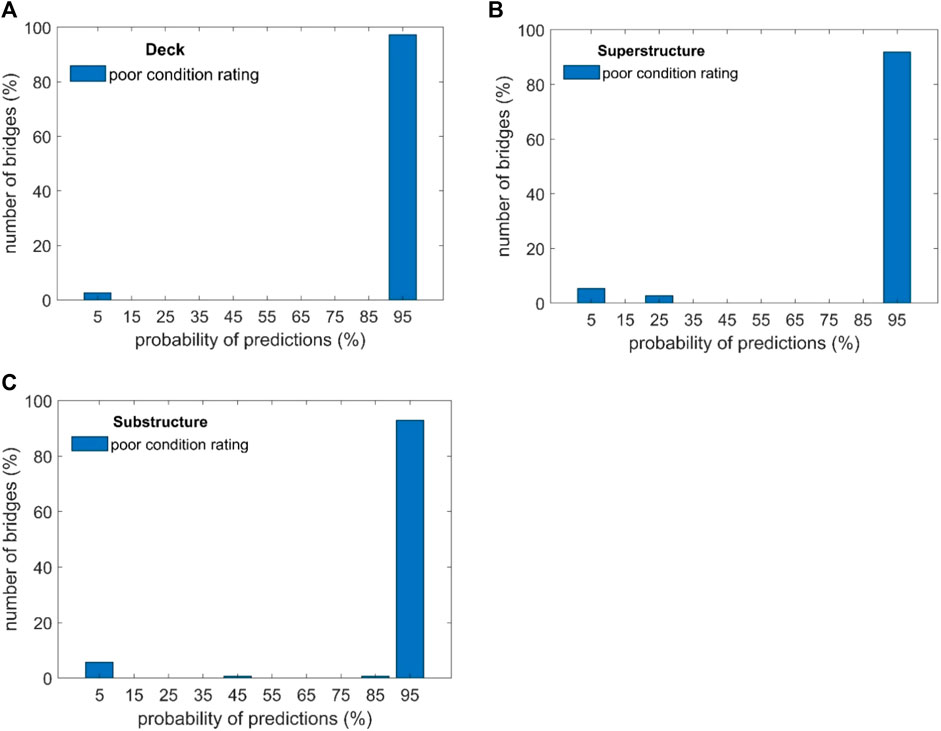
FIGURE 4. Uncertainty quantification for individual bridges from random forest models for poor condition rating in 2020: (A) deck; (B) superstructure; (C) substructure.
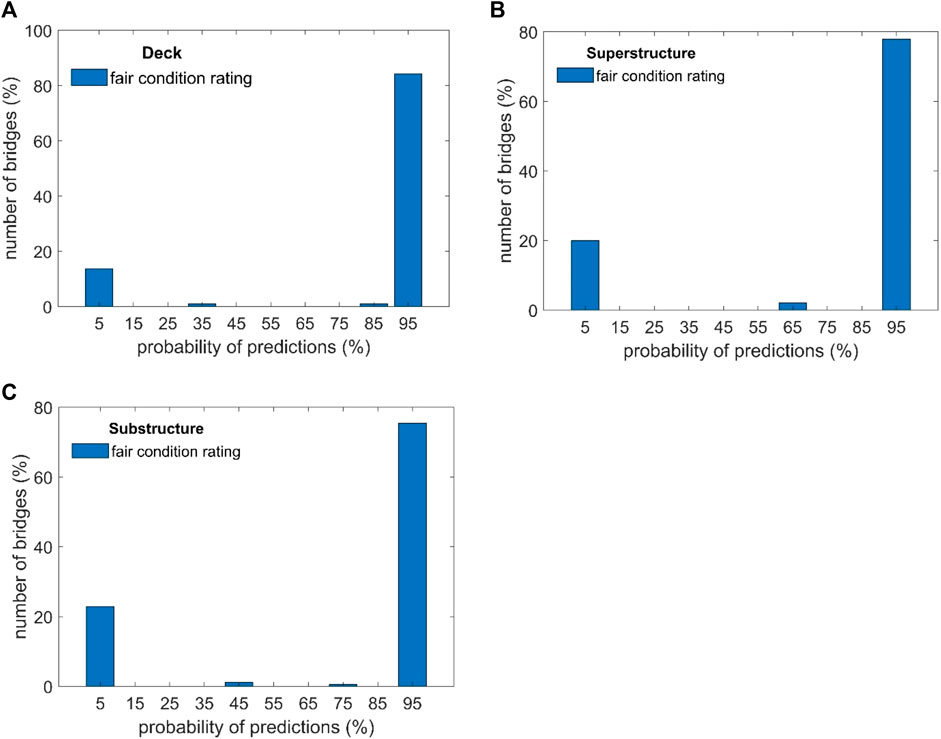
FIGURE 5. Uncertainty quantification for individual bridges from random forest models for fair condition rating in 2020: (A) deck; (B) superstructure; (C) substructure.
The histograms in Figures 4, 5 are bimodal with the two models centered around 5% and 95%. This observation shows that across random forest models obtained from different bootstrap samples, bridges are consistently classified correctly or incorrectly, indicating that there is low uncertainty in the predictions for individual bridges. Furthermore, it can be seen from Figure 4 that very few bridges were misclassified frequently and most of the bridges were rated correctly. Similar trends were also observed for good condition rating as well. Although not shown herein, for good condition rating, less than 1% of bridges were misclassified by developed models in case of deck and superstructure condition ratings. For substructure good condition rating, this number was less than 4%. It can be attributed to the large number of bridges with good condition rating. As a result, the random forest models were trained with more data as compared to poor and fair condition ratings. For fair condition ratings, Figure 5 shows approximately 20% chance of misclassification across random forest models obtained from different bootstrap samples. This increase in uncertainty in predictions can be attributed to relatively less data on bridges with fair condition ratings. In case of substructure component, the error was highest, but still the accuracy of the developed model was above 85%. Thus, one simulation is enough for the prediction of future values herein.
A similar trend was also observed for CONIBM bridges where bimodal histograms with the two modes centered around 5% and 95% were observed. Also, most of the bridges were rated correctly for deck, superstructure and substructure components. However, like COPCSS bridges, maximum error was observed for substructure component. Approximately 12% probability of misclassification across random forest models was found in case of substructure component condition ratings for different bootstrap samples. The higher uncertainty can be attributed to higher levels of uncertainty in the condition ratings because several parts of the sub-structure are not easily accessible during bridge inspections. It is important to note that one of our objectives was to develop random forest models to predict future condition ratings with high prediction accuracy. Although training and testing accuracy of the developed models were above 93% (please refer to Table 5 in the manuscript), still these models were not 100% accurate and some bridges were classified incorrectly during training. Since the hyperparameters were not varied for propagating uncertainties in bootstrap sampling, these errors propagated to the 100 random forest models that were created using different bootstrap samples. Consequently, these errors were also observed in the predictions of condition ratings for years 2020 and 2021. However, the consistency of the misclassification indicates low uncertainties and structural variations due to bootstrap sampling.
5 Conclusion
Information on bridge component condition rating is essential for policymakers to take decisions on rehabilitation, repair, and resource allocation. Although there are some studies on bridge condition and deterioration rates, however, there are very few studies on predicting the future condition rating of bridge components’. In this context, the major contribution of this paper is the development of a data based approach to predict the future values of deck, superstructure and substructure condition ratings. Herein, concrete pre-cast slab units (COPCSS) and steel I-beam (CONIBM) on—system bridges of Louisiana were selected to demonstrate the applicability of the proposed approach. Data was collected from National Bridge Inventory (NBI) and was processed and labelled to make it suitable for use with machine learning methods. Next, feature selection was carried out to select the important parameters.
Results indicated that age, bridge geometry parameters, traffic information, previous year’s condition ratings, scour and climate conditions are the important features. Three RUSBoost based random forest models were developed to predict future (i.e., next year’s) deck, superstructure and substructure condition ratings, respectively. These models were found to have high prediction accuracy. The predicted models were used to predict condition rating values for years 2020 and 2021. The developed models were found to be accurate when compared against actual condition rating values.
Another major contribution of this study is the quantification of uncertainty associated with random forest models’ predictions. For this purpose, herein, 100 random forest models were trained with different initial seed to propagate uncertainties in bootstrap sampling. Uncertainties associated with the predictions based on aggregated results obtained from the random forest models were quantified. Additionally, uncertainties associated with the predictions for individual bridges were also investigated using the set of 100 random forest models developed using different bootstrap samples. For random forest models trained using the proposed approach, uncertainty analysis revealed that uncertainties associated with the number of bridges with components in different condition ratings are small, and therefore, one simulation is enough to estimate the total number bridges with a given component condition rating in the future. Finally, uncertainties associated with the predictions for individual bridges indicated that there is low uncertainty in the predictions for individual bridges and very few bridges were infrequently misclassified. Again, highlighting that one simulation is enough.
The outcomes of this research can help stakeholders identify potential maintenance and rehabilitation actions and allocation of resources based on anticipated future condition of bridges. In addition, missing data on components’ condition can be filled out using the proposed approach. Although the prediction accuracy of the developed machine learning models were satisfactory, however, further studies are suggested to improve the accuracy, and thus minimize the misclassified number of bridges.
Data availability statement
Publicly available datasets were analyzed in this study. This data can be found here: https://www.fhwa.dot.gov/bridge/nbi.cfm.
Author contributions
MM: Conceptualization, Formal Analysis, Investigation, Methodology, Visualization, Writing–original draft, Writing–review and editing. SK: Conceptualization, Funding acquisition, Investigation, Methodology, Project administration, Supervision, Writing–review and editing.
Funding
The authors would like to gratefully acknowledge the support of this research by Transportation Consortium of South Central States (Tran-SET) through grant 20STLSU01.
Conflict of interest
The authors declare that the research was conducted in the absence of any commercial or financial relationships that could be construed as a potential conflict of interest.
Publisher’s note
All claims expressed in this article are solely those of the authors and do not necessarily represent those of their affiliated organizations, or those of the publisher, the editors and the reviewers. Any product that may be evaluated in this article, or claim that may be made by its manufacturer, is not guaranteed or endorsed by the publisher.
Author disclaimer
Any opinions, findings, and conclusions or recommendations expressed in this material are those of the authors and do not necessarily reflect the views of Tran-SET.
References
AASHTO (2018). The manual for bridge evaluation. Third. Ed. American Association of State Highway and Transportation Officials.
Alipour, M., Harris, D. K., Barnes, L. E., Ozbulut, O. E., and Carroll, J. (2017). Load-Capacity Rating of Bridge Populations through Machine Learning: application of Decision Trees and Random Forests. J. Bridge Eng. 22 (10), 04017076. doi:10.1061/(ASCE)BE.1943-5592.0001103
Andrews, J. (2013). A modelling approach to railway track asset management. Proc. Institution Mech. Eng. Part F J. Rail Rapid Transit 227, 56–73. doi:10.1177/0954409712452235
ASCE (2017). 2017 report card of America’s infrastructure. Available at: https://www.infrastructurereportcard.org/cat-item/bridges/.
Assaad, R., and El-adaway, I. H. (2020). Bridge Infrastructure Asset Management System: comparative Computational Machine Learning Approach for Evaluating and Predicting Deck Deterioration Conditions. J. Infrastructure Syst. 26 (3), 04020032. doi:10.1061/(ASCE)IS.1943-555X.0000572
Bektas, B. A., Carriquiry, A., and Smadi, O. (2013). Using Classification Trees for Predicting National Bridge Inventory Condition Ratings. J. Infrastructure Syst. 19 (4), 425–433. doi:10.1061/(ASCE)IS.1943-555X.0000143
Bektaş, B. A. (2017). Use of Recursive Partitioning to Predict National Bridge Inventory Condition Ratings from National Bridge Elements Condition Data. Transp. Res. Rec. 2612 (1), 29–38. doi:10.3141/2612-04
Blackard, J., and Dean, D. (1999). Comparative accuracies of artificial neural networks and discriminant analysis in predicting forest cover types from cartographic variables. Comput. Electron. Agric. 24, 131–151. doi:10.1016/S0168-1699(99)00046-0
Calvert, G., Neves, L., Andrews, J., and Hamer, M. (2021). Incorporating defect specific condition indicators in a bridge life cycle analysis. Eng. Struct. 246, 113003. doi:10.1016/j.engstruct.2021.113003
Chen, R.-C., Dewi, C., Huang, S.-W., and Caraka, R. E. (2020). Selecting critical features for data classification based on machine learning methods. J. Big Data 7 (1), 52. doi:10.1186/s40537-020-00327-4
Collins, J. (2023). A Multiple Model Approach To Bridge Deterioration Modeling. Open Access Theses & Dissertations. Available at: https://scholarworks.utep.edu/open_etd/3777.
Contreras-Nieto, C., Shan, Y., and Lewis, P. (2018). Characterization of Steel Bridge Superstructure Deterioration through Data Mining Techniques. J. Perform. Constr. Facil. 32 (5), 04018062. doi:10.1061/(ASCE)CF.1943-5509.0001205
Daly, A., Dekker, T., and Hess, S. (2016). Dummy coding vs effects coding for categorical variables: clarifications and extensions. J. Choice Model. 21, 36–41. doi:10.1016/j.jocm.2016.09.005
Dean, P. C. Y., Neves, L. C., Rama, D., and Andrews, R. (2018). “Using Petri-Net Modelling for a Data-Driven Approach to Bridge Management and Safety,” in Maintenance, safety, risk, management and life-cycle performance of bridges (CRC Press).
Fang, Y., and Sun, L. (2019). Developing A Semi-Markov Process Model for Bridge Deterioration Prediction in Shanghai. Sustainability 11 (19), 5524. Article 19. doi:10.3390/su11195524
Fecarotti, C., and Andrews, J. (2020). A Petri net approach to assess the effects of railway maintenance on track availability. Infrastruct. Asset Manag. 7 (3), 201–220. doi:10.1680/jinam.18.00046
Fernando, D., Adey, B. T., and Walbridge, S. (2013). A methodology for the prediction of structure level costs based on element condition states. Struct. Infrastructure Eng. 9 (8), 735–748. doi:10.1080/15732479.2011.609176
Ferreira, C., Neves, L., Matos, J. C. e., and Silva, A. (2022). “Application of Petri Nets to Manage Bridge Decks,” in Proceedings of the 1st conference of the European association on quality control of bridges and structures. Editors C. Pellegrino, F. Faleschini, M. A. Zanini, J. C. Matos, J. R. Casas, and A. Strauss (Springer International Publishing), 1308–1317. doi:10.1007/978-3-030-91877-4_149
FHWA (1995). Recording and coding guide for the structural inventory and appraisal of the nation’s bridges. Federal Highway Administration. https://rosap.ntl.bts.gov/view/dot/1032.
Furtado, F., and Ribeiro, D. (2023). Railway Bridge Management System Based on Visual Inspections with Semi-Markov Continuous Time Process. KSCE J. Civ. Eng. 27 (1), 233–250. doi:10.1007/s12205-022-0387-8
Goyal, R., Whelan, M. J., and Cavalline, T. L. (2020). Multivariable Proportional Hazards-Based Probabilistic Model for Bridge Deterioration Forecasting. J. Infrastructure Syst. 26 (2), 04020007. doi:10.1061/(ASCE)IS.1943-555X.0000534
Hearn, G. (2014). “State Bridge Load Posting Processes and Practices,” in NCHRP synthesis of highway practice (Transportation Research Board), 453. Article Project 20-05, Topic 44-15 https://trid.trb.org/view/1306683.
Hong, T., Chae, M. J., Kim, D., Koo, C., Lee, K. S., and Chin, K. H. (2013). Infrastructure asset management system for bridge projects in South Korea. KSCE J. Civ. Eng. 17 (7), 1551–1561. doi:10.1007/s12205-013-0408-8
Jamalipour, A., Niknam, S. A., and Cheraghi, S. H. (2017). “Predicting highway bridge condition rating using Markov models,” in Proceedings of the 2017 industrial and systems engineering conference, 362.
Jiang, Y., Saito, M., and Sinha, K. C. (1988). Bridge performance prediction model using the Markov Chain. Transp. Res. Rec. 1180. http://onlinepubs.trb.org/Onlinepubs/trr/1988/1180/1180-005.pdf.
Kim, Y. J., and Yoon, D. K. (2010). Identifying Critical Sources of Bridge Deterioration in Cold Regions through the Constructed Bridges in North Dakota. J. Bridge Eng. 15 (5), 542–552. doi:10.1061/(ASCE)BE.1943-5592.0000087
Kinoshita, T., Fujiwara, K., Kano, M., Ogawa, K., Sumi, Y., Matsuo, M., et al. (2020). Sleep Spindle Detection Using RUSBoost and Synchrosqueezed Wavelet Transform. IEEE Trans. Neural Syst. Rehabilitation Eng. 28 (2), 390–398. doi:10.1109/TNSRE.2020.2964597
Kleiner, Y. (2001). Scheduling Inspection and Renewal of Large Infrastructure Assets. J. Infrastructure Syst. 7 (4), 136–143. doi:10.1061/(ASCE)1076-0342(2001)7:4(136)
Kohavi, R., and Provost, F. (1998). Glossary of Terms. Mach. Learn. 30 (2), 271–274. doi:10.1023/A:1017181826899
Le, B., and Andrews, J. (2013). Modelling railway bridge asset management. Proc. Institution Mech. Eng. Part F J. Rail Rapid Transit 227 (6), 644–656. doi:10.1177/0954409713490924
Le, B., and Andrews, J. (2015). Petri net modelling of bridge asset management using maintenance-related state conditions. Struct. Infrastructure Eng. 12 (6), 730–751. doi:10.1080/15732479.2015.1043639
Le, B., Andrews, J., and Fecarotti, C. (2017). A Petri net model for railway bridge maintenance. Proc. Institution Mech. Eng. Part O J. Risk Reliab. 231 (3), 306–323. doi:10.1177/1748006X17701667
Li, Q., and Song, Z. (2022). Ensemble-Learning-Based Prediction of Steel Bridge Deck Defect Condition. Appl. Sci. 12 (11), 5442. Article 11. doi:10.3390/app12115442
Lichtenstein, A. G. (1993). The Silver Bridge Collapse Recounted. J. Perform. Constr. Facil. 7 (4), 249–261. doi:10.1061/(ASCE)0887-3828(1993)7:4(249)
Liu, H., and Zhang, Y. (2020). Bridge condition rating data modeling using deep learning algorithm. Struct. Infrastructure Eng. 16 (10), 1447–1460. doi:10.1080/15732479.2020.1712610
Maalouf, M., and Siddiqi, M. (2014). Weighted logistic regression for large-scale imbalanced and rare events data. Knowledge-Based Systems 59, 142–148. doi:10.1016/j.knosys.2014.01.012
Malek, N. H. A., Yaacob, W. F. W., Wah, Y. B., Md Nasir, S. A., Shaadan, N., and Indratno, S. W. (2022). Comparison of ensemble hybrid sampling with bagging and boosting machine learning approach for imbalanced data. IJEECS 29, 598. doi:10.11591/ijeecs.v29.i1.pp598-608
Martinez, P., Mohamed, E., Mohsen, O., and Mohamed, Y. (2020). Comparative Study of Data Mining Models for Prediction of Bridge Future Conditions. J. Perform. Constr. Facil. 34 (1), 04019108. doi:10.1061/(ASCE)CF.1943-5509.0001395
Mašović, S., and Hajdin, R. (2014). Modelling of bridge elements deterioration for Serbian bridge inventory. Struct. Infrastructure Eng. 10 (8), 976–987. doi:10.1080/15732479.2013.774426
Mishalani, R. G., and Madanat, S. M. (2002). Computation of Infrastructure Transition Probabilities Using Stochastic Duration Models. J. Infrastructure Syst. 8 (4), 139–148. doi:10.1061/(ASCE)1076-0342(2002)8:4(139)
Mohammed Abdelkader, E., Moselhi, O., Marzouk, M., and Zayed, T. (2019). “Condition Prediction of Concrete Bridge Decks Using Markov Chain Monte Carlo-Based Method,” in CSCE Annual Conference. Growing with youth – croître avec les jeunes (Laval (Greater Montreal), Canada.
Morcous, G. (2006). Performance Prediction of Bridge Deck Systems Using Markov Chains. J. Perform. Constr. Facil. 20 (2), 146–155. doi:10.1061/(ASCE)0887-3828(2006)20:2(146)
Mounce, S. R., Ellis, K., Edwards, J. M., Speight, V. L., Jakomis, N., and Boxall, J. B. (2017). Ensemble Decision Tree Models Using RUSBoost for Estimating Risk of Iron Failure in Drinking Water Distribution Systems. Water Resour. Manag. 31 (5), 1575–1589. doi:10.1007/s11269-017-1595-8
Pallepogu, A. (2022). Predicting bridge deck condition ratings using K-nearest neighbors algorithm for national bridge inventory. University of Cincinnati.
Park, S., and Mun, S. (2023). Effects of Seated Postural Sway on Visually Induced Motion Sickness: A Multiple Regression and RUSBoost Classification Approach. Int. J. Human–Computer Interact. 0 (0), 1–12. doi:10.1080/10447318.2023.2200638
Rajkumar, M., Nagarajan, S., and Arockiasamy, M. (2023). Bridge Infrastructure Management System: autoencoder Approach for Predicting Bridge Condition Ratings. J. Infrastructure Syst. 29 (1), 04022042. doi:10.1061/JITSE4.ISENG-2123
Rashidi Nasab, A., and Elzarka, H. (2023). Optimizing Machine Learning Algorithms for Improving Prediction of Bridge Deck Deterioration: A Case Study of Ohio Bridges. Buildings 13 (6), 1517. Article 6. doi:10.3390/buildings13061517
Saeed, T. U., Moomen, M., Ahmed, A., Murillo-Hoyos, J., Volovski, M., and Labi, S. (2017). Performance Evaluation and Life Prediction of Highway Concrete Bridge Superstructure across Design Types. J. Perform. Constr. Facil. 31 (5), 04017052. doi:10.1061/(ASCE)CF.1943-5509.0001051
Seiffert, C., Khoshgoftaar, T. M., Van Hulse, J., and Napolitano, A. (2008). “RUSBoost: improving classification performance when training data is skewed,” in Proceeding of the 2008 19th International Conference on Pattern Recognition, Tampa, FL, USA, December 2008 (IEEE), 1–4. doi:10.1109/ICPR.2008.4761297
Seiffert, C., Khoshgoftaar, T. M., Van Hulse, J., and Napolitano, A. (2010). RUSBoost: A Hybrid Approach to Alleviating Class Imbalance. IEEE Trans. Syst. Man, Cybern. - Part A Syst. Humans 40 (1), 185–197. doi:10.1109/TSMCA.2009.2029559
Sobanjo, J., Mtenga, P., and Rambo-Roddenberry, M. (2010). Reliability-Based Modeling of Bridge Deterioration Hazards. J. Bridge Eng. 15 (6), 671–683. doi:10.1061/(ASCE)BE.1943-5592.0000074
Srikanth, I., and Arockiasamy, M. (2020). Deterioration models for prediction of remaining useful life of timber and concrete bridges: A review. J. Traffic Transp. Eng. Engl. Ed. 7 (2), 152–173. doi:10.1016/j.jtte.2019.09.005
Suresh, A. (2021). What is a confusion matrix? Analytics Vidhya. https://medium.com/analytics-vidhya/what-is-a-confusion-matrix-d1c0f8feda5.
Wellalage, N. K. W., Zhang, T., and Dwight, R. (2015). Calibrating Markov Chain–Based Deterioration Models for Predicting Future Conditions of Railway Bridge Elements. J. Bridge Eng. 20 (2), 04014060. doi:10.1061/(ASCE)BE.1943-5592.0000640
Yang, Y. N., Pam, H. J., and Kumaraswamy, M. M. (2009). Framework Development of Performance Prediction Models for Concrete Bridges. J. Transp. Eng. 135 (8), 545–554. doi:10.1061/(asce)te.1943-5436.0000018
Yianni, P. C., Rama, D., Neves, L. C., Andrews, J. D., and Castlo, D. (2017). A Petri-Net-based modelling approach to railway bridge asset management. Struct. Infrastructure Eng. 13 (2), 287–297. doi:10.1080/15732479.2016.1157826
Keywords: condition ratings, random forest, machine learning, Louisiana bridges, bootstrap uncertainties
Citation: Mia MM and Kameshwar S (2023) Machine learning approach for predicting bridge components’ condition ratings. Front. Built Environ. 9:1254269. doi: 10.3389/fbuil.2023.1254269
Received: 06 July 2023; Accepted: 28 September 2023;
Published: 09 October 2023.
Edited by:
Anna Maria Rakoczy, Warsaw University of Technology, PolandReviewed by:
Prakash Kripakaran, University of Exeter, United KingdomSamuel Labi, Purdue University, United States
Copyright © 2023 Mia and Kameshwar. This is an open-access article distributed under the terms of the Creative Commons Attribution License (CC BY). The use, distribution or reproduction in other forums is permitted, provided the original author(s) and the copyright owner(s) are credited and that the original publication in this journal is cited, in accordance with accepted academic practice. No use, distribution or reproduction is permitted which does not comply with these terms.
*Correspondence: Sabarethinam Kameshwar, c2thbWVzaHdhcjFAbHN1LmVkdQ==