
94% of researchers rate our articles as excellent or good
Learn more about the work of our research integrity team to safeguard the quality of each article we publish.
Find out more
REVIEW article
Front. Built Environ., 28 September 2023
Sec. Sustainable Design and Construction
Volume 9 - 2023 | https://doi.org/10.3389/fbuil.2023.1245223
This article is part of the Research TopicSolar Neighborhood Planning: Optimize Solar Energy Use in Cities Through the Digitalization of the Built EnvironmentView all 8 articles
 Mattia Manni1*
 Jacowb Krum Thorning2
 Sami Jouttijärvi3Kati Miettunen3Marisa Di Sabatino2
 Gabriele Lobaccaro1
This review focuses on the solar irradiance model chain for horizontal-to-tilted irradiance conversion at high latitudes. The main goals of the work are 1) to assess the extent to which the literature accounts for decomposition and transposition models specifically developed for high-latitude application; 2) to evaluate existing validation studies for these particular conditions; 3) to identify research gaps in the optimal solar irradiance model chain for high-latitude application (i.e., latitude ≥60°). In total, 112 publications are reviewed according to their publication year, country, climate, method, and keywords: 78 publications deal with decomposition models and 34 deal with transposition models. Only a few models (6) have been parameterized using data from Nordic countries. Here, we compare 57 decomposition models in terms of their performance in Nordic climate zones and analyze the geographical distribution of the data used to parametrize these models. By comparing the Normalized Root Mean Square Deviation coefficients for direct normal irradiation, the decomposition models Skartveit1 and Mondol1 are most effective on one-hour scale and Yang4 on one-minute scale. Recent studies on the empirical transposition models estimating the global tilted irradiation on vertical surfaces show the best performance for Perez4 and Muneer models. In addition, innovative methods such as artificial neural networks have been identified to further enhance the model chain. This review reveals that a validated model chain for estimating global tilted irradiation at high latitudes is missing from the literature. Moreover, there is a need for a universal validation protocol to ease the comparison of different studies.
• In total, 47 one-hour and 10 one-minute decomposition models are parametrized for high latitudes.
• Skartveit1 and Yang4 are the most effective one-hour and one-minute models.
• Perez4 and Muneer can assess east-west vertical bifacial photovoltaics.
• Decomposition models can achieve sub-hour resolution, transposition models cannot.
• Validated model chains are lacking for east-west vertical surfaces at high latitudes.
Achieving net-zero emissions by 2050 represents a milestone for the low-carbon built environment. However, reaching this target is hindered by continuously rising global energy consumption (International Energy Agency, 2021). In response, different governments have proposed increasing the share of energy production from renewables and enhancing the efficiency of new energy power plants (Gielen et al., 2019).
To achieve climate targets, monofacial photovoltaics (MPV) and bifacial photovoltaics (BPV) have been exploited in recent decades. While MPV produces electricity by collecting sunlight only from the front side (i.e., the backside is covered with an opaque sheet), BPV collects sunlight from both sides of the panel. Using two active sides (i.e., the front and the rear side) increases overall energy production because the backside of the panel can harvest sunlight scattered by the atmosphere and reflected by the ground or other surfaces behind the panel. When not integrated into the building envelope, MPV and BPV are generally south oriented (in the Northern Hemisphere) and tilted at an optimal angle, which maximizes annual energy production, depending on the location. Therefore, the peak in energy production is usually observed at around solar noon. However, there is a mismatch between typical solar production and the average consumption profile of a residential sector which peaks in the early morning (around 7–8a.m.) and late afternoon (around 5–6p.m.) (International Energy Agency, 2022). Such a temporal mismatch between solar power production and electricity load can be reduced by adopting east-west (E-W) vertically mounted BPV systems (VBPV) (Khan et al., 2017; Jouttijärvi et al., 2022), whose production peaks are specifically in the morning and in the afternoon or evening. Furthermore, the electricity spot price typically peaks during the evening, and therefore increasing the self-consumption of PV electricity should be prioritized. Increasing self-consumption and avoiding electricity use during peak price represent the main drivers for E-W VBPV.
E-W VBPV have the greatest potential at high latitudes (Jouttijärvi et al., 2022) based on the low average Sun elevation, wide azimuth range, and long periods of high ground albedo due to snowfalls (Guo et al., 2013; Khan et al., 2017). In these conditions, an E-W VBPV can outperform a south-facing photovoltaic (PV) system (Stein, 2018; Pike et al., 2021). Rodríguez-Gallegos et al., (2018) investigated the advantages and disadvantages of MPV and BPV installations from an economic perspective. Their analysis highlighted the importance of different parameters, such as latitude, weather data, albedo, and the applied model chain, when calculating global tilted irradiance (Egt) (Perez et al., 1990a; Hofmann and Seckmeyer, 2017a). Knowing the Egt is a key factor for determining the potential energy production of a new PV plant (Prasad et al., 2020; Ramadhan et al., 2021). To estimate the Egt, the amount of direct normal irradiance (Ebn) and diffuse horizontal irradiance (Edh) must be known. However, ground measurements of Ebn and Edh are uncommon, and these quantities are usually estimated from global horizontal irradiance (Egh) using empirical decomposition models (Hassan et al., 2021). Although the scientific community has improved and developed new decomposition models since they were first introduced in 1961, they continue to be strongly influenced by the selected location, as they are empirical models based on site-specific data (Gueymard and Ruiz-Arias, 2016; Li et al., 2017). The number of locations considered in the model parametrization has been increasing in the recent years by permitting to implement a group of quasi-universal models (i.e., decomposition models for global application) in contrast to local models (i.e., decomposition models for regional application). However, local models can outperform models presented as quasi-universal when applied to the location where the data originates (Starke et al., 2021).
In contrast to decomposition models, transposition models allow Egt to be estimated based on solar irradiance (i.e., Ebn, Edh), Sun geometry (i.e., solar zenith angle, solar azimuth angle), and surface geometry (i.e., tilt angle, azimuth angle). These models have used different assumptions about the spatial distribution of sky radiance over the hemisphere, ranging from isotropic (Liu and Jordan, 1961) to anisotropic (Perez et al., 1987a). Nowadays, the anisotropic assumption is used the most, as it accounts for the circumsolar and horizon brightening contribution beyond the isotropic sky radiance and the direct beam irradiance (Figure 1).
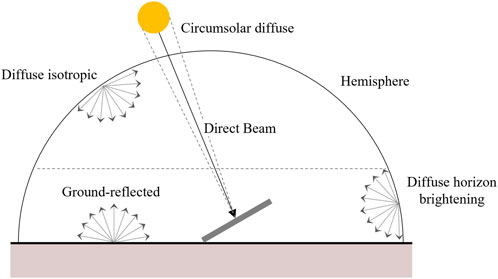
FIGURE 1. Different solar contributions to global tilted irradiance.
Within this framework, E-W VBPV systems in high-latitude application pose different challenges compared to south-facing PV systems. In particular, during the early and late hours of the day, when energy production peaks for E-W VBPV systems, the atmospheric thickness is high, which is a major source of error in many transposition models (Toledo et al., 2020). In addition, solar elevations less than five degrees are often omitted in the decomposition models because data quality check routines tend to filter them out as low-reliable datapoints (Utrillas and Martinez-Lozano, 1994; Hofmann and Seckmeyer, 2017b). This is only a minor drawback when modelling conventionally mounted PV systems. However, when modelling vertical E-W mounted systems at high latitudes, a significant part of the production is cut when solar elevations below five degrees are excluded (Figure 2). During 2021 in Trondheim (Norway), a direct solar irradiance of approximately 120 kWh/m2 reached the ground throughout the year (around 15% of the total yearly direct normal irradiance) when the Sun elevation angle was lower than five degrees. Moreover, another source of error is related to the estimation of the horizon brightness component of diffuse irradiance, which has a greater influence on E-W VBPV than on south-facing MPV systems.
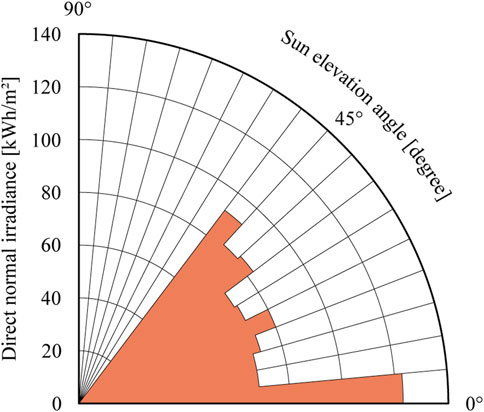
FIGURE 2. Angular distribution of direct normal irradiance depending on sun elevation angle. Data refers to 2021 in Trondheim.
The ability to accurately predict PV energy production is based on implementing a solar irradiance model chain which comprises suitable decomposition and transposition models. Knowing which combination of decomposition and transposition models should be used to estimate Egt in a new PV system is of primary importance. In fact, the accuracy of the model used for estimating the available solar energy is tied to uncertainty in the predicted energy production of the system. However, such models are usually created and validated for a specific geographical area (i.e., local, regional, global). Therefore, their accuracy can vary depending on where they are exploited.
Although a significant number of publications have validated decomposition and transposition models, the extent to which the literature covers the use of decomposition models in the Nordic geographical area is unclear. Moving from the extensive worldwide validation studies carried out by Ramadhan et al. (2021), and Yang (2022), the aim of this review is to explore decomposition models which can adequately estimate the Edh and Ebn at high latitudes. In addition, transposition model validation studies are investigated to provide a complete theoretical framework for a model chain for Egt estimation of E-W VBPV in Nordic setting. The paper is structured as follows: the materials and methods (Section 2) defines the literature search workflow, the statistical indicators, and the investigated location; the theory section (Section 3) outlines the theoretical framework behind the model chain for Egt estimation; the results section (Section 4) provides an overview of decomposition and transposition models; the discussion section (Section 5) comments on the results and analyses the strengths, weaknesses, opportunities, and threats (SWOT), literature gaps, and study limitations. The review concludes by considering future developments and summarises the most important findings and the implications for future advancements in model development and application to high-latitude locations (Section 6).
A systematic review approach was followed to investigate decomposition and transposition models for predicting Egt on E-W VBPV in high-latitude locations. Relevant literature was identified using a keyword-based search on the Web of Science (WoS) and Scopus databases. Among the existing databases, these were selected as they return literature from highly reliable sources and provide wide geographic coverage. Identical search terms were used in both databases. Scientific journal articles that focused on the development and validation of methodologies for estimating Egt were selected through a three-step screening process similar to (Manni and Nicolini, 2022). The first and the limited to selecting the best combination of search terms. Although using numerous search terms may be considered best, it can result in an unnecessarily high number of database hits which require longer and more extensive screening. In the third step, the eligibility of each database hit was “manually” assessed. The abstracts were screened to identify and exclude review articles and comparative studies which did not introduce new models.
Initially, all the possible combinations of three groups of terms were searched for in the titles, abstracts and keywords of the papers selected from both databases. The Boolean Operator “AND” was used to connect the three groups (A, B, and C) which included the following terms:
• Group A: “decomposition” and “transposition”;
• Group B: “*radia*“, and “solar”;
• Group C: “tilted”, “photovoltaic”, and “surface”.
Terms within the same group were mainly connected with the Boolean Operator “OR”. In particular, the query which was entered in both databases was: (“decomposition” OR “transposition”) AND (“*radia*” W/3 “solar”) AND (“tilted” OR “surface” OR “photovoltaic”). The operator W/3 (NEAR/3 in WoS) indicated that the search should only identify articles where the connected words appear within a range of 3 words in the selected search fields, while the asterisks were used to consider all the words including “radia” such as “irradiation”, “radiation”, “radiative”, and “irradiance”. The search was conducted in March 2022. The chosen search terms were found in more than 500 articles in Scopus and WoS. The order of the terms within the group and the order of the groups did not alter the returned literature: for example, (“decomposition” OR “transposition”) AND (“*radia*" W/3 “solar”) AND (“tilted” OR “surface” OR “photovoltaic”) and (“solar” W/3“*radia*”) AND (“photovoltaic” OR “tilted” OR “surface”) AND (“transposition” OR “decomposition”) returned the same publications. However, this search was deemed ineffective, as it returned a wide range of literature with topics beyond the scope of decomposition and transposition models. The search terms used in step two were refined with the help of the VOS Visualizer tool. This machine learning-based tool ranks the words contained in authors’ keywords from database hits and then applies clustering models to classify the most used words in groups. The resulting density visualization provided a quick overview of the main areas in the bibliometric network, highlighting the presence of journal articles about chemical photodegradation, photocatalysis, and x-ray diffraction. The density visualization in Figure 3 shows how the database hits belong to two different research areas that only share the “solar energy” term. Probably, using “decomposition” without “model” as well as including “photovoltaic” in the entered query led to such undesirable results.
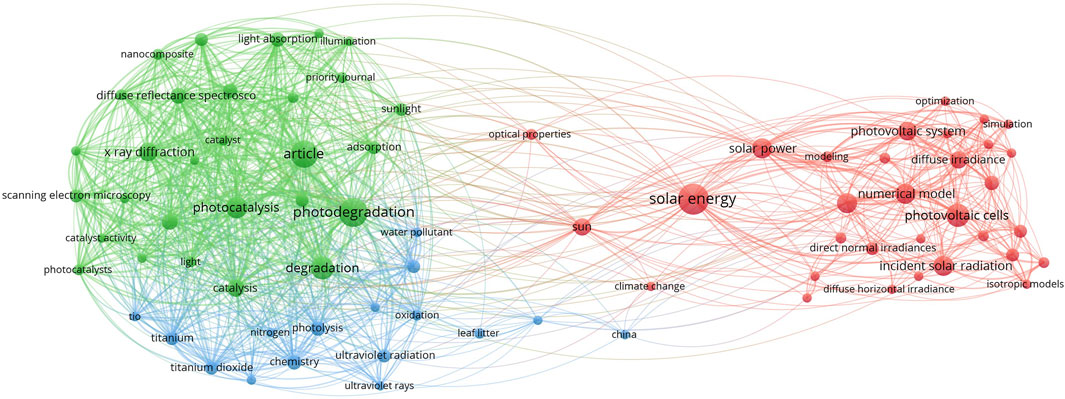
FIGURE 3. Density visualization of words in the authors’ keywords from the journal articles selected during step one. The words included in the search were excluded from the figure.
In step two, the entered query was modified into: [(“decomposition” OR “transposition”) W/5 “model”] AND (“*radia*” W/3 “solar”). The density visualization map (Figure 4) highlights the exclusion of the unwanted scientific journal articles which appeared in step one. The chosen search terms were found in around 150 articles in Scopus and WoS. Finally, the screening process in the third step permitted the results to be further narrowed. Around 110 database hits were selected for a detailed review in this study. Among these, 78 research studies describe decomposition models, while 34 research studies focus on transposition models.
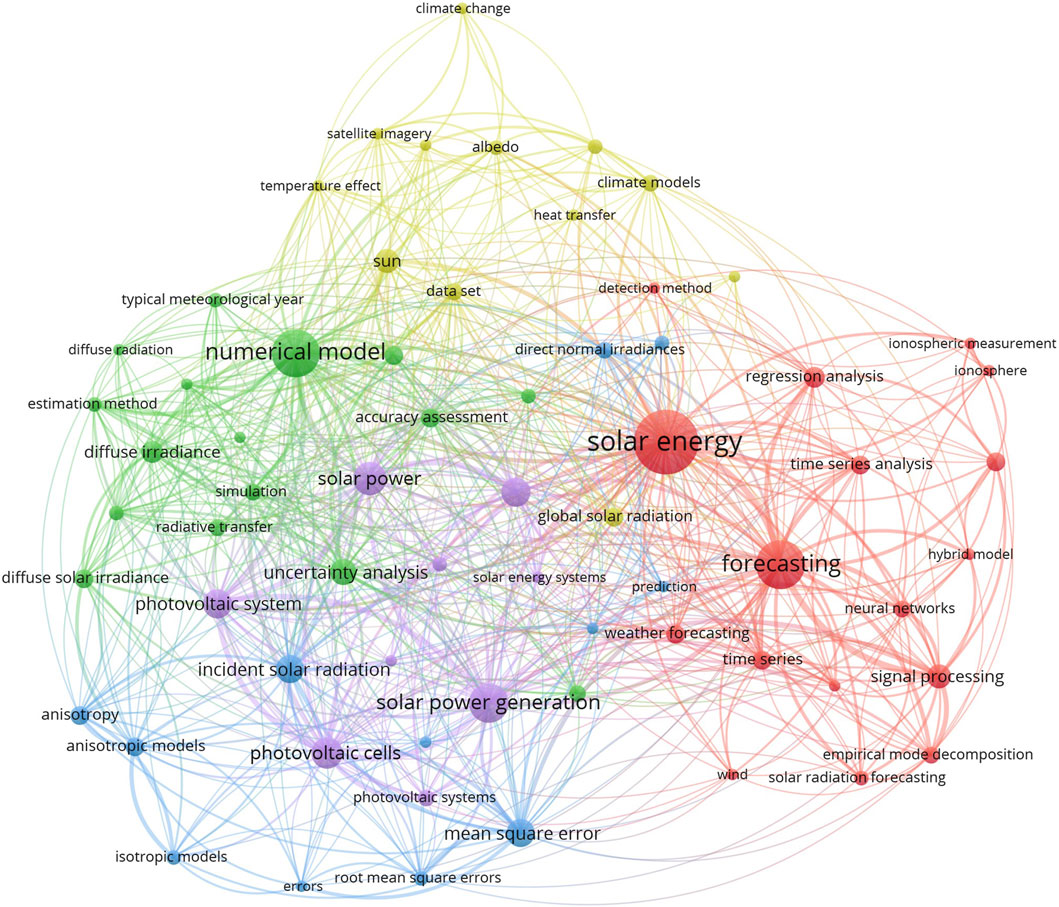
FIGURE 4. Density visualization of words in the authors’ keywords from the journal articles selected during step two. The words included in the search were excluded from the figure.
Studies related to Norway, Sweden and Finland were investigated in this work. According to the Köppen-Geiger climate classification (Köppen, 1900) updated by Peel et al. (2007), these countries mainly belong to subtypes of cold climate which begin with the letter D (Table 1). Alongside these, areas classified as subzones from polar climate (E) and mild temperate climate (C) are also present (Figure 5).
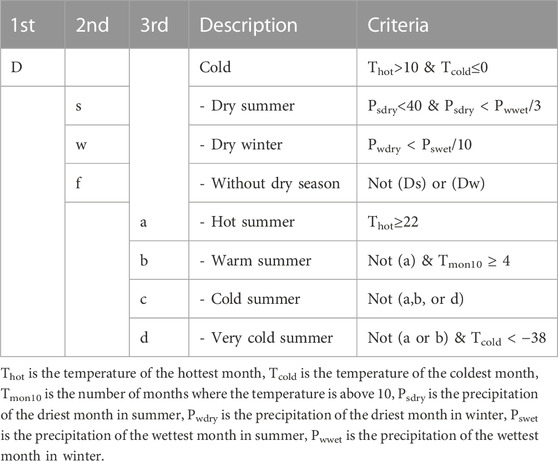
TABLE 1. Description of Köppen-Geiger climate symbols and defining criteria for the cold climate.
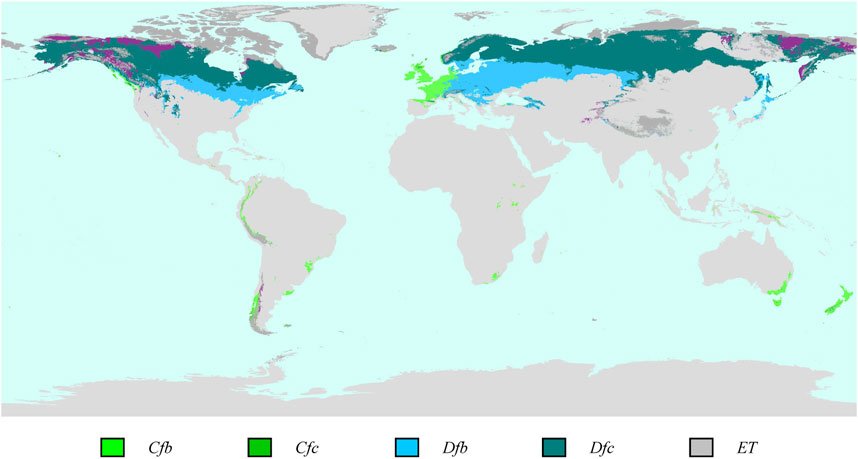
FIGURE 5. Worldwide distribution of the Köppen-Geiger climate zones which are present in Norway, Sweden, and Finland (i.e., Cfb, Cfc, Dfb, Dfc, ET). The map was created by re-elaborating the original version in Beck et al. (2018).
Most Norwegian, Swedish, and Finnish regions belong to the “Dfc” sub-climate which corresponds to subarctic climates with the coldest month averaging below 0°C and up to 3 months averaging above 10°C. No significant precipitation difference is observed throughout the year. However, since only one weather station from the Dfc subzone is considered in the most relevant validation studies about decomposition models (Gueymard and Ruiz-Arias, 2016; Yang, 2022), the other climate zones present in Norway, Sweden, and Finland (i.e., Cfb, Cfc, Dfb, and ET) are also included in this study.
This section outlines the theory behind decomposition and transposition models used to estimate Egt. Regarding the taxonomy applied to decomposition and transposition models, these are named after the main author’s name with the addition of a number in case more models from the same author exist. In this article, the only exception to this is represented by the BRL decomposition model which is named after the initial of the three scientists who developed this: Boland, Ridley et al. (2010).
The total solar irradiance outside the Earth`s atmosphere (E0) is almost constant at 1,361.1 W/m2 (Gueymard, 2018). Absorption, scattering, and reflection phenomena occur within the atmosphere due to the presence of O2, O3, CO2, and H2O molecules (Calvin and WR, 2012). Therefore, the Ebn reaching the Earth’s surface is reduced by approximately 30% on a clear day and when the Sun is directly overhead (Calvin and WR, 2012), while Edh is generated because of scattering events. Sunrays travel through the air mass (AM) following a path whose length is variable and depends on the position of the Sun. The AM length is the distance covered by sunray through the atmosphere and normalized by the shortest possible path.
As reported in Eq. 1, the sum of direct and diffuse irradiance incident to a horizontal plane is defined as Egh.
where θz is the solar zenith angle (the angle between the direct line to the Sun and a vertical line).
The Egh is used to calculate the clearness index (kt) which is equal to the Egh to E0cosθz ratio. The diffuse fraction (kd) is the share of the diffuse horizontal irradiance from the global horizontal irradiance (Edh/Egh). Due to the atmosphere inhomogeneity, the kt and kd indices vary with space and time.
The Edh can be split into isotropic (Ed;iso), circumsolar (Ed;circ) and horizon brightening (Ed;hor) components. The Ed;iso is emanated uniformly from every point in the sky dome, while the Ed;circ originates from forward scattering rays near the path of sunrays. Finally, the Ed;hor consists of the brightness near the horizon and occurs when rays are scattered multiple times in the atmosphere in a band just above the horizon. Positive values for Ed;hor correspond to clear sky days (and they increase with the θz), while negative values are calculated for overcast days when the sky is not visible and the clouds near the horizon are darker than the rest of the hemisphere (Perez et al., 1990b). Cloud coverage influences irradiance scattering. Egh can be reduced by more than 50% with a kd close to one (heavy cloud cover day). However, some changes in the cloud pattern can increase Egh above the clear sky conditions and the kt index is consequently greater than one. Such a phenomenon is known as cloud enhancement (CE) (Inman et al., 2016; Gueymard., 2017a).
Determining the position of the Sun in relation to the investigated PV system is necessary to quantify the Egt. The position of the Sun can be easily estimated for a specific combination of date, time, latitude, longitude, and elevation. Numerous algorithms determine the Sun position with high accuracy (Michalsky, 1988; Reda and Andreas, 2004; Blanc and Wald, 2012). Among these, the one proposed by Reda and Andreas (2004), which is used in the open-source pvlib-python tool (Holmgren et al., 2018) and National Renewable Energy Laboratory (2014), enables predicting the θz and solar azimuth angle (αz) with an accuracy of 0.0003°. The θz and αz as well as the tilt angle of the investigated PV surface (β) and its azimuth (α) allows calculating the angle of incidence of the sunrays (Φ) (Gueymard, 2022).
Following this, Egt can be calculated with the following equation:
where Edt is the calculated diffuse irradiance on the tilted surface and Er;gr is the incident irradiance from ground reflections. The fb and fd factors account for the shading phenomena of direct and diffuse irradiance, respectively. To calculate Egr, the View Factor (VF) from a specific ground area to the sky, the Edh for that ground area, the ground albedo (ρ), and the VF from the tilted surface to the ground area must be known.
The ground area is assumed as horizontal in Eq. 3.
To estimate the solar irradiance collected by an oriented surface, Edh and Ebn in the chosen location, the surface geometry configuration, and the characteristics of the surroundings (i.e., buildings, vegetation) in terms of horizon profile and albedo must be known. Quantifying Edh and Ebn represents an issue due to the lack of measured data. Although it is feasible from a technological point of view, only Egh is usually monitored for economic reasons (Gueymard, 2022). Therefore, implementing numerical models for decomposing Egh into Edh and Ebn are a topic largely debated by the scientific community.
Decomposition models enable Edh and Ebn to be estimated by knowing Egh. The first decomposition models to be developed exploited experimental data to identify empirical correlations between kd and kt. The reliability of these models was limited to climate conditions similar to the one used in the model parametrization. Therefore, more complex models have been developed which correlate kd to more than one predictor. In general, such models calculate the kd index through the Eq. 4 that was originally proposed by Yang and Boland (2019):
where X is a vector of predictors, μ(X) describes a trend (constant or linear combination of X), g is the model function (typically exponential or logarithmic), f (X) is a linear function which can be a step function, and ε is the error estimation. Predictors are input parameters which can be based on measurements or deterministic calculations. The most popular predictors are the kt, the θz, and the variability index (V). A decomposition model using only kt as a predictor will probably result in less accurate results than a model using multiple predictors (Figure 6) (Gueymard and Ruiz-Arias, 2016).
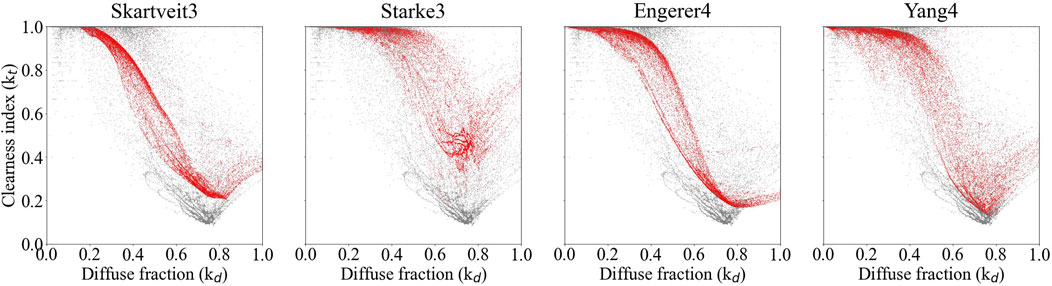
FIGURE 6. Measured and modelled kd vs. kt at Trondheim (Norway). Measurements are retrieved from the NTNU-SINTEF SolarNet in Trondheim (Manni et al., 2023).
Several databases provide solar radiation datasets based on satellite monitoring or reanalysis models from Numerical Weather Prediction (NWP). Alongside these, Typical Meteorological Year (TMY) datasets are commonly used to evaluate building energy performance. Nonetheless, the use of solar irradiation data from statistic-based weather data files may result in the incorrect computing of diffuse fractions as well as in systematic error within the evaluation of the potential benefits. Databases from satellite observation are characterized by a specific spatial resolution and are not available for each time-period and for each latitude. Moreover, they present limitations regarding the assessed solar radiation components and land cover. The major issue related to the use of satellite images is distinguishing between snow and cloud coverage because they usually have the same pixel values and spatial distribution patterns. Conversely, reanalysis databases are created by running modern NWP models on previous data before correcting the outcomes with ground-measured meteorological data. The main advantage is that the datasets usually cover the whole Earth, although with a low accuracy and spatial resolution compared to satellite observations. Since large parts of Norway, Sweden, and Finland lack coverage of satellite-derived datasets, reanalysis databases have potential if they are more accurate than using empirical decomposition models with ground-measured Egh. In this regard, the Copernicus Arctic Regional Reanalysis (CARRA) system, which is the first regional atmospheric reanalysis targeted for European parts of the Arctic areas, have been implemented in 2022 to specifically investigate the climate at high-latitude locations. Databases providing Egh and another radiative component for the Nordic zone are listed in Table 2.
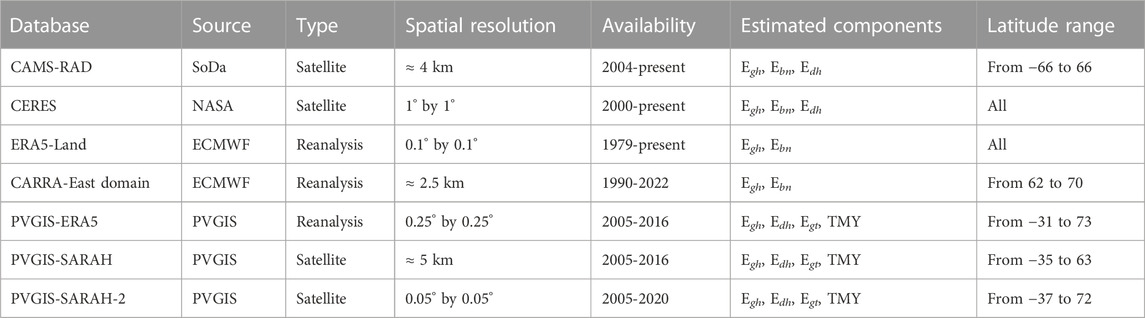
TABLE 2. List of modelled databases which provide at least two irradiance components for a significant part of Norway, Sweden, and Finland. Metric conversion of 1° longitude is around 110 km, while 1° latitude can range between 63 km (at 55° latitude) and 36 km (at 71° latitude).
Once Edh and Ebn have been determined, Egt can be estimated by applying the transposition models in the next step of the model chain. Numerous transposition models have been implemented for quantifying Egt on south-oriented MPV (Gueymard, 2009; Gueymard, 2022). Nonetheless, this calculation is still prone to significant errors when it comes to estimating Egt characterized by a low angle of incidence or impinging on faces away from direct sunlight (i.e., rear of a BPV) (Riedel-Lyngskær et al., 2020). The Perez4 model (Perez et al., 1990b) is shown in Eq. 5 as an example:
where fnm varied according to sky conditions. However, empirical transposition models are often incorporated into software tools which perform VF or raytracing analyses.
Such tools usually assess the VF from the ground to the sky and from the tilted surface to the ground. The view factor describes the ratio of radiant energy emitted by a surface which is incident on another surface. This is calculated with Eq. 6:
When it comes to PV systems, the VF can be estimated by considering only two dimensions.
Raytracing assessment can be applied as an alternative to the VF evaluation to estimate shading. Raytracing is a method to mathematically determine the ray’s path within a tridimensional environment (Negi et al., 1986). The Monte Carlo simulation can be applied to track rays from the PV surface backwards to the light source as well (Hansen et al., 2016; Manni et al., 2020). If compared to the VF calculation, both raytracing assessment and the probabilistic approach require greater computational time (Berrian and Libal, 2020).
Figure 7 shows the number of articles published per year along with the time resolution adopted for the model outputs. More than half of the studies were published in the last two decades, even though the first study about decomposition modeling was published in 1961. A turning point in this research topic occurred in the year 2015. In fact, decomposition models characterized by sub-hour time resolution, which first appeared in 1988, became increasingly frequent between 2013 and 2015, when they finally outnumbered one-hour models.
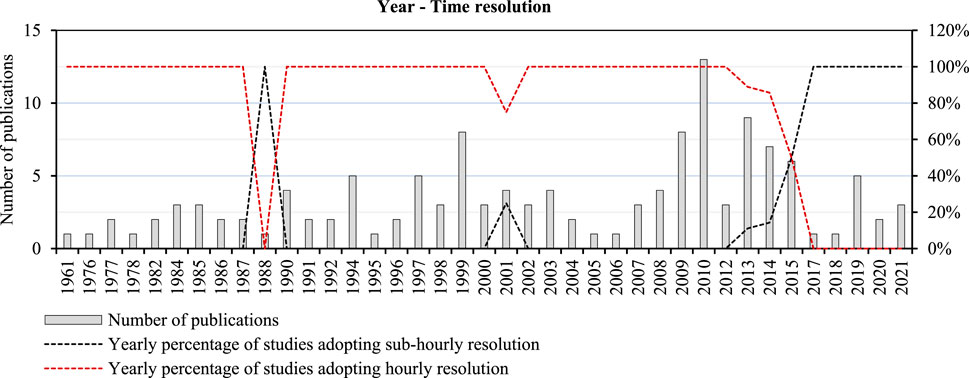
FIGURE 7. Number and distribution of time resolution of publications by year. The black and red dashed lines indicate, respectively, the yearly percentage of the study adopting a sub-hour and an hour time resolution.
After 2015, all the decomposition models included in this review had sub-hour resolution. This represents a significant improvement because it allows some instantaneous events to be investigated such as the CE and albedo enhancement (AE) effects, which cannot be detected when aggregating data hourly.
The analysis of weather stations whose data were used for the model validations in the reviewed studies highlighted the scarcity of decomposition models that are specifically developed for high latitudes. In fact, around three quarters of these models were implemented for dry climates (B) and temperate climates (C), while the rest were divided into tropical climates (A), continental climates (D), and polar climates (E). Figure 8 highlights that the most investigated climate zones were the humid sub-tropical climates (Cfa), the oceanic climate (Cfb), and the Mediterranean hot summer climates (Csa). Moreover, the tropical savanna climates with dry-winter characteristics (Aw), the cold semi-arid climates (Bsk), the warm summer continental climates (Dfb), and the tundra climate (ET) were the most common from the other main climate zones. Data from the sub-artic climates (Dfc), which is most common in the territories of Norway, Sweden, and Finland, were used in the validation of only five decomposition models.
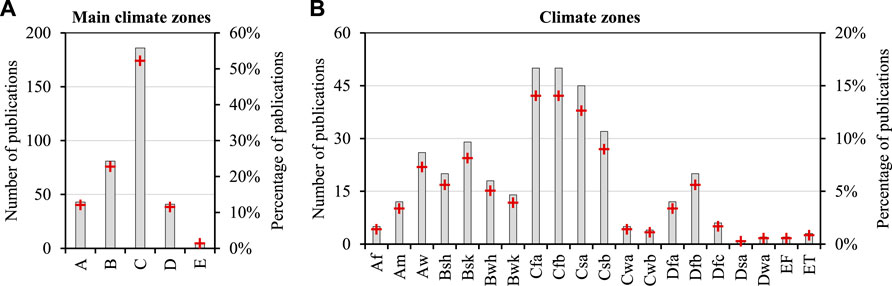
FIGURE 8. Number of publications by Köppen-Geiger main climate zones (A) and sub-climate zones (B). The red crosses represent the percentage of studies for each bin with respect to the totality.
The geographical distribution of the studies is reported in Figure 9. Among the investigated countries, up to six decomposition models were proposed for Norway, while none was found for Sweden or Finland.
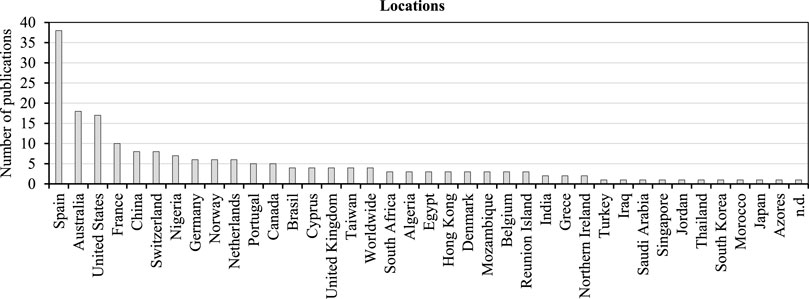
FIGURE 9. Number of studies by countries.
Decomposition model inputs were chosen from a wide group of predictors. The number of predictors varied and ranged from one to seven in the reviewed studies. A unique predictor was used by 71 decomposition models (kt in 70), while in 27 studies another predictor such as θz or V was added to kt. The number of publications per quantity of predictors is reported in Table 3 along with the number of publications for each predictor.

TABLE 3. Number of publications by number of predictors used as decomposition model input.
In total, around 20 different predictors were considered in the reviewed decomposition models. The analysis highlighted that the θz, the V, and the time of the day (t) are the three most used parameters after the clearness index (Figure 10).
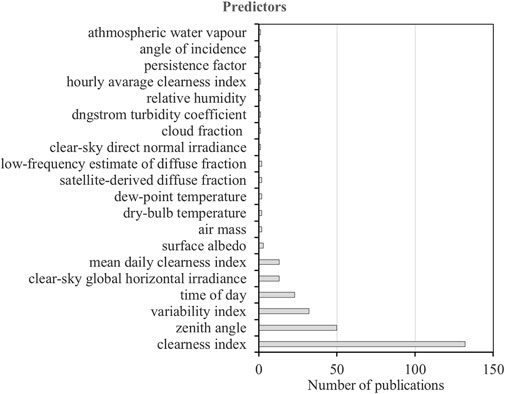
FIGURE 10. Number of publications by used predictor.
A frequency analysis of the keywords associated with the reviewed scientific journal articles was carried out (Figure 11). On the one hand, the “diffuse solar radiation” and “clearness index” keywords were the most used and were found in 59 and 30 articles, respectively. On the other hand, the “clouds” and “statistical models” keywords were less frequent with only seven and six articles, respectively. The “other” category includes up to 26 different keywords that occurred less than five times.
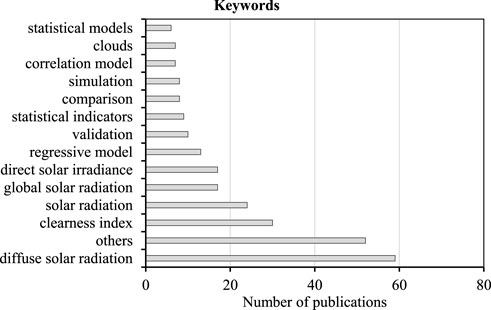
FIGURE 11. Number of publications by authors’ keywords.
This section presents the decomposition models existing in the literature that were parameterized by considering solar radiation datasets from at least one of the climate zones characteristic of Norway, Sweden, and Finland (see Figure 5) (Tables 4, 5). Decomposition models which are characterized by an hourly time resolution are shown in the first part, while those having a one-minute time resolution are described in the second part.
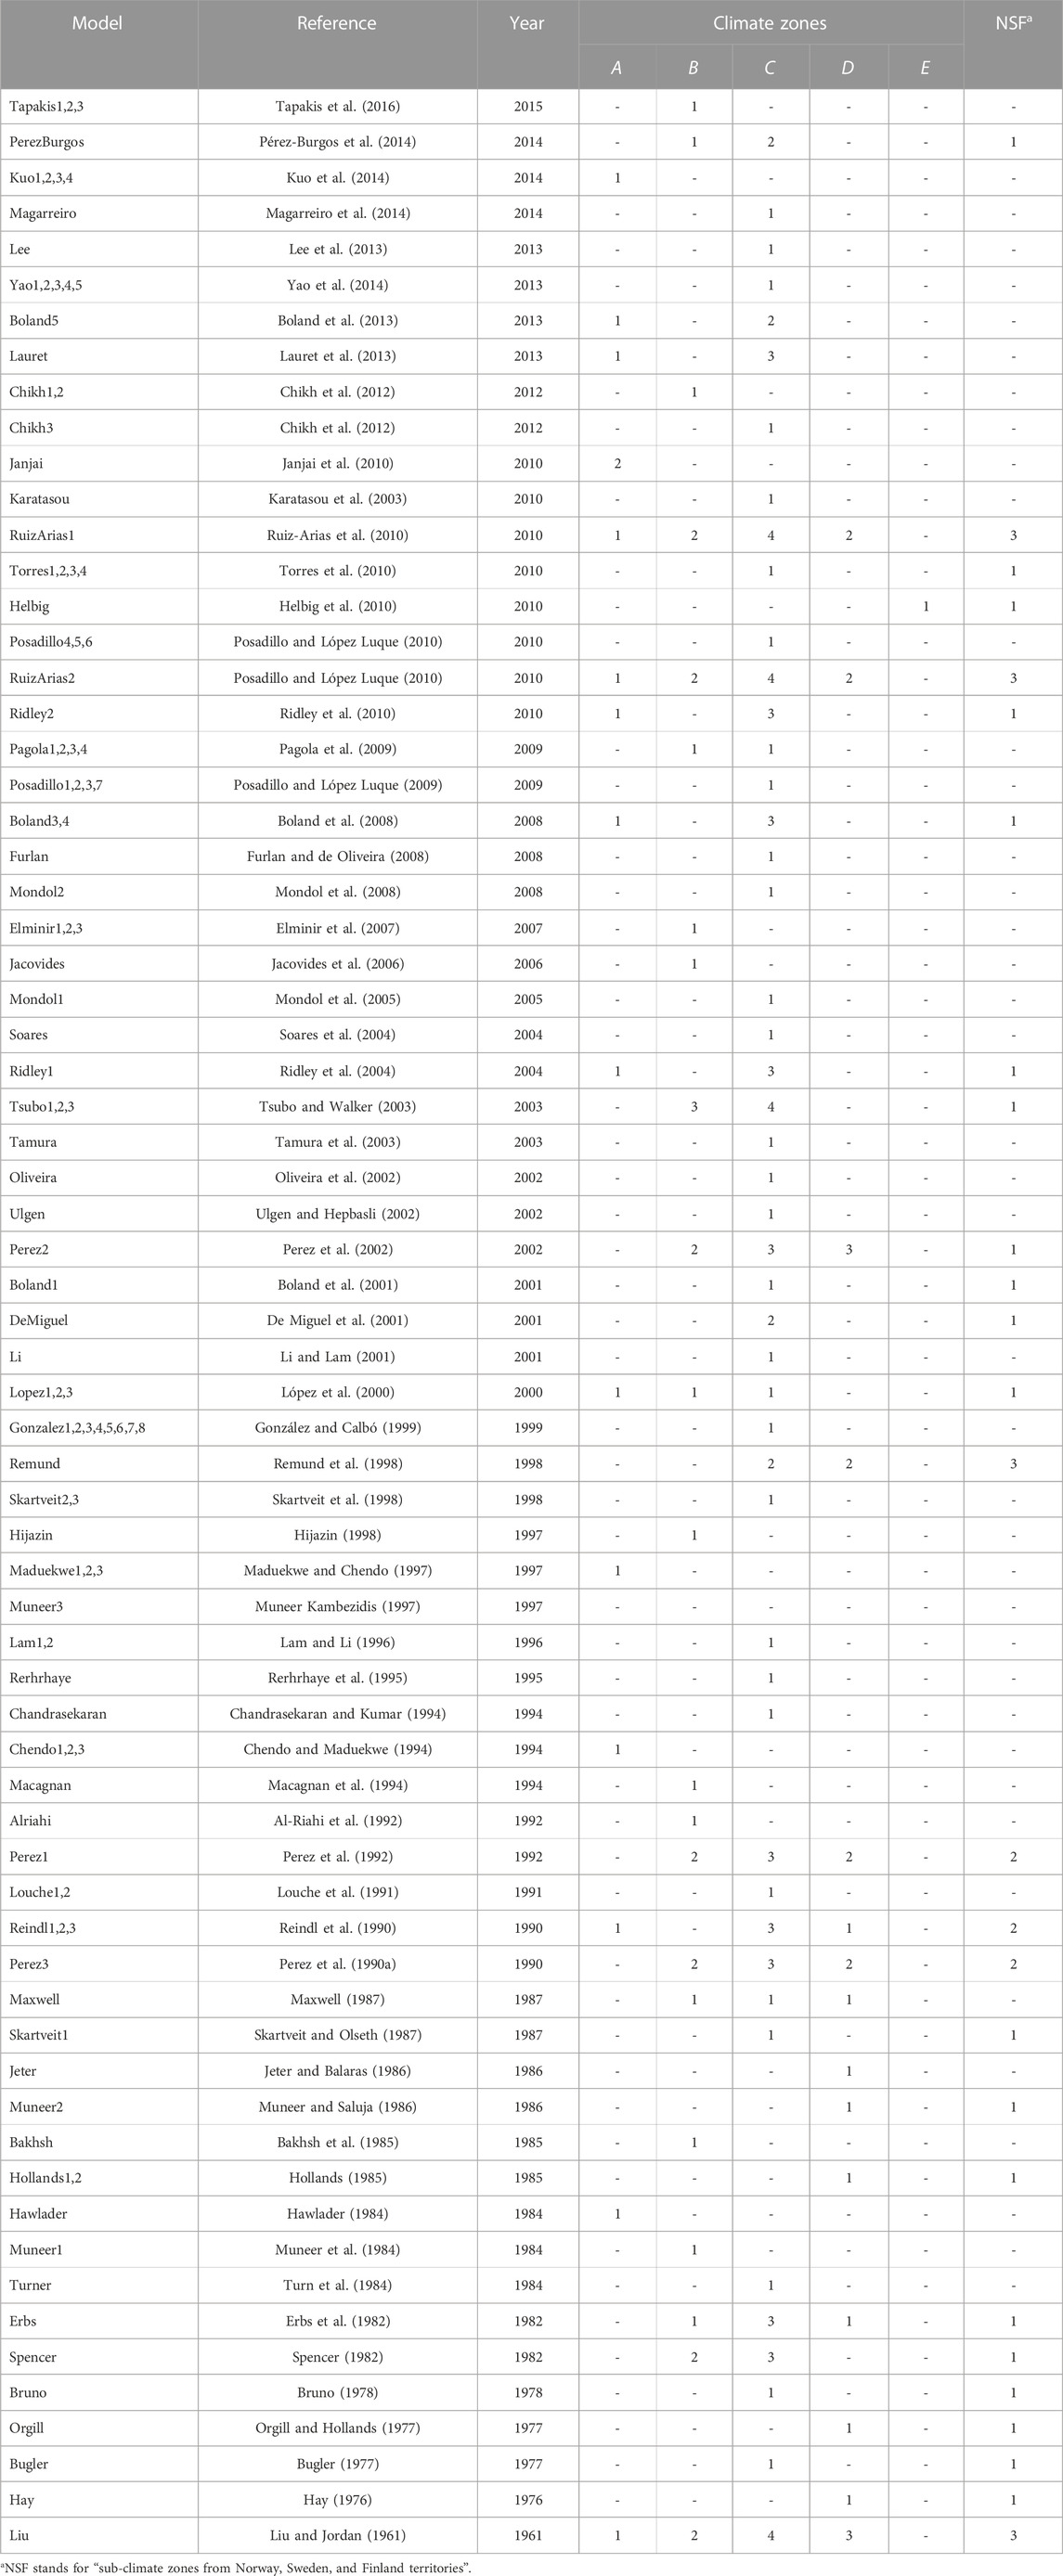
TABLE 4. Distribution of the climate zones used in the parametrization of the reviewed one-hour decomposition models. Multiple models presented in the same publication are clustered in the same row.
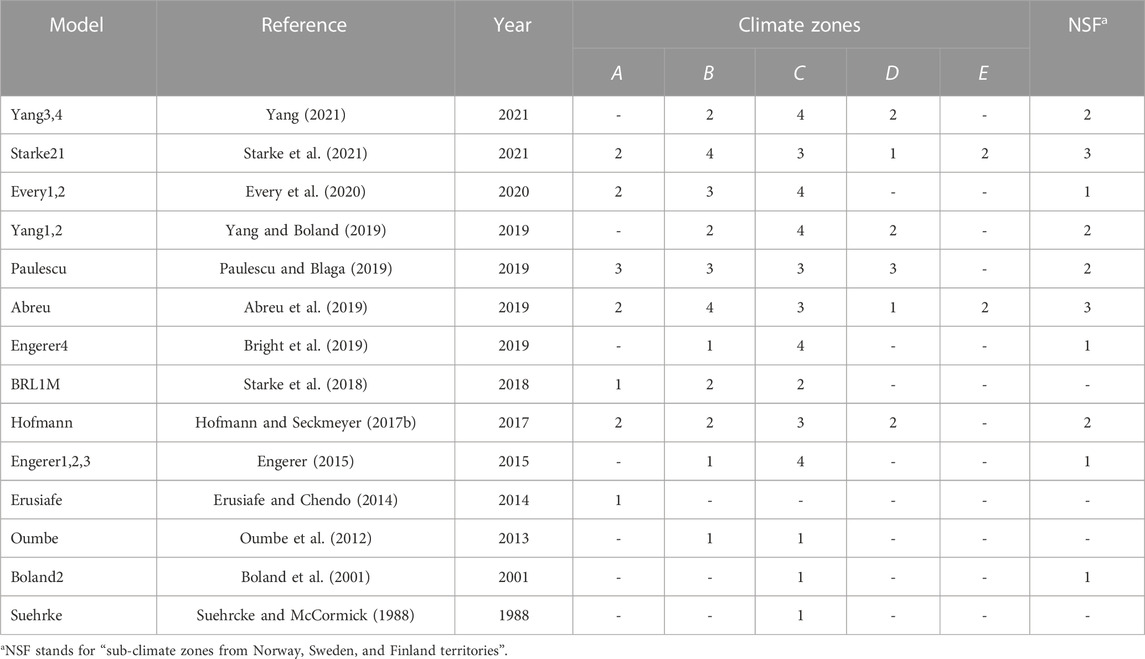
TABLE 5. Distribution of the climate zones used in the parametrization of the reviewed one-minute decomposition models. Multiple models presented in the same publication are clustered in the same row.
Their performances were evaluated based on the extensive validation work carried out by Gueymard and Ruiz-Arias (2016) in the case of one-hour decomposition models, and on the novel study from Yang (2022) in the case of one-minute decomposition models. Moreover, the Ebn quantities predicted for locations classified as Cfb, Cfc, Dfb, Dfc, or ET in the Köppen Geiger climate map were considered to estimate the normalized Root Mean Square Deviation (nRMSD) values used to compare the models.
One-hour models which might be suitable for high-latitude locations were mostly climate-specific models. In fact, only one fourth of them were found to consider more than one location during the parametrization process. In this regard, the Skartveit model family was established in (Skartveit and Olseth, 1987) based on data collected over 32 years in Bergen (Norway). Later, the models were improved by introducing the hourly variability index (Vhour) and the ground albedo predictor (Skartveit et al., 1998). The possibility of using ρ as an input parameter and exploiting climate data from Bergen make the Skartveit3 model suitable for high-latitude locations.
The Reindl model family was also parametrized with a solar radiation dataset from Norway, although it was used alongside datasets from the United States, Germany, Denmark, and Spain (Reindl et al., 1990). However, solar irradiation values from 1979 were used which cannot be considered as completely representative of the current scenario.
In addition, other decomposition models such as the ones from Hollands, Perez, Boland, and Ridley model families are evaluated in this section since they were developed for high-latitude climate zones. It is worth highlighting that the Yao model family (Yao et al., 2014) was included in the analysis even if it was parametrized with data from the Cfa climate zone. The reason is that these models were specifically developed for high albedo climate zones.
The analysis of the nRMSD index is reported in Table 6 and visualized in Figure 12. The Skartveit1 model was identified as the most effective model at high latitudes, although it was outperformed by Spencer in the E zone. In addition to this, Mondol1, which was parametrized with solar radiation data from Northern Ireland, exhibited high performance levels being the second in the global ranking and the third in the D zone ranking.
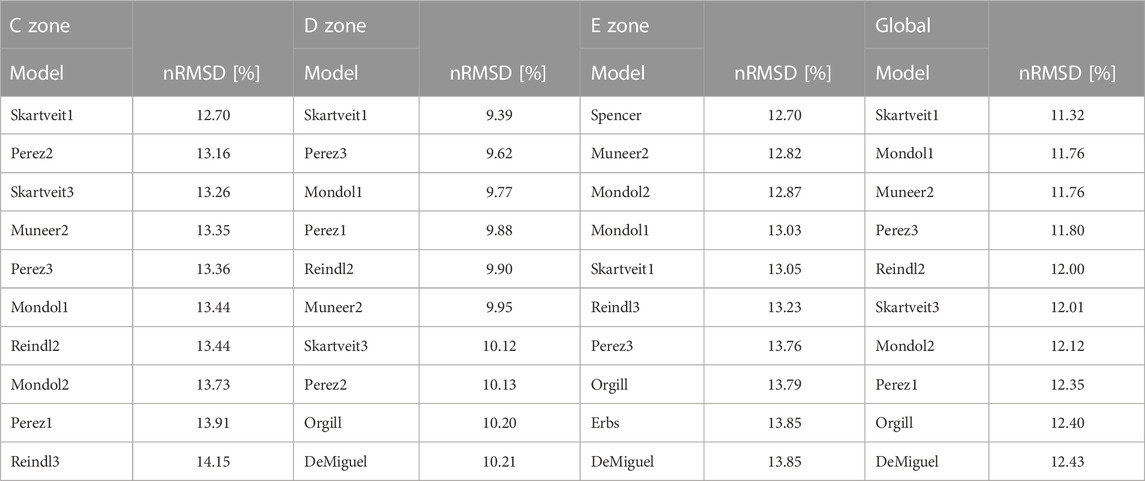
TABLE 6. Error statistics about Ebn calculated for the high-latitude locations from Supplementary Material by Gueymard and Ruiz-Arias (2016). The best ten performing models are shown, with statistics averaged over the selected sites.
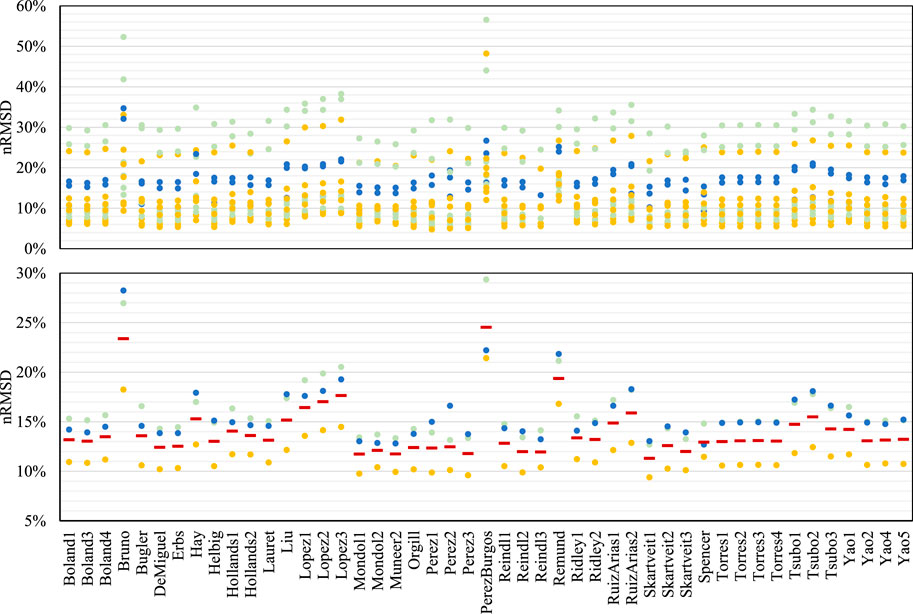
FIGURE 12. Error statistics about Ebn calculated for the high-latitude locations from Supplementary Material by Gueymard and Ruiz-Arias (2016). Values for each weather station are reported on the top, while on the bottom the average value is reported for each climate zone (dots) and globally (red line). Light green, orange, and dark blue dots correspond to a weather station in C, D, and E climate zone.
Regarding the analysis of one-minute models, those reviewed in the extensive validation study carried out by Yang (2022) and suitable for the high-latitude locations have been considered. Unlike one-hour models, one-minute models are usually developed to be globally applied. Therefore, datasets from different locations are exploited in their parameterization. Among these, the Engerer2 (Engerer, 2015) was considered to perform best, but recently the Yang4 was demonstrated to be able to replace it as the new quasi-universal model (Yang, 2022).
Alongside this, the one-minute model from Paulescu and Blaga (Paulescu and Blaga, 2019) was assessed since it proved to be as valid as the Engerer2 in all the locations considered in their study. The Paulescu was established for the Cfb climate and then validated against measured values from 35 locations, but none from the D climate zone. The authors argued that the irradiance (particularly the diffuse irradiance) showed odd features in these zones, as already stated by Gueymard, (2017a), Gueymard, (2017b).
In Yang and Boland (2019), two enhanced versions of Engerer2 (YANG1 and YANG2) were developed by adding the satellite derived diffuse fraction predictor (kd,s). The kd,s predictor consists of a one-minute interpolation between 30-min datapoints from satellite databases and is used to describe low frequency variability patterns. In fact, satellite observations can be exploited in the decomposition process by providing information about temperature and wind speed (Urraca et al., 2018), as well as about the ground irradiance which can be determined though specific methods (i.e., Heliosat-4) (Qu et al., 2017). However, Babar et al. (2020) demonstrated that satellite-based models are worse than empirical decomposition models despite the higher accuracy of their input datasets. Recently, Yang has introduced a new modeling strategy named temporal-resolution cascade (Yang, 2021). Such a strategy was incorporated into Yang3 (15-min model) and Yang4 (1-min model). Since Yang1, Yang2 and Yang3 are not as accessible nor as accurate as Yang4 (Yang, 2022), they were overlooked in the present performance assessment.
In 2019, Bright et al., (2019) updated the Engerer2 model by recalculating the parameters with datasets from 75 different stations worldwide and by removing inputs such as the Sun elevation angle and the clear sky irradiance (Ecs) (Engerer4). When datasets from the Australia region were used, the Root Mean Square Deviation was reduced by 17.9% from the original model. Conversely, in the cold climate zone, the authors reported an overall worsening in model performance.
In 2021, Starke et al. (2021) reviewed and updated their previous work (Starke18A and Starke18B) (Starke et al., 2018) by proposing new climate specific models based on BRL1M (Starke21). A new predictor, the hourly clearness index (kt,hour), was added. A model for each climate zone and sub-zone defined in Köppen-Geiger climate classification was proposed and then verified against Engerer2, Skartveit3, Perez2, and BRL. The study revealed that the new models were the most accurate. It is worth highlighting that only the Starke family’s models developed for climate zones characteristic of the Norway, Sweden, and Finland regions were considered in this work.
In Figure 13, the comparative analysis on models’ performance levels in the high-latitude locations confirmed that Yang4 is the best one-minute model. Alongside this, the Starke family model can represent an effective solution particularly when applied to C and D zones (Table 7).
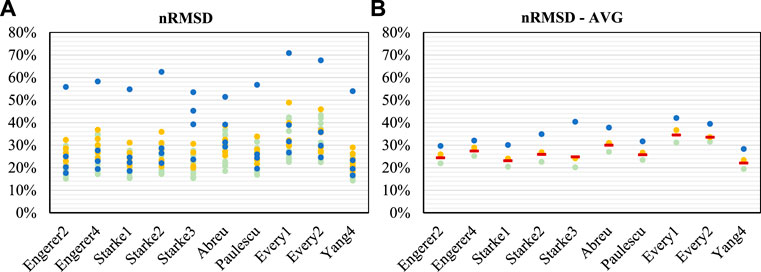
FIGURE 13. Error statistics about Ebn calculated for the high-latitude locations from Supplementary Material by Yang (2022). Values for each weather station are reported on the (A), while on the (B) the average value is reported for each climate zone (dots) and globally (red line). Light green, orange, and dark blue dots correspond to a weather station in C, D, E climate zone.
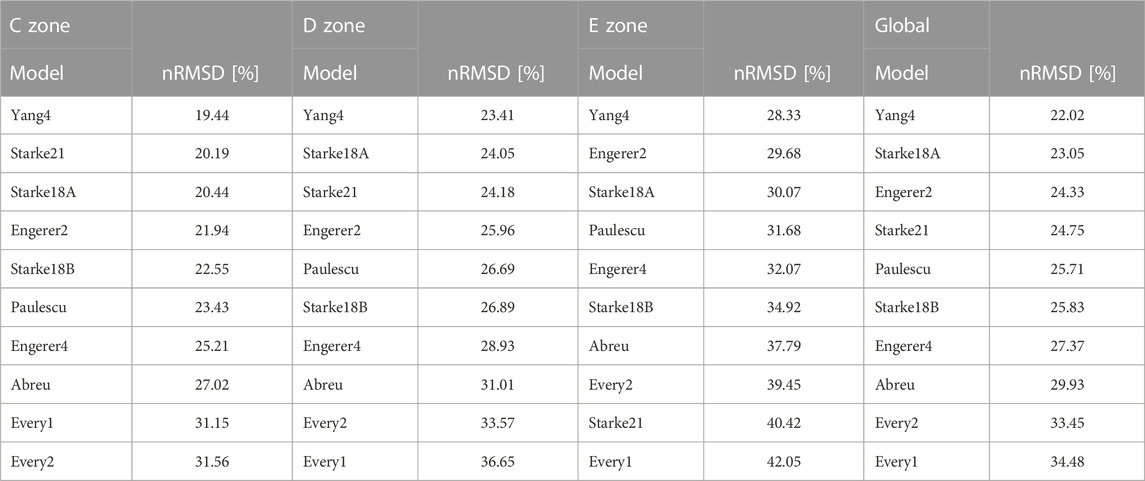
TABLE 7. Error statistics about Ebn calculated for the high-latitude locations from Supplementary Material by Yang (2022). The best ten performing models are shown, with statistics averaged over the selected sites.
Figure 14 shows a timeline in which the reviewed studies about transposition modeling are distributed and clustered according to the model typology. Four model typologies were found in the literature: isotropic models, anisotropic models, artificial neural network (ANN) models, and probabilistic models. Isotropic models were the first model typology to be implemented in 1961; then, anisotropic models were developed (1977). ANN (e.g., multi-inputs convolutional neural networks, generalized regression neural networks, gradient-boosting frameworks for machine learning) and probabilistic models have been introduced recently in this research field (from 2013), but they are considered so promising that around 70% of the transposition models published since 2013 belong to these two groups. Conversely, the isotropic models have been investigated increasingly less over the last two decades. Nonetheless, ANN and probabilistic models have been presented in around 20% of the reviewed studies, while the isotropic and anisotropic models have occurred in 63% and 16% of the studies, respectively (Figure 15).
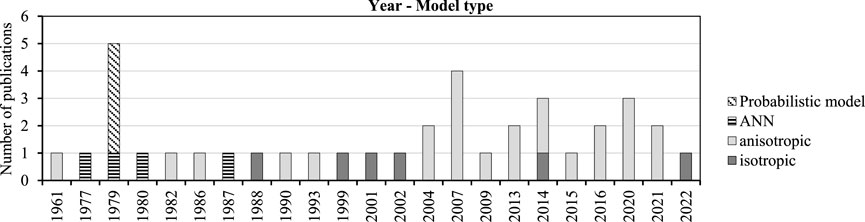
FIGURE 14. Number of publications and distribution of model typologies by year.
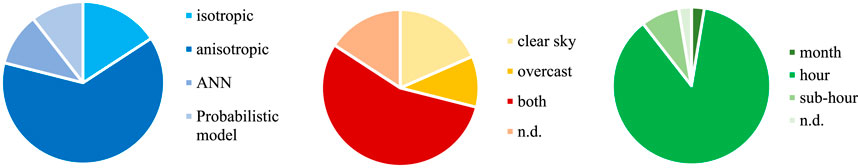
FIGURE 15. From the left: percentage distribution of model typologies, percentage distribution of sky conditions in the model validation, percent distribution of time resolution values. Percentage is calculated over all the reviewed transposition models.
When it comes to the simulated sky conditions, half of the reviewed transposition models were found to be validated in both clear and overcast sky conditions (Figure 15). Conversely, 18% of the models performed exclusively for overcast skies, while 16% of the models can operate only in case of a clear sky. Furthermore, most of the transposition models were found to provide hourly outputs (87%), and only three models could work with a sub-hour time resolution (8%). Contrary to decomposition modeling, there is a lack of trend in transposition modeling towards the reduction of the time resolution. Such a discrepancy might represent an issue and reduce the impacts of the decomposition model’s enhancement on the overall model chain. However, the hourly transposition models reviewed in (Gueymard, 2009) appear to be equally applicable to one-minute data. The tabular review (Table 8) provides information about the approach to modeling solar diffuse radiation (i.e., isotropic, circumsolar, horizontal bright). It is worth highlighting that recent ANN and probabilistic models based on machine-learning methods, can directly estimate the Egt without considering the anisotropic sky dome.
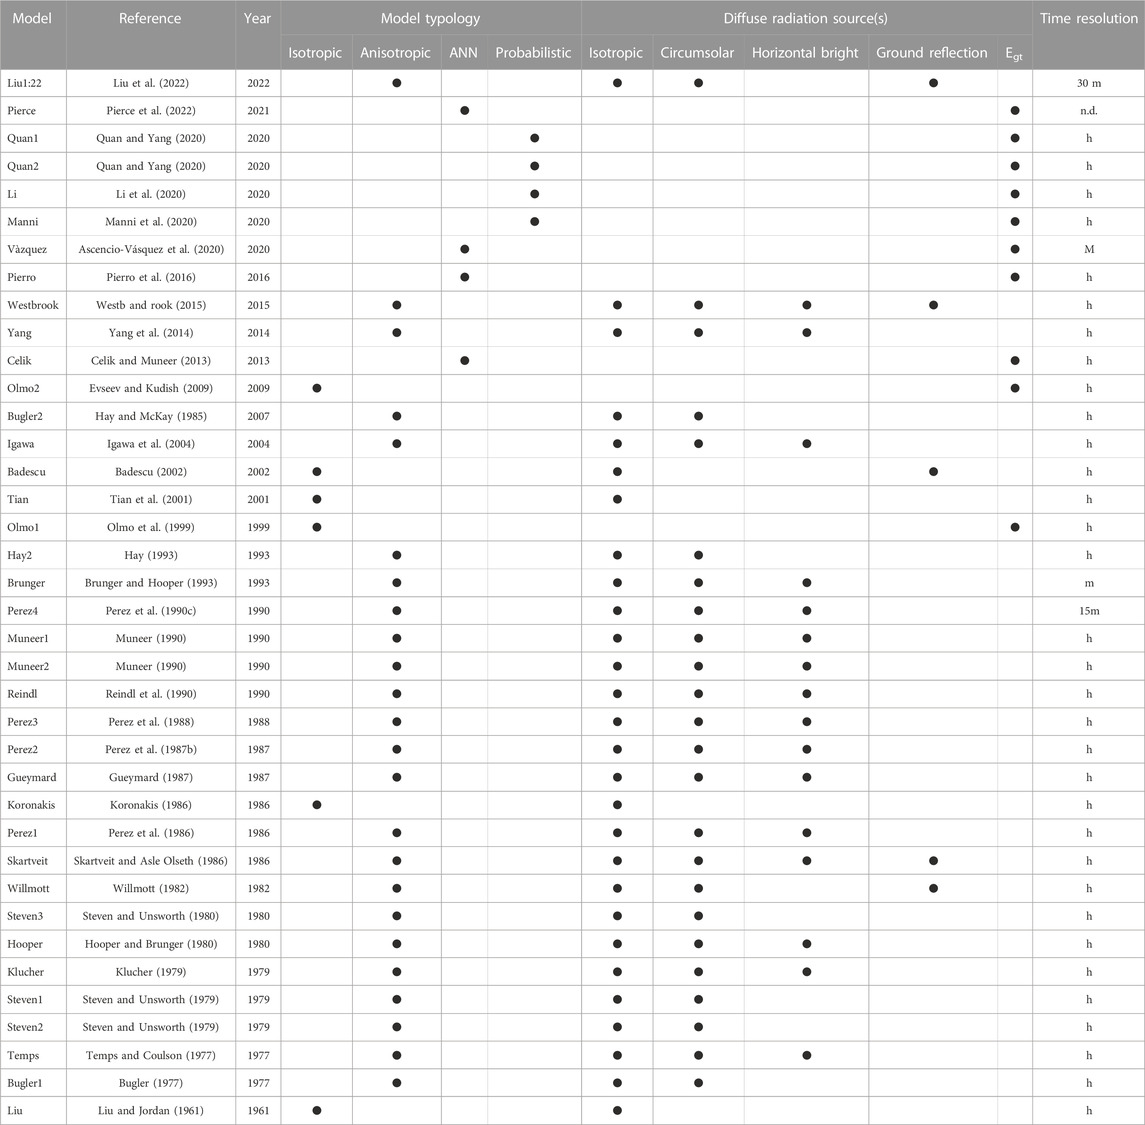
TABLE 8. Tabular review of the reviewed transposition models according to the typology, the evaluated diffuse radiation sources, and the time resolution. For the time resolution: M stands for “month”, h stands for “hour”, and m stands for “minute”.
The review study about transposition models from Yang, (2016) highlighted that no universal model exists. However, the Perez4, Gueymard, Muneer, and Hay models showed high performance levels, locally. The analysis performed for locations in Switzerland (Loutzenhiser et al., 2007) and Poland (Nowak and Włodarczyk, 2009) revealed that Perez4 and Muneer perform the best for E-W vertical surfaces, with Perez4 performing slightly better. The nRMSD coefficients estimated for Perez and Muneer were around 32% and 34%, respectively (Nowak and Włodarczyk, 2009). This outcome was questioned in Toledo et al., (2020) where the Muneer model turned out to be more accurate than Perez4. The reason can be attributed to the location and datasets used to test the two models: data from North America, Germany, and Singapore was used in the first, whereas data from Spain was used in the second. Moreover, the Perez4 has been parameterized with data from nine locations in the United States of America and three locations in Europe, while Muneer is parameterized with data from five locations in Europe. Models are typically characterized by better error statistics when applied to a location where data exploited for the parameterization were measured. However, these climate conditions are different from Norway, Sweden, and Finland; therefore, it is not possible to express a preference with this information.
An innovative sky-radiance model was conceptualized in Yang (2016) and then implemented by Westb and rook, (2015), but the outcomes demonstrated that Perez4 was still superior for east- or west-facing vertical surfaces. Nonetheless, significant issues such as overestimating diffuse solar radiation were reported for the Perez4 model when assessing hours with high kt due to CE or AE (Gueymard, 2017b). In fact, calculations during these hours of the day are critical for all the reviewed models, which showed systematic errors and an incapacity to simulate CE and AE effects. Therefore, exploiting empirical models which consider short time-enhancement effects are recommended. In particular, combining different transposition models as a function of the clearness index (i.e., Muneer for kt<0.85 and Gueymard for 0.85 kt) enables achieving a higher accuracy level (Gueymard, 2017a).
Appelbaum et al., (2019) proposed various enhancements to anisotropic radiance models for single rows of PV panels by neglecting sky obstructions. These corrections such as incorporating the sky VF (SVF) were applied to the KLUCHER model to account for adjacent rows and temporal deviations in Ed;circ and Ed;hor. The proposed approach is valuable for analyses performed in an urban environment characterized by an SVF lower than 0.9. The modified version of Klucher was found to be more accurate for the locations considered in the study. Similarly, Gu et al., (2020) established an optical model in which irradiance and VF are coupled for assessing single row irradiance.
Up to 26 parametric models (isotropic and anisotropic) were designed through Artificial Neural Networks (ANNs) and machine learning techniques in (de Simón-Martín et al., 2017). They developed a re-parameterized version of Perez4 based on a training dataset from Spain. Such a local version of Perez4 performed the best for East- and West-oriented facades. The outcomes prove that transposition models fitted with local data usually outperform models based on global data or data from other locations.
The literature on decomposition modelling is evolving rapidly with new innovative models being presented and more validation studies carried out. The methodology and standards used are well documented in most cases, but not consistent among the studies. New methods are frequently being developed, and an overview of recent development as well as historical works are presented in many recent review studies (Gueymard and Ruiz-Arias, 2016; Paulescu and Blaga, 2019; Starke et al., 2021; Gueymard, 2022; Yang, 2022). Up to six aspects such as the estimated value (i.e., Ebn, kd), the statistic indicators, the benchmark dataset, the data time resolution, the quality control routine, and the method of input calculations were found to be inconsistent in the validation studies. Each of these aspects reduces the scientific validity of a comparative analysis between the models. Various qualitative and quantitative performance indicators were assessed in the reviewed validation studies, making it difficult to compare the outcomes. When it comes to the decomposition models, validation studies typically provide a graphical comparison between the estimated and the measured kd values. Sometimes, the deviation of the estimated kd from the measured quantity is also plotted against the kt depending on the author’s preferences.
Conversely, almost all of the reviewed studies assessed quantitative performance indicators such as nMBD and nRMSD. However, features of the used datasets such as time interval, quality control, and model implementation are not homogeneous throughout the studies, making it difficult to compare them. A nonparametric statistical procedure, based on the sum of ranks, is presented in Stone, (1994) as a solution to the problem of ranking the overall performance of solar radiation estimation models at multiple locations. In addition, the use of large datasets is preferable since it reduces the influence of rare weather phenomena and improves the reliability of the validation process. Several studies used data collected by the Baseline Solar Radiation Network (BSRN) meteorological stations which were provided with a one-minute time step in the early 2000s with a high quality and time resolution (Gueymard and Ruiz-Arias, 2016). Nonetheless, the climate alteration due to solar cycles, human influence, and global climate change make it necessary to use only the most recent data. Authors of the reviewed studies considered data from a few years back and up to a few days before. Yang and Boland, (2019) exploited data from 2016 by providing the number of datapoints from each meteorological station, while Starke et al., (2021) stated that data after 2,000 was considered. Conversely, Bright et al., (2019) exploited datasets from the previous 5 years. To highlight inconsistency in the methodology, Table 9 illustrates the variance in inputs and outputs of three recent model validation studies, as an example.
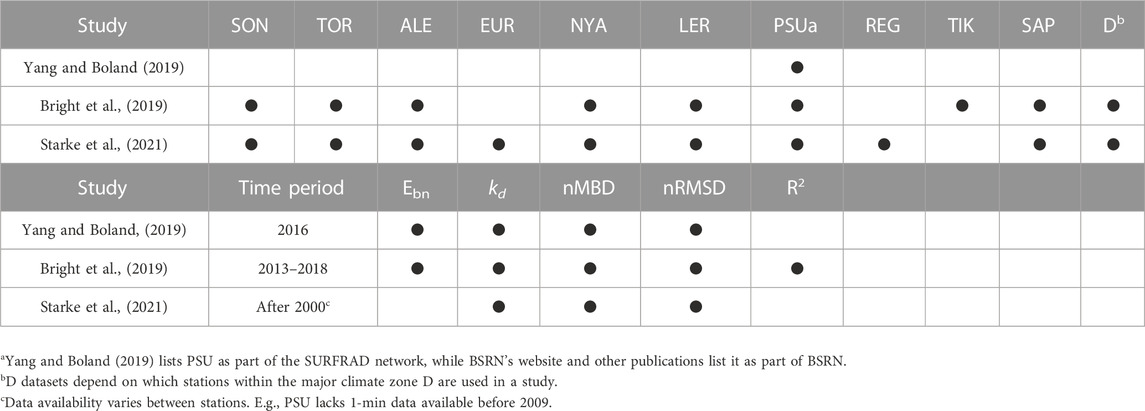
TABLE 9. List of weather stations, time period, model outputs, and statistical indicators used by Yang and Boland (2019), Starke et al. (2021), and Bright et al. (2019).
Validation studies also differ in the models exploited to predict Ebn and the kd. Eq. 1 was applied by some authors to validate the models for calculating Ebn (Gueymard and Ruiz-Arias, 2016), while some others exploited such equations to validate only kd (Starke et al., 2021) or both Ebn and kd (Paulescu and Blaga, 2019). Furthermore, the quality control routine which was applied to filter impossible or unlikely data from the datasets is not always the same. Despite the guidelines identified in (Sengupta et al., 2017), there is not one universally accepted way to perform quality control on irradiance data. In this regard, Paulescu and Blaga, (2019) replicated the dataset [D FIT 1 in (Paulescu and Blaga, 2019)] used by Gueymard and Ruiz-Arias, (2016), to validate Paulescu against the Engerer2. Also, the same quality control filters were applied to make outcomes comparable. Nonetheless, negative solar irradiance values were obtained in (Paulescu and Blaga, 2019) at the end of the quality control since Gueymard and Ruiz-Arias, (2016) manually modified data by changing all kt values greater than one to one. Finally, the calculation of model inputs differs. When estimating the kt index, the E0 is required, but some authors did not provide the E0 values (Yang and Boland, 2019), some used an equation based on the day of the year (Bright et al., 2019), and some applied a constant of either 1,366.1 W/m2 or 1,361.1 W/m2 (Gueymard and Ruiz-Arias, 2016). Such an inconsistency might represent an issue when using a model to estimate the kd based on kt values which are calculated with a different method from the one used for its training. Moreover, many models used the clear sky clearness index (ktcs) as a predictor (Engerer, 2015; Yang and Boland, 2019), which requires the use of a clear sky decomposition model. The accuracy of such all-weather models depends on the chosen clear sky model. Gueymard and Ruiz-Arias, (2016) used the Perez–Ineichen clear sky model, while Starke et al., (2021) applied Solis clear sky model. Data sources were also different: the first used Solar radiation Data (SoDa), while CAMS Reanalysis was exploited in the second. An important step towards identifying a shared methodology to validate and compare different models was done by Yang, (2022). Yang introduced a universal benchmarking dataset that permits testing the generalization ability of decomposition models. This will enable the resolving of inconsistencies about the meteorological station, the data time interval, and the quality control routine by proposing a database with data from up to 126 sites, over a 5-year period from 2016 to 2020 which result from a very stringent quality control sequence.
As observed for decomposition models, the existing literature about transposition models is characterized by some inconsistencies in the applied methodologies. In fact, there is a lack of shared protocols for the implementation of transposition models as well as in their validation. However, some methodologies such as the Taylor diagrams (Taylor, 2001) exist in the Literature that might represent a potential and effective solution to harmonize the presentation of the results from different studies and make simpler the comparison of the calculated statistical indicators. Alongside those aspects which were found to be inconsistent in decomposition modeling (i.e., the statistic indicators, the data time interval, the quality control routine, and the method of input calculations), others related to the experimental apparatus used for the validation were found to be inconsistent in transposition modeling. Validation studies differ for the geometry configuration of the tilted surface. The tilt angle as well as the orientation changed depending on the experimental setup implemented by the authors. The validation study carried out by Nassar et al., (2020) on 24 models considered only horizontal and 30° south-facing planes, while Mahachi and Rix, (2016) focused exclusively on the geometry configuration of the investigated PV plant. A wider range of orientations was assessed in Toledo et al., (2020) where vertical surfaces facing the four main cardinal points were evaluated. Similarly, Mubarak et al., (2017) presented an articulated apparatus coupling pyranometers and crystalline silicon PV devices with individual temperature sensors to monitor the Egt at various orientations (i.e., north, south, east, west, south-East, south-west) and tilt angles (from 0° to 70° with a 10° angular step). Furthermore, the experimental facility exploited in the validation of transposition models changes among the studies. Different equipment such as pyranometers or crystalline silicon PV devices were used to monitor Egt, and uncertainties from measurements were often neglected. In this regard, applying the quality standards defined by the World Meteorological Organization and the National Renewable Energy Laboratory (Sengupta et al., 2021) for the measuring instruments could enhance the accuracy of the datasets and ease the comparison of results from different studies.
Even though the decomposition models require many inputs, the kt is commonly used since it can be measured. Alongside this, other parameters are used such as θz, V, and AM which are deterministic and can be easily calculated. In particular, the θz and the AM can be calculated from dataset timestamps, while the V is typically determined from a moving window of the kt values. As observed in Engerer2, decomposition models are usually comprised of a single function which makes them easy to implement in the Python environment. In this regard, the pvlib-python consists of a library of decomposition model implementations and supporting functions which can be used to calculate model parameters such as apparent solar time (AST), θz, and AM. This Python library is continuously developed and maintained and can be edited, so that new models can be implemented. Moreover, the kt can be used to combine different decomposition models by either choosing the output of a single model depending on the kt, or by summing the weighted outputs of multiple models, where the weight of each model depends again on the kt. Different approaches exist, and combining models is still a developing topic. Exploiting a combination of decomposition models which are defined through ANNs and machine learning-based models depending on the kt and time of year is also a solution. Model parameters can be re-fitted for local datasets to produce location tailored models. Major issues currently concern data availability and data quality-control routines. These have yet to be sufficiently discussed in the literature although this would improve the comparability of outcomes from different validation studies. Recent models such as the one presented in Starke et al., (2021) use data from the last two decades to calculate model parameters. Using as much data as possible for creating a model typically increases its accuracy, but since weather patterns and global temperature are changing, measurements from the early 2000s may not be representative of current climates. Climate change is also a threat to old models, as their accuracy is assumed to decrease for the climate they are intended to be used in, which means new studies will be required to assess their performance (Table 10). In fact, modifications of the atmosphere composition can alter the scattering phenomena of sunrays or cloud properties, by reducing the model capability to simulate such events. When it comes to a quality control routine, there are several methods which are documented in the literature for solar irradiance applications (Muneer et al., 2007; Lee et al., 2013). Nonetheless, all of them undergo the same limitations (Urraca et al., 2020). Solar irradiance can significantly change with cloud cover; therefore, all these methods cannot detect low magnitude measuring errors such as shadows, calibration drifts, soiling, and snow accumulation. The six-step quality control procedure which was proposed in Yang et al., (2018) for the BSRN data might represent best practice in this topic. The study concluded that measurements of Egh, Ebn, and Edh are needed to ensure reasonably good quality control. Otherwise, satellite-derived irradiance should be used to contrast the on-site irradiance measurements.
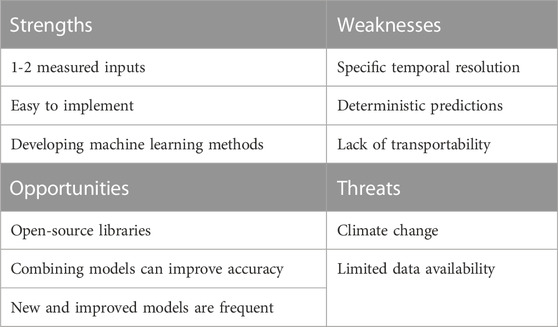
TABLE 10. SWOT analysis of decomposition modeling.
Empirical transposition models are usually less user-friendly than decomposition models. The pvlib-python tool includes the most common transposition models by allowing model chains to be built in Python. It is worth highlighting that transposition models such as Perez4 struggle with the hours of the day characterized by low solar elevation angles, making uncertainties high when the power production of the E-W VBPV system peaks. This issue is not addressed in the literature, as almost all the validation studies exclude the hours of low solar elevation (Table 11).
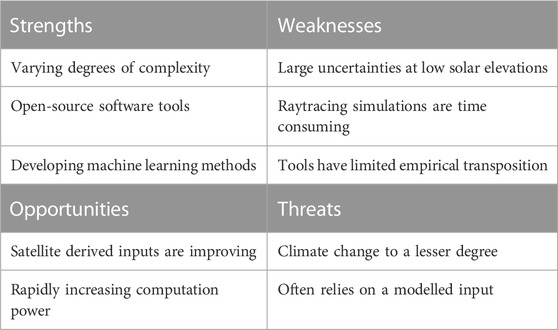
TABLE 11. SWOT analysis of transposition modeling.
As mentioned in the above paragraph for decomposition models, numerous approaches exist that enable combining different transposition models to increase the model accuracy. Furthermore, machine learning-based methods can contribute to ANN-created transposition models and have shown improvements over empirical transposition models due to lower computation times (faster routines and faster hardware).
The main literature gaps that were found in this review study are highlighted in this section. Firstly, the difference in temporal resolution of data between decomposition and transposition models is addressed. The former can provide one-minute estimations and validations, while the latter usually deals with hourly predictions which is also the same time resolution used when assessing PV energy production. Indeed, PV simulations tools aim to estimate the economic prospects of different system configurations, and if the system is contracted with a set price per kWh electricity produced, the hourly or sub hourly mismatch between production and load profiles is not a factor in the calculations. For this study, however, the penetration potential of E-W VBPV systems is investigated at a sub-hour temporal resolution for more accurate results enabling user to account for CE and AE effects.
Secondly, the numerical models implemented for assessing BPV systems mainly focuses on south-oriented cells with a tilt angle that can range between 30° and 45°. In such optimally exposed configurations, the diffuse fraction of solar radiation and the solar radiation reflected by the ground play a secondary role. Conversely, these factors are relevant in E-W VBPV, particularly when simulating solar irradiation with low Sun elevation angles (i.e., significant contribution from horizontal brightening). Being the reviewed models mostly empirical, their performances can reasonably worsen when applied to conditions different from the one considered for the model parametrization. Therefore, the use of models particularly accurate in the estimation of the horizontal brightening as well as with the ground albedo as input parameter should be recommended for E-W VBPV systems. Among the reviewed models, the transposition model from Olmo et al., (1999) is the only having the ground albedo as an input. Despite of this, whether higher or lower accuracy is expected is difficult to say a priori, and it has to be demonstrated through a comparison of different combinations of decomposition and transposition models.
Thirdly, there is an evident gap with high-latitude conditions. Decomposition models are mostly parametrized with datasets from climate zones which are not representative of the territories of Norway, Sweden, and Finland. In particular, only one weather station was considered from the Dfc climate in Gueymard and Ruiz-Arias, (2016), and none in Yang, (2022) by making it difficult to univocally identify an accurate model chain to be exploited in these countries. In this regard, additional efforts are needed to collect data from these countries as well as to perform experimental validations which can contribute to identify room for improvement of decomposition and transposition models. For example, a decomposition model developed for mostly clear sky locations will probably fail in accurately estimating kd in locations mostly characterized by overcast sky conditions. Similarly, a transposition model which cannot estimate properly the scattering of sunrays near the horizon will luckily provide estimations of Egt with low accuracy in a location where the Sun is low in the sky for most of the time.
The evaluation of decomposition models based on outcomes from Gueymard and Ruiz-Arias, (2016) and Yang, (2022) focused on a performance average over all stations in the same climate zone of Norway, Sweden, and Finland, and performance was not assessed in a specific station from the Dfc zone. A more detailed investigation may have revealed the potential of additional decomposition models for high-latitude locations.
The data provided as Supplementary Material from Gueymard and Ruiz-Arias, (2016) and Yang, (2022) usually do not include daily or monthly or seasonal error statistics since the results are averaged over the full time period of the dataset. A one-minute dataset for each station including irradiance measurements and model estimations is provided by Starke et al., (2021). However, such results are only available for the models presented in the publication and it is not possible to conduct an inter-comparison of seasonal model performance. Following this, it has not been possible to assess how the performance of decomposition or transposition models varies with clearness index kt, which is required for a discussion on how multiple models can be combined to reduce the overall uncertainty of the decomposition step in the modeling chain.
Finally, ensemble model output statistics such as the one described in Yang and Gueymard, (2020) were excluded from the comparative analysis presented in this work, although they seem to be promising. The authors preferred to limit the field of investigation to individual decomposition models and their match with transposition models within the model chain. The potential for combining various decomposition models to assess solar radiation in high-latitude locations is worth exploring in specific validation work. Note also that the ensemble model output statistics from Yang and Gueymard, (2020) was found to outperform some reliable stand-alone models such as Yang2 and Engerer2.
This systematic review investigated the solar irradiance model chain for horizontal-to-tilted irradiance conversion at high-latitude locations. Although a considerable number of publications exist on this topic, it is a scarcity of examples in the literature about the use of decomposition models at these latitudes. Moving from Gueymard and Ruiz-Arias, (2016) and Yang, (2022), a list of decomposition models suitable for high-latitude locations was provided. Moreover, validation studies concerning transposition models were reviewed based on the aim to identify transposition models which can be used in the model chain for estimating Egt on E-W VBPV.
This work demonstrates that validation studies lack in terms of their inter-comparability and relevance to E-W VBPV in Norway, Sweden, and Finland. The major issues are the variety in the applied methodologies in recent decomposition model validation studies, the lack of validation studies for empirical transposition models for E-W VBPV, and the absence of one-minute transposition models. While the newest decomposition models (i.e., Yang4, Engerer4, Starke21) show promising results, more data and climate-specific validation of these models are required. The development of a common and shared validation protocol should be prioritized to ease the inter-comparison of the numerous decomposition models. Such a gap has been partially covered by the recent work from Yang, (2022). Regarding transposition models, the Perez4 was found to locally perform best for E-W oriented surfaces and vertically mounted surfaces, but it is preferable to combine different transposition models depending on the kt.
The main findings from the present review can be summarized as follows:
• Skartveit1 and Mondol1 are the most effective one-hour model at high latitudes, although they are outperformed by Spencer in the E zone;
• Yang4 is the best one-minute model followed by the Starke family model which represents an effective solution particularly when applied to C and D zones;
• Perez4 and Muneer transposition models perform best for East- and West-facing vertical surfaces;
• Hour time resolution is mostly adopted in transposition models, while decomposition models can already perform one-minute analyses;
• A validated model chain for Egt estimation on E-W VBPV in Norway, Sweden, and Finland was not found in the literature.
Therefore, the model chain resulting from the matching of Yang4 and Perez4 models could be recommended for performing one-minute analysis of E-W VBPV at high-latitude locations. Nonetheless, further insight into the best model choice for optical modelling is necessary. This includes:
• Validating the best performing decomposition models (see Table 5) with data from Norway, Sweden, and Finland by assessing decomposition model performance both on a seasonal level, and as a function of kt;
• Evaluating how well the model validation with other D-type climate zone data works for Dfc-zone;
• Validating transposition models with irradiance measurements from an E-W VBPV system;
• Assessing the potential of novel methods within the field such as ANN and probabilistic models.
MM, MDS, and GL contributed to conception and design of the study. MM and JT organized the database. MM and JT performed the statistical analysis. MM and JT wrote the first draft of the manuscript. SJ and KM wrote sections of the manuscript. All authors contributed to the article and approved the submitted version.
The authors acknowledge the financial support from the Norwegian Research Council (research project FRIPRO-FRINATEK No. 324243 HELIOS), the Finnish Cultural Foundation, and Emil Aaltonen Foundation.
The authors declare that the research was conducted in the absence of any commercial or financial relationships that could be construed as a potential conflict of interest.
All claims expressed in this article are solely those of the authors and do not necessarily represent those of their affiliated organizations, or those of the publisher, the editors and the reviewers. Any product that may be evaluated in this article, or claim that may be made by its manufacturer, is not guaranteed or endorsed by the publisher.
Abreu, E. F. M., Canhoto, P., and Costa, M. J. (2019). Prediction of diffuse horizontal irradiance using a new climate zone model. Renew. Sustain Energy Rev. 110, 28–42. doi:10.1016/J.RSER.2019.04.055
Al-Riahi, M., Al-Hamdani, N., and Tahir, K. (1992). An empirical method for estimation of hourly diffuse fraction of global radiation. Renew. Energy 2, 451–456. doi:10.1016/0960-1481(92)90079-I
Appelbaum, J., Massalha, Y., and Aronescu, A. (2019). Corrections to anisotropic diffuse radiation model. Sol. Energy 193, 523–528. doi:10.1016/J.SOLENER.2019.09.090
Ascencio-Vásquez, J., Bevc, J., Reba, K., Brecl, K., Jankovec, M., and Topič, M. (2020). Advanced PV performance modelling based on different levels of irradiance data accuracy. Energies 13, 2166. doi:10.3390/en13092166
Babar, B., Luppino, L. T., Boström, T., and Anfinsen, S. N. (2020). Random forest regression for improved mapping of solar irradiance at high latitudes. Sol. Energy 198, 81–92. doi:10.1016/J.SOLENER.2020.01.034
Badescu, V. (2002). 3D isotropic approximation for solar diffuse irradiance on tilted surfaces. Renew. Energy 26, 221–233. doi:10.1016/S0960-1481(01)00123-9
Bakhsh, H., Srinivasan, R., and Bahel, V. (1985). Correlation between hourly diffuse and global radiation for Dhahran, Saudi Arabia. Sol. Wind Technol. 2, 59–61. doi:10.1016/0741-983X(85)90027-X
Beck, H. E., Zimmermann, N. E., McVicar, T. R., Vergopolan, N., Berg, A., and Wood, E. F. (2018). Present and future Köppen-Geiger climate classification maps at 1-km resolution. Sci. Data 5, 180214. doi:10.1038/sdata.2018.214
Berrian, D., and Libal, J. A comparison of ray tracing and view factor simulations of locally resolved rear irradiance with the experimental values. Prog. Photovoltaics Res. Appl. 2020;28:609–620. doi:10.1002/pip.3261
Blanc, P., and Wald, L. (2012). The SG2 algorithm for a fast and accurate computation of the position of the Sun for multi-decadal time period. Sol. Energy 86, 3072–3083. doi:10.1016/J.SOLENER.2012.07.018
Boland, J., Huang, J., and Ridley, B. (2013). Decomposing global solar radiation into its direct and diffuse components. Renew. Sustain Energy Rev. 28, 749–756. doi:10.1016/j.rser.2013.08.023
Boland, J., Ridley, B., and Brown, B. (2008). Models of diffuse solar radiation. Renew. Energy 33, 575–584. doi:10.1016/j.renene.2007.04.012
Boland, J., Scott, L., and Luther, M. (2001). Modelling the diffuse fraction of global solar radiation on a horizontal surface. Environmetrics 12, 103–116. doi:10.1002/1099-095X(200103)12:2<103:AID-ENV447>3.0.CO;2-2
Bright, J. M., and Engerer, N. A. (2019). Engerer2: global re-parameterisation, update, and validation of an irradiance separation model at different temporal resolutions. J. Renew. Sustain Energy 11, 33701. doi:10.1063/1.5097014
Brunger, A. P., and Hooper, F. C. (1993). Anisotropic sky radiance model based on narrow field of view measurements of shortwave radiance. Sol. Energy 51, 53–64. doi:10.1016/0038-092X(93)90042-M
Bruno, R. (1978). A correction procedure for separating direct and diffuse insolation on a horizontal surface. Sol. Energy 20, 97–100. doi:10.1016/0038-092X(78)90148-2
Bugler, J. W. (1977). The determination of hourly insolation on an inclined plane using a diffuse irradiance model based on hourly measured global horizontal insolation. Sol. Energy 19, 477–491. doi:10.1016/0038-092X(77)90103-7
Calvin, H. C., and Wr, M. (2012). Solar cells: from basics to advanced systems. https://nanohub.org/resources/13141.
Celik, A. N., and Muneer, T. (2013). Neural network based method for conversion of solar radiation data. Energy Convers. Manag. 67, 117–124. doi:10.1016/j.enconman.2012.11.010
Chandrasekaran, J., and Kumar, S. (1994). Hourly diffuse fraction correlation at a tropical location. Sol. Energy 53, 505–510. doi:10.1016/0038-092X(94)90130-T
Chendo, M. A. C., and Maduekwe, A. A. L. (1994). Hourly global and diffuse radiation of Lagos, Nigeria-Correlation with some atmospheric parameters. Sol. Energy 52, 247–251. doi:10.1016/0038-092X(94)90491-X
Chikh, M., Mahrane, A., and Haddadi, M. (2012). Modeling the diffuse part of the global solar radiation in Algeria. Energy Procedia 18, 1068–1075. doi:10.1016/j.egypro.2012.05.121
De Miguel, A., Bilbao, J., Aguiar, R., Kambezidis, H., and Negro, E. (2001). Diffuse solar irradiation model evaluation in the North Mediterranean Belt area. Sol. Energy 70, 143–153. doi:10.1016/S0038-092X(00)00135-3
de Simón-Martín, M., Alonso-Tristán, C., and Díez-Mediavilla, M. (2017). Diffuse solar irradiance estimation on building’s façades: review, classification and benchmarking of 30 models under all sky conditions. Renew. Sustain Energy Rev. 77, 783–802. doi:10.1016/J.RSER.2017.04.034
Elminir, H. K., Azzam, Y. A., and Younes, F. I. (2007). Prediction of hourly and daily diffuse fraction using neural network, as compared to linear regression models. Energy 32, 1513–1523. doi:10.1016/j.energy.2006.10.010
Engerer, N. A. (2015). Minute resolution estimates of the diffuse fraction of global irradiance for southeastern Australia. Sol. Energy 116, 215–237. doi:10.1016/j.solener.2015.04.012
Erbs, D. G., Klein, S. A., and Duffie, J. A. (1982). Estimation of the diffuse radiation fraction for hourly, daily and monthly-average global radiation. Sol. Energy 28, 293–302. doi:10.1016/0038-092X(82)90302-4
Erusiafe, N. E., and Chendo, M. A. (2014). Estimating diffuse solar radiation from global solar radiation. Aix-Les-Bains, France: EuroSun. doi:10.18086/eurosun.2014.08.05
Every, J. P., Li, L., and Dorrell, D. G. (2020). Köppen-Geiger climate classification adjustment of the BRL diffuse irradiation model for Australian locations. Renew. Energy 147, 2453–2469. doi:10.1016/J.RENENE.2019.09.114
Evseev, E. G., and Kudish, A. I. (2009). An assessment of a revised Olmo et al. model to predict solar global radiation on a tilted surface at Beer Sheva, Israel. Renew. Energy 34, 112–119. doi:10.1016/j.renene.2008.04.012
Furlan, C., and de Oliveira, A. P. (2008). Hourly diffuse solar radiation in the presence of clouds and other environmental parameters. São Paulo, Brazil: Univ Padua.
Gielen, D., Boshell, F., Saygin, D., Bazilian, M. D., Wagner, N., and Gorini, R. (2019). The role of renewable energy in the global energy transformation. Energy Strateg. Rev. 24, 38–50. doi:10.1016/J.ESR.2019.01.006
González, J. A., and Calbó, J. (1999). Influence of the global radiation variability on the hourly diffuse fraction correlations. Sol. Energy 65, 119–131. doi:10.1016/S0038-092X(98)00121-2
Gu, W., Ma, T., Li, M., Shen, L., and Zhang, Y. (2020). A coupled optical-electrical-thermal model of the bifacial photovoltaic module. Appl. Energy 258, 114075. doi:10.1016/J.APENERGY.2019.114075
Gueymard, C. (1987). An anisotropic solar irradiance model for tilted surfaces and its comparison with selected engineering algorithms. Sol. Energy 38, 367–386. doi:10.1016/0038-092X(87)90009-0
Gueymard, C. A. (2018). A reevaluation of the solar constant based on a 42-year total solar irradiance time series and a reconciliation of spaceborne observations. Sol. Energy 168, 2–9. doi:10.1016/J.SOLENER.2018.04.001
Gueymard, C. A. (2017a). Cloud and albedo enhancement impacts on solar irradiance using high-frequency measurements from thermopile and photodiode radiometers. Part 1: impacts on global horizontal irradiance. Sol. Energy 153, 755–765. doi:10.1016/J.SOLENER.2017.05.004
Gueymard, C. A. (2017b). Cloud and albedo enhancement impacts on solar irradiance using high-frequency measurements from thermopile and photodiode radiometers. Part 2: performance of separation and transposition models for global tilted irradiance. Sol. Energy 153, 766–779. doi:10.1016/J.SOLENER.2017.04.068
Gueymard, C. A. (2009). Direct and indirect uncertainties in the prediction of tilted irradiance for solar engineering applications. Sol. Energy 83, 432–444. doi:10.1016/j.solener.2008.11.004
Gueymard, C. A., and Ruiz-Arias, J. A. (2016). Extensive worldwide validation and climate sensitivity analysis of direct irradiance predictions from 1-min global irradiance. Pergamon 128, 1–30. doi:10.1016/j.solener.2015.10.010
Gueymard, C. A. (2022). Solar radiation resource: measurement, modeling, and methods. Compr. Renew. Energy, 176–212. doi:10.1016/B978-0-12-819727-1.00101-1
Guo, S., Walsh, T. M., and Peters, M. (2013). Vertically mounted bifacial photovoltaic modules: A global analysis. Energy 61, 447–454. doi:10.1016/J.ENERGY.2013.08.040
Hansen, C. W., Stein, J. S., Deline, C., MacAlpine, S., Marion, B., Asgharzadeh, A., et al. Analysis of irradiance models for bifacial PV modules. Proceedings of the 2016 IEEE 43rd photovolt. Spec. Conf., Portland, Oregon, June 2016, p. 138–143. doi:10.1109/PVSC.2016.7749564
Hassan, M. A., Akoush, B. M., Abubakr, M., Campana, P. E., and Khalil, A. (2021). High-resolution estimates of diffuse fraction based on dynamic definitions of sky conditions. Renew. Energy 169, 641–659. doi:10.1016/J.RENENE.2021.01.066
Hawlader, M. N. (1984). Diffuse, global and extra-terrestrial solar radiation for Singapore. Int. J. Ambient. Energy 5, 31–38. doi:10.1080/01430750.1984.9675406
Hay, J. E. (1976). A revised method for determining the direct and diffuse components of the total short-wave radiation. Atmos. (Basel) 14, 278–287. doi:10.1080/00046973.1976.9648423
Hay, J. E. (1993). Calculating solar radiation for inclined surfaces: practical approaches. Renew. Energy 3, 373–380. doi:10.1016/0960-1481(93)90104-O
Hay, J. E., and McKay, D. C. (1985). Estimating solar irradiance on inclined surfaces: A review and assessment of methodologies. Int. J. Sol. Energy 3, 203–240. doi:10.1080/01425918508914395
Helbig, N., Löwe, H., Mayer, B., and Lehning, M. (2010). Explicit validation of a surface shortwave radiation balance model over snow-covered complex terrain. J. Geophys Res. Atmos. 115, D18113. doi:10.1029/2010JD013970
Hijazin, M. I. (1998). The diffuse fraction of hourly solar radiation for Amman/Jordan. Renew. Energy 13, 249–253. doi:10.1016/S0960-1481(97)00082-7
Hofmann, M., and Seckmeyer, G. (2017b). A new model for estimating the diffuse fraction of solar irradiance for photovoltaic system simulations. Energies 10, 248. doi:10.3390/en10020248
Hofmann, M., and Seckmeyer, G. (2017a). Influence of various irradiance models and their combination on simulation results of photovoltaic systems. Energies 10, 1495. doi:10.3390/en10101495
Hollands, K. G. T. (1985). A derivation of the diffuse fraction’s dependence on the clearness index. Sol. Energy 35, 131–136. doi:10.1016/0038-092X(85)90003-9
Holmgren, W. F., Hansen, C. W., and Mikofski, M. A. (2018). PVlib Python: A Python package for modeling solar energy systems. J. Open Source Softw. 3, 884. doi:10.21105/joss.00884
Hooper, F. C., and Brunger, A. P. (1980). A model for the angular distribution of sky radiance. J. Sol. Energy Eng. Trans. ASME 102, 196–202. doi:10.1115/1.3266154
Igawa, N., Koga, Y., Matsuzawa, T., and Nakamura, H. (2004). Models of sky radiance distribution and sky luminance distribution. Sol. Energy 77, 137–157. doi:10.1016/j.solener.2004.04.016
Inman, R. H., Chu, Y., and Coimbra, C. F. M. (2016). Cloud enhancement of global horizontal irradiance in California and Hawaii. Sol. Energy 130, 128–138. doi:10.1016/J.SOLENER.2016.02.011
International Energy Agency (2022). IEA statistics: explore energy data by category, indicator, country or region. https://www.iea.org/data-and-statistics/data-browser?country=WORLD& fuel=Energy%5C supply&indicator=TESbySource (Accessed March 22, 2022).
International Energy Agency (2021). World energy outlook 2021. Paris, France: OECD. doi:10.1787/14fcb638-en
Jacovides, C. P., Tymvios, F. S., Assimakopoulos, V. D., and Kaltsounides, N. A. (2006). Comparative study of various correlations in estimating hourly diffuse fraction of global solar radiation. Renew. Energy 31, 2492–2504. doi:10.1016/j.renene.2005.11.009
Janjai, S., Phaprom, P., Wattan, R., and Masiri, I. Statistical models for estimating hourly diffuse solar radiation in different regions of Thailand. Proc. Int. Conf. Energy sustain. Dev. Issues strateg. (ESD 2010), Chiang Mai, Thailand, June 2010, p. 1–6. doi:10.1109/ESD.2010.5598771
Jeter, S. M., and Balaras, C. A. (1986). A regression model for the beam transmittance of the atmosphere based on data for Shenandoah, Georgia, U.S.A. U.S.A. Sol. Energy 37, 7–14. doi:10.1016/0038-092X(86)90101-5
Jouttijärvi, S., Lobaccaro, G., Kamppinen, A., and Miettunen, K. (2022). Benefits of bifacial solar cells combined with low voltage power grids at high latitudes. Renew. Sustain Energy Rev. 161, 112354. doi:10.1016/J.RSER.2022.112354
Karatasou, S., Santamouris, M., and Geros, V. (2003). Analysis of experimental data on diffuse solar radiation in Athens, Greece, for building applications. Int. J. Sustain Energy 23, 1–11. doi:10.1080/0142591031000148597
Khan, M. R., Hanna, A., Sun, X., and Alam, M. A. (2017). Vertical bifacial solar farms: physics, design, and global optimization. Appl. Energy 206, 240–248. doi:10.1016/J.APENERGY.2017.08.042
Klucher, T. M. (1979). Evaluation of models to predict insolation on tilted surfaces. Sol. Energy 23, 111–114. doi:10.1016/0038-092X(79)90110-5
Köppen, W. (1900). Versuch einer Klassifikation der Klimate, vorzugsweise nach ihren Beziehungen zur Pflanzenwelt. Geogr. Z 6, 593–611.
Koronakis, P. S. (1986). On the choice of the angle of tilt for south facing solar collectors in the Athens basin area. Sol. Energy 36, 217–225. doi:10.1016/0038-092X(86)90137-4
Kuo, C. W., Chang, W. C., and Chang, K. C. (2014). Modeling the hourly solar diffuse fraction in Taiwan. Renew. Energy 66, 56–61. doi:10.1016/j.renene.2013.11.072
Lam, J. C., and Li, D. H. W. (1996). Correlation between global solar radiation and its direct and diffuse components. Build. Environ. 31, 527–535. doi:10.1016/0360-1323(96)00026-1
Lauret, P., Boland, J., and Ridley, B. (2013). Bayesian statistical analysis applied to solar radiation modelling. Renew. Energy 49, 124–127. doi:10.1016/j.renene.2012.01.049
Lee, K., Yoo, H., and Levermore, G. J. (2013). Quality control and estimation hourly solar irradiation on inclined surfaces in South Korea. Renew. Energy 57, 190–199. doi:10.1016/j.renene.2013.01.028
Li, D. H. W., and Lam, J. C. (2001). Analysis of solar heat gain factors using sky clearness index and energy implications. Energy Convers. Manag. 42, 555–571. doi:10.1016/S0196-8904(00)00082-0
Li, M., Liao, Z., and Coimbra, C. F. M. (2020). Spectral solar irradiance on inclined surfaces: A fast Monte Carlo approach. J. Renew. Sustain Energy 12, 53705. doi:10.1063/5.0011635
Li, Z., Xing, H., Zeng, S., Zhao, J., and Wang, T. (2017). Comparison of Anisotropic Diffuse Sky Radiance Models for Irradiance Estimation on Building Facades. Procedia Eng. 205, 779–786. doi:10.1016/J.PROENG.2017.10.010
Liu, B. L., and Jordan, R. (1961). Daily insolation on surfaces tilted towards equator. Washington, D.C., USA: United States Department of Energy.
Liu, W., Guan, H., Gutiérrez-Jurado, H. A., Banks, E. W., He, X., and Zhang, X. (2022). Modelling quasi-three-dimensional distribution of solar irradiance on complex terrain. Environ. Model Softw. 149, 105293. doi:10.1016/j.envsoft.2021.105293
López, G., Rubio, M. A., and Batlles, F. J. (2000). Estimation of hourly direct normal from measured global solar irradiance in Spain. Renew. Energy 21, 175–186. doi:10.1016/S0960-1481(99)00121-4
Louche, A., Notton, G., Poggi, P., and Simonnot, G. (1991). Correlations for direct normal and global horizontal irradiation on a French Mediterranean site. Sol. Energy 46, 261–266. doi:10.1016/0038-092X(91)90072-5
Loutzenhiser, P. G., Manz, H., Felsmann, C., Strachan, P. A., Frank, T., and Maxwell, G. M. (2007). Empirical validation of models to compute solar irradiance on inclined surfaces for building energy simulation. Sol. Energy 81, 254–267. doi:10.1016/j.solener.2006.03.009
Macagnan, M. H., Lorenzo, E., and Jimenez, C. (1994). Solar radiation in madrid. Int. J. Sol. Energy 16, 1–14. doi:10.1080/01425919408914262
Maduekwe, A. A. L., and Chendo, M. A. C. (1997). Atmospheric turbidity and the diffuse irradiance in Lagos, Nigeria. Sol. Energy 61, 241–249. doi:10.1016/S0038-092X(97)00020-0
Magarreiro, C., Brito, M. C., and Soares, P. M. M. (2014). Assessment of diffuse radiation models for cloudy atmospheric conditions in the Azores region. Sol. Energy 108, 538–547. doi:10.1016/j.solener.2014.08.003
Mahachi, T., and Rix, A. J. Evaluation of irradiance decomposition and transposition models for a region in South Africa Investigating the sensitivity of various diffuse radiation models. Proceedings of the IECON 2016 - 42nd annu. Conf. IEEE ind. Electron. Soc., Berlin, Germany, October 2016, p. 3064–3069. doi:10.1109/IECON.2016.7793897
Manni, M., Bonamente, E., Lobaccaro, G., Goia, F., Nicolini, A., Bozonnet, E., et al. (2020). Development and validation of a Monte Carlo-based numerical model for solar analyses in urban canyon configurations. Build. Environ. 170, 106638. doi:10.1016/J.BUILDENV.2019.106638
Manni, M., and Nicolini, A. (2022). Multi-Objective Optimization Models to Design a Responsive Built Environment: A Synthetic Review. Energies 15, 486. doi:10.3390/en15020486
Manni, M., Nocente, A., Bellmann, M., and Lobaccaro, G. (2023). Multi-Stage Validation of a Solar Irradiance Model Chain: an application at high latitudes. Sustainability 15, 2938. doi:10.3390/su15042938
Maxwell, E. L. (1987). A quasi-physical model for converting hourly global horizontal to direct normal insolation. Golden, CO, USA: National Renewable Energy Laboratory.
Michalsky, J. J. (1988). The Astronomical Almanac’s algorithm for approximate solar position (1950-2050). Sol. Energy 40, 227–235. doi:10.1016/0038-092X(88)90045-X
Mondol, J. D., Yohanis, Y. G., Smyth, M., and Norton, B. (2005). Long-term validated simulation of a building integrated photovoltaic system. Sol. Energy 78, 163–176. doi:10.1016/j.solener.2004.04.021
Mondol, J. D., Yohanis, Y. G., and Norton, B. (2008). Solar radiation modelling for the simulation of photovoltaic systems. Renew. Energy 33, 1109–1120. doi:10.1016/j.renene.2007.06.005
Mubarak, R., Hofmann, M., Riechelmann, S., and Seckmeyer, G. (2017). Comparison of Modelled and Measured Tilted Solar Irradiance for Photovoltaic Applications. Energies 10, 1688. doi:10.3390/en10111688
Muneer Kambezidis, H. T. (1997). Solar radiation and daylight models for the energy efficient design of buildings. Oxford; Boston: Architectural Press.
Muneer, T., Hawas, M. M., and Sahili, K. (1984). Correlation between hourly diffuse and global radiation for New Delhi. Energy Convers. Manag. 24, 265–267. doi:10.1016/0196-8904(84)90004-9
Muneer, T., and Saluja, G. S. (1986). Correlation between hourly diffuse and global solar irradiation for the UK. Build. Serv. Eng. Res. Technol. 7, 37–43. doi:10.1177/014362448600700106
Muneer, T., Younes, S., and Munawwar, S. (2007). Discourses on solar radiation modeling. Renew. Sustain Energy Rev. 11, 551–602. doi:10.1016/j.rser.2005.05.006
Muneer, T. (1990). Solar radiation model for Europe. Build. Serv. Eng. Res. Technol. 11, 153–163. doi:10.1177/014362449001100405
National Renewable Energy Laboratory (2014). NREL solar position algorithm. https://midcdmz.nrel.gov/spa/ (Accessed March 22, 2022).
Nassar, Y. F., Hafez, A. A., and Alsadi, S. Y. (2020). Multi-Factorial Comparison for 24 Distinct Transposition Models for Inclined Surface Solar Irradiance Computation in the State of Palestine: A Case Study. Front. Energy Res. 7. doi:10.3389/fenrg.2019.00163
Negi, B. S., Bhowmik, N. C., Mathur, S. S., and Kandpal, T. C. (1986). Ray trace evaluation of solar concentrators including limb darkening effects. Sol. Energy 36, 293–296. doi:10.1016/0038-092X(86)90145-3
Nowak, H., and Włodarczyk, D. (2009). Statistical analysis of solar radiation models onto inclined planes for climatic conditions of Lower Silesia in Poland. Archives Civ. Mech. Eng. 9, 127–144. doi:10.1016/s1644-9665(12)60064-8
Oliveira, A. P., Escobedo, J. F., Machado, A. J., and Soares, J. (2002). Correlation models of diffuse solar-radiation applied to the city of São Paulo, Brazil. Appl. Energy 71, 59–73. doi:10.1016/S0306-2619(01)00040-X
Olmo, F. J., Vida, J., Foyo, I., Castro-Diez, Y., and Alados-Arboledas, L. (1999). Prediction of global irradiance on inclined surfaces from horizontal global irradiance. Energy 24, 689–704. doi:10.1016/S0360-5442(99)00025-0
Orgill, J. F., and Hollands, K. G. T. (1977). Correlation equation for hourly diffuse radiation on a horizontal surface. Sol. Energy 19, 357–359. doi:10.1016/0038-092X(77)90006-8
Oumbe, A., Qu, Z., Blanc, P., Bru, H., and Wald, L. (2012). An adaptive method to derive direct irradiance from global irradiance. Freiburg, Germany: SolarPACES.
Pagola, Í., Gastón, M., Fernández-Peruchena, C. M., Torres, J. L., Silva, M., and Ramírez, L. Comparison and fitting of several Global-to\_beam irradiance models in Spain. Proceedings of the 15th SolarPACES conf., Berlin, Germany: September 2009, p. 11724
Paulescu, E., and Blaga, R. (2019). A simple and reliable empirical model with two predictors for estimating 1-minute diffuse fraction. Sol. Energy 180, 75–84. doi:10.1016/J.SOLENER.2019.01.029
Peel, M. C., Finlayson, B. L., and McMahon, T. A. (2007). Updated world map of the Köppen-Geiger climate classification. Hydrol. Earth Syst. Sci. 11, 1633–1644. doi:10.5194/hess-11-1633-2007
Perez, R., Ineichen, P., Maxwell, E. L., Seals, R. D., and Zelenka, A. (1992). Dynamic global-to-direct irradiance conversion models. ASHRAE Trans. 98, 354–369.
Perez, R., Ineichen, P., Moore, K., Kmiecik, M., Chain, C., George, R., et al. (2002). A new operational model for satellite-derived irradiances: description and validation. Sol. Energy 73, 307–317. doi:10.1016/S0038-092X(02)00122-6
Perez, R., Ineichen, P., Seals, R., Michalsky, J., and Stewart, R. (1990b). Modeling daylight availability and irradiance components from direct and global irradiance. Sol. Energy 44, 271–289. doi:10.1016/0038-092X(90)90055-H
Perez, R., Ineichen, P., Seals, R., Michalsky, J., and Stewart, R. (1990c). Modeling daylight availability and irradiance components from direct and global irradiance. Sol. Energy 44, 271–289. doi:10.1016/0038-092X(90)90055-H
Perez, R., Seals, R., Ineichen, P., Stewart, R., and Menicucci, D. (1987a). A new simplified version of the perez diffuse irradiance model for tilted surfaces. Sol. Energy 39, 221–231. doi:10.1016/S0038-092X(87)80031-2
Perez, R., Seals, R., Ineichen, P., Stewart, R., and Menicucci, D. (1987b). A new simplified version of the perez diffuse irradiance model for tilted surfaces. Sol. Energy 39, 221–231. doi:10.1016/S0038-092X(87)80031-2
Perez, R., Seals, R., Zelenka, A., and Ineichen, P. (1990a). Climatic evaluation of models that predict hourly direct irradiance from hourly global irradiance: prospects for performance improvements. Sol. Energy 44, 99–108. doi:10.1016/0038-092X(90)90071-J
Perez, R., Stewart, R., Arbogast, C., Seals, R., and Scott, J. (1986). An anisotropic hourly diffuse radiation model for sloping surfaces: description, performance validation, site dependency evaluation. Sol. Energy 36, 481–497. doi:10.1016/0038-092X(86)90013-7
Perez, R., Stewart, R., Seals, R., and Guertin, T. (1988). The development and verification of the Perez diffuse radiation model. Albuquerque, New Mexico: Sandia Nabanal Laboratortes. doi:10.2172/7024029
Pérez-Burgos, A., Bilbao, J., De Miguel, A., and Román, R. (2014). Analysis of Solar Direct Irradiance in Spain. Energy Procedia 57, 1070–1076. doi:10.1016/J.EGYPRO.2014.10.070
Pierce, B. G., Braid, J. L., Stein, J. S., Augustyn, J., and Riley, D. (2022). Solar Transposition Modeling via Deep Neural Networks With Sky Images. IEEE J. Photovoltaics 12, 145–151. doi:10.1109/JPHOTOV.2021.3120508
Pierro, M., Bucci, F., De Felice, M., Maggioni, E., Perotto, A., Spada, F., et al. (2016). Deterministic and Stochastic Approaches for Day-Ahead Solar Power Forecasting. J. Sol. Energy Eng. 139. doi:10.1115/1.4034823
Pike, C., Whitney, E., Wilber, M., and Stein, J. S. (2021). Field Performance of South-Facing and East-West Facing Bifacial Modules in the Arctic. Energies 14, 1210. doi:10.3390/en14041210
Posadillo, R., and López Luque, R. (2009). Hourly distributions of the diffuse fraction of global solar irradiation in Córdoba (Spain). Energy Convers. Manag. 50, 223–231. doi:10.1016/j.enconman.2008.09.042
Posadillo, R., and López Luque, R. (2010). The generation of hourly diffuse irradiation: A model from the analysis of the fluctuation of global irradiance series. Energy Convers. Manag. 51, 627–635. doi:10.1016/j.enconman.2009.08.034
Prasad, R., Ali, M., Xiang, Y., and Khan, H. (2020). A double decomposition-based modelling approach to forecast weekly solar radiation. Renew. Energy 152, 9–22. doi:10.1016/J.RENENE.2020.01.005
Qu, Z., Oumbe, A., Blanc, P., Espinar, B., Gesell, G., Gschwind, B., et al. (2017). Fast radiative transfer parameterisation for assessing the surface solar irradiance: the heliosat?4 method. Meteorol. Z. 26, 33–57. doi:10.1127/metz/2016/0781
Quan, H., and Yang, D. (2020). Probabilistic solar irradiance transposition models. Renew. Sustain Energy Rev. 125, 109814. doi:10.1016/J.RSER.2020.109814
Ramadhan, R. A. A., Heatubun, Y. R. J., Tan, S. F., and Lee, H. J. (2021). Comparison of physical and machine learning models for estimating solar irradiance and photovoltaic power. Renew. Energy 178, 1006–1019. doi:10.1016/J.RENENE.2021.06.079
Reda, I., and Andreas, A. (2004). Solar position algorithm for solar radiation applications. Sol. Energy 76, 577–589. doi:10.1016/J.SOLENER.2003.12.003
Reindl, D. T., Beckman, W. A., and Duffie, J. A. (1990). Diffuse fraction correlations. Sol. Energy 45, 1–7. doi:10.1016/0038-092X(90)90060-P
Remund, J., Salvisberg, E., and Kunz, S. (1998). On the generation of hourly shortwave radiation data on tilted surfaces. Sol. Energy 62, 331–344. doi:10.1016/S0038-092X(98)00020-6
Rerhrhaye, A., Zehaf, M., and Flechon, J. (1995). Estimation of the direct beam from seasonal correlations. Renew. Energy 6, 779–785. doi:10.1016/0960-1481(95)00006-6
Ridley, B., Boland, J., and Lauret, P. (2010). Modelling of diffuse solar fraction with multiple predictors. Renew. Energy 35, 478–483. doi:10.1016/j.renene.2009.07.018
Riedel-Lyngskær, N., Petit, M., Berrian, D., Poulsen, P. B., Libal, J., and Jakobsen, M. L. A Spatial Irradiance Map Measured on the Rear Side of a Utility-Scale Horizontal Single Axis Tracker with Validation using Open Source Tools. Proceedings of the 2020 47th IEEE photovolt. Spec. Conf., Calgary, AB, Canada, June 2020, p. 1026–1032. doi:10.1109/PVSC45281.2020.9300608
Rodríguez-Gallegos, C. D., Bieri, M., Gandhi, O., Singh, J. P., Reindl, T., and Panda, S. K. (2018). Monofacial vs bifacial Si-based PV modules: which one is more cost-effective? Sol. Energy 176, 412–438. doi:10.1016/J.SOLENER.2018.10.012
Ruiz-Arias, J. A., Alsamamra, H., Tovar-Pescador, J., and Pozo-Vázquez, D. (2010). Proposal of a regressive model for the hourly diffuse solar radiation under all sky conditions. Energy Convers. Manag. 51, 881–893. doi:10.1016/j.enconman.2009.11.024
Sengupta, M., Habte, A., Gueymard, C., Wilbert, S., and Renné, D. (2017). Best practices handbook for the collection and use of solar resource data for solar energy applications. Golden, CO, United States: National Renewable Energy Laboratory.
Sengupta, M., Habte, A., Wilbert, S., Gueymard, C., and Remund, J. (2021). Best practices handbook for the collection and use of solar resource data for solar energy applications. Golden, CO, United States: National Renewable Energy Laboratory. doi:10.2172/1778700
Skartveit, A., and Asle Olseth, J. (1986). Modelling slope irradiance at high latitudes. Sol. Energy 36, 333–344. doi:10.1016/0038-092X(86)90151-9
Skartveit, A., and Olseth, J. A. (1987). A model for the diffuse fraction of hourly global radiation. Sol. Energy 38, 271–274. doi:10.1016/0038-092X(87)90049-1
Skartveit, A., Olseth, J. A., and Tuft, M. E. (1998). An hourly diffuse fraction model with correction for variability and surface albedo. Sol. Energy 63, 173–183. doi:10.1016/S0038-092X(98)00067-X
Soares, J., Oliveira, A. P., Božnar, M. Z., Mlakar, P., Escobedo, J. F., and Machado, A. J. (2004). Modeling hourly diffuse solar-radiation in the city of São Paulo using a neural-network technique. Appl. Energy 79, 201–214. doi:10.1016/j.apenergy.2003.11.004
Spencer, J. W. (1982). A comparison of methods for estimating hourly diffuse solar radiation from global solar radiation. Sol. Energy 29, 19–32. doi:10.1016/0038-092X(82)90277-8
Starke, A. R., Lemos, L. F. L., Barni, C. M., Machado, R. D., Cardemil, J. M., Boland, J., et al. (2021). Assessing one-minute diffuse fraction models based on worldwide climate features. Renew. Energy 177, 700–714. doi:10.1016/J.RENENE.2021.05.108
Starke, A. R., Lemos, L. F. L., Boland, J., Cardemil, J. M., and Colle, S. (2018). Resolution of the cloud enhancement problem for one-minute diffuse radiation prediction. Renew. Energy 125, 472–484. doi:10.1016/J.RENENE.2018.02.107
Stein, J. (2018). Solar PV performance and new technologies in northern latitude regions. Washington, D.C., USA: United States Department of Energy.
Steven, M. D., and Unsworth, M. H. (1980). The angular distribution and interception of diffuse solar radiation below overcast skies. Q. J. R. Meteorol. Soc. 106, 57–61. doi:10.1002/qj.49710644705
Steven, M. D., and Unsworth, M. H. The diffuse solar irradiance of slopes under cloudless skies. Q. J. R. Meteorol. Soc. 1979;105:593–602. doi:10.1002/qj.49710544507
Stone, R. J. A nonparametric statistical procedure for ranking the overall performance of solar radiation models at multiple locations. Energy 1994;19:765–769. doi:10.1016/0360-5442(94)90014-0
Suehrcke, H., and McCormick, P. G. (1988). The diffuse fraction of instantaneous solar radiation. Sol. Energy 40, 423–430. doi:10.1016/0038-092X(88)90097-7
Tamura, J., Kurokawa, K., and Otani, K. (2003). Estimation of hourly in-plane irradiation by using minutely horizontal data. Sol. Energy Mater Sol. Cells 75, 585–595. doi:10.1016/S0927-0248(02)00159-9
Tapakis, R., Michaelides, S., and Charalambides, A. G. (2016). Computations of diffuse fraction of global irradiance: part 1 – analytical modelling. Sol. Energy 139, 711–722. doi:10.1016/J.SOLENER.2014.10.005
Taylor, K. E. (2001). Summarizing multiple aspects of model performance in a single diagram. J. Geophys Res. Atmos. 106, 7183–7192. doi:10.1029/2000JD900719
Temps, R. C., and Coulson, K. L. (1977). Solar radiation incident upon slopes of different orientations. Sol. Energy 19, 179–184. doi:10.1016/0038-092X(77)90056-1
Tian, Y. Q., Davies-Colley, R. J., Gong, P., and Thorrold, B. W. (2001). Estimating solar radiation on slopes of arbitrary aspect. Agric Meteorol 109, 67–74. doi:10.1016/S0168-1923(01)00245-3
Toledo, C., Gracia Amillo, A. M., Bardizza, G., Abad, J., and Urbina, A. (2020). Evaluation of Solar Radiation Transposition Models for Passive Energy Management and Building Integrated Photovoltaics. Energies 13, 702. doi:10.3390/en13030702
Torres, J. L., De Blas, M., García, A., and de Francisco, A. (2010). Comparative study of various models in estimating hourly diffuse solar irradiance. Renew. Energy 35, 1325–1332. doi:10.1016/j.renene.2009.11.025
Tsubo, M., and Walker, S. (2003). Relationships between diffuse and global solar radiation in southern Africa. S Afr. J. Sci. 99, 360–362. doi:10.10520/EJC97665
Turner, W. D., and Salim, M. (1984). Comparison of two diffuse sky radiation models. Sol. Energy 32, 677–679. doi:10.1016/0038-092X(84)90148-8
Ulgen, K., and Hepbasli, A. (2002). Prediction of Solar Radiation Parameters Through Clearness Index for Izmir, Turkey. Energy sources. 24, 773–785. doi:10.1080/00908310290086680
Urraca, R., Huld, T., Lindfors, A. V., Riihelä, A., Martinez-de-Pison, F. J., and Sanz-Garcia, A. (2018). Quantifying the amplified bias of PV system simulations due to uncertainties in solar radiation estimates. Sol. Energy 176, 663–677. doi:10.1016/J.SOLENER.2018.10.065
Urraca, R., Sanz-Garcia, A., and Sanz-Garcia, I. (2020). Bqc: A free web service to quality control solar irradiance measurements across Europe. Sol. Energy 211, 1–10. doi:10.1016/J.SOLENER.2020.09.055
Utrillas, M. P., and Martinez-Lozano, J. A. (1994). Performance evaluation of several versions of the Perez tilted diffuse irradiance model. Sol. Energy 53, 155–162. doi:10.1016/0038-092X(94)90476-6
Westbrook, O. W. A sky radiance-based approach to diffuse irradiance transposition. Proceedings of the 2015 IEEE 42nd photovolt. Spec. Conf., New Orleans, LA, USA, June 2015, p. 1–5. doi:10.1109/PVSC.2015.7356210
Willmott, C. J. (1982). On the climatic optimization of the tilt and azimuth of flat-plate solar collectors. Sol. Energy 28, 205–216. doi:10.1016/0038-092X(82)90159-1
Yang, D., and Boland, J. (2019). Satellite-augmented diffuse solar radiation separation models. J. Renew. Sustain Energy 11, 23705. doi:10.1063/1.5087463
Yang, D. (2022). Estimating 1-min beam and diffuse irradiance from the global irradiance: A review and an extensive worldwide comparison of latest separation models at 126 stations. Renew. Sustain Energy Rev. 159, 112195. doi:10.1016/J.RSER.2022.112195
Yang, D., and Gueymard, C. A. (2020). Ensemble model output statistics for the separation of direct and diffuse components from 1-min global irradiance. Sol. Energy 208, 591–603. doi:10.1016/J.SOLENER.2020.05.082
Yang, D. (2016). Solar radiation on inclined surfaces: corrections and benchmarks. Sol. Energy 136, 288–302. doi:10.1016/j.solener.2016.06.062
Yang, D. (2021). Temporal-resolution cascade model for separation of 1-min beam and diffuse irradiance. J. Renew. Sustain Energy 13, 56101. doi:10.1063/5.0067997
Yang, D., Yagli, G. M., and Quan, H. Quality Control for Solar Irradiance Data. Proceedings of the 2018 IEEE innov. Smart grid technol. - asia (ISGT asia), Singapore, May 2018, p. 208–213. doi:10.1109/ISGT-Asia.2018.8467892
Yang, D., Ye, Z., Nobre, A. M., Du, H., Walsh, W. M., Lim, L. I., et al. (2014). Bidirectional irradiance transposition based on the Perez model. Sol. Energy 110, 768–780. doi:10.1016/J.SOLENER.2014.10.006
Yao, W., Li, Z., Lu, Y., Jiang, F., and Li, C. (2014). “New Models for Separating Hourly Diffuse and Direct Components of Global Solar Radiation BT,” in Proceedings of the 8th international symposium on heating, ventilation and air conditioning. Editors A. Li, Y. Zhu, and Y. Li (Berlin, Heidelberg: Springer Berlin Heidelberg), 653–663.

Keywords: decomposition modelling, transposition modelling, solar energy, high latitudes, solar modelling
Citation: Manni M, Thorning JK, Jouttijärvi S, Miettunen K, Di Sabatino M and Lobaccaro G (2023) Horizontal-to-tilt irradiance conversion for high-latitude regions: a review and meta-analysis. Front. Built Environ. 9:1245223. doi: 10.3389/fbuil.2023.1245223
Received: 23 June 2023; Accepted: 12 September 2023;
Published: 28 September 2023.
Edited by:
Cristina Piselli, University of Florence, ItalyReviewed by:
Marina Bonomolo, University of Palermo, ItalyCopyright © 2023 Manni, Thorning, Jouttijärvi, Miettunen, Di Sabatino and Lobaccaro. This is an open-access article distributed under the terms of the Creative Commons Attribution License (CC BY). The use, distribution or reproduction in other forums is permitted, provided the original author(s) and the copyright owner(s) are credited and that the original publication in this journal is cited, in accordance with accepted academic practice. No use, distribution or reproduction is permitted which does not comply with these terms.
*Correspondence: Mattia Manni, bWF0dGlhLm1hbm5pQG50bnUubm8=
Disclaimer: All claims expressed in this article are solely those of the authors and do not necessarily represent those of their affiliated organizations, or those of the publisher, the editors and the reviewers. Any product that may be evaluated in this article or claim that may be made by its manufacturer is not guaranteed or endorsed by the publisher.
Research integrity at Frontiers
Learn more about the work of our research integrity team to safeguard the quality of each article we publish.