 N. W. Alnaser
 W. E. Alnaser
 E. A. D. Al-Kaabi3
94% of researchers rate our articles as excellent or good
Learn more about the work of our research integrity team to safeguard the quality of each article we publish.
Find out more
ORIGINAL RESEARCH article
Front. Built Environ., 07 July 2023
Sec. Sustainable Design and Construction
Volume 9 - 2023 | https://doi.org/10.3389/fbuil.2023.1210324
This article is part of the Research TopicResilience of the Built Environment to Climate ChangeView all 5 articles
Recently, the Kingdom of Bahrain doubled its renewable energy (RE) target to achieve 20% of energy mix by 2035 instead of 10%. Two RE sources are candidates among others, i.e., solar and wind energy. Both of these sources require, relatively, large spaces, and both are subject to fluctuation throughout the day, month, and year. Therefore, a thorough experimental evaluation of these two sources is necessary as theoretical assessment has been extensively made. Therefore, we are analyzing the result of two prototypes, solar and wind RE systems installed by the government. The first system includes installing two wind turbines (WT1 and WT2), each rated at 850 kW, and the second system is a 1 MW solar PV system. The annual result for 2022 is recorded for the wind turbine along with the results of 2 years (2017 and 2018) for the solar PV. The annual average produced by the first turbine (WT1), in the front, was found to be 899 MWh, while the second (WT2), at the back, was 872 MWh with an average capacity factor of 12%. Meanwhile, the 1 MW solar PV produced 1,632 MWh in 2017 and 1,497 MWh in 2018. Our analysis shows that each kW of wind turbine yields 2.9 kWh per day while each kW solar PV electricity yields, in average, 4.3 kWh per day. We also found that the average cost of wind electricity unit is 49 fils/kWh (USD¢ 13/kWh) and the payback is nearly 40 years while the average cost of solar electricity unit is 17 fils/kWh (USD ¢ 4.5/kWh) and the payback is nearly 12 years. Furthermore, we found that 1 MW of solar PV gives more electricity than 1 MW of wind by 42% and, subsequently, alleviates more CO2 by 42% than wind turbines’ installation; i.e., 1 MW solar PV will annually produce 1,500 MWh (alleviating 654 tons of CO2), while 1 MW produces, annually, 1057 MWh (alleviating 461 tons of CO2).
The Third National Climate Change Communication (third NCCC) reported by the Kingdom of Bahrain studied the CO2 inventory (SCE 1Supreme Council for Environment, 2020; SCE2 and Supreme Council for Environment, 2020). This communication is conducted periodically (every 5 years) to assist the governments to implement best practices in achieving prosperity with the least environmental damage due to greenhouse gases (GHGs), in particular CO2 due to its predominance as an effluent in the industry sector and energy production. Bahrain is among the countries that strive to fulfill its international commitment in having zero CO2 emission by 2060 (IF and International Finance, 2021), although its CO2 emission contribution to the world emission is nearly negligible (only 0.01%). The source of CO2 emission in Bahrain comes from four sectors, namely, the energy; industrial processes and product use; municipal, industrial, and commercial solid waste; and agricultural forestry and other land use.
The latest report (IEA, 2023) shows that the global energy-related CO2 emission grew in 2022 by 0.9%, or 321 million tons, reaching a new high of more than 36.8 billion tons, whereas Bahrain’s emission is only 38 million tons. Table 1 and Figure 1 show the distribution of CO2 emission from different sectors (and subsectors) in the Kingdom of Bahrain in 2015. This indicates that the total CO2 emission from all these four sectors in 2015 in Bahrain is 38.1 million tons. Considering that the population of Bahrain in 2015 was around 1.372 million, the CO2 per capita was 27.8 ton per capita for that same year.
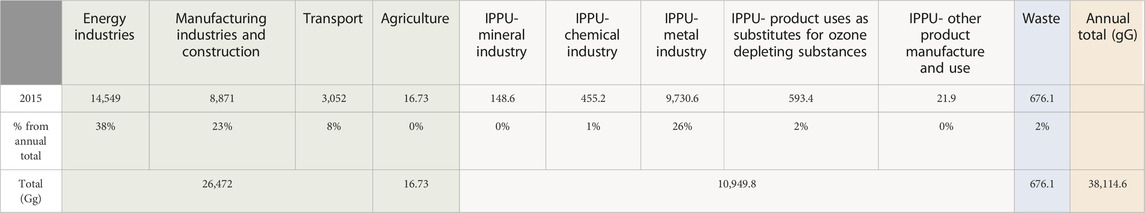
TABLE 1. Distribution of CO2 emission from different sectors (and subsectors) in the Kingdom of Bahrain in 2015 (SCE2 and Supreme Council for Environment, 2020).
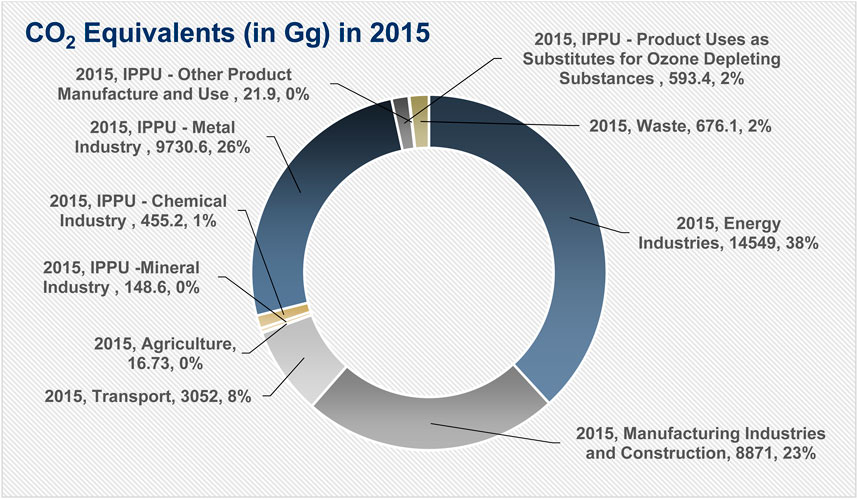
FIGURE 1. Distribution of CO2 emission from different sectors (and subsectors) in the Kingdom of Bahrain in 2015 (SCE2 and Supreme Council for Environment, 2020).
The emission from each sector can be summarized as follows:
i. Energy
The CO2 equivalent in the energy sector in the year 2015 was found to reach 26.47 million tons of CO2 equivalents. The contribution of the CO2 emission in this sector (energy) is 57.8% for the energy industry, 35.2% for manufacturing industries and construction, and 12.1% for transport.
ii. Industrial processes and product use (IPPU)
The estimated GHG emission in the IPPU sector in 2015 was 10.95 million tons of CO2 equivalents. This emission mainly resulted from the aluminum production process (78.3%), which emitted 8.58 million tons of CO2 equivalents in the form of per fluoro carbon (PFC) gases (such as CF3, C2F6, C4F8, and CHF3 which are used as cleaning agents for dry-edging), which represent 83%, while the CO2 represents 17%.
iii. Municipal, industrial, and commercial solid waste
The CO2 equivalent from municipal, industrial, and commercial solid waste, as well as wastewater generation, was found to increase annually, i.e., in the year 2015; it was 0.67 million tons of CO2 equivalents, while the per capita/year of municipal waste indicated 2.5 kg/day in 2015. The total amount of municipal waste increased from 1.25 million tons of CO2 equivalents in the year 2015.
iv. Agriculture, Forestry, and Other Land Use (AFOLU) sector
The total CO2 equivalent emissions are 0.17 million tons.
A more recent report (Worldmeter, 2023) indicates that CO2 emission has increased by 2.50% over the previous year. To mitigate CO2 emission in Bahrain, the Government of Bahrain established a Sustainable Energy Unit (SEU) which launched the National Renewable Energy Action Plan (NREAP) (Sustainable Energy Unit SEU, 2017a) and the National Energy Efficiency Action Plan (NEEAP) (Sustainable Energy Unit SEU, 2017b).
NREAP targets indicated 5% of energy (255 MW of installed capacity) from renewable sources by 2025 and 10% (710 MW of installed capacity) by 2035 (Sustainable Energy Unit SEU, 2017a)—which has risen to 20% (Chandak, 2023). The plan seeks to utilize renewable energy (RE), like solar and wind, as an energy mix of public and private investment, whereby if fully implemented, it would prevent the emission of 392,000 tons of CO2 per year. Three main policies have been established to realize these three RE targets: net metering (enabling consumers to generate on-site solar and wind electricity, grid-connected), feed-in tariffs (a long-term tender-based mechanism to purchase solar and wind electricity through an agreement), and mandates (refer to renewable energy mandates for new buildings).
The NEEAP, on the other hand, is a complementary initiative (Sustainable Energy Unit SEU, 2017b) to reduce the GHG emission. SEU established the target of a 6% reduction (about 6000 GWh) in final energy consumption by 2025 which is expected to make a cumulative reduction of 3.4 million tons of CO2 by 2025. The NEEAP has made 22 initiatives to fulfill Bahrain’s target as follows:
i. Building codes: Integrating energy efficiency objectives into regulations governing the design, construction, and maintenance of structures
ii. Demand-side efficiency standards: Establishing new standards for lighting, appliances, motor vehicles, and street lighting
iii. Supply-side efficiency standards: Focusing on electricity generation, including efficiency enhancements for the transmission and distribution of electricity, and the installation of smart meters
iv. District cooling: Introducing of highly efficient, industrial-grade equipment to produce space cooling for buildings through an insulated underground piping network
v. Green building initiatives: Retrofitting of government buildings
vi. Subsidy reform: Reforming both power subsidies and those that affect transport to offset perverse incentives for wasteful consumption
There is a plethora of RE initiatives in Bahrain; however, the current share of its renewable energy in the electricity generation mix is very modest. There is about 20 MW of solar PV installed in Bahrain (Alnaser NW., 2023) and 1.5 MW of wind energy. The largest single project will be the Bahrain Solar PV Park (100 MW solar PV) which is expected to get commissioned in September 2023 (Power Technology, 2023). The Ministry of Electricity and Water Affairs in Bahrain announced in August 2022 the launch of an international tender inviting proposals grid-connected solar PV projects with a minimum total capacity of 72 MW. The projects comprise rooftop, ground-mounted, car park solar power systems, and electric vehicle charging stations at the Bahrain International Circuit, University of Bahrain, Bahrain Tourism and Exhibitions Authority and Al Dana Amphitheatre (Zawya Projects’ Writer, 2022). The NREAP plan identifies a set of specific policies to incentivize increasing the share of RE throughout the economy. Four scenarios were established as follows:
1- Business-as usual (BAU): assuming pre-plan conditions
2- Energy efficiency scenario
3- Renewable energy scenario
4- Combined scenario considering both energy efficiency initiatives and renewable energy
It is hoped that these scenarios, together, will contribute to a national renewable energy target of 5% of peak capacity by 2025 and 20% by 2035, i.e. 478 GWh and 1456 GWh of renewable electricity by 2025 and 2035, respectively. This RE initiative consists of the following.
Solar PV systems will be deployed as decentralized renewable energy applications in urban areas as well as large-scale installations on available land. Decentralized applications include solar systems for new housing units, solar systems for government buildings, decentralized solar systems in urban developments (solar lighting and solar parking), decentralized rooftop solar systems on existing residential and commercial buildings, and large-scale installation opportunities on available land including utility-scale renewable solar PV farms by large industry groups and solar farms in new town developments.
Luckily, the costs for solar PV systems have dropped significantly, and by the year 2025, in Bahrain, the levelized cost of energy is projected to be between 18.6 fils/kWh (US¢ 4.9/kWh) and 24 fils/kWh (US$ 6.3/kWh), and by 2035, this cost is projected to drop to between 13 fils/kWh (US¢ 3.6/kWh) and 20 fils/kWh (US¢ 5.5/kWh) (Sustainable Energy Unit SEU, 2017b). By 2030, the projected capacity totals to 300 MW (510 GWh of Solar electricity) with cost savings of BD 32 million (US$ 83 million).
Onshore wind systems will be mostly deployed as large-scale installations on available land. These opportunities on available land include utility-scale wind farms by large industry groups and wind farms on other available land.
Also, the costs for onshore wind systems have also dropped significantly, and by 2025, the costs of installing onshore wind is expected to fall by 12%, resulting in a 34% reduction of today’s levelized cost of onshore wind energy (Sustainable Energy Unit SEU, 2017b), whereas the average levelized cost of electricity from onshore wind farms may be 21 fils/kWh (US¢ 5.5/kWh)—which is consistent with estimates available from the US Energy Information Administration (US Energy Information Administration USEIA, 2019).
Offshore wind systems will be mostly deployed as large-scale installations on available land. These opportunities on available land include near shore or offshore wind farms and integrating renewable energy technologies in large infrastructure projects like causeways. The costs for offshore wind systems are typically between 1.5 and 3.3 times larger than onshore wind system costs. The average levelized cost of electricity for offshore wind farms was assumed to be 45 fils/kWh (US¢12/kWh (US Energy Information Administration USEIA, 2019). By 2030, the projected installation in Bahrain is 25 MW (62 GWh).
Bahrain has a strong opportunity to use different REs, including solar energy and wind energy. Solar radiation in Bahrain is estimated at 6 kWh/m2/day (Alnaser et al., 2014). The country’s global horizontal irradiance is 2160 kWh/m2/year, while direct normal radiation is 2050 kWh/m2/year (IRENA, 2014). Average daily sunshine exceeded 10 h in 2016, further underscoring the potential for solar energy (IGA, 2016). The available wind power in Bahrain has been estimated using four methods. The power density was found to be 60.0, 63.5, 54.5, and 167.0 W m−2, (Alnaser, 1993). The power obtained from a wind generator module (1 m in diameter) was reported and compared with the estimated results. A comparison between the available wind and solar power in an urban area in the State of Bahrain is also discussed in this paper.
Several studies have explored the technical aspects in Bahrain toward establishing large-scale solar power projects (Pillai and Naser, 2018), meteorological parameters that impact the adoption of RE technologies (Shams et al., 2016) at achieving zero-emission design of houses in the country (Krarti and Dubey, 2018).
It was reported recently (Alsabbagh and Alnaser, 2022) that achieving carbon neutrality requires not only technologies for reducing CO2 emission at the source and enhanced carbon sinks but also the introduction of a circular economy culture and efforts to foster pro-environmental behavior within the population. The involvement of different stakeholders in the journey toward carbon neutrality is critical, along with the formulation of requisite policies regulating the roles of technology, behavior, and research.
The purpose of this paper is to analyze the results of actual installations of solar PV (1 MW) and two identical wind turbines (each 850 kW) in Bahrain to actually reach a conclusion on how these two types of energy can contribute highly in fulfilling the kingdom’s commitment to reach its RE target by 2035 and its zero emission by 2060. The outcome of this work may alert the Government of Bahrain to revise its plan in using large percentage of wind electricity and to give more attention to using floating solar PV instead of an off-shore wind turbine. It is hoped that this work will also help other relatively flat small islands located in the arid and humid zone (sunny, low precipitation, and modest wind) in conducting their feasibility study in using solar and wind energy as well as in prioritizing between these two sources or compromising the suitable energy mix between them to achieve sustainability and combat climate change.
Bahrain is set to cut emissions by 30% by the year 2035 and reach its net-zero emission target by 2060, a commitment made at the 26th United Nations Climate Change Conference of the Parties (COP26) in Glasgow (IF and International Finance, 2021). For Bahrain to maintain a minimum of 5% of energy usage from renewable sources by 2025, the Government of the Kingdom of Bahrain has targeted all industries. The aim of this target is to reduce gas consumption used for power generation and greenhouse gases such as carbon dioxide, nitrogen oxides, and sulphur oxides. It involves two large projects in wind electricity (about 2 MW) by the Electricity and Water Authority (EWA) and Solar PV electricity (1 MW) by the Bahrain Oil Company.
Bahrain had installed the first two identical, large-sized wind turbines, each rated at 850 kW, at the Al Dur area, south of Bahrain (Figure 2). They were manufactured by Vestas, model V52, with three blades, each 26 m in length. The two turbines (one in front the other) are 200 m apart (Figure 3). The cut-in speed is 4 m/s, and the cut-off speed is 25 m/s. The hub height is 44 m, with an AC voltage of 690 V and transformers 1,250 kVA (1.2 MW). The wind turbine occupies an area of 80,000 m2. The monitoring of the turbines is carried out by Vestas which reports the wind electricity produced quarterly to the owner (Electricity and Water Authority, EWA). The turbines started regular operation in February 2022. The wind speed at hub height (44 m) is recorded continuously (Figure 4).
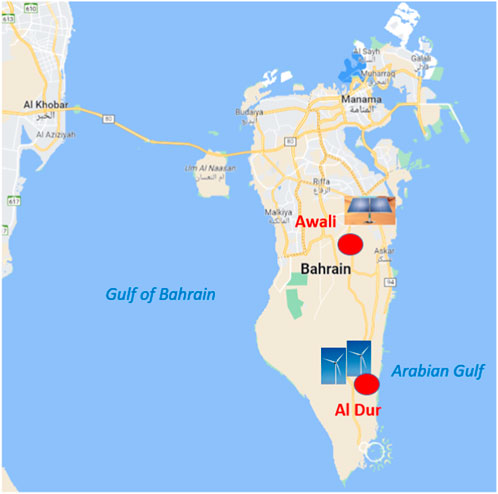
FIGURE 2. Location of the wind turbine installation (1.7 MW) at Al Dur (By EWA) and the Solar PV System (1 MW) at Awali (by the Bahrain Oil Company) in the Kingdom of Bahrain.
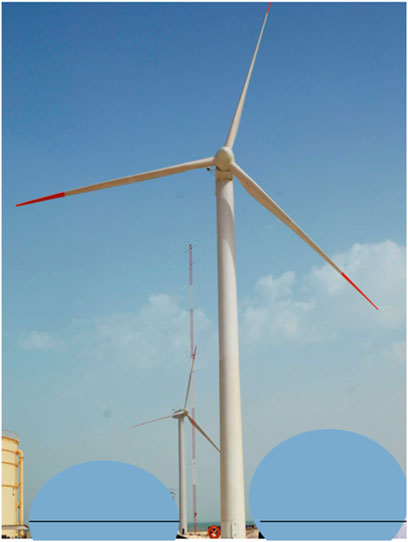
FIGURE 3. First two identical large-sized wind turbines are installed at the Al Dur area, south of Bahrain. Each wind turbine is rated at 850 kW by Vestas, model V52, with a blade diameter of 52 m (blade size 26 m). The two turbines (one in front of the other) are 200 m apart.
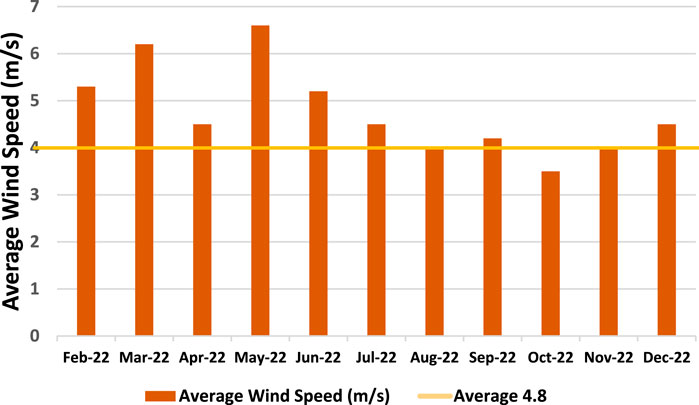
FIGURE 4. Average wind speed at a hub height (44 m) of a 850 kW wind turbine installed at Al Dur, south of Bahrain, Kingdom of Bahrain.
The Bahrain Oil Company has initiated two projects to utilize solar energy in the Bahraini field (Tatweer Petroleum, 2019); the first is a 1 MW solar power plant (SPP) in Awali town (Figure 2)—which was initiated in February 2016 and was completed within 5 months, becoming in operation in February 2016 (Figure 5)—while the second is 3 MW SSP, which has been recently completed. Any surplus energy generated by the SPP is supplied to TP’s high voltage (HV) distribution network, thereby decreasing the power demand from the government grid and reducing natural gas consumption.
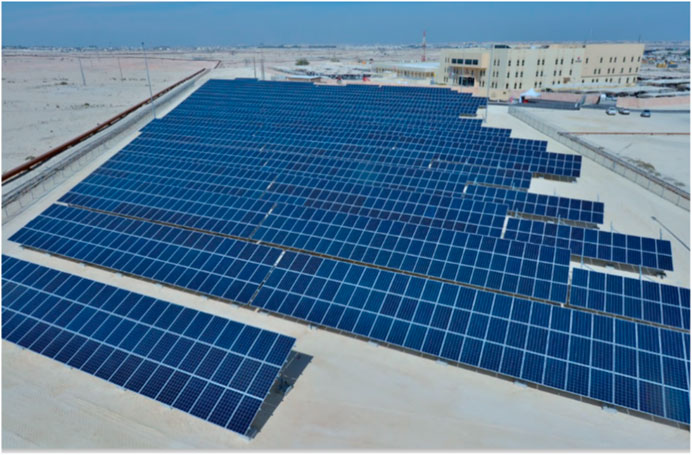
FIGURE 5. Bahrain Oil Company’s 1 MW solar polycrystalline solar PV installed on an area of 14900 m2 at Awali, Kingdom of Bahrain.
The 1 MW SPP consists of 3,980 polycrystalline solar photovoltaic modules, model TC250 series, 60-cell multi-crystalline made by Tata Power Solar. Each module has an area of 1.6 m2 (1 m × 0.6 m), panel efficiency 15.4%, current at Pmax = 8.39 A, and voltage at Pmax = 29.83 V with 16–60 KVA inverters. The expected annual solar electricity of this installation (1 MW) is 1.83 GWh. This means that the total PV panel area is 6,397 m2 and was constructed on a land with an area of 14,900 m2 (57% of land area is for spacing for maneuver, cleaning, and repair).
The cleaning of the PV panels is performed manually, once every 3 months, using distilled water. It consumes about 6000 L (6 tons), i.e., each PV panel (@250 W with an area of 1.6 m2), and consumes 1.5 L of distilled water.
The SPP was fully constructed in 5 months and is expected to have a payback period of 12 years. The monitoring of the system is assigned to a professional company which monthly reports to the Bahrain Oil Company.
The wind energy results are promising. The average wind speed at hub height had reached 6.6 m/s. Usually, at this location, the annual average wind speed (average of 5 years) at a height of 10 m is 4.1 m/s with the highest monthly average in June (4.85 m/s) with a prevailing wind direction of 4° (or nearly north) (Alnaser et al., 2020a). The common equation used for the variation of wind speed with height is as follows (Perez et al., 2004):
where v1 and v2 are the mean wind speeds at heights h1 and h2, respectively. The exponent (α) depends on factors such as surface roughness and atmospheric stability, as shown in Table 2 (Shams et al., 2016). Therefore, comparing the results in Figure 4 with that reported by Alnaser et al. (2021), we conclude that the exponent α for the location is 0.123. This value looks reasonable as for open water α = 1 and for several buildings and hilly and mountainous terrain α = 0.25. The recommended value for α is 0.14; the lower, the better (Twiddle and Weir, 2011).
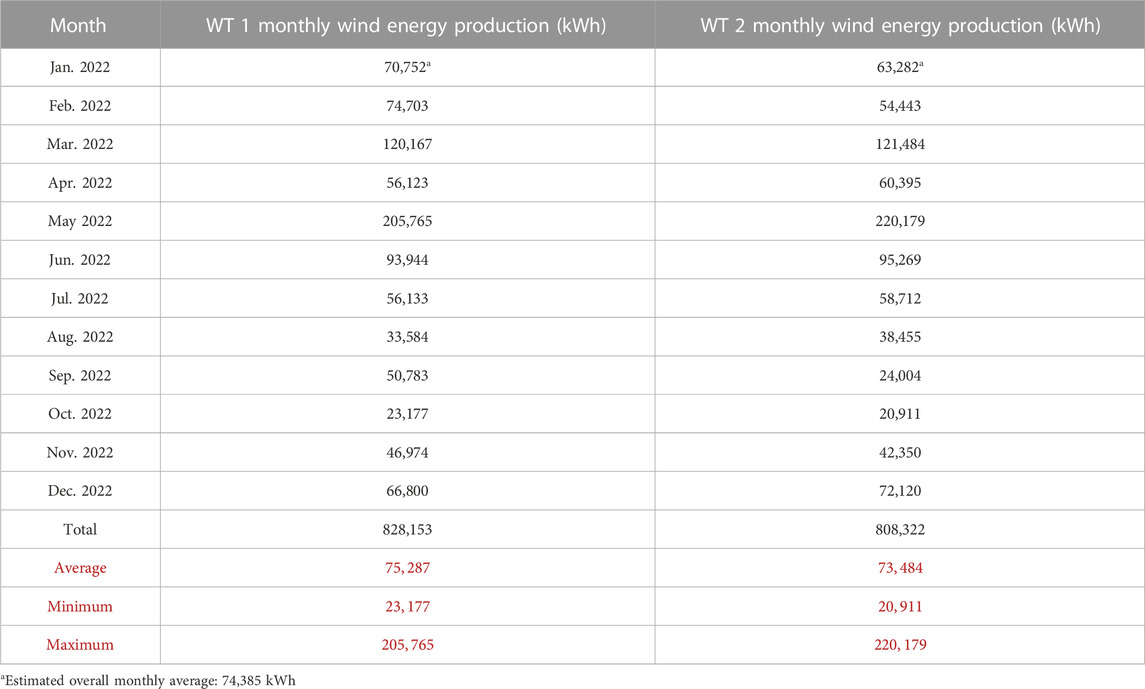
TABLE 2. Generated wind electricity from two identical wind turbines (@0.85 MW), 200 m apart, near to a sea coast, installed at Al Dur, Kingdom of Bahrain.
Table 2 and Figure 6 show the generated wind electricity from wind turbine 1 (WT1) and wind turbine 2 (WT2) as both are rated at 850 kW (0.85 MW) and are 200 m apart. The performance of both wind turbines seems nearly similar with more wind electricity from WT1 than WT2 (more by 2.5%), which is attributed to the partial blockage effect from the front wind turbines altering the upstream flow on WT2 (Forsting and Troldborg, 2015).
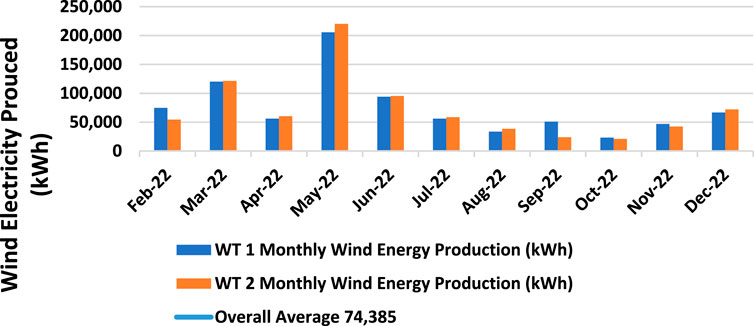
FIGURE 6. Wind electricity produced in 2022 by two wind turbines (@850 kW), hub height 44 m and blade size 26 m, installed at Al Dur, Kingdom of Bahrain.
The month of January 2022 (or January 2023) has to be estimated to be complete for a one full year’s data. This is due to a non-received report on the first quarter performance by Vistas for 2023 and due to the operation of WT1 and WT2 in February 2022. For January 2022, the estimated wind electricity for WT1 is 70,752 kWh and for WT2 is 63,282 kWh. Therefore, the annual average produced by WT 1 is 898,905 kWh (899 MWh) and that by WT2 is 871,604 (872 MWh). These results lead to conclude the following:
a. The annual specific yield for WT1 is 1058 kWh/kW, or each kW produces an annual wind electricity of 1058 kWh (2.9 kWh/kW/day).
b. The capacity factor (CF) of the turbines, which indicates how much energy is generated by the wind turbine relative to the maximum amount of energy, could provide over the course of a single year 12% for WT1 and 11.7% for WT2. Recalling that the average capacity factor of the U.S. wind fleet hovers is around 32%–34% (Dell and klippenstein, 2017), this value seems to be low; CF = wind electricity from the turbine in kWh/(capacity in kW x 8,760 h).
c. The previously reported (Jowder, 2009) average annual wind power density was found to be 114.54 W/m2 for 10 m height, 433.29 W/m2 for 30 m height, and 816.70 W/m2 for 60 m height when applied to the result of this study (for a rotor area A = 2123 m2). It is reported (Forsting and Troldborg, 2015) that a power of 242 kW, 919 kW, and 1732 kW will result from the wind turbine at height 10, 30, and 60 m, respectively.
Taking the efficiency of the turbine as 55%, the annual expected wind electricity from the study is 48.6, 185, and 347 MWh. Comparing the annual expected yield for the hub height 60 m (347 MWh) with the annual yield from the 850 kW wind turbines at Al Dur at hub height 44 m (872 MWh), it can be concluded that the current performance is encouraging.
d. The average cost of wind electricity unit is found 49 fils/kWh (USD¢ 13/kWh), and the payback is nearly 40 years. These values are while assuming the purchase of each kWh produced is purchased (or charged) as 29 fils (USD¢ 8.5/kWh) and the wind turbine generates annually about 900 MWh per year for 20 years. The Government of Bahrain currently charges USD¢8.5/kWh for commercial use while it is only 3 fils/kWh (USD¢8.5/kWh) for domestic use when the consumption does not exceed 3000 kWh. The method of calculating the payback period used herein is explained in detail elsewhere (Alnaser et al., 2020b; Alnaser N. W., 2023).
e. Knowing that Bahrain uses combined cycle gas turbines (natural gas) to produce electrical energy, where the natural gas CO2 factor is 0.21, each 1 kWh produced will result in the emission of 0.436 kg (or 436 g CO2eq/kWhel) (volker-quaschning.de, 2023). This means that these two wind turbines save, annually, the emission of 772 tons of CO2 as their total annual wind electricity production was 1,770,509 kWh.
f. A 1 MW wind turbine installation in Bahrain will give wind electricity 1,057 MWh which will alleviate 461 tons of CO2.
According to a recent study in Kuwait (Alawadhi, 2022), changing the rated power of wind turbine from 2 MW to 3 MW almost doubled the yearly output power from 6.22 GWh to 11.71 GWh. Moreover, the maximum yearly output energy of 11.71 GWh can be produced by a wind turbine with a rated power of 3.0 MW. As such, each kW of wind turbine will provide an energy of 8.5–10.7 kWh. These values are much larger than those obtained using 850 kW wind turbines.
Furthermore, a 1 kW horizontal axis turbine with wind blowing at a constant speed for long periods of time may generate 8 to 10 kWh per day (voltaconsolar.com, 2023). The aforementioned figure is in line with the Kuwaiti study (Alawadhi, 2022) and shows that the yield of our 850 kW is relatively low.
One way to make more yield from is through turbines via using large-blade size wind turbines with low cut-in speed such as Vestas 6 MW (Vestas V150-6.0 EnVentus) that has a cut-in speed of 3 m/s and rotor diameter of 150 m (blade size 75 m), i.e., the rotor area (A). For example, this model may produce about 12 kWh/kW/day (annually 26,280,000 kWh = 26.2 GWh) which can save the emission of 11,458 tons of CO2 instead of 772 tons of CO2 from both 850 kW Vestas wind turbines installed in Bahrain. Also, among ways to increase yield from wind turbines is installing an offshore wind turbine due to more wind speed first, v (night and day breeze), and accordingly the power, P, and low exponent (α) of sea water surface. There is no loss on the wind speed incident on the turbine, therefore contributing to more electricity production. This can be understood from Eqs 1, 2 as follows (Perez et al., 2004):
where ρ is the mean air density (1.225 kg/m3 at average atmospheric pressure at sea level and 15°C) and ƞ is the efficiency.
Al-Ghussain et al. (2020) presented a techno-economic comparison of standalone wind (2 MW) and solar photovoltaic, PV, (1.41 MW) at Gwanda, Zimbabwe, and reported for wind capacity factor 34.57%, RE fraction 54.99%, demand supply fraction (DSF); 32.55%, levelized cost of electricity (LCOE) 0.09 USD/kWh, net present value (NPV) 3.00 million USD, internal rate of return (IRR) 17%, and payback period (PBP) 5 years, while for PV, it was 18.72, 28.72%, 9.57%, 0.10, 0.087, 7.65, and 13.1 years. Their work shows that for the PV (1.4 MW), the average maximum hourly energy generation is about 1.6 MWh at 13:30 h, while for the wind (2 MW), it was 1 MWh at 17 h, i.e., for 1 MW PV, it is 1.14 MWh, and for 1 MW wind, it is 0.5 MWh. This observation agrees with our finding, although it is a local sensitive performance.
Osman and Alsokhiry (2022) described a grid-connected PV (1 MW) wind (3 MW) hybrid system’s comprehensive design, control strategy, and performance assessment in Dongola city located in Sudan’s northern region. Their simulation revealed that the wind will produce 7,907 MWh, annually, while the PV will produce 977 MWh, i. e., 1 MW wind will produce 2,635 MWh, annually (daily yield 22 kWh/kW/day), and 1 MW of PV will produce 977 MWh (daily yield 2.6 kWh/kW/day). This result contradicts with Bahrain’s case. This shows that these two sources (wind and solar) are location sensitive.
The specific yield of the wind turbine depends on the turbine’s size and the wind speed. The average turbine with a capacity of 2.5–3 MW can produce more than 6 GWh in a year in some locations, enough to supply 1,500 average EU households with electricity (Zander, 2011) which means that every MW of wind turbine produces annually 2,105 MWh or average daily specific yield of 5.8 kWh/kW (Zander, 2011). It is well known that wind turbines do not operate near their capacity, but rather at about 15%–30%. Therefore, a wind turbine with a 25% capacity factor, a 2 MW turbine would produce 4,380,000 kWh per year or 6 kWh/kW (ANEMOI Energy Service, 2020). Although Zander (2011) and ANEMOI Energy Service (2020) have a time lapse of 9 years, they report nearly similar average daily specific yield for a wind turbine performance.
Ahmed (2018) conducted a technical estimation of a yield of 150 MW in a wind park at Shark El-Ouinat, Egypt, and reported that such installation will generate an annual energy of 730,791 MWh (yield of about 13 kWh/kW/day) with a capacity factor of 56%, at hub height 100 m, with an expected cost of 1.3 € cent/kWh.
Aventa AV-7 turbine (Power 7 kW) was chosen to test the power generation of wind in Medina, Kingdom of Saudi Arabia (KSA) (AlQdah et al., 2021). It was found that this wind turbine can generate 8,648 kWh/year (yield of 3.4 kWh/kW/day) in which it is only 15.2% of the maximum power. This turbine is expected to generate the maximum possible power output at a wind speed of 7 m/s. This is similar to the case of Bahrain.
Furthermore, a wind farm suggested to be located in Doha, Qatar (Méndez and Bicer, 2022), is expected to generate about 59.7, 90.4, and 113.5 GWh/y electricity by employing Gamesa G97/2000 (2 MW), GE Energy 2.75–120 (2.75 MW), and Senvion 3.4 MW wind turbines, respectively. This means that the yield of each of the three wind turbines will be 82 kWh/kW/day, 113 kWh/kW/days, and 91 kWh/kW/day. These values are so high and look exaggerated.
Oman started its first utility-scale wind power project with a generation capacity of 50 MW from 13 wind turbines. It began operations in 2019 and supplies customers with more than 190 GWH of carbon-free electricity (daily specific yield 10 kWh/kW/day), according to the company (Energy and Utilities, 2022). Table 3 summarizes the average daily specific yield (DSY) of wind in some Gulf Cooperation Council (GCC) countries, which include Bahrain, KSA, UAE, Kuwait, Qatar, and Oman. In Oman, for a 1 MW grid-connected PV plant in Adam City (Kazem et al., 2017), the capacity factor of the proposed system is 21.7% while the cost of energy found for the plant is around 0.2258 USD/kWh which is economically feasible and shows great promise.

TABLE 3. Average daily specific yield (DSY) of wind in some of Gulf Cooperation Council countries.
It is expected that the DSY can be larger than this value if the wind turbine was located, same arrangement and model type of wind turbine, at a location that has more wind power density (WPD) in Bahrain; extreme north of Bahrain. The WPD dependence is highly on wind speed, i.e., WPD ∞ v3 (Eq. 2). Figure 7 indicates that if the hub height of the wind turbine is at a height of 100 m, the wind speed will range from 6.3 to 6.5 m/s (top), while if the hub height is 150 m, the wind speed will range from 6.8 to 6.9 m/s (bottom) (Alnaser and Alnaser, 2019); this means a difference in WPD of about 20%.
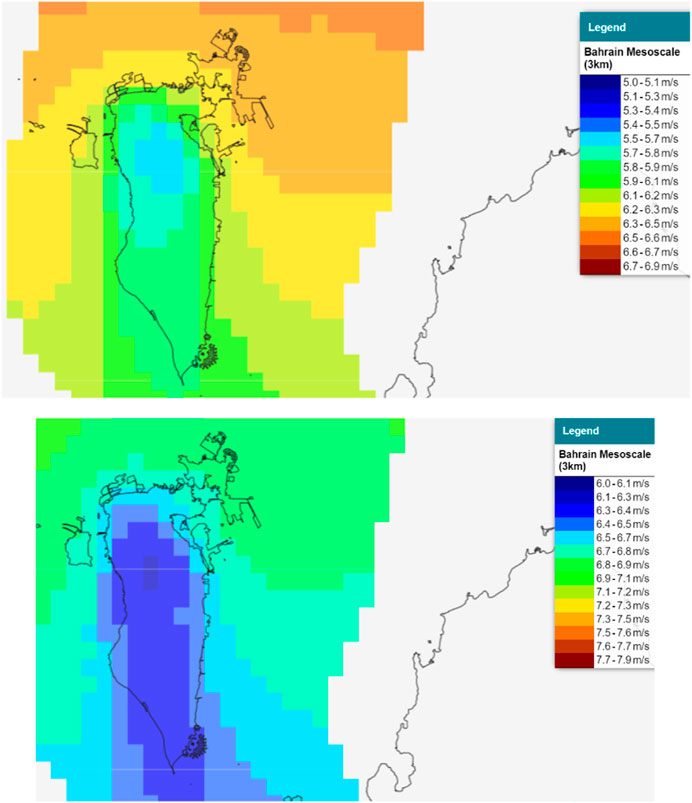
FIGURE 7. The Variation of the wind speed in the extreme north of Bahrain at different hub heights, 100 m (top) and 150 m (down), according to wind prospecting by EMD International made for Bahrain (Alnaser and Alnaser, 2019).
The generated solar electricity of 2 years (2017 and 2018) from a 1 MW solar PV installed by the Bahrain Oil Company at Awali, Kingdom of Bahrain, is presented in Table 4 and Figure 8.
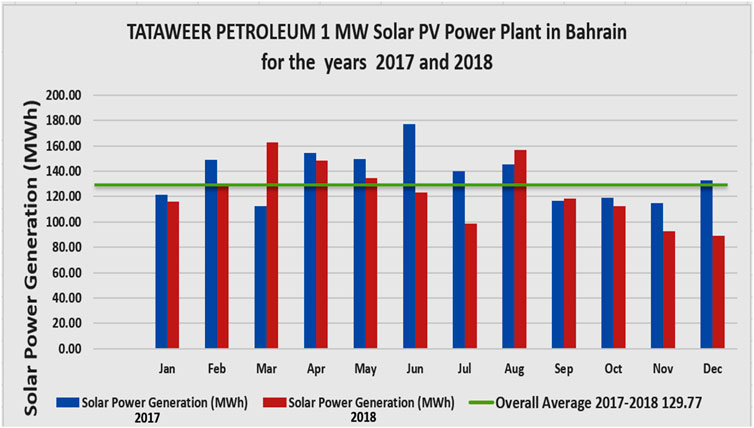
FIGURE 8. Generated solar electricity of 2 years (2017 and 2018) from a 1 MW solar PV installed at Awali, Kingdom of Bahrain.
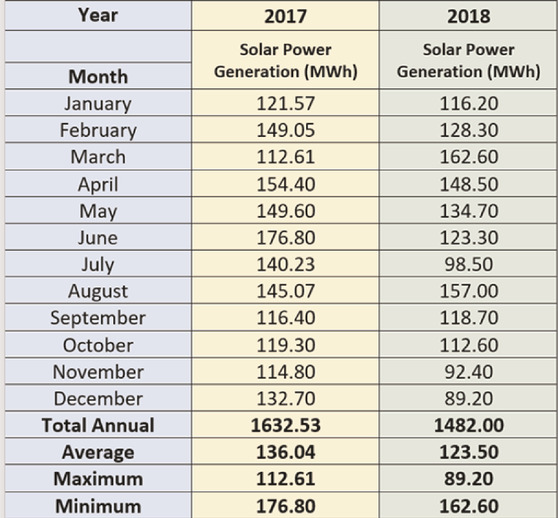
TABLE 4. The Generated solar electricity of 2 years (2017 and 2018) from a 1 MW solar PV installed at Awali, Kingdom of Bahrain.
The performance of the PV system looks very promising and rich. The annual solar electricity in 2017 is 1,632 MWh, with a monthly average of 136 MWh. As for the year 2018, the annual solar electricity average is 1,482 MWh, with a monthly average of 124 MWh.
The declination in the yield is either to less solar radiation in this year or more turbid sky or slight degradation in the solar cells due to heat and other weather parameters. Based on the recorded data of solar radiation in Muharraq town (Figure 9), the recorded global solar radiation in 2017 was 449.2 W/m2, and in 2018, it was 448.5 W/m2. Muharraq is only 30 km away from Awali, where there is not much change in terrain or topography except that Muharraq is close to the sea coast while Awali is in the middle of a desert.
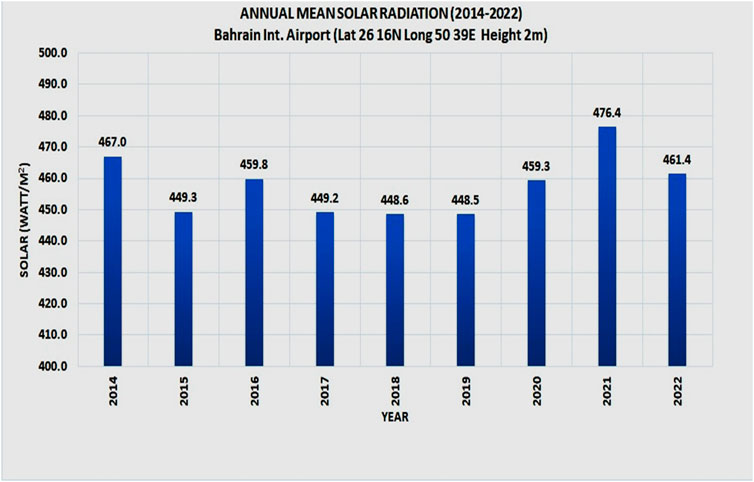
FIGURE 9. Annual global solar radiation recorded in Bahrain International Airport, Muharraq town, Kingdom of Bahrain, in the years 2014–2022.
Therefore, one can conclude that the slight change in the yield in 2017 and 2018 from the PV installation is due to a slight electronic degradation or loss which resulted in a decrease in productivity by 10%. The expected losses are due to change in ohmic wiring loss, invertor loss during operation (efficiency), and PV loss due to temperature.
It is worth mentioning that in the month of June, followed by July, the solar radiations feed the PV system in early morning hours (5 a.m.–6 a.m.), while from 5 p.m. to 6:00 p.m., the solar feeding takes place in May, June, July, and August as shown in Figure 10, which is produced using HelioScope software. The figure shows breakdown of the average hourly production data depicting the pattern during the day, and subsequently the month, leading to useful information on the harvest of solar electricity in each hour in each month. Figure 9 also shows that the peak harvest (yield) of solar electricity throughout the day is from 10 a.m. to 1 p.m. (4 h), where the mean solar electricity production reaches from 3,200,000 kWh to about 3, 500,000 kWh for an installation of 1 MW PV single crystal.
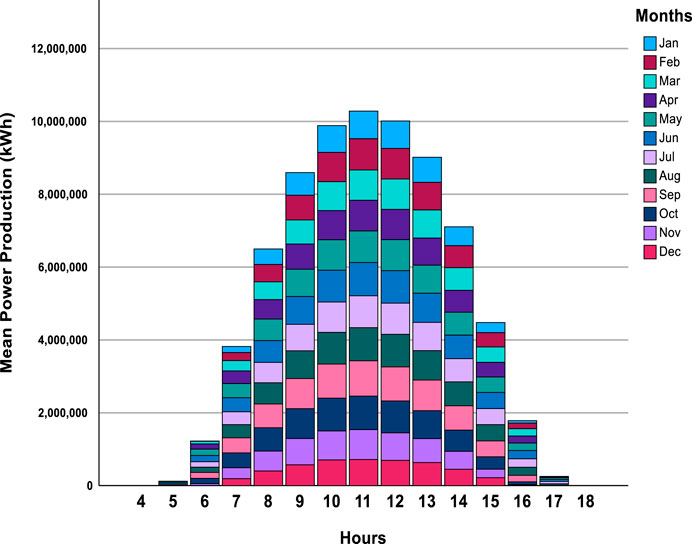
FIGURE 10. Breakdown of the average hourly production data in installing 1 MW PV solar in Bahrain.
The results indicate that the annual specific yield of the installed PV Solar System in Awali was 1,632 MWh/MW indicating that every day, a 1 kW PV solar system will give a solar electricity of 4.5 kWh while considering the result of 2017. As for the result of 2018, it was 1,497 MWh/MW (4.5 kWh/kW), thus making an average of 4.3 kWh/kW/day. These results agree, to a certain extent, with the reported specific yield for the other GCC countries as illustrated in Table 5.
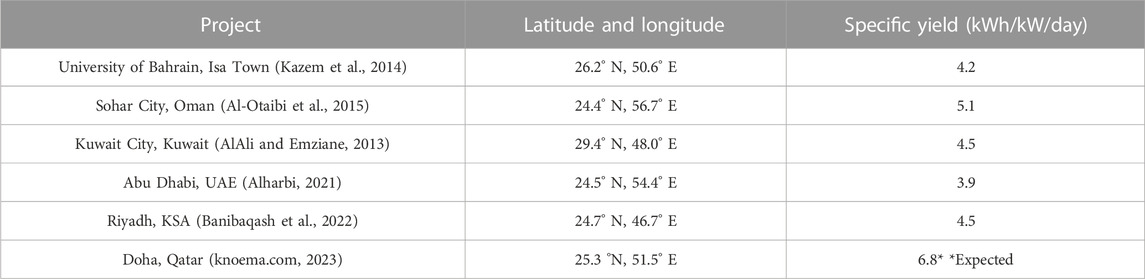
TABLE 5. Comparison between the findings of this study with other studies in GCC countries.
The aforementioned results show that the average cost of the solar electricity unit is found to be 14 fils/kWh (USD¢ 3.6/kWh), and the payback is nearly 12 years. These values are while assuming the purchase of each kWh produced is purchased (or charged) as 29 fils (USD¢ 8.5/kWh) and the 1 MW PV system generates annually about 1,500 MWh per year for 25 years. The Government of Bahrain currently charges USD¢8.5/kWh for commercial use, while it is only 3 fils/kWh (USD¢8.5/kWh) for domestic use when the consumption does not exceed 3,000 kWh.
We can conclude that a 1 MW solar PV will produce annually about 1,500 MWh (alleviates 654 tons of CO2), while a 1 MW wind turbine produces 1,057 MWh (alleviates 461 tons of CO2), i.e., 1 MW of solar PV gives more electricity than 1 MW of wind by 42%, and subsequently alleviates CO2 by 42% more than the wind turbines’ installation.
We have seen that the annual CO2 emission in Bahrain is about 38 million tons (with installed capacity about 7,000 MW, i.e., an energy of 30 TWh (knoema.com, 2023)), and we understood that each MW of solar PV will alleviate CO2 emission of 654 tons (which needs, at least, an area of 6,400 m2), while each MW of wind (which needs an area 80,000 m2) will alleviate 461 tons of CO2. If the Government of Bahrain decides to make the ratio of solar PV to wind utilization 2:1 to make zero CO2 emission, then it needs to install 38,736 MW of PV, which needs an area of 577,166,400 m2 (577 km2) and 27,477 MW of wind turbine, which needs an area of 247,910,400 m2 (248 km2). Since Bahrain’s land area is only 750 km2, inevitably, rooftop and offshore utility will be a must. For calculation clarification, to use solar PV to alleviate all CO2 in Bahrain, 58,104 MW is needed, while to use wind turbines to alleviate all CO2, 82,430 MW is needed. The reason for this large number of MWs needed pertains to the conversion factor from kWh natural gas to CO2 which was put low (0.453 kg CO2/kWhn.g) and also due to the low specific yield of both technology with superiority of solar PV. The problem of using a building’s rooftop is that only 40% of the roof could be utilized in our region. According to the work of Asif et al. (2019), the UF—ratio of the available area for PV utilization to the total roof area—has been found to range between 25% and 41% in the King Fahad University for Petroleum and Mineral campus at Dhahran, Kingdom of Saudi Arabia, with faculty residential buildings turning out to be the least effective due to greater degree of obstructive features on rooftops. The housing style in Dhahran and Bahrain is nearly similar.
To minimize the need of using RE technology to save CO2, Bahrain has targeted afforestation and has become successful in achieving 100% of its annual afforestation goal, by planting 110,000 seedlings of mangrove trees and 140,000 other trees across governorates (Gulf Daily News Online, 2022). In addition, it has put a program to improve the energy efficiency and energy conservation (equinor.com, 2023).
To reduce the CO2 emission in Bahrain and to reach the target of 20% RE share, as well as reach the zero-emission target in Bahrain by 2060, which a major step toward combating the climate change, it is advisable that Bahrain relies more on the utilization of solar energy for electricity production followed by wind energy. The rationale is based on two pilot projects, 1 MW in solar PV and 1.7 MW wind turbine. The outcome of these two pilot projects proves that 1 MW of solar PV gives more electricity than 1 MW of wind by 42%, and subsequently, it alleviates CO2 by 42% more than using wind turbines.
One possible way to have more yield from wind electricity is to use large-blade size wind turbines with low cut-in speed such as Vestas 6 MW (Vestas V150-6.0 EnVentus) which has a cut-in speed of 3 m/s. This model may produce about 12 kWh/kW/day (annually 26,280,000 kWh = 26.2 GWh) which can save the emission of 11,458 tons of CO2 instead of 772 tons of CO2 from both 850 kW Vestas wind turbines installed in Bahrain (total 1.7 MW).
Bahrain, being an island with a small area (about 750 km2), may install an offshore wind turbine at the north of the Bahrain marine territory with a hub height 150 m, due to more average wind speed low exponent (α) of such site, and consequently harvest more electricity production.
Furthermore, Bahrain can install a transparent floating solar PV system offshore which will save land for commercial, industrial, or housing projects and reduce CO2 emission. Our future work will be concentrated on sizing the RE mix (especially wind and solar) using floating solar PV, offshore wind turbines, and floating wind turbines as made by Equinor [54].
It is advisable that Bahrain revises its RE initiative in the energy mix policy based on such finding. This is applicable to any country that has similar climate characteristics, topography, and in vicinity location (SEU and Sustainable Energy Unit, 2017; Al-Salem et al., 2018).
The original contributions presented in the study are included in the article/Supplementary Material; further inquiries can be directed to the corresponding author.
NA and WA were involved in the writing and collection of data. EA-K arranged for wind energy data. All authors contributed to the article and approved the submitted version.
This research was supported partially by the Arabian Gulf University.
The authors would like to thank the University of Bahrain and the Arabian Gulf University for their support. Special thanks go to Eng. Mohammed Alexander Al Samahiji, Executive Director and Project Manager, Sustainable Energy Unit, Kingdom of Bahrain, for his technical assistance. The authors would like to thank Luma AlSalah, English Language Instructor at the Arabian Gulf University, for editing the English language of the paper. Special thanks go to Nadr Ahmed and Hala Al-Ali, Directorate of Meteorology, for providing helpful weather information. Special thanks go to Ali Fardan, researcher in water technologies and renewable energy, Bahrain Aluminum Company (ALBA).
The authors declare that the research was conducted in the absence of any commercial or financial relationships that could be construed as a potential conflict of interest.
All claims expressed in this article are solely those of the authors and do not necessarily represent those of their affiliated organizations, or those of the publisher, the editors, and the reviewers. Any product that may be evaluated in this article, or claim that may be made by its manufacturer, is not guaranteed or endorsed by the publisher.
Ahmed, A. S. (2018). Wind energy characteristics and wind park installation in Shark El-Ouinat, Egypt. Renew. Sustain. Energy Rev. 82 (2), 734–742. doi:10.1016/j.rser.2017.09.031
Al-Ghussain, L., SamuTaylan, R. O., and Fahrioglu, M. (2020). Techno-economic comparative analysis of renewable energy systems: Case study in Zimbabwe. Inventions 5 (3), 27–13. doi:10.3390/inventions5030027
Al-Otaibi, A., Al-Qattan, A., Fairouz, F., and Al-Mulla, A. (2015). Performance evaluation of photovoltaic systems on Kuwaiti schools’ rooftop. Energy Convers. Manag. 95, 110–119. doi:10.1016/j.enconman.2015.02.039
Al-Salem, K., Neelamani, S., and Al-Nassar, W. (2018). Wind energy map of arabian Gulf. Nat. Resour. 9, pp212–228. doi:10.4236/nr.2018.95014
AlAli, M., and Emziane, M. (2013). Performance analysis of rooftop PV systems in abu dhabi. Energy Procedia, 42689–42697. doi:10.1016/j.egypro.2013.11.071
Alawadhi, E. M. (2022). The potential of wind energy in Kuwait: A complete feasibility investigation. J. Eng. Res. Online First Article. Kuwait University. doi:10.36909/jer.18167
Alharbi, M. M. (2021). “An assessment of greenhouse gas mitigation options for residential electricity consumption in the kingdom of Saudi Arabia: A case study of Al- qassim,”. MSc Thesis (Kingdom of Bahrain: Arabian Gulf University).
Alnaser, N. W. (2023a). A domestic rooftop PV system: A step towards retrofitting the built environment to combat climate change in Bahrain. Front. Built Environ. 9, 1178512. doi:10.3389/fbuil.2023.1178512
Alnaser, N. W., and Alnaser, W. E. (2019). Analyzing the impact of bapco 5 MW solar PV grid-connected project on Bahrain’s outlook for energy-mix production. Int. J. Mod. Nonlinear Theory Appl. 8, 72–91. doi:10.4236/ijmnta.2019.83006
Alnaser, N. W. (2023b). The performance of four domestic rooftop 7.8 kW–PV in the kingdom of Bahrain: Toward low building emission. J. Renew. Energy Environ. Sustain. 8, 6. Accepted in 30 March 2023. in Press. doi:10.1051/rees/2023002
Alnaser, W., Alnaser, N., and Batarseh, I. (2014). Bahrain’s BAPCO 5MWp PV grid–connected solar project. Int. J. Power Renew. Energy Syst. 1, 72–84.
Alnaser, W. E., Darwish, A, S., and Alnaser, N. W. (2020b). Feasibility of utilizing wind electricity for king abdulla medical city (KAMC) at kingdom of Bahrain. Arab Gulf J. Sci. Res. (AGJSR) 38 (1), 29–32. doi:10.51758/agjsr-01-2020-0003
Alnaser, W. E., Darwish, A. S., and Alnaser, N. W. (2020a). Feasibility of utilizing wind electricity for king abdulla medical city (KAMC) at kingdom of Bahrain. Arabian Gulf J. Sci. Res. 38 (1), 29–32. doi:10.51758/agjsr-01-2020-0003
Alnaser, W. E. (1993). The available wind power in Bahrain. Renew. Energy 3 (2–3), 185–188. doi:10.1016/0960-1481(93)90018-C
AlQdah, K. S., Alahmdi, R., Alansari, A., Almoghamisi, A., Abualkhair, M., and Awais, M. (2021). “Potential of wind energy in Medina, Saudi Arabia based on Weibull distribution parameters,” in In Medina, Saudi arabiabased on weibull distribution parameters (United Kingdom: Wind Engineering). Potential of wind energy. doi:10.1177/0309524x21102730309524X2110273
Alsabbagh, M., and Alnaser, W. E. (2022). Assessment of climate change mitigation readiness in the kingdom of Bahrain. Int. J. Clim. Change Strategies Manag. Int. J. Clim. Change Strategies Manag. 15, 391–411. Emerald Publishing Limited. doi:10.1108/IJCCSM-08-2021-0096
ANEMOI Energy Service (2020). How much electricity does a wind turbine produce? 3rd november 2020. Available at: http://anemoiservices.com/industry-news/how-much-electricity-does-a-wind-turbine-produce/.
Asif, M., HassanainNahiduzzaman, M. M. K. M., and Sawalha, H. (2019). Technoeconomic assessment of application of solar PV in building sector: A case study from Saudi Arabia. Smart Sustain. Built Environ. 8 (1), 34–52. doi:10.1108/SASBE-06-2018-0032
Banibaqash, A., Hunaiti, Z., and Abbod, M. (2022). An analytical feasibility study for solar panel installation in Qatar based on generated to consumed electrical energy indicator. Energies 15, 9270. doi:10.3390/en15249270
Chandak, P. (2023). Bahrain plans to double renewable energy to achieve 20% of energy mix by 2035, 10th may 2023, solarquarter.com. Available at: https://solarquarter.com/2023/05/10/bahrain-plans-to-double-renewable-energy-to-achieve-20-of-energy-mix-by-2035/.
Dell, J., and klippenstein, M. (2017). Wind power could blow past hydro’s capacity factor by 2020, greentechmedia (gtm), 8th Feb 2017. Available at: https://www.greentechmedia.com/articles/read/wind-power-could-blow-past-hydros-capacity-factor-by-2020 (Accessed on April 9, 2023).
Energy and Utilities (2022). Oman to gain more wind power with TotalEnergies+Veolia agreement. Available at; https://energy-utilities.com/oman-to-gain-more-wind-power-with-totalenergies-news118266.html (Accessed May 25, 2023).
equinor.com (2023). Floating wind: Industrializing floating offshore wind. Available at: https://www.equinor.com/energy/floating-wind (Accessed April 10, 2023).
Forsting, A. R. M., and Troldborg, N. (2015). The effect of blockage on power production for laterally aligned wind turbines. J. Phys. Conf. Ser. 625, 012029. doi:10.1088/1742-6596/625/1/012029
Gulf Daily News Online (2022). Kingdom on track to achieve green goals. 1st November 2022; Available at: https://www.gdnonline.com/Details/1146499 (accessed on April 13, 2023).
IEA (2023). Global CO2 emissions rose less than initially feared in 2022 as clean energy growth offset much of the impact of greater coal and oil use. Available at: https://www.iea.org/news/global-co2-emissions-rose-less-than-initially-feared-in-2022-as-clean-energy-growth-offset-much-of-the-impact-of-greater-coal-and-oil-use.
IF, International Finance (2021). Bahrain to cut 30% emission by 2035, vows net-zero emissions by 2060. Available at: https://internationalfinance.com/bahrain-to-cut-emission-by-2035-vows-net-zero-emissions-by-2060/ (November 4, 2021).
IGA (2016). Statistical abstract 30 may 2018. Available at: http://www.data.gov.bh/.
IRENA (2014). Pan-arab renewable energy strategy 2030: Roadmap of actions for implementation. Masdar City, United Arab Emirates: International Renewable Energy Agency.
Jowder, F. A. L. (2009). Wind power analysis and site matching of wind turbine generators in Kingdom of Bahrain. Appl. Energy 86 (4), 538–545. doi:10.1016/j.apenergy.2008.08.006
Kazem, H. A., Albadib Ali, M. H., Al-Waeli, H. A., Al-Busaidid, A. H., and Chaichan, M. T. (2017). Techno-economic feasibility analysis of 1 MW photovoltaic grid connected system in Oman. Case Stud. Therm. Eng. 10, PP131–141. doi:10.1016/j.csite.2017.05.008
Kazem, H. A., Khatib, T., Sopian, K., and Elmenreich, W. (2014). Performance and feasibility assessment of a 1.4 kW roof top grid-connected photovoltaic power system under desertic weather conditions. Energy Build. 82, 123–129. doi:10.1016/j.enbuild.2014.06.048
knoema.com (2023). World data atlas, the installed capacity of Bahrain. Available at: https://knoema.com/data/installed-capacity+bahrain (Accessed April 10, 2023).
Krarti, M., and Dubey, K. (2018). Benefits of energy efficiency programs for residential buildings in Bahrain. J. Build. Eng. 18, 40–50. doi:10.1016/j.jobe.2018.02.018
Méndez, C., and Bicer, Y. (2022). Assessment of wind energy potential and characteristics in Qatar for clean electricity generation. Wind Eng. 46 (2), 598–614. doi:10.1177/0309524X211043855
Osman, A. M., and Alsokhiry, F. (2022). Control design and performance evaluation of a grid connected PV–wind power system: A case study of Dongola, Sudan. Energy Rep. 8, 15629–15653. doi:10.1016/j.egyr.2022.11.145
Power Technology, (2023). Power plant profile: Bahrain solar PV park, Bahrain. Available at: https://www.power-technology.com/marketdata/power-plant-profile-bahrain-solar-pv-park-bahrain/.
Perez, I. A., Garcia, M. A., Sanchez, M. L., and Torre de, B. (2004). Analysis of height variations of sodar-derived wind speeds in northern Spain. J. Wind Eng. Industrial Aerodynamics 92, pp875–894. doi:10.1016/j.jweia.2004.05.002
Pillai, G., and Naser, H. A. Y. (2018). Techno-economic potential of largescale photovoltaics in Bahrain. Sustain. Energy Technol. Assessments 27, 40–45. doi:10.1016/j.seta.2018.03.003
SCE 1Supreme Council for Environment (2020). Bahrain's Third national communication, executive summary, kingdom of Bahrain. https://unfccc.int/sites/default/files/resource/9143680_Bahrain-NC3-2-SCE%20Third%20National%20Communication%202020.pdf.
SCE2, Supreme Council for Environment (2020). Bahrain’s Third national communication, full report, kingdom of Bahrain. Available at: https://www.sce.gov.bh/Media/Documents/%D8%AA%D9%82%D8%B1%D9%8A%D8%B1%20%D8%A7%D9%84%D8%A8%D9%84%D8%A7%D8%BA%20%D8%A7%D9%84%D9%88%D8%B7%D9%86%D9%8A%20%D8%A7%D9%84%D8%AB%D8%A7%D9%84%D8%AB/SCE%20book%20Executive%20Summery%20ENGLISH-%2012%20july.pdf.
SEU, Sustainable Energy Unit (2017). National renewable energy action plan (NREAP). Available at: https://www.climate-laws.org/document/bahrain-s-national-energy-efficiency-action-plan-neeap_47c5 (Accessed April 10, 2023).
Shams, M. B., Haji, S., Salman, A., Abdali, H., and Alsaffar, A. (2016). Time series analysis of Bahrain's first hybrid renewable energy system. Energy 103, 1–15. doi:10.1016/j.energy.2016.02.136
Sustainable Energy Unit (SEU) (2017b). The kingdom of Bahrain – national renewable energy action plan (NREAP), january. Bahrain: Sustainable Energy Unit.
Sustainable Energy Unit (SEU) (2017a). The kingdom of Bahrain–national energy efficiency action plan (NEEAP), january. Bahrain: Sustainable Energy Unit.
Tatweer Petroleum, (2019). “Solar power in the Bahrain oil Field,” in International Sustainable Energy Event 2019 (iSEE 2019), kingdom of Bahrain, April 2019, 17–18.
Twiddle, J., and Weir, T. Renewable energy resources. 2011. London and New York: E&FNSpon, Ty;or and Frances Group.
US Energy Information Administration (USEIA) (2019). Levelized cost and levelized avoided cost of new generation resources in the annual energy outlook 2019, february. Washington, United States: USEIA.
volker-quaschning.de, (2023). Specific carbon dioxide emissions of various fuels. Available at: https://www.volker-quaschning.de/datserv/CO2-spez/index_e.php (Accessed April 10, 2023).
voltaconsolar.com (2023). 1kw wind turbine: Hybrid off-grid wind and solar systems. Available at: https://voltaconsolar.com/off-grid-kits/wind-generators.html (Accessed April 11, 2023).
Worldmeter (2023). Bahrain CO2 emissions. Available at: https://www.worldometers.info/co2-emissions/bahrain-co2-emissions/.
Zander, E. (2011). Wind power, capacity, watts, and kilowatts hours-how is it all connected ? EWEA blog. Available at: https://www.ewea.org/blog/2011/01/wind-power-capacity-watts-and-kilowatt-hours-%E2%80%93-how-is-it-all-connected/(Published 10 Jan 2011.
Zawya Projects’ Writer (2022). Bahrain invites proposals 72MW multi-site solar photovoltaic PPP power project. Available at: https://www.zawya.com/en/projects/utilities/bahrain-invites-proposals-72mw-multi-site-solar-photovoltaic-ppp-power-project-bvvaqg3n (August 18, 2022).
Keywords: wind electricity, solar electricity, climate change, CO2 emission, renewable energy target
Citation: Alnaser NW, Alnaser WE and Al-Kaabi EAD (2023) Evaluating solar and wind electricity production in the Kingdom of Bahrain to combat climate change. Front. Built Environ. 9:1210324. doi: 10.3389/fbuil.2023.1210324
Received: 22 April 2023; Accepted: 23 June 2023;
Published: 07 July 2023.
Edited by:
Assed N. Haddad, Federal University of Rio de Janeiro, BrazilReviewed by:
Shaik Saboor, Vellore Institute of Technology, IndiaCopyright © 2023 Alnaser, Alnaser and Al-Kaabi. This is an open-access article distributed under the terms of the Creative Commons Attribution License (CC BY). The use, distribution or reproduction in other forums is permitted, provided the original author(s) and the copyright owner(s) are credited and that the original publication in this journal is cited, in accordance with accepted academic practice. No use, distribution or reproduction is permitted which does not comply with these terms.
*Correspondence: N. W. Alnaser, bmFsbmFzZXJAdW9iLmVkdS5iaA==
Disclaimer: All claims expressed in this article are solely those of the authors and do not necessarily represent those of their affiliated organizations, or those of the publisher, the editors and the reviewers. Any product that may be evaluated in this article or claim that may be made by its manufacturer is not guaranteed or endorsed by the publisher.
Research integrity at Frontiers
Learn more about the work of our research integrity team to safeguard the quality of each article we publish.