1 Introduction
One of the most important issues in the seismic design of structures is related to the form in which the energy of an earthquake is introduced and dissipated in buildings. Up to the 50s of the 20th century, the seismic design of structures was based, overall, on elastic criteria with the absence of damage. Later, the seismic design evolved to enable plastic deformations in the structure under severe earthquakes for economic reasons, and this was reflected in the use of reduction factors for the lateral strength based on the ductility coefficient, , where and are the maximum displacement and the yield displacement of the i story. Since that time, the use of equivalent lateral forces allowing inelastic deformations in seismic designs has been a practice accepted worldwide and incorporated into most of the standards. Nevertheless, the force-based design methodology has not yet solved the problems derived from the damage concentration of the seismic actions that lead to severe damage and even the collapse of structures when moderate or strong earthquakes occur. Most of the standards put forward heuristic recommendations or criteria for the safe seismic design of structures, like symmetry, absence of irregularities in the geometry of the buildings, or the hierarchy of damage in structural elements based on the strong column-weak beam, that show deficiencies in practice (Kuntz and Browning, 2003). Furthermore, different studies have shown that the simplified lateral load patterns proposed by standards do not lead to a uniform ductility demand distribution in building structures (Mohammadi et al., 2004; Chopra, 2011). By contrast, there are some approaches in the literature aimed to address the problem of damage concentration. They propose optimization procedures and formulations of lateral load patterns or their equivalent strength distributions for the seismic design of structures to achieve a uniform distribution of the damage expressed in terms of deformations or dissipated energies. The lateral load pattern is defined by the relationship , where Fi and Qy,1 are the lateral force of the i-th story and the yield shear force at the first story—base shear force, respectively. The most important drawback is that the optimum strength or lateral load pattern distribution is different for each ground motion. Then, differences between the actual and the “ideal” even distribution of the damage are expected in structures when they are subjected to different ground motions.
The approaches based on the control of the lateral deformations of the structure are aimed at achieving a uniform distribution of the interstory drift, , or . Connor et al. (1997) formulated an expression for the optimum distribution of the lateral stiffness of building structures to achieve a uniform distribution of . Medina (2004) proposed an iterative procedure to obtain the optimum strength distribution that led to a uniform ductility distribution in two up to 18-story RC structures using the Clough model for the constitutive model on each story. This procedure was applied on each system using a set ground motion records, obtaining the optimum distribution in each case. Then, he formulated a simplified relationship that depended on the fundamental period, T, the number of stories¸ N, and based on the median of the optimum distributions obtained in calculations. Moghaddam and Hajirasouliha (2006) applied the Theory of Uniform Deformations which proposed that structures became lighter as deformation was distributed uniformly. In this case, the average was used instead of the median values as the representative optimum distribution among the obtained by applying an iterative procedure to a set of records on structures with EPP models. Later, the authors applied the procedure to buildings with a wider range of T (between 0.1 and 3 s) and formulated an optimum load pattern to achieve the uniform ductility distribution that depended on T and (Hajirasouliha and Moghaddam, 2009). Li et al. (2019) used the optimization procedure proposed by Moghaddam and Hajirasouliha (2006), considering different classes of soils and ground motions—far-field and pulse-like near-field records—to formulate an expression for the optimum lateral load pattern to achieve the uniform ductility distribution at the collapse state using hysteretic models with different degrees for the degradation of stiffness that represents the pinching effect of RC structures. The formulation depends on T, N, , and , where is an incremental factor for soft soils and pulse-like near-field earthquakes. Furthermore, other approaches propose optimization procedures through numeric evaluations with ground motion records to obtain lateral load patterns for achieving a uniform distribution of (Montuori et al., 2019). Besides that, the soil-structure interaction has also been considered to obtain the optimum lateral load pattern that achieves the uniform ductility distribution for the design of elastic structures (Ganjavi and Hao, 2013) and non-linear structures with EPP models (Ganjavi et al., 2016) and RC models with strength and stiffness deterioration—Ibarra-Medina-Krawinkler model (Ibarra et al., 2005; Bai et al., 2020).
On the other hand, there are approaches aimed at achieving a uniform distribution of the dissipated energy which is the main goal of the energy-based methods. Akiyama (2000), Akiyama (2003) proposed and demonstrated that the lateral strength of the stories in a structure should be “optimal” to achieve a uniform distribution of the damage. For this purpose, the damage of the i story was expressed through the dimensionless parameter which is defined as the ratio of the energy dissipated by the story, Wp,i, and divided by the product of , where Qy,i is the yield shear force of the story. In turn, Qy,i can be dimensionless and expressed through the yield shear-force coefficient defined as , where M is the total mass of the structure and , where mj is the mass of the j-th story, is the total number of stories, and g is the gravity acceleration. Then Akiyama (2000), Akiyama (2003), defined the optimum yield shear-force coefficient distribution as the ratio , where was the yield shear-force coefficient that led to a uniform distribution of . Akiyama (2000), Akiyama (2003) showed that the approach for a uniform distribution of proposed by the Japanese Code from 1950 to 1981 led to a damage concentration at the upper stories. Furthermore, he applied an iterative procedure to obtain an optimum strength distribution where structures—EPP models—with three, five, seven, and nine stories were subjected to non-linear time history analysis using the El Centro (1940) ground motion record, varying until achieving . He formulated an expression for by fitting the distributions obtained previously; hence, its values depend only on the location of the story. Furthermore, there are simple approaches for which depend only on (Deguchi et al., 2008) or depend on and T such as that formulated by the Japanese Building Code (Building Research Institute, 2009b). Benavent-Climent (2011) put forward an expression for EPP models that depends on the stiffness distribution, T, and the predominant period of the ground motion, TG. Donaire-Ávila (2013) and Donaire-Ávila and Benavent-Climent (2020) formulated an equation of for structures equipped with hysteretic dampers—only the latter undergo plastic deformations, which depends on the modal properties, the hysteretic energy demand and the distribution of stiffness and masses.
Unlike the approaches for which the damage is based on the maximum lateral deformations, the use of optimization algorithms to obtain are scarce. Donaire-Avila et al. (2018) used the direct search methodology for the optimization of n-dimensional functions to obtain in structures (EPP models) with three and six stories subjected to near- and far-field records. Furthermore, Donaire-Avila et al. (2020) put forward a new proposal for for low and mid-rise shear-type buildings. Such types of building are those with an aspect ratio—a height to width ratio approximately lower than six (Connor, 2003), for which the contribution of the shear to the lateral deformations of the building is significantly higher than that of the bending deformations. An optimization procedure was applied to achieve a uniform distribution of in the building structures through numeric evaluations of EPP models designed for different soil classes and ductility levels and obtained for each of the ordinary ground motion records selected for each soil class. The mean of the obtained for each set of records was the approach with the lower dispersion for . Moreover, two predictive equations—polynomial and simplified for design purposes—were also formulated, which depended on the soil class N and .
This study sheds light on the influence of the constitutive model in the damage distribution of low and mid-rise shear-type buildings subjected to seismic actions along one of their principal directions—planar analysis. The structures were designed with energy-based methods by using different approaches for optimum strength distributions. Accordingly, the constitutive models Clough and Modified Clough that characterize the reinforced concrete (RC) structures are used and the results are compared with those obtained in structures with EPP constitutive model. Results in terms of energy dissipation and its deviation with respect to the even distribution are shown and discussed. The main limitation of the study is that it addresses only low and mid-rise shear-type buildings. In future studies, investigating the influence of the global flexural deformation that can be relevant in high-rise buildings and extending the analysis to spatial models subjected to more than one component of the seismic action is recommended.
2 Methodology
This study focuses on the distribution of damage among stories in building structures designed with different optimum strength distributions and considers different constitutive models for the shear force-interstory drift relationship. Several low-to-moderate height shear-type buildings were designed (prototype structures) following the Housner-Akiyama (Akiyama, 2000; Akiyama, 2003) energy-based methodology. The differences among prototypes were: i) the lateral strength of each story that varied according to the distribution used and ii) the constitutive model used to represent the restoring force characteristics of the stories. The nonlinear dynamic response of each prototype structure under different ground motions was obtained through time history analysis. The capability of each distribution of lateral strength to reach an even distribution of damage with different constitutive models was investigated. The methodology applied consists of the following steps:
1. Selection of realistic distributions of mass and lateral stiffness for the benchmark prototype structures.
2. Calculation of the base shear-force coefficient of each prototype structure by applying the energy-based approach proposed by Akiyama (2000), Akiyama (2003) for a given amount of input energy EI (expressed in terms of equivalent velocity ) and for a specific level of damage characterized by parameter which is, in turn, related to the ductility demand .
3. Calculation of the shear-force coefficient of the upper stories (i > 1) using the different optimum distributions , i.e., .
4. Development of a numerical model for each prototype structure using different constitutive models for the shear force-interstory drift relationships.
5. Selection of ground motion records and scaling to the VE adopted in the design.
6. Non-linear time history analyses of the numerical models and evaluation of the damage distributions.
3 Benchmark prototype structures
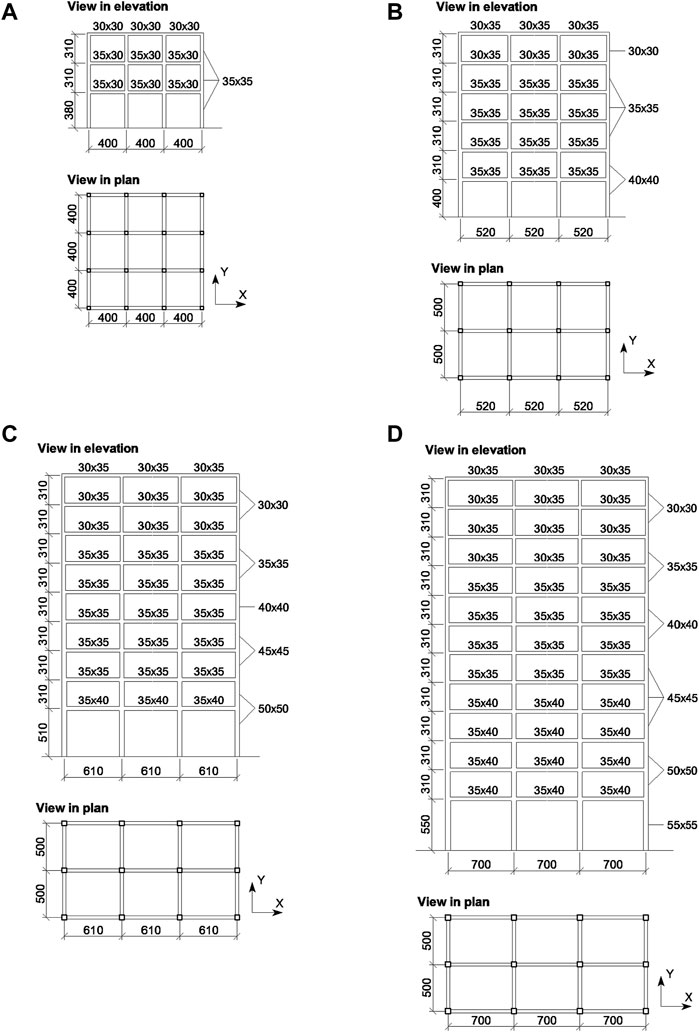
Prototype structures—benchmark—of 3, 6, 9, and 12 stories used by the authors (Donaire-Avila et al., 2020) in previous studies are used here, modifying only the constitutive models for the shear force-interstory drift relationship. Figure 1 illustrates the geometry of them as well as the structural elements—beams and columns. They have a fundamental period of 0.40 s, 0.80 s, 1.2 s, and 1.6 s, respectively, with a uniform mass distribution (). The distribution of the lateral stiffness of the prototype structures varied linearly from the first story k1 to the top story kT, with k1/kT equal to 1, 1.5, 2.0, and 2.5.
The base shear-force coefficient of each prototype structure was determined by applying the energy-based design methodology proposed by Akiyama (2000), Akiyama (2003) for a given input energy demand EI and the expected level of damage . In this calculation of , the optimum shear coefficient distribution proposed by Akiyama was used. The input energy EI, expressed in terms of the equivalent velocity VE, was obtained from the study carried out by Donaire-Avila et al. (2020) by applying the ground motion prediction equation developed by Cheng et al. (2014), whose functional form is defined by a set of variables which were applied in this case as follows: i) a moment magnitude for the earthquake, Mw = 6.5; ii) a reverse or oblique-reverse fault type; iii) the closest distance to a fault of 10 km; iv) set of coefficients that depend on T; iv) the average shear-wave velocity in the top 30 m, Vs30. The moment magnitude and the fault type were established to ensure later in the non-linear evaluations a minimum number of records that achieve the target input energy in a wide range of periods, preventing the use of large-scale factors. The closest distance to the fault was determined to obtain a significant input energy VE for each benchmark prototype structure that leads to reasonable values for the base shear coefficient . Furthermore, two types of soils were considered: soil class B (dense soil) and C (dense or medium-dense soil), according to Eurocode 8 Part I (Eurocode 8, 2004), which are characterized by m/s and m/s, respectively. Then, two values of VE were obtained for each benchmark structure; one per soil class, which are reported in Table 1.
The expected level of damage was determined for two ductility levels: and through the relationship proposed by Akiyama (2000), Akiyama (2003) giving and 10.5, respectively. Then, four different values were obtained for on each benchmark prototype structure and are reported in Table 1. These are relatively low and can be endured by bare frames. This led to sixteen cases being investigated.
4 Design of prototype structures with different optimum shear coefficient distributions
According to the energy-based design methodology, once is determined, the shear strength of the rest of the stories is obtained through the expression such that This analysis is carried out independently in two orthogonal horizontal directions of the building using 2D models, but torsional effects due to eccentricities between the center of stiffness and the center of mass of each story can be taken into account in the formulation (Building Research Institute, 2009a). Nevertheless, in this work, for the sake of simplicity, the eccentricities between the center of stiffness and the center of mass have been neglected. Different expressions proposed in the literature for are investigated in this study. All the optimum distribution used were derived for systems with EPP restoring force characteristics.
4.1 Optimum distributions for systems with EPP restoring force characteristics
Five optimum distributions were considered in this study. First, the three versions proposed by Donaire-Avila et al. (2020). Second, Akiyama’s approach (Akiyama, 2000; Akiyama, 2003), is an important reference of the literature. Lastly, the proposal of the Japanese Building Code (Building Research Institute, 2009b), which is the unique standard until now that has formulated an expression for it. Then, 80 prototype structures are considered (= four buildings x two soil classes x two ductility levels x five approaches for ).
The optimum distribution proposed by Donaire-Avila et al. (2020) was obtained from an optimization procedure based on non-linear time history analysis (NLTHA) applied to 3, 6, 9, and 12-story prototype building structures designed as stated above for two ductility levels and two soil classes. The numerical model of each prototype structure, a lumped-mass model with EPP restoring force characteristics, was subjected to a seismic record in an iterative process. In each iteration, the strength distribution of the model, except , was varied until an even distribution of damage was reached. The optimum distribution obtained in this way for a given record is denoted by herein. This procedure was applied to 15 ground motion records for each soil class. The mean of the optimum shear coefficient distribution obtained for each prototype building subjected to each set of records, , was determined.
Then, a predictive equation for was obtained using a third-order polynomial least-square fitting over , denoted by and shown in Eq. 1.
The zi coefficients were obtained for each soil class and ductility level and can be found elsewhere (Donaire-Avila et al., 2020). Eventually, a simplified expression of was obtained for design purposes, denoted by . Eqs 2, 3 show for soil class B and soil class C, respectively.
where N is the number of stories of the building; , where i is the story level (i = 1 for the first story and i = N for the top story).
The optimum distribution proposed by Akiyama, herein, is expressed as follows:
Finally, the expression proposed by the Japanese Building code, herein, is:
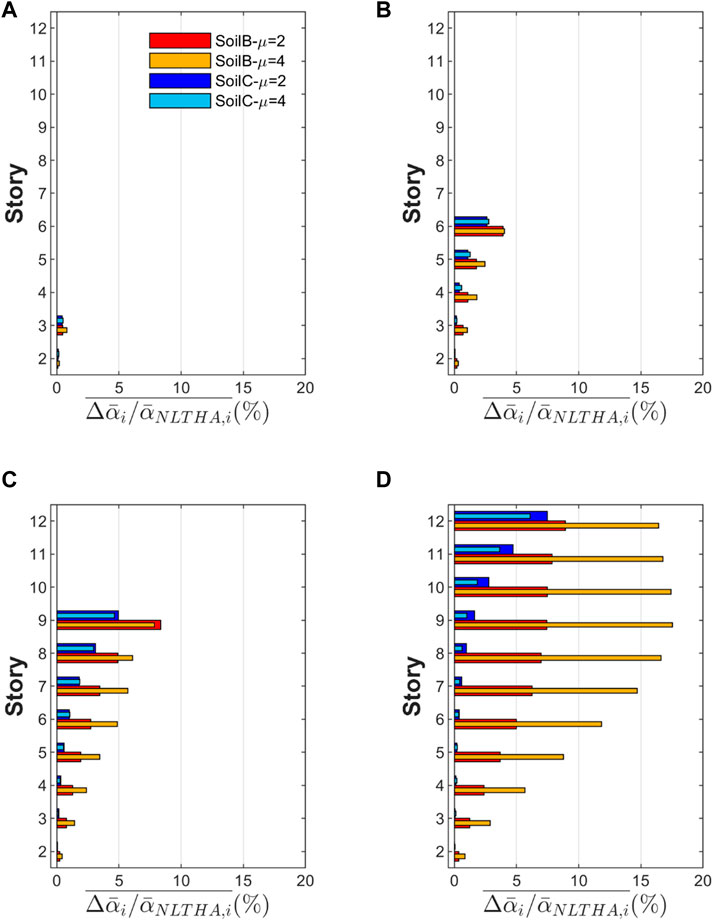
Among the different approaches , and analyzed by Donaire-Avila et al. (2020), the former showed the lowest deviations with respect to the uniform distribution. Figure 2 shows the mean of the difference (in %) of over , denoted by . The values are positive in either case. It is important to note that positive deviations in a given story means overstrength in the story with respect to the optimum value and this tends to decrease the damage to the story. Further, when the deviation is positive in all the stories, the damage will tend to concentrate on those stories with the lowest overstrength. For 3 and 6-story buildings the differences are negligible. For 9 and 12-story buildings, the differences are higher in the upper stories due to the influence of the higher vibration modes but in general lower than 10%. Only the 12-story building designed for Soil Class B and exceeds this value, reaching 15%–17% in the upper stories. and showed larger differences than (Donaire-Avila et al., 2020). Then, is considered as the best optimum distribution in this study.
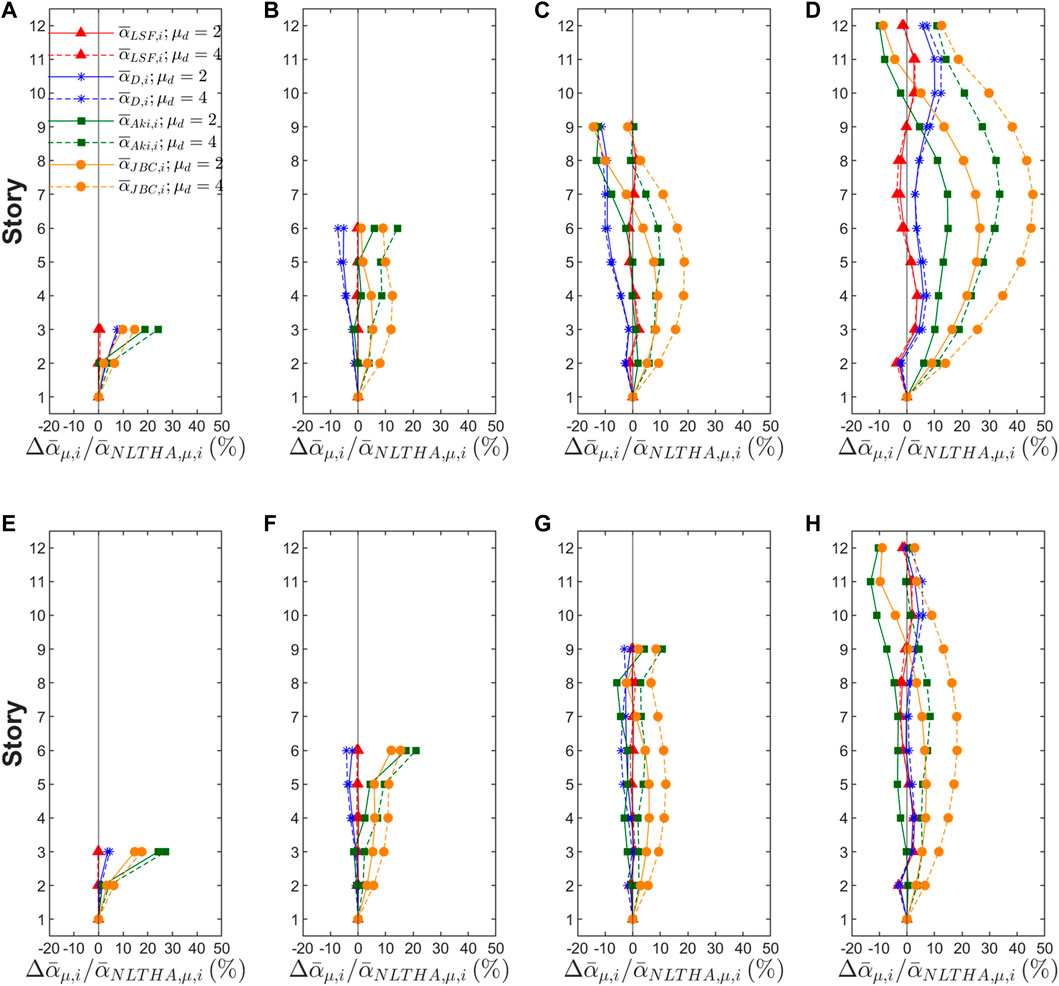
Next, the differences with respect to of , , and are evaluated. Such differences are denoted by . Figure 3 illustrates the ratio (in %) for (solid lines) and (dashed lines). Overall, larger positive differences are observed for . shows a good agreement with . In this case, the maximum differences range between 2% and 4% for 9 and 12-story buildings, respectively. On the other hand, shows differences within 5% but reaching up to 10% in 9 and 12-story buildings for Soil Class B. In the case of , significant differences—positive—are observed at the uppermost story in 3-story buildings which range between 20% for Soil B and 28% for Soil C. Then, the damage is expected to concentrate on the lower stories. For 6-story buildings, the differences—positive—reach at most 10% at the uppermost story. Nevertheless, for 9 and 12-story buildings the highest differences—positive—are observed for Soil B and . They concentrate on the intermediate stories, reaching 10% for the former and 30% for the latter. Finally, and show similar trends though the differences observed at intermediate stories of the 9 and 12-th story buildings are even higher, having reached values up to 20% and 45% for Soil B and , respectively.
5 Damage distribution in structures with different constitutive models
This section investigates the distribution of damage on the prototype structures designed with the optimum distributions described in Section 4 for different constitutive models to describe the restoring forces: the EPP, the Clough model, and the Modified Clough model.
5.1 Numerical models
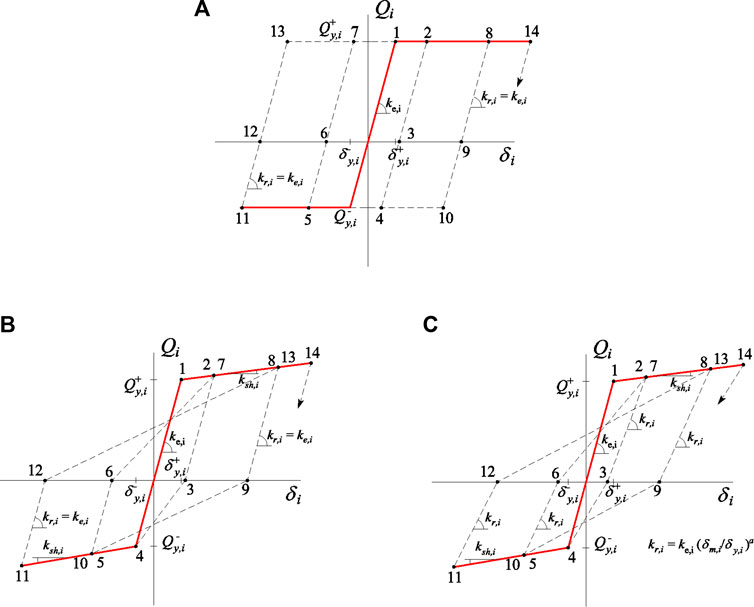
The prototype structures were represented by a lumped-mass model with one translational degree of freedom per level. Three constitutive models were considered in this study for the shear force-interstory drift relationships (Figure 4): i) the EPP model, ii) the Clough model (Clough and Johnston, 1966), and iii) the Modified Clough model (Otani, 1981). The first one is used to represent the mechanical behavior of steel structures and was also the main reference used by Akiyama (2000), Akiyama (2003) to develop the energy-based design methodology applied to multistory buildings. The Clough model and the Modified Clough model are two of the most widely used models to characterize the hysteretic behavior of reinforced concrete structural elements. They are phenomenological models based on experimental investigations that have been validated by many studies for the simulation of the monotonic and cyclic behavior of reinforced concrete (RC) structures (Gupta et al., 2001; Grammatikou et al., 2019). The postyield stiffness was established to be null, for both models, in order to avoid a favorable condition against the damage concentration when (Akiyama, 2000; Akiyama, 2003). Nevertheless, they are different in the unloading stiffness of the i story, kr,i. For the Clough model, kr,i remains constant and equal to the initial lateral stiffness of the story ke,i. But for the Modified Clough model, kr,i shows a progressive degradation with the maximum interstory drift, following the law , where a is a constant that is calibrated with tests. Akiyama 2000, Akiyama, 2003 proposed to use . Recently, based on an extensive experimental investigation, Grammatikou et al. (2019) proposed the expression , where Ls is the shear span and h is the depth of the transverse section of the structural element. For the size of the members of the prototype structures used in this study (Figure 1), the expression proposed by Grammatikou et al. (2019) gives a between −0.50 and −0.33. The value adopted in this study (a = 0.50) is within this range.
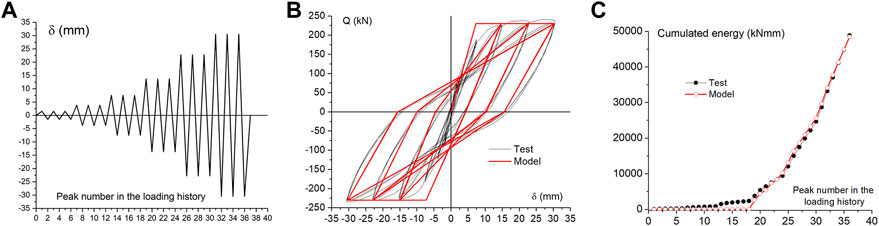
To further validate the Modified Clough numerical model (with a = 0.50) used in this study against experimental results, the prediction provided with this model was compared with the tests conducted by Lynn et al. (1996) on an RC column subjected to imposed lateral cyclic deformations. The details of the tests can be found in the reference (Lynn et al., 1996). Figure 5A shows the history of loading. Figure 5B shows with thin lines the experimental lateral force-displacement Q-δ curves and with bold lines the prediction. It can be seen that the numerical model captures well the shape of the hysteretic loops. Finally, Figure 5C compares the energy dissipated by the numerical model and by the test specimen up to each peak of the history of the loading plot in Figure 5A. It can be seen that both histories of dissipated energy are very close.
Accordingly, 240 (=80·3) numerical models were built for the analysis, 120 for each soil class. The Rayleigh damping model was considered for an equivalent damping ratio .
5.2 Selection of ground motion records
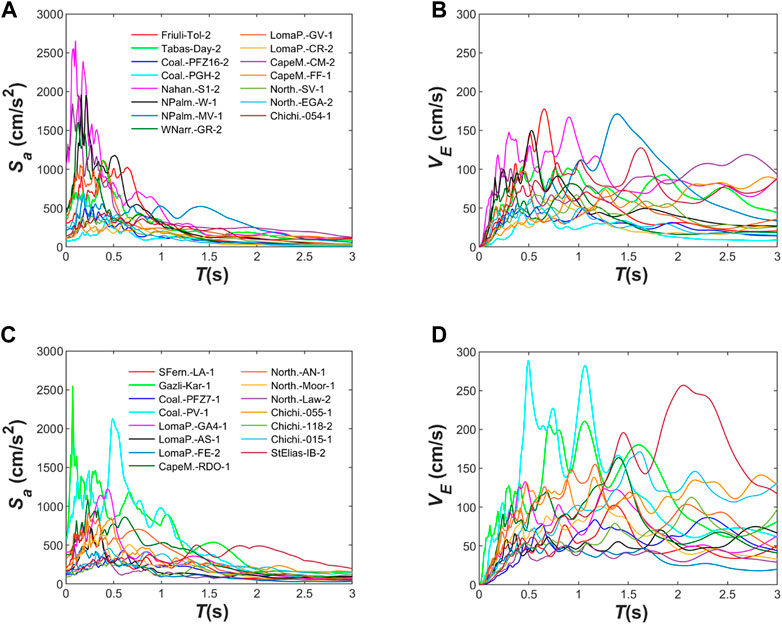
The ground motions used in this study are the same employed by Donaire-Avila et al. (2020). Two sets of ground motion records were selected, fifteen for each soil class −30 in total, obtained from the database of Campbell and Bozorgnia (2007) by excluding the records with and the pulse-like type. Figure 6 illustrates the spectra of Sa and VE of the selected ground motion records, where Sa is the response acceleration. The scale factor applied to each record for matching VE (Table 1) was lower than four.
5.3 Damage evaluation
The numerical models were subjected to the selected set of ground motion records and the response was obtained through non-linear time history analysis (NLTHA). This entailed 3,600 dynamic evaluations (= 120 numerical models x 2 soil classes x 15 records per soil class). They were conducted with OpenSees (2022).
5.3.1 Results in terms of and
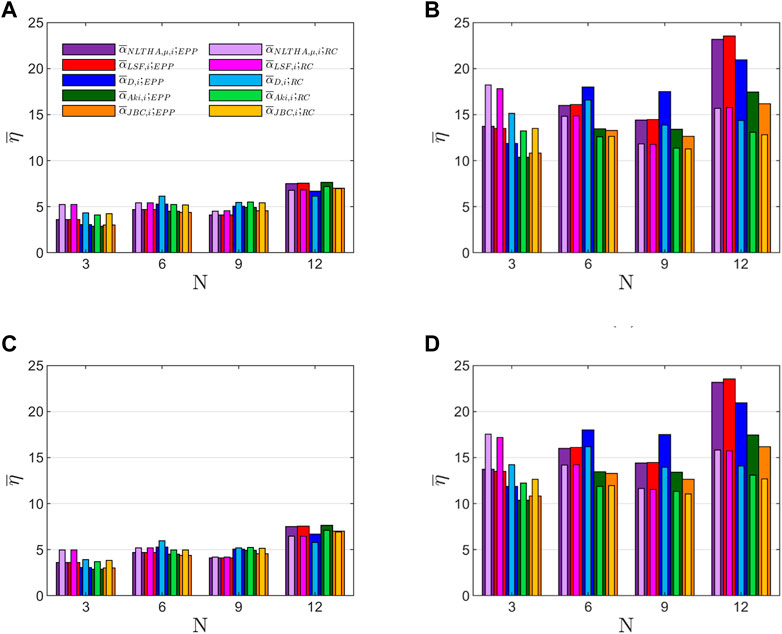
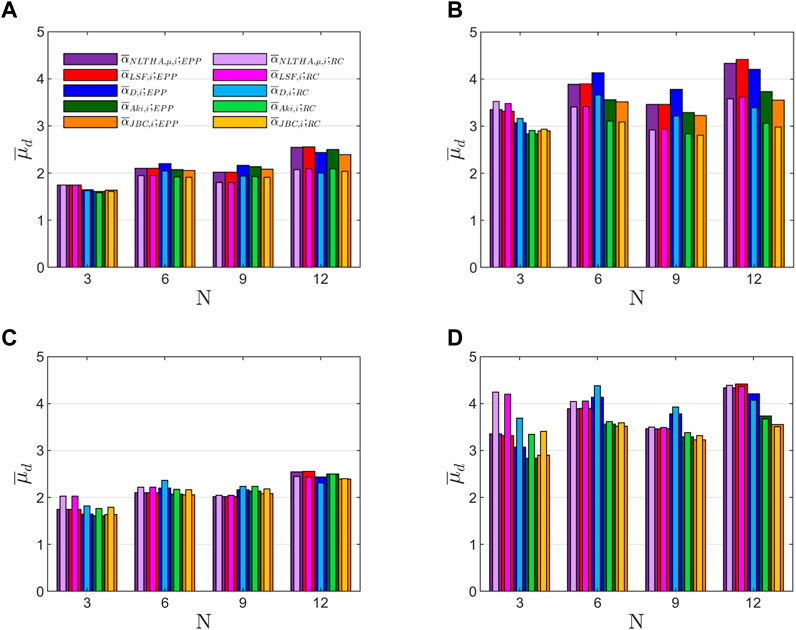
The energy dissipated—normalized by the product — by the i story of each prototype structure subjected to the ground motion j, , was calculated. Next, the average of among the stories, , was obtained as well as the average among the set of records, . Figures 7, 8 show calculated from the data obtained in the analysis. In designing the prototype structures, and 10.5 were considered for the ductility levels and 4, respectively. For 3, 6, and 9-story structures designed with in Soil Class B, the results obtained with the EPP model offer values of range between three and five with a coefficient of variation COV from 0.2 to 0.3. On the one hand, for those designed in Soil Class C, the variation is between 2.5 and 3.7 with a COV from 0.3 to 0.5. A similar behavior was observed when the Clough model and the Modified Clough model were used: ranges between 3.5 and 5.2 for both Soil Class B and C with COV from 0.3 to 0.5. Furthermore, the 12-story structures designed with , show higher values than the lower structures, especially for Soil Class B and the RC constitutive models for which ranges between 5.5 and 7 with COV from 0.3 to 0.5.
On the other hand, structures designed with showed higher than the proposed design (). Overall, for Soil Class B, the results obtained for with EPP models are higher than the results obtained with RC models—except for 3-story buildings—and conversely for Soil Class C. Furthermore, the results obtained for with EPP models range between 10 and 15 (except for 12-story buildings in Soil Class B with ranges between 15 and 25). The highest values ( ) correspond to the structures designed with and its two predictive approaches and . Nevertheless, in the case of RC models, ranges between 10 and 15 for Soil B and between 15 and 22 for Soil C. For 3-story buildings, the results obtained for with RC models are higher in either case than with EPP models, where ranges between 15 and 22.
It is important to note that the differences observed for between the results obtained with the Clough model and the Modified Clough model are negligible.
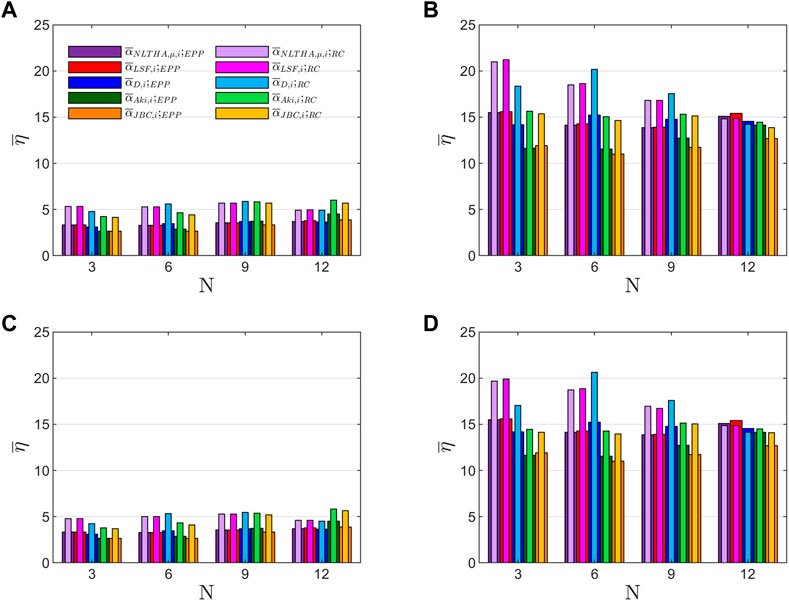
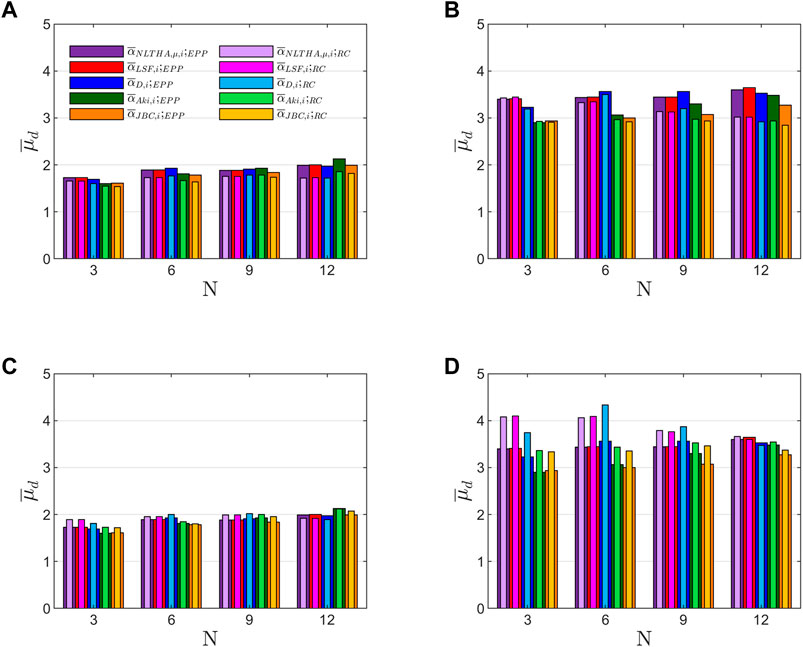
The same procedure described above to obtain was also applied to obtain the ductility factor for each i story and ground motion j, , the average among the stories, and, finally, the average among the set of records, . Figures 9, 10 illustrate the values of obtained from the calculations. It can be observed that the values of are close to the ductility factors considered to design the prototypes for and between 3 and 4.3 for those designed for . Conversely to the results obtained for , the values of obtained from the analyses using the Clough Model and the Modified Clough model show significant differences, being higher for the latter and closer to the values considered for the design.
Moreover, it can be observed that, overall, is higher and is lower than the considered value to design the prototype structures, respectively, especially for structures with . This can be explained by the differences observed for the ratio between the obtained values in the analysis and for the design, where —and then . The ratio forms part of the relationships or which represents the relationship between the dissipated energy and the maximum displacement in the energy-based design methodology (Akiyama, 2003; Manfredi et al., 2003; Benavent-Climent et al., 2021). The ratio is known by different names in the literature but it is preferable to refer to it as the equivalent number of yield excursions, neq (Khashaee et al., 2003). The design of the prototypes was made considering for both EPP and RC constitutive models (Akiyama, 2000; Akiyama, 2003). The estimation of from the numeric analysis was made as follows. Firstly, the ratio was obtained for each story of the prototype structures subjected to the ground motion j. Next, the mean among the stories was calculated, , and finally the mean for each set of records was . The results obtained in EPP models for range between 3.5 and 5 in structures designed with and between 5.5 and 7 for those designed with , without appreciable differences in the soil type. For Clough models, ranges between 7 and 10 and for Modified Clough models between 4 and 7. Then, is higher than that considered for the design of the structures. This is coherent with the type of earthquakes—far-field—used in this study, for which high values of are expected (Manfredi et al., 2003). This demonstrates the conservative criterion used by Akiyama, 2000, Akiyama, 2003) in order to obtain but it is detrimental with respect to the actually observed—on average—in the structures.
5.3.2 Influence of the constitutive models in the damage distribution
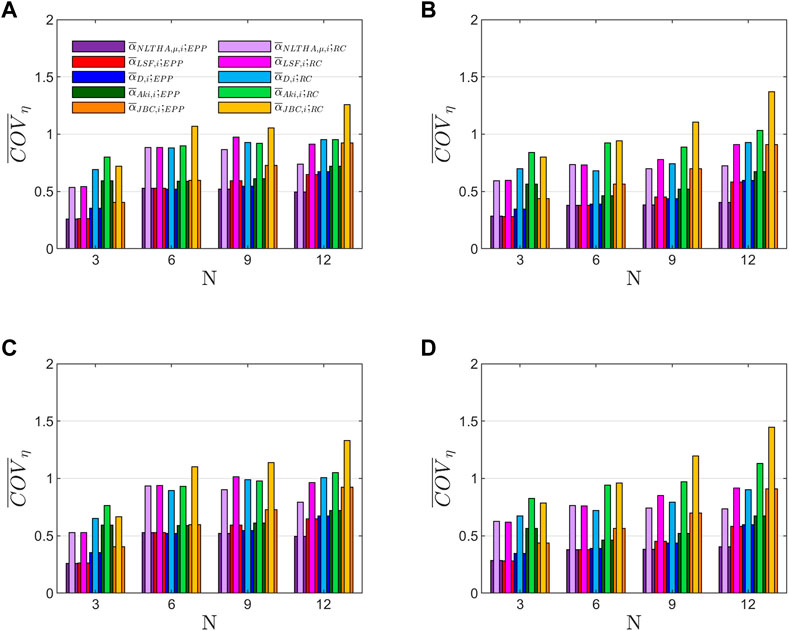
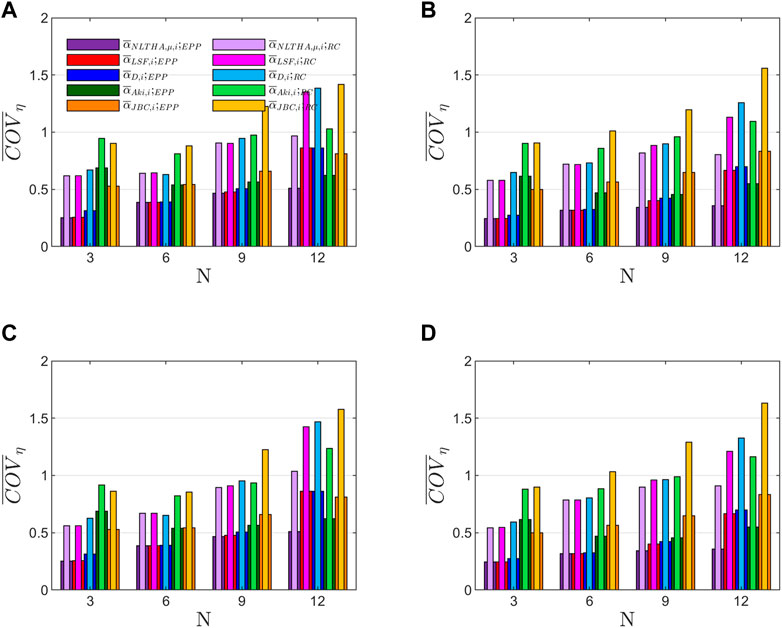
The energy-based design methodology proposes to design the structures using an optimum shear strength distribution such that—ideally—the energy dissipated by plastic deformations is evenly distributed (). Nevertheless, this is difficult to achieve in practice because the optimum distribution is different for each specific ground motion. Then, variations of with respect to the evenly distributed are always expected. This section quantifies these variations through the coefficient of variation (COV) of obtained as follows. First, the coefficient of variation of is obtained for each structure when it is subjected to the ground motion j, , and then, the average among the obtained in the set of records, .
Figures 11, 12 illustrate obtained for the prototype structures designed with the different approaches of in Soil Class B and C, respectively, by using EPP, Clough, and Modified Clough constitutive models. Overall, minor differences were observed in the distribution of between structures with Clough models and structures with Modified Clough models. Moreover, they offer similar values for both and , hence, any of them can be used to determine the damage distribution in terms of dissipated energy of RC structures.
Next, the differences for between EPP and RC structures (Clough model or Modified Clough model) are studied. For EPP models, the structures designed with showed the lowest values of which ranges between 0.25 and 0.50, regardless of the soil type and the ductility level. The structures designed with and show results similar to except for 12-story buildings where is 50% and 100% higher for soil classes B and C, respectively. Structures that follow show moderate increments over and except for 3-story buildings which is twice. Finally, structures designed with show the highest values of which range between 0.4–0.6 for 3 and 6-story buildings and 0.7–0.9 for 9 and 12-story buildings. On the other hand, the results obtained with RC models show, overall, significant increments of which range between 50% and 100% than the observed values in EPP models. Then, RC structures show a more irregular damage distribution than the structures with EPP restoring force characteristics.
Moreover, Figures 11, 12 show that there are no appreciable differences for among structures with different ductility levels.
5.3.3 Damage concentration
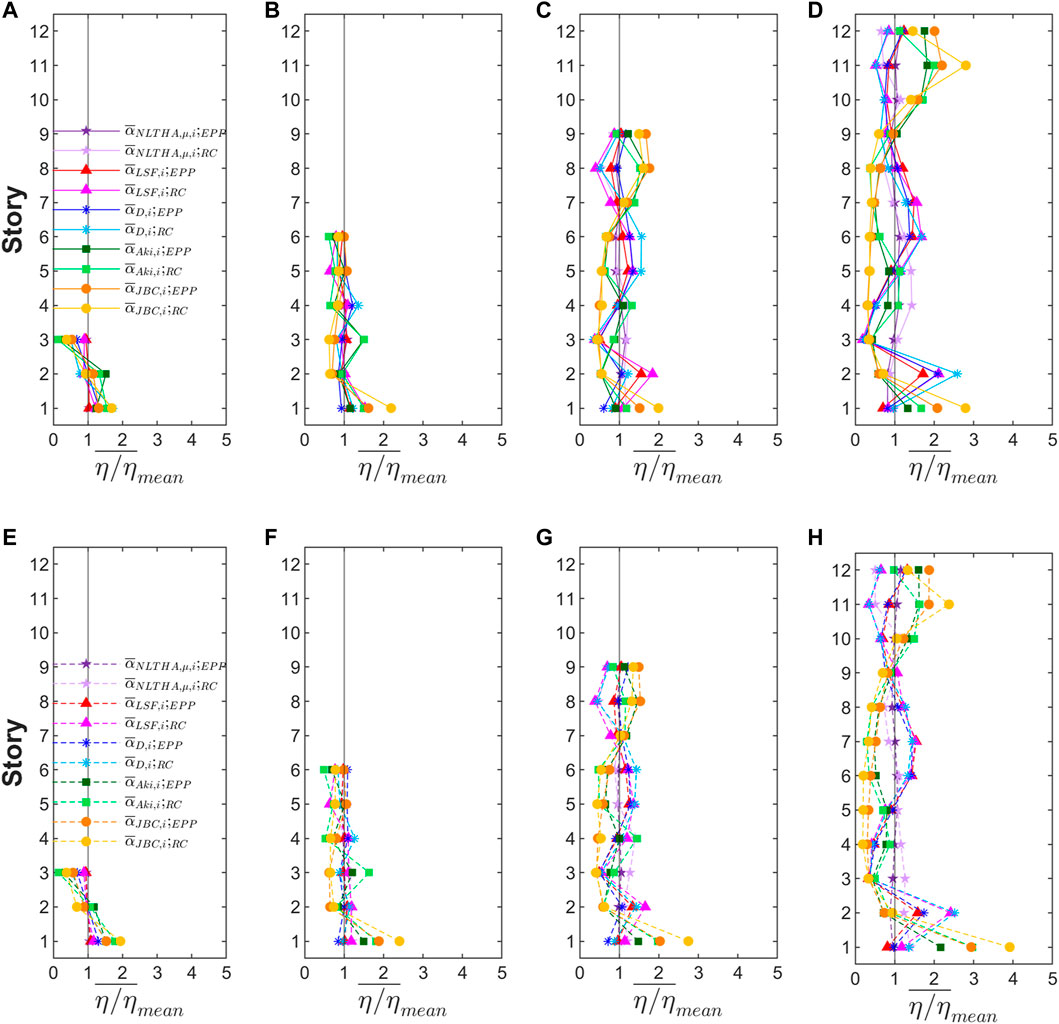
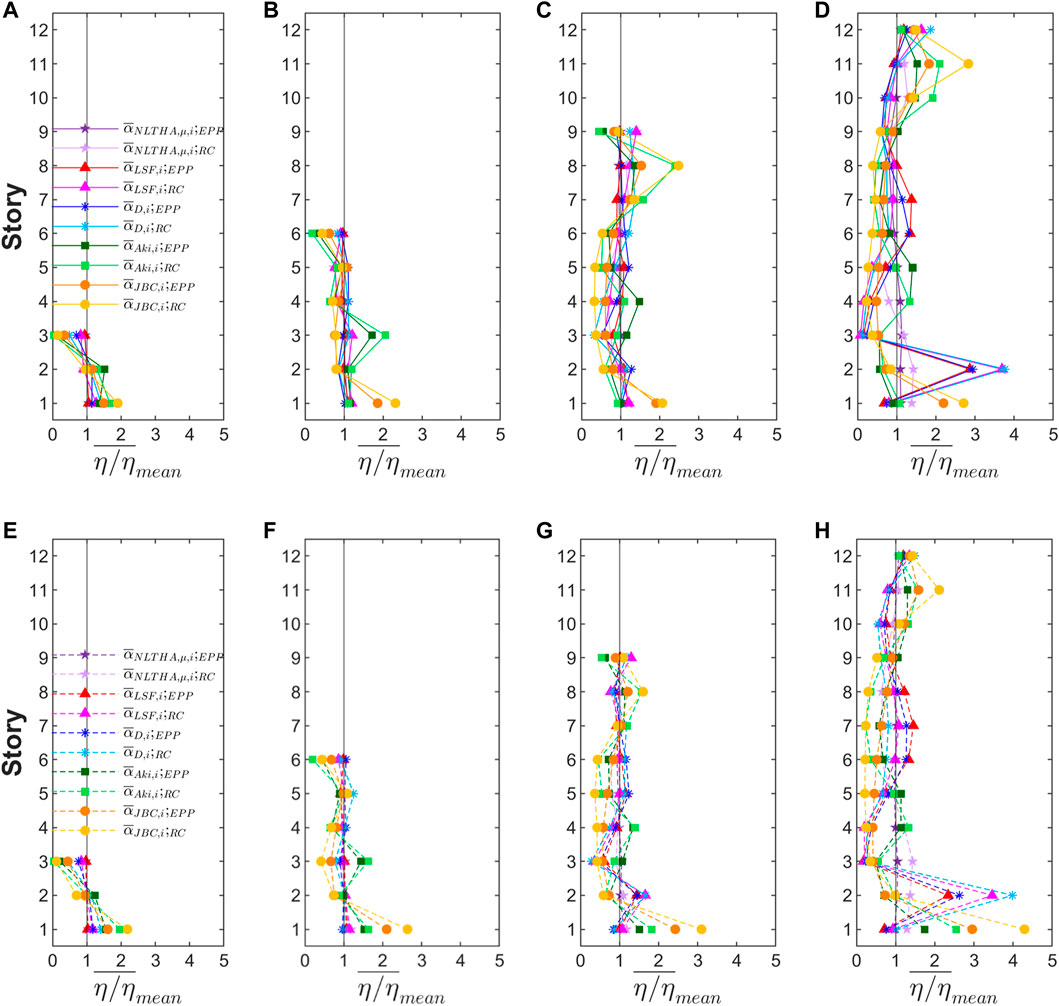
Another important issue is the level of damage concentration in the structures. It was estimated through the ratio for each structure subjected to the ground motion j. Then, the average of this ratio among the set of records for each story i, , was calculated, where . Figures 13, 14 show the distribution of obtained from the numeric evaluations on soil class B and C, respectively, for structures with EPP and RC-Clough restoring force characteristics designed with different optimum strength distributions and ductility levels. As shown in Figure 3, the solid lines correspond to structures designed with and the dashed lines to those designed with . A solid vertical black line is also depicted for which represents the even distribution of damage (). The results obtained for in Modified Clough and Clough models are very close; hence, the first ones are not depicted in Figures 13, 14.
Overall, RC models offer a worse agreement of with than the obtained with EPP models, especially for the highest buildings −9 and 12-story. Furthermore, the larger the differences in the optimum distribution with respect to (Figures 2, 3) the lower the and conversely, as it is shown for and, especially, for .
Structures designed with showed the distribution of closest to one for both EPP models and Clough models, ranging between 0.8 and 1.2 for the former and between 0.5 and 1.5 for the latter. For structures designed with and , the values of ranges between 0.5 and 1.5 except for 9 and especially for 12-story buildings where the differences are larger. For the latter, the following behavior is observed. For the second story, grows up to two (EPP models) and three (RC models) for soil class B and up to 2.5 (EPP models) and four (RC Models) for soil class C. Nevertheless, for the third, fourth, and fifth stories ranges between 0.15 and 0.8 for every case. This can be explained by the values of obtained for and , respectively, as shown in Figures 3D, H. For , the values of varies between −3.5% and 3.5% for both soil classes B and C, where the second story shows the lowest limit of the range and the highest value of . In the case of , the highest values of are expected in the second story because is the lowest of the 12-story building for both soil classes B and C, approximately −2% for while for the rest of the stories, shows positive values which range between 2% and 10% for soil class B and between 0.5% and 6% for soil class C. It is worth emphasizing the high sensibility of with respect to the strength distribution when low variations of the optimum distribution lead to higher differences for .
In the case of structures designed with and , larger irregularities are shown for the distribution of , especially for the last one. For 3 and 6-story buildings, the differences observed between the upper and lower stories for are significant. The upper stories of these buildings show low values of which ranges between 0 (RC models) and 0.15 (EPP models) for the former and between 0.5 (EPP models) and 0.7 (RC models) for the latter. Conversely, for lower stories and especially at the first story, the values of range between 1.5 (EPP models) and 2.0 (RC models). On the other hand, 9 and 12-story buildings show higher values of in upper and lower stories, which ranges between 1.5 and three for EPP models and between three and four for RC models, while intermediate stories offer lower values of which ranges between 0.3 and 0.5 for both EPP and RC models. These results are coherent with the large values proposed by these optimum distributions for intermediate and upper stories in 3 and 6-story buildings as well as at intermediate stories in 9 and 12-story buildings (Figure 3).
6 Conclusion
This study is relevant for the following reasons. First, because it involves a large number of parameters and cases: four prototype buildings designed for five different approaches for the optimum strength distributions in two different soil types with two different levels of ductility and three different constitutive models for the shear force-interstory drift relationships and subjected to 30 different ground motions—15 for each soil type— (total 3,600 cases). Second, the distribution of damage is investigated using realistic constitutive models for RC structures instead of the elastic perfectly plastic model used in most past studies. Third, because, as far as the authors know, a study that quantifies the goodness of different lateral strength distributions to achieve an even distribution of damage using realistic constitutive models of RC structures has never been done. Finally, this study provides valuable information on the most appropriate lateral strength distribution to design RC structures applying the energy-based approach. The optimum strength distribution was obtained by the authors in previous research for 3, 6, 9, and 12-story buildings through the analysis of structures subjected to a set of ground motions. and , were formulated by the authors as a predictive and design equation for , respectively. and are reported in the literature. Accordingly, the different prototype structures were set up by using the five approaches for , the two ductility levels — and 4— and the two soil classes—very dense (B) and medium-dense (C). Next, the numerical models of the structures were built to carry out non-linear time history analysis by using three different constitutive models for the shear force-interstory drift relationship: the EPP model, the Clough model, and the Modified model. Eventually, the ductility and the damage distributions were calculated from the results obtained in the numeric evaluations. The following conclusions can be drawn:
• RC structures designed with the optimum distributions considered in this study showed higher deviations in the damage distribution () than the obtained in EPP structures, with increments of which range between 50% and 100%.
• Structures with Clough and Modified Clough restoring force characteristics showed, on average, similar distributions of dissipated energy without significant differences for and but not for for which the latter structures show, on average, higher values than the observed values with the former structures.
• Structures that differ only in the ductility level show similar values for .
• Structures designed with offered the best approaches to the even distribution of , showing the lowest values of and closest to one.
• When and are considered, the values of were similar to the obtained with in EPP and RC structures with 3, 6, and 9-story buildings except for 12-story buildings. In this case, was 50% and 100% higher for soil classes B and C, respectively, and shows a marked value at the second story that ranges between two (EPP models) and three (RC models) for soil class B and between 2.5 (EPP models) and four (RC models) for soil class C. Nevertheless, these values are within the range of the maximum values of observed for structures designed with and .
• and can be considered valid approaches of for both EPP and RC structures though some modifications for 12-story buildings would be desirable in order to improve the distribution of damage obtained in this study.
• By contrast, the structures designed with and show the largest deviations of . The first one shows higher values of than the obtained values with , especially for 3-story buildings where the increments are twice. The second one shows the highest values of with about twice the observed value with . In both cases, the distribution of damage was irregular, especially for RC structures. For 3 and 6-story buildings, high values of in lower stories and converse for the upper stories was observed. For 9 and 6-story buildings, the highest values of was observed in the upper and lower stories and the lowest ones at the intermediate stories. Then, it can be concluded that the overstrength that and produce at the intermediate and upper stories should be avoided.
Eventually, it is worth noting that future studies will be needed to evaluate the influence of different aspects not developed here in the damage distribution of structures designed with different approaches for the optimum strength distribution: i) structures subjected to different seismic actions such as the near-field—pulse-like—ground motions; ii) analysis employing the two components of the seismic actions—spatial analysis; iii) type of structures where the contribution to the lateral deformations of the bending moment component is not secondary (e.g., tall buildings equipped with RC frames and shear walls).
Data availability statement
The original contributions presented in the study are included in the article/supplementary material, further inquiries can be directed to the corresponding author.
Author contributions
JD-A formulated the study, conducted the non-linear time history analysis, carried out the data curation, and wrote the paper. AB-C supervised the research, discussed the results, and reviewed the paper. FM proposed the seismic levels used in the study, selected the ground motions database, and reviewed the paper. All authors contributed to the article and approved the submitted version.
Funding
This work has received financial support from the Sapienza University of Rome (Grant no. RG11916B4C241B32). The support from the Spanish Government under Project MEC_PID 2020-120135RB-I00 and received funds from the European Union (Fonds Européen de Dévelopment Régional) is also gratefully acknowledged.
Conflict of interest
The authors declare that the research was conducted in the absence of any commercial or financial relationships that could be construed as a potential conflict of interest.
Publisher’s note
All claims expressed in this article are solely those of the authors and do not necessarily represent those of their affiliated organizations, or those of the publisher, the editors and the reviewers. Any product that may be evaluated in this article, or claim that may be made by its manufacturer, is not guaranteed or endorsed by the publisher.
References
Akiyama, H. (2003). Earthquake-resistant design method for buildings based on energy balance. Tokyo: Reverte S.A.
Google Scholar
Akiyama, H. (2000). “Method based on energy criteria,”. Seismic resistant steel structures. International centre for mechanical sciences. Editors F. M. Mazzolani, and V. Gioncu (Berlin, Germany: Springer), 101–158. doi:10.1007/978-3-7091-2480-2_3
CrossRef Full Text | Google Scholar
Bai, J., Chen, H., Jia, J., Sun, B., and Jin, S. (2020). New lateral load distribution pattern for seismic design of deteriorating shear buildings considering soil-structure interaction. Soil Dyn. Earthq. Eng. 139, 106344. doi:10.1016/j.soildyn.2020.106344
CrossRef Full Text | Google Scholar
Benavent-Climent, A. (2011). An energy-based method for seismic retrofit of existing frames using hysteretic dampers. Soil Dyn. Earthq. Eng. 31, 1385–1396. doi:10.1016/j.soildyn.2011.05.015
CrossRef Full Text | Google Scholar
Benavent-Climent, A., Donaire-Ávila, J., and Mollaioli, F. “Key points and pending issues in the energy-based seismic design approach,” in Proceedings of 1st International Workshop on Energy-Based Seismic Engineering (IWEBSE), Madrid, Spain, May 2021, 151–168. doi:10.1007/978-3-030-73932-4_11
CrossRef Full Text | Google Scholar
Building Research Institute, (2009a). “Earthquake-resistant structural calculation based on energy balance,” in The building standard law of Japan (Tokyo, Japan: The Building Center of Japan), 414–423.
Google Scholar
Building Research Institute, (2009b). “Notification No. 1793 (1980): Stipulation of the value of Z, methods of calculating and Rt and Ai and standards for the designation by the Designated Administrative Organization of districts where the ground is extremely soft,” in The building standard law of Japan (Tokyo, Japan: The Building Center of Japan), 42–43.
Google Scholar
Campbell, K. W., and Bozorgnia, Y. (2007). “Campbell-bozorgnia NGA ground motion relations for the geometric mean horizontal component of peak and spectral ground motion parameters,” in Pacific earthquake engineering research center (Berkeley, California, United States: University of California).
Google Scholar
Cheng, Y., Lucchini, A., and Mollaioli, F. (2014). Proposal of new ground-motion prediction equations for elastic input energy spectra. Earthq. Struct. 7, 485–510. doi:10.12989/eas.2014.7.4.485
CrossRef Full Text | Google Scholar
Chopra, A. K. (2011). Dynamics of Structures: Theory and applications to earhquake engineering. Hoboken, New Jersey, United States: Prentice Hall.
Google Scholar
Clough, R. W., and Johnston, S. B. (1966). Effect of stiffness degradation on earthquake ductility requirements, in 2nd Japan earthquake engineering symposium (Tokyo, Japan: Japan Earthquake Engineering Symposium), 227–232.
Google Scholar
Connor, J. J. (2003). Introduction to structural motion control. New Jersey, USA: Prentice Hall.
Google Scholar
Connor, J. J., Wada, A., Iwata, M., and Huang, Y. H. (1997). Damage-controlled structures. I: Premliminary design methodology for seismically active regions. J. Struct. Eng. 123, 423–431. doi:10.1061/(ASCE)0733-9445
CrossRef Full Text | Google Scholar
Deguchi, Y., Kawashima, T., Yamanari, M., and Ogawa, K. “Sesimic design load distribution in steel frame,” in Proceedings of the 14th World Conference on Earthquake Engineering, Beijin, China, October 2008.
Google Scholar
Donaire-Ávila, J., and Benavent-Climent, A. (2020). Optimum strength distribution for structures with metallic dampers subjected to seismic loading. Met. (Basel) 10, 127–227. doi:10.3390/met10010127
CrossRef Full Text | Google Scholar
Donaire-Avila, J., Lucchini, A., Benavent-climent, A., and Mollaioli, F. “New approach for the optimal yield-force coefficient distribution in the seismic design of buildings,” in Proceedings of the 16th European Conference on Earthquake Engineering, Thessaloniki, Greece, July 2018.
Google Scholar
Donaire-Avila, J., Lucchini, A., Benavent-Climent, A., and Mollaioli, F. (2020). New optimum distribution of lateral strength of shear - type buildings for uniform damage. Struct. Eng. Mech. 76, 279–291. doi:10.12989/sem.2020.76.3.279
CrossRef Full Text | Google Scholar
Eurocode 8, (2004). Design of structures for eathquake resistance, Part I: General rules, seismic actions and rules for buildings. Brusells, Belgium: European Committee for Standardization.
Google Scholar
Ganjavi, B., Hajirasouliha, I., and Bolourchi, A. (2016). Optimum lateral load distribution for seismic design of nonlinear shear-buildings considering soil-structure interaction. Soil Dyn. Earthq. Eng. 88, 356–368. doi:10.1016/j.soildyn.2016.07.003
CrossRef Full Text | Google Scholar
Ganjavi, B., and Hao, H. (2013). Optimum lateral load pattern for seismic design of elastic shear-buildings incorporating soil-structure interaction effects. Earthq. Eng. Struct. Dyn. 42, 913–933. doi:10.1002/eqe.2252
CrossRef Full Text | Google Scholar
Grammatikou, S., Fardis, M. N., and Biskinis, D. (2019). Energy dissipation models for RC members and structures. Earthq. Eng. Struct. Dyn. 48, 287–305. doi:10.1002/eqe.3136
CrossRef Full Text | Google Scholar
Gupta, V. K., Nielsen, S. R. K., and Kirkegaard, P. H. (2001). A preliminary prediction of seismic damage-based degradation in RC structures. Earthq. Eng. Struct. Dyn. 30, 981–993. doi:10.1002/eqe.45
CrossRef Full Text | Google Scholar
Hajirasouliha, I., and Moghaddam, H. (2009). New lateral force distribution for seismic design of structures. J. Struct. Eng. 135, 906–915. doi:10.1061/(asce)0733-9445
CrossRef Full Text | Google Scholar
Ibarra, L. F., Medina, R. a., and Krawinkler, H. (2005). Hysteretic models that incorporate strength and stiffness deterioration. Earthq. Eng. Struct. Dyn. 34, 1489–1511. doi:10.1002/eqe.495
CrossRef Full Text | Google Scholar
Khashaee, P., Mohraz, B., Sadek, F., Lew, H. S., and Gross, J. L. (2003) NISTIR Report 6903. Washington, D.C., United States: United States Department of Commerce.Distribution of earthquake input energy in structures
Google Scholar
Kuntz, G. L., and Browning, J. A. (2003). Reduction of column yielding during earthquakes for reinforced concrete frames. ACI Struct. J. 100, 573–580.
Google Scholar
Li, S., Yu, B., Gao, M., and Zhai, C. (2019). Optimum seismic design of multi-story buildings for increasing collapse resistant capacity. Soil Dyn. Earthq. Eng. 116, 495–510. doi:10.1016/j.soildyn.2018.10.032
CrossRef Full Text | Google Scholar
Lynn, A. C., Moehle, J. P., Mahin, S. A., and Holmes, W. T. (1996). Seismic evaluation of existing reinforced concrete building columns. Earthq. Spectra 12, 715–739. doi:10.1193/1.1585907
CrossRef Full Text | Google Scholar
Manfredi, G., Polese, M., and Cosenza, E. (2003). Cumulative demand of the earthquake ground motions in the near source. Earthq. Eng. Struct. Dyn. 32, 1853–1865. doi:10.1002/eqe.305
CrossRef Full Text | Google Scholar
Medina, R. a. (2004). Story shear strength patterns for the performance- based seismic design of regular frames. ISET J. Earthq. Technol. 41, 101–125.
Google Scholar
Moghaddam, H., and Hajirasouliha, I. (2006). Toward more rational criteria for determination of design earthquake forces. Int. J. Solids Struct. 43, 2631–2645. doi:10.1016/j.ijsolstr.2005.07.038
CrossRef Full Text | Google Scholar
Mohammadi, R. K., El Naggar, M. H., and Moghaddam, H. (2004). Optimum strength distribution for seismic resistant shear buildings. Int. J. Solids Struct. 41, 6597–6612. doi:10.1016/j.ijsolstr.2004.05.012
CrossRef Full Text | Google Scholar
Montuori, R., Nastri, E., and Tagliafierro, B. (2019). An optimal seismic force pattern for uniform drift distribution. Buildings 9, 231–320. doi:10.3390/buildings9110231
CrossRef Full Text | Google Scholar
OpenSees, (2022). Open system for earthquake engineering simulation (V.3.3.0) pacific earthquake engineering research center. Berkeley, California, United States: University of California.
Google Scholar
Otani, S. (1981). Hysteresis models of reinforced concrete for earthquake response analysis. J. Fac. Eng. 36, 407–441.
Google Scholar
 Jesus Donaire-Avila
 Amadeo Benavent-Climent
 Fabrizio Mollaioli