- 1PLINIVS Study Centre, University of Naples Federico II, Napoli, Italy
- 2Department of Structures for Engineering and Architecture (DiSt), University of Naples Federico II, Naples, Italy
- 3Department of Civil Engineering, University of Salerno, Fisciano (SA), Italy
- 4Department of Civil and Environmental Engineering, Princeton University, Princeton, NJ, United States
- 5Department of Engineering, University of Sannio, Benevento, Italy
The high seismic hazard of the Italian territory and the vulnerability of its historic masonry heritage require the development of fragility curves that must be increasingly reliable and robustly correlated to exposure. To date, national-scale seismic risk analyses mainly use empirical curves derived from the statistical analysis of damage induced by past events. These curves have shown good reliability, but they correlate only with a few typological-structural characteristics of the building, such as the number of floors, the vertical structure typology or the construction period. The present research paper aims to overcome this limitation with a hybrid approach that provides a better exposure characterisation. Specifically, the proposed strategy integrates the SAVE and Piecewise Rigid Displacement (PRD) methods. SAVE is an empirical approach based on the damage assessment due to past seismic events used to identify a seismic behaviour of a structure, while the PRD method is a numerical approach that solves the boundary value problem for normal, rigid, no-tension material. It can model different structural typologies, and as a result, it also provides the value of the horizontal static multiplier that drives the masonry construction to collapse. An extended numerical campaign is carried out considering a sample of 750 masonry buildings distributed throughout the Italian territory and extracted from the PLINIVS typological database. Looking at each construction, first, a PRD analysis is conducted to define its seismic capacity, paying special attention to modelling construction details. After that, the SAVE method is used to classify the construction in a specific seismic vulnerability class, i.e., from A to C, with decreasing vulnerability. All the buildings belonging to the same class are then collected, and three fragility curves representative of the collapse state (one for each vulnerability class) are derived and validated against empirical and analytical ones commonly adopted in the Literature. The integrated methodology shows a good agreement between simulations and observations, confirming the viability of the proposed hybrid methodology for the large-scale assessment of masonry buildings, providing an effective strategy to plan mitigation and rehabilitation interventions.
1 Introduction
Italy is a country exposed to a high seismic hazard as a relevant part is estimated to be subjected to high seismic actions, i.e., with a 10% probability in 50 years of acceleration values exceeding 0.225 g (OPCM et al., 2006). The highest seismic values refer to Calabria, south-eastern Sicily, Friuli-Venezia Giulia, and the central-southern Apennines. Average seismic acceleration values refer to the Salento Peninsula, the Tyrrhenian coast, between Tuscany and Lazio, Liguria, most of the Po Valley, and the entire Alpine Arch. Sardinia is the least dangerous region, as only moderate shaking values are expected. Additionally, the corresponding seismic risk drastically increases as most areas show a vast presence of old civil buildings, either designed with outdated rules or suffering from deterioration due to age. According to ISTAT Census (2001), 60% of residential buildings were constructed before 1980, and 42.5% are over 50 years old.
Additionally, more than one-half of such buildings were built before 1970 without paying attention to any seismic rule, especially for masonry buildings in the historical centres. The combination of the elevated hazard and the vulnerability of civil buildings has already resulted in considerable high damage to building heritage and population, as evidenced by the catastrophic events of the last 50 years. Starting from the earthquake in the Belice area (1968), 15 seismic events with a magnitude greater than 5.5 occurred, and more than 120 billion euros were allocated to interventions due to damage. This condition has strongly fostered the development of structures for managing seismic risk to protect people and building heritage.
Starting with the 1976 Friuli earthquake, the Italian Civil Protection system has consolidated the DRM cycle (preparedness, response, recovery, mitigation) so much that it has become an international reference, boosting scientific research to develop models for the assessment of the seismic vulnerability of buildings. As a result of Civil Protection actions, such effort has been addressed to the development of shared analysis for the national seismic risk assessment (Dolce et al., 2021), according to European Guidelines (Poljansek et al., 2019), in response to the specific requirement of the Sendai Framework for Disaster Risk (UNDRR, 2015). The last National Risk Assessment for Italy dated back to the end of 2018 and was promoted by the Department of Civil Protection (Dolce et al., 2021) through empirical fragility curves based on available damage and vulnerability data for buildings inspected after past seismic events (Irpinia 1980; L'Aquila 2009). The methodology adopted has allowed the seismic risk assessment for the whole Italian territory thanks to a procedure based on the convolution of the hazard (OPCM et al., 2006), exposure (ISTAT Census 2001) and vulnerability.
A seismic vulnerability model represents the expected damage due to a given level of Peak Ground Acceleration (PGA) for a building having known typological features. Different approaches can be adopted to construct a vulnerability model (Calvi et al., 2006): in particular, observation-based approaches require previous survey activities in areas that have experienced seismic events. Through specific post-earthquake seismic forms (i.e., AeDES (Baggio et al., 2007), Palazzi (Presidenza del Consiglio dei Ministri, 2006), and Churches (Presidenza del Consiglio dei Ministri, 2013) forms), devoted to rapid visual screening and structural safety checks through expert judgments, the information on the buildings’ typological characteristics and level of damage are collected and reported in a damage database. This information is combined with shakemaps provided by geology and volcanology research centres, such as the National Institute of Geophysics and Volcanology—INGV in Italy, to associate a PGA to each surveyed building based on its position. Finally, it is possible to derive the correlation among collected typological characteristics, reached levels of damage and associated hazard. In the Literature, several observation-based approaches have been proposed in the context of the development of seismic fragility curves (the reader is referred to (Benedetti et al., 1988; Riuscetti et al., 1997; Rossetto et al., 2013; Zuccaro et al., 2021) and references therein).
Oppositely, mechanical approaches are based on analytical or numerical structural evaluations, which directly take into account type of materials, real geometries, the presence of reinforcements or any other structural feature. However, a high computational and modelling effort is required to assess several hundreds of buildings. In the scientific Literature, a few simplified approaches have been proposed to lower the computational effort for the large-scale assessment of the seismic vulnerability of masonry buildings. In the context of masonry structures, mechanical-based methods can be grouped into three main categories (Shabani et al., 2021):
(i) collapse mechanism-based methods, in which kinematic chains are used to define and evaluate the collapse multipliers corresponding to possible failure mechanisms. Non-linear static or pushover analyses are then adopted to define capacity curves (Bernardini et al., 1990; Lagomarsino and Podesta, 2004; Zuccaro et al., 2017);
(ii) capacity spectrum-based methods whose use allows to compute predetermined capacity curves for each building typology. The capacity curve is then intersected with the seismic demand to derive the performance points for different damage thresholds (D'Ayala et al., 2013; Ansal, 2012; Fajifar, 2000);
(iii) fully displacement-based methods, where buildings are modelled through an equivalent single-degree-of-freedom system. The displacement capacity for each damage threshold is compared to the displacement demand in each corresponding period of vibration to derive the possibility of crossing the damage thresholds (Calvi, 1999; Crowley and Pinho eBommer, 2004; Borzi and Pinho, 2008; De Angelis et al., 2020).
Several methods have been proposed to provide collapse multipliers for in- and out-of-plane collapse mechanisms of ordinary masonry building stocks (Bernardini et al., 1990; Bernardini et al., 2008a; Bernardini et al., 2008b; Zuccaro et al., 2017; Donà et al., 2020), churches (Lagomarsino and Podesta, 2004; DPCM, 2011) and towers (Torelli et al., 2019) at the building scale. Sophisticated limit analysis-based methods have also been developed to define the most probable failure mechanism of 3D masonry towers at the building scale (Milani, 2019) considering predefined mechanisms such as rocking, Heyman’s diagonal cracking, and base shear sliding; an optimisation algorithm finds the most probable mechanism by minimising the corresponding failure multipliers. The kinematic limit analysis theorem performed on NURBS-based elements has been developed to assess the buildings’ aggregates and the ‘domes’ failure behaviour subjected to static horizontal loads (Grillanda and Milani, 2020a; Grillanda et al., 2020). Other strategies based on the kinematical approach include the Discrete Element Method (Cascini and Gagliardo ePortioli, 2018; Malena et al., 2019; Gobbin and Lemos, 2021) and Rigid Block Models (Gilbert and Melbourne, 1994; Baraldi eCecchi, 2017; Portioli and Cascini, 2017; Angelillo et al., 2018), ore, more in general, methods based on energy minimization (Gesualdo et al., 2019; Gesualdo et al., 2020; Fortunato et al., 2022). Other numerical approaches based on the Static theorem have been proposed. The collapse load is evaluated as the maximum load for which at least a statically admissible and equilibrated solution exists. Examples of applications of the Static theorem on masonry buildings are provided in (Monaco et al., 2018; Cusano et al., 2021a; Nodargi and Bisegna, 2021a; Cusano et al., 2021b; Cusano et al., 2021c; Montanino et al., 2021; Montanino et al., 2022). These mechanical-based approaches allow for numerically computing the collapse load of specific masonry structures and are independent of specific seismic events. Analytical methods for seismic fragility curves have also been proposed for different typologies of buildings, in particular, for Reinforced Concrete (RC). The most common approaches are based on non-linear dynamic analyses (Folić and Čokić, 2021; Manfredi et al., 2022; Ruggieri et al., 2022). The proposed methods often require a relevant modelling effort in defining the geometry and a high computational effort to solve the numerical problem. Some of them also require a detailed material characterisation to describe the mechanical response correctly (Monaco et al., 2021). A material description that all too often is impossible to achieve, particularly when looking at large-scale problems.
This research aims to fill the gap between observation- and mechanical-based approaches by proposing a novel methodology to define fragility curves that, on the one hand, can directly take into account geometrical and material aspects and, on the other hand, provide a fast strategy for the large-scale assessment of masonry buildings. This approach founds upon a pipeline that combines the SAVE methodology (Zuccaro eCacace, 2015), the extensive PLINIVS database (Cacace et al., 2018) and the Piecewise Rigid Displacement (PRD) method (Iannuzzo et al., 2018; Iannuzzo and VanMele eBlock, 2020). The PRD approach is a fast energy-based method that allows framing and solving the Limit Analysis kinematic problem for no-tension materials through linear or second-order cone programming. Using a suitable objective function, PRD allows to take any boundary condition into account and to model several typological features. Based on the PRD results of the buildings sample extracted from the PLINIVS database, the SAVE method is then applied to define fragility curves. Specifically, the first step of the pipeline consists in defining a sample of structures from the PLINIVS database, which contains information on the structural-typological features of hundreds of thousands of Italian buildings. This sample comprises 750 buildings extracted through the most recurrent typologies in the PLINIVS databasea. The SAVE procedure is then applied to assign to each building a vulnerability class, which is defined as a function of the building’s main structural-typological features and calibrated on damages observed after past seismic events. The analysis is conducted on the 2D main façade of the building, and a parametric description of their geometry is provided to generate digital models. The PRD is then applied to the corresponding digital models to find the pseudo-static collapse loads. Because of the fast numerical PRD solving, several hundred buildings are analysed, and the related results are used to construct fragility curves for each building vulnerability class.
The paper is organised as follows. Section 2 describes the theoretical framework, referring to the SAVE procedure and the mechanical framework on which the PRD method is based; Section 3 introduces the process employed to select the buildings sample and the numerical approach used to discretise the energy problem in a mathematical programming optimisation. Section 4 details geometries, material properties and typological features and how these are framed in a numerical optimisation referring to 2D buildings. The results are then presented and discussed in Section 5. A final section outlines the pro and cons of the present methodology along with future outcomes.
2 Methodology
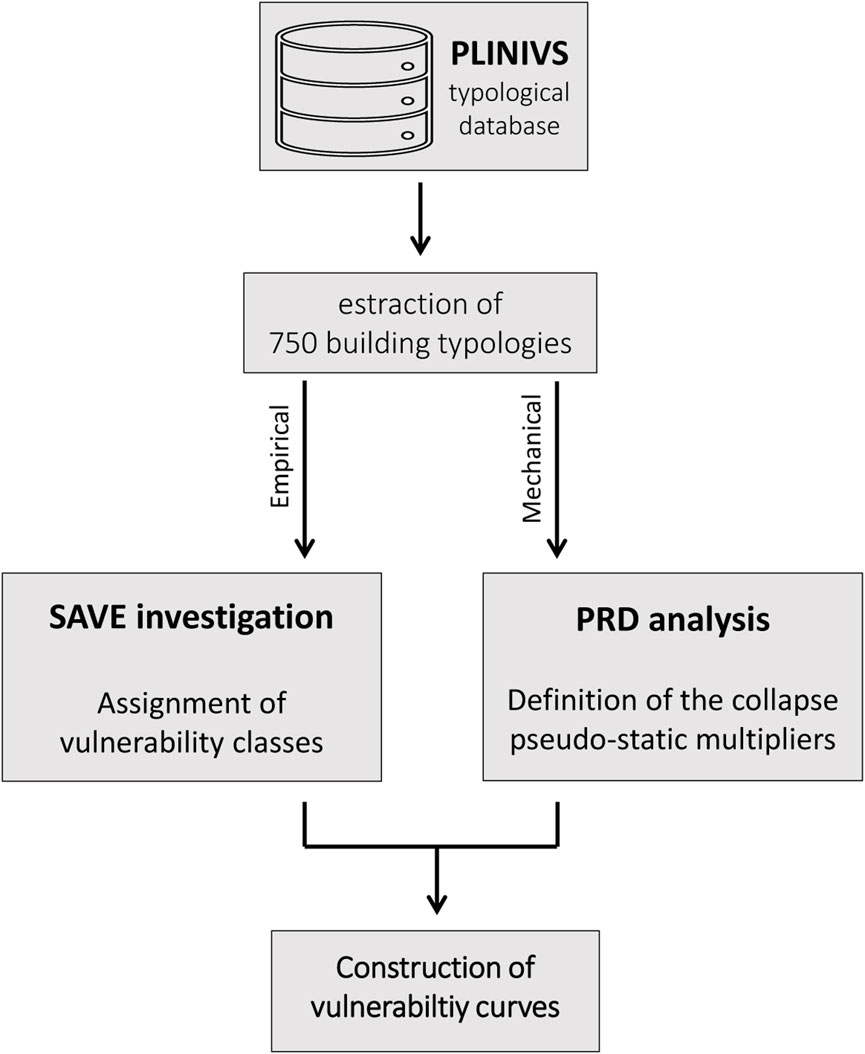
The present Section briefly recalls the pipeline at the base of the proposed methodology, whose main structure is depicted in Figure 1. The first step looks at selecting a sample of 750 building typologies from the extensive PLINIVS database, which comprises about 240,000 buildings. All the sample buildings are assumed to be different from each other and have the same frequency of occurrence for each construction typology. Each building is then separately analysed using the SAVE procedure to assign a vulnerability class and the PRD method to define the maximum horizontal pseudo-static multiplier.
Specifically, as detailed in Section 2.1, the SAVE method reduces the uncertainty provided by the European Macroseismic Scale EMS98 (Grünthal, 1998) and is applied to link each building to a specific vulnerability class. Simultaneously, from an analytical standpoint, each building is numerically processed by the PRD method to find the maximum allowable horizontal load. The PRD method is based on a pure Heyman material model, i.e., explicitly considering the no-sliding material failure. Indeed, whenever rigid block models are applied to model unilateral continua, such as old masonry buildings, the need for modelling diagonal cracks forces the introduction of a yield criterion to consider the shear-sliding behaviour. This criterion is usually represented by the classic Mohr-Coulomb relation. However, from a computational perspective, when a non-associative behaviour is considered, searching for a solution to the boundary value problem for which normal forces vanish in the presence of normal detachments requires more sophisticated computational and modelling strategies. Non-linear programming methods (Nodargi and Bisegna, 2021b; Kao et al., 2022; Nodargi and Bisegna, 2022) have to be used for such a purpose, or heuristic, linear or convex algorithm procedures, to lower the computational burden, although the convergence is not mathematically proven.
The collapse multiplier is found as the maximum horizontal load that a building can sustain. It is later translated into a Peak Ground Acceleration (PGA) according to the Italian Technical Code for buildings (Ministero delle Infrastrutture e dei Trasporti, 2018) and used to construct fragility curves.
This Section is organised as follows. In section 2.1, the SAVE methodology and its procedure for the quick assignments of the vulnerability classes are briefly recalled. In section 2.2, the PRD’s theoretical framework is illustrated.
2.1 SAVE methodology
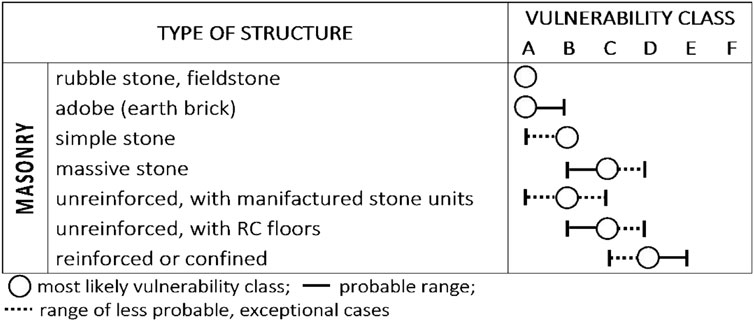
The SAVE method provides an empirical procedure to quickly describe the overall seismic response of a building through the assignment of the seismic vulnerability classes. The 1998 European Macroseismic Scale, EMS'98 (Grünthal, 1998) considers five vulnerability classes (see Figure 2), denoted with letters ranging from A to E with decreasing levels of fragility, and assigns to each building the most likely vulnerability class as a function of the vertical structure typology, neglecting the influence of the other typological-structural characteristics (age, floor number, horizontal structure, etc).
The SAVE procedure reduces the level of uncertainty on the attribution of vulnerability classes considering the effects on the building seismic response of additional typological features, defined modifiers, such as the horizontal structural typology, the number of floors, the presence of ties and other features. The method is empirical and built on the extensive PLINIVS database in which typological and damage information of about 250,000 masonry buildings are collected. In the first step, the correlation between the vertical typologies and the level of damage is estimated. The vertical structures defined in the SAVE method are three: generic masonry, denoted with
In the second step, the influence of the parameters affecting the average seismic behaviour of the building is estimated through the Synthetic Parameter of Damage (SPD) variation. To this purpose, buildings with vertical structure
where
2.2 Boundary value problem and limit condition
This Section illustrates the boundary value problem (BVP) at the base of the PRD method referring to a no-tension Heyman material. Specific mathematical restrictions on the stress and latent strain are introduced to model the masonry response. A 2D masonry structure is modelled as a continuum occupying the region
with
representing the necessary conditions to rigorously apply the classic theorem of limit analysis to unilateral masonry materials. For more information, the reader is referred to (Kooharian, 1952; Livesley, 1978; Giaquinta and Giusti, 1985; Fortunato et al., 2014; Fortunato et al., 2016; Chiozzi et al., 2017). Therefore the BVP on domains made up of NRNT material reads
with
In the present formulation, only singular strains and stresses are considered, meaning that the displacement
with
with
implicitly guarantees the equilibrium of the loads imposed on the structure. From a mathematical standpoint, the minimiser
Indeed, the main idea is to describe the external loads as an affine distribution so they remain proportional to the original self-weight through a scalar parameter. From a physical standpoint, many experimental tests are commonly performed through a tilting test to look at possible collapse mechanisms (DeJong, 2009; Ochsendorf, 2022). The numerical modelling of those tests is straightforward and can be performed through two different strategies. The first one is a pure geometrical strategy, and it consists of directly and fictitiously rotating the original angle geometry of an angle
with
The last stable configuration, along with the collapse multiplier, can be defined through the following min-max problem:
Because of the uniqueness of the multiplier due to the normality rule, this min-max problem can be solved following two strategies: the first one translates this in classic limit-analysis approaches, while the second one solves the problem through a sequence of minimisation problems until a solution can still be found. The present contribution follows this last procedure as it directly considers different typological features in the objective function as specified in Section 4.
3 Numerical methodology
The present Section illustrates the statistical procedure adopted to generate the buildings’ sample from the data from the PLINIVS database to define the buildings sample (Section 3.1) along with the numerical strategy used to frame problem (11) in a linear programming problem (Section 3.2).
3.1 Sample of buildings
Following the SAVE method, the most relevant parameters in the vulnerability class assignment are the vertical and the horizontal structures, the presence of ties, the number of floors and the construction age. The first four parameters are used to generate the sample of virtual façades. Conversely, the last one is related to the exposure and cannot be directly considered to construct the analytical-fragility model. The construction age is a fundamental parameter when approaching the problem from an observational standpoint, as it often provides sufficient information about construction technology. When adopting an analytical approach, the construction technology is explicitly modelled, and the importance of including the construction age in the model vanishes. The four SAVE parameters used to scan the variability of the building stock under consideration:
1) vertical structure, which is defined in terms of hollow bricks, tuff, filled brick, irregular stonework, and regular stonework;
2) horizontal structure, which can vary among steel, reinforced concrete (RC), wooden floors as well as vaulted floor systems;
3) tie rods, whose presence is assumed as a binary variable, i.e., they can be considered or not considered at all. Moreover, when they are modelled, they are not considered at each floor level;
4) the number of floors, which ranges from 1 to 5.
From a technological perspective, not all horizontal structures are compatible with tie roads, and thus, parameters 2 and 3 are collected in a unique variable called horizontal technology. Therefore, these four parameters allow the definition of the following six horizontal technology classes: steel, RC, wooden with ties, wooden without tie rods, vaults with tie rods and vaults without tie rods. In addition to the SAVE parameters, other geometrical variables are considered, such as the façade baseline length and thickness, inter-storey height, and openings, whose size and numbers are assumed as variables. The inter-storey height has been fixed in all the analyses at 3.5 m. The façade baseline length ranges from 4.00 m to 7.00 m, which statistically includes most of the 2D masonry geometries catalogued in the PLINIVS database. The possible intermediate heights range from 5.00 m to 6.00 m. The dimensions of the openings have been fixed at
- at least one opening per floor when the façade baseline length is 4.00 m;
- one or two openings per floor if the façade baseline length is 5.00 m;
- two openings per floor, with a façade baseline length longer than 5.00 m.
Combining this information, the parameter “length and openings” can be labelled as:
- L4O1: Length 4.00 m Opening 1;
- L5O1: Length 5.00 m Openings 1;
- L5O2: Length 5.00 m Openings 2;
- L6O2: Length 6.00 m Openings 2;
- L7O2: Length 7.00 m Openings 2.
The wall’s thickness has been considered as a function of the number of floors, and its variation over the height goes from 0.60 m to 0.45 m, as detailed in Section 4.1. Table 2 collects all the typological parameters used to define the building stocks. As the reader can note, combining all of them, the number of façades under consideration is 750.

TABLE 2. Summary of the parameters used to define the buildings’ sample and their corresponding ranges.
For each of these typologies, the following information has to be defined: the vulnerability class on the base of the SAVE parameters, the collapse multiplier, which will be found through numerical simulations, and the frequency of occurrence in a typological database.
Looking at the vulnerability class assignment, the exploitable parameters for the SAVE method are the vertical structure, the horizontal technology, and the number of floors. Based on these parameters, Table 3; Table 4; Table 5 report the vulnerability class assignments for buildings with 1–2, 3-4 and 5 floors, respectively. These values are used to develop the fragility curves as reported in Section 4.
3.2 Limit solution to the BVP by way of the PRD method
The approximate solution to the minimum problem (11) is obtained by restricting the search of the minimum in the class
of

FIGURE 3. The infinite-dimensional space
A generic piecewise rigid displacement
In Equation 16,
and the
Assuming homogeneous boundary conditions, restrictions (16) can be expressed in matrix forms as a function of the vector
Finally, the discretised version of the minimum problem (14), which approximates the minimum continuum problem (8), reads:
where the objective function representing the potential energy of the external body loads
The limit analysis problem can be then solved through a sequence of LP problems as:t
The minimisation problem (20) transforms the original minimisation problem (8) for a continuum, into a minimisation problem for a structure composed of rigid parts, acted on by given loads and given settlements and subject to unilateral contact conditions along the interfaces. Problem (20) is a standard linear finite-dimensional minimisation problem, as both objective function and constraints are linear. The existence of the solution of this approximate problem is trivially guaranteed if the original problem is bounded from below. For small problems, it can be solved exactly with the simplex method (Dantzig et al., 1955), while for large problems, interior-point algorithms represent efficient and fast alternatives (Mehrotra, 1992; Vanderbei, 2015; Dantzig, 2016).
4 Numerical implementation
The present Section illustrates the numerical pipeline adopted to define the fragility curves combining the SAVE and PRD methods. In particular, Section 4.1 provides a detailed overview of how masonry buildings coming from the PLINIVS database have been modelled, considering geometrical and mechanical information. Section 4.2 shows how these features have been modelled and, after that, framed in an LP problem to define the collapse load multiplier for each case. It is worth noting that the present analysis looks at the in-plane collapse load of the main 2D façade of a masonry building.
4.1 Geometrical and mechanical description of the buildings’ sample
The present Section gives an overview of the procedure adopted to parametrically model geometries and mechanical features of the buildings’ stock extracted from the PLINIVS database. The 2D analysis of a building is carried out by referring to its main façade. For example, looking at three-story buildings, Figures 4A, B describe the geometries and loading conditions of two facades having one and two openings per floor, respectively.
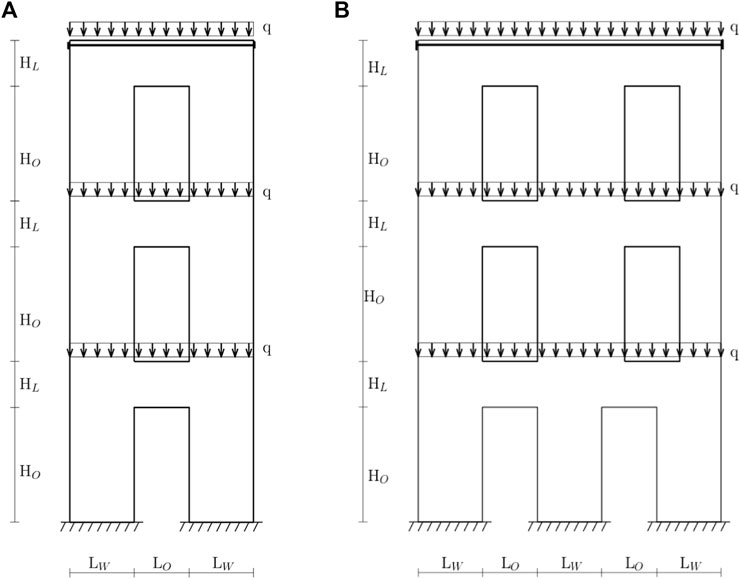
FIGURE 4. The two strategies adopted to model horizontal loads in the presence of deformable (A) or rigid slabs (B).
The inter-story height
Table 6 reports geometric data needed to generate a masonry building of the sample referring to the symbols introduced in Figure 4. It is worth emphasising that these geometrical features as well as the openings number, do not depend on the building height but only on the building baseline length. Indeed, structures with baseline lengths equal to 4 m show only one opening per floor; the ones whose length is equal to 6 m or 6.6 m, show two openings per floor; and façades with a baseline length equal to 5 m can have one or two openings per floor as illustrated in Table 6.
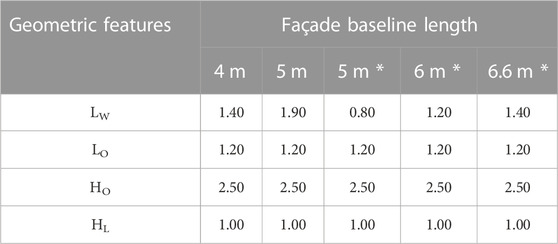
TABLE 6. Summary of the geometric features needed to generate a masonry façade of the sample according to Figure 4. The symbol * refers to facades with two openings per floor (Figure 4B).
Regarding the loads, mass density values depend on the masonry typology as reported in Table 7.

TABLE 7. Density values [kg/m3] adopted for the five masonry typologies considered in the present analysis.
The presence of slabs and the corresponding transmitted live loads are modelled through additional linear loads placed as in Figure 4, and whose gross values are reported in Table 8. The liner loads adopted in the numerical analyses can be derived by multiplying these values by the slab’s net orthogonal length, assumed to equal 5 m.

TABLE 8. Live loads q [kg/m2] due to the different slab typologies and also including the slab’s self-weight.
Lastly, the presence of tie roads depends on the number of floors and, according to the PLINIVS database, whenever they are present (i.e., for wooden and vaulted slabs only), one assumes:
- One-, two- and three-story façade has only one tie-rod at the uppermost level;
- Four-story facades have two tire rods at the second and fourth levels; and,
- Five-story facades show two tire rods at the third and fifth levels.
Buildings with reinforced concrete and steel slabs are assumed not to show any tire rod systems. The tie-rod strength (
It is assumed that the square anchor plate edge length is 0.30 m, the cable has a net diameter of 30 mm, and it is made up of steel with a yield tension of 240 MPa. Moreover, the calculation assumes a confidence factor of 1.35 according to the Italian national code (Ministero delle Infrastrutture e dei Trasporti, 2018) and the masonry compressive strength values as detailed in Table 9.
Based on these assumptions, once the masonry typology has been fixed, Eq. 23 yields the maximum tensile force that the tie-rod can sustain and that will be used in energy minimisation, as detailed in the next Section.
4.2 PRD numerical modelling of the buildings’ sample
The minimum energy problem is formulated as an LP problem whose most general version reads:
with
while for rigid slabs (i.e., steel and RC):
where

FIGURE 5. Overview of five geometrical models and corresponding discretisations used to describe three-story masonry buildings. Yellow stripes denote linear loads due to and transmitted by the slabs, while red lines show the presence of tire rods. (A) L4O1; (B) L5O1; (C) L5O2; (D) L6O2; (E) L7O2.
Referring to three-story masonry buildings, Figure 6 shows five digital models and the corresponding discretisations for different façade baseline lengths. Particularly, the number of elements ranges from 6,194 for a baseline of 4 m, to 9,862 for a baseline of 6.6 m.
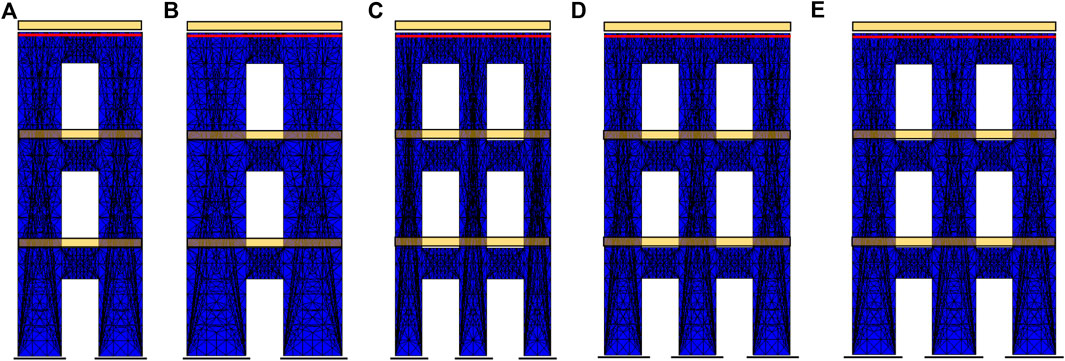
FIGURE 6. Vulnerability class assignment according to the 1998 European Macroseismic Scale, EMS'98 (Grünthal, 1998).
Table 10 shows the number of elements used to discretise the digital models as a function of the building’s baseline length and floor number. The robustness of the proposed discretisation against two different numerical approaches is validated here (Iannuzzo et al., 2021).
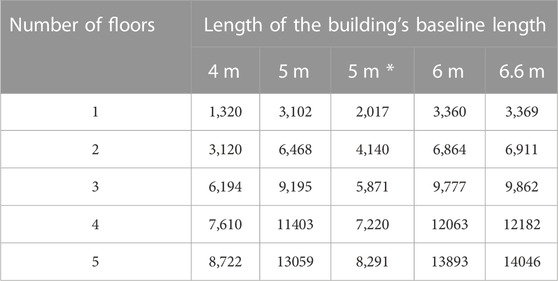
TABLE 10. The number of elements adopted to discretise the buildings’ geometries. The symbol * refers to buildings with a horizontal length of 5 m but with two openings per floor. In red are the numbers of digital models elements depicted in Figure 6.
The computational time required to solve a single optimisation problem is 0.15 s using an agile laptop with an AMD Ryzen 7 5700U and using Mosek (Mosek, 2010) as a solver.
4.3 Results and discussions
PRD results, obtained in terms of load multipliers, are translated into peak ground acceleration (PGA) according to the procedure detailed in (Ministero delle Infrastrutture e dei Trasporti, 2018), as
with
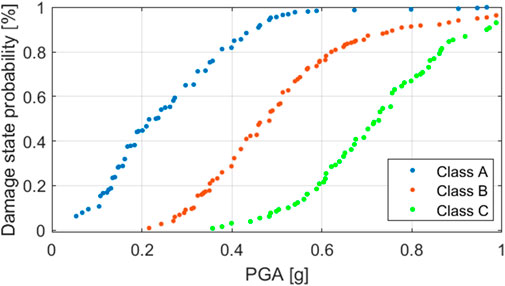
FIGURE 7. PRD-based fragility curves for the three vulnerability classes as from the SAVE procedure.
The PRD results obtained are then approximated through lognormal curves
and the corresponding smooth curves are represented in Figure 8, again as a function of the three vulnerability classes. Equation 28 is the cumulative of a normal distribution with average value
In Figure 9, the PRD-based fragility curves are compared with the ones proposed in (Zuccaro et al., 2017), which evaluate the minimum acceleration triggering the first damage mechanism selected among predetermined mechanisms (including also out-of-plane ones) on a sample of buildings from the PLINIVS database. In this sense, it is worth noting that the PRD-based curves are associated with higher PGA levels since the curves evaluated in (Zuccaro et al., 2017) are strongly influenced by the out-of-plane mechanisms occuring at lower levels of PGA.
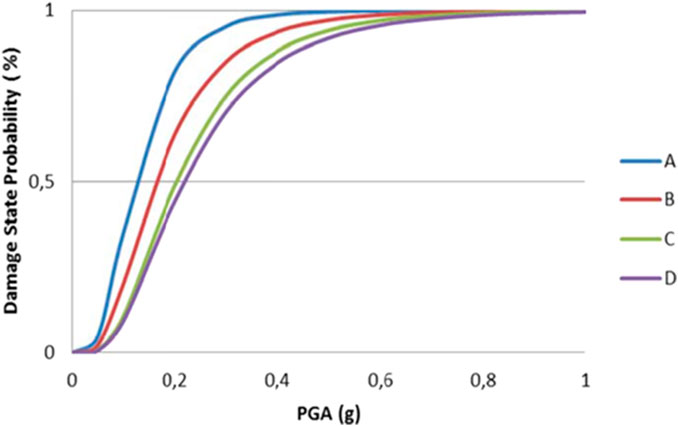
FIGURE 9. Comparison between PRD-based fragility curves (dashed lines) and the ones (solid line) related to the first damage mechanism proposed in (Zuccaro et al., 2017).
Restricting to vulnerability class B, shows the PRD-based fragility curve together with the ones proposed in (Cattari et al., 2014) for different damage levels. As expected, the numerical-based curve is in good agreement with the damage level D5, corresponding to the global collapse of the structure. Indeed, as applied, the PRD method can only detect the mechanism driving the structure to collapse without the possibility of accounting for lower damage levels.
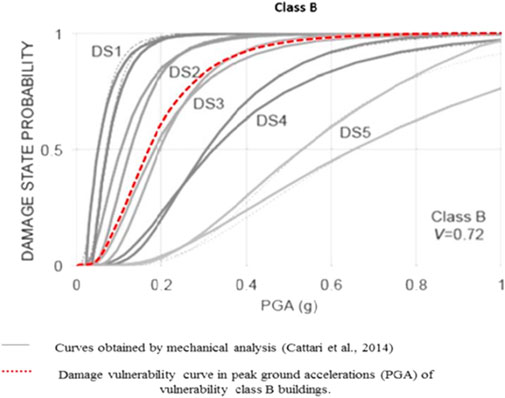
FIGURE 10. Comparison among the PRD-based fragility curve for vulnerability class B with the ones proposed in (Cattari et al., 2014) for different damage levels. The PRD results match with the damage state D5.
5 Conclusion
The present paper proposes a novel analytic methodology to define masonry structures’ fragility curves, employing a hybrid approach that combines the SAVE and PRD methods. SAVE is an observation-based approach to estimating the vulnerability class of buildings based on actual damages after past seismic events. It provides a quick procedure to identify the structure’s seismic behaviour. The PRD method is a numerical approach to solving boundary value problems for normal, rigid, no-tension materials. These two methods were combined on an extensive sample of 750 masonry buildings extracted from the PLINIVS database, which collects typological-structural information on about 250,000 ordinary masonry buildings distributed throughout the Italian national territory. Each masonry structure of the sample was modelled referring to its 2D main façade. After that, the SAVE procedure was applied to assign a vulnerability class to each of them, while a PRD numerical campaign was conducted to compute the corresponding collapse loads. Specifically, PRD digital models were constructed to account for the relevant typological-structural and geometrical features. Lastly, the PRD and SAVE results were combined to produce fragility curves related to the three vulnerability classes as from the SAVE method.
The results of the proposed approach were benchmarked against other numerical strategies based on predetermined mechanisms. The comparison showed a good agreement between the PRD results and the fragility curves present in the Literature, confirming the robustness and effectiveness of the proposed approach, particularly when referring to the damage level D4-D5, as from EMS'98. The estimated curves can be used for the National Risk Assessment in Italy and can also be adapted for the seismic risk evaluation at different scales. Indeed, the main advantage of this methodology is its possibility to analytically evaluate fragility curves considering specific structural and geometric characteristics, which, combined with the ease of modelling and the solving time, allows it to be used on a large-scale assessment of masonry structures. Moreover, the proposed procedure can also be used to localise fragility curves modelling the seismic risk assessments of specific local areas (i.e., local, regional) accounting explicitly for the frequency of occurrence of the related typological-structural and geometrical features by also employing other databases (Zuccaro et al., 2023). This strategy will be pursued in forthcoming contributions while also validated against other empirical fragility curves in the Literature.
However, the current methodology accounts only for 2D in-plane collapse mechanisms. In contrast, out-of-plane ones, as well as information on lower levels of damage, such as D1/D3, cannot be provided. Further development will include extending the numerical approach to overcome these limitations while exploiting data provided by other databases.
Data availability statement
The raw data supporting the conclusions of this article will be made available by the authors, without undue reservation.
Author contributions
FP: Writing—Review and Editing, Software, Formal analysis, Investigation, Data Curation; DD: Writing—Original Draft, Writing—Review and Editing, Conceptualization, Investigation, Validation, Funding acquisition; AM: Writing—Original Draft, Writing—Review and Editing, Software, Investigation, Visualization, Validation; CO: Methodology, Investigation, Writing—Review and Editing; GM: Writing—Review and Editing, Investigation, Validation, Supervision; AI: Writing—Original Draft, Writing—Review and Editing, Methodology, Conceptualization, Software, Formal analysis, Investigation, Supervision.
Funding
This research was supported by the Italian Ministry of University and Research through the Programme “Rita Levi Montalcini for young researchers” (FFO 2020).
Conflict of interest
The authors declare that the research was conducted in the absence of any commercial or financial relationships that could be construed as a potential conflict of interest.
Publisher’s note
All claims expressed in this article are solely those of the authors and do not necessarily represent those of their affiliated organizations, or those of the publisher, the editors and the reviewers. Any product that may be evaluated in this article, or claim that may be made by its manufacturer, is not guaranteed or endorsed by the publisher.
References
Angelillo, M., Fortunato, A., Gesualdo, A., and Zuccaro, A. I. e. G. (2018). Rigid block models for masonry structures. Int. J. Mason. Res. Innovation 3 (4), 349–368. doi:10.1504/ijmri.2018.095701
Ansal, D. D'Ayala e. A. (2012). Non linear push over assessment of heritage buildings in Istanbul to define seismic risk. Bull. Earthq. Eng. 10, 285–306. doi:10.1007/s10518-011-9311-1
Anzellotti, G. (1985). A class of convex non-coercive functionals and masonry-like materials. Ann. l'IHP Anal. non linéaire 2 (4), 261–307. doi:10.1016/s0294-1449(16)30398-5
Baggio, C., Bernardini, A., Colozza, R., Corazza, L., Della Bella, M., Di Pasquale, G., et al. (2007). Field manual for post-earthquake damage and safety assessment and short term countermeasures (AeDES). Europe: European Commission—Joint Research Centre—Institute for the Protection and Security of the Citizen, 22868.
Baraldi eCecchi, D. A. (2017). A full 3D rigid block model for the collapse behaviour of masonry walls. Eur. J. Mechanics-A/Solids 64, 11–28. doi:10.1016/j.euromechsol.2017.01.012
Benedetti, D., Benzoni, G., and Parisi, M. (1988) Seismic vulnerability risk evaluation for old urban nuclei,» Earthquake engineering and structural dynamics. Wiley Online Library. Hoboken.
Bernardini, A., D'Ayala, D., Meroni, F., and Valluzzi, P. e. M. (2008). «Damage scenarios in the vittorio veneto town centre (NE Italy),» bollettino di Geofisica teorica. Boll. Geofis. Teor. Appl. 49, 463.
Bernardini, A., Gori, R., and Modena, C. (1990). «An application of coupled analytical models and experiential knowledge for seismic vulnerability analyses of masonry buildings. Eng. Asp. Earthq. Phenom., 161–180. doi:10.1533/9780857098986.3.334
Bernardini, A., Valluzzi, M., Modena, C., and Speranza, D. D'Ayala e. E. (2008). «Vulnerability assessment of the historical masonry building typologies of Vittorio Veneto (NE Italy). » Boll. Geofis. Teor. Appl. 49, 463–483.
Borzi, B.-., and Pinho, H. C. e. R. (2008). Simplified pushover-based earthquake loss assessment (SP-BELA) method for masonry buildings. Int. J. Archit. Herit. 2, 353–376. doi:10.1080/15583050701828178
Cacace, F., Zuccaro, G., and Perelli, D. D. G. e. F. L. (2018). Building inventory at national scale by evaluation of seismic vulnerability classes distribution based on Census data analysis: BINC procedure. Int. J. disaster risk Reduct. 28, 384–393. doi:10.1016/j.ijdrr.2018.03.016
Calvi, G. (1999). A displacement-based approach for vulnerability evaluation of classes of buildings. J. Earthq. Eng. 3, 411–438. doi:10.1080/13632469909350353
Calvi, G., Pinho, R., Magenes, G., Brommer, J., and Restrepo-VélezCrowley, L. e. H. (2006). Development of seismic vulnerability assessment methodologies over the past 30 years. ISET J. Earthq. Technol. 43, 75–104.
Cascini, L., and Gagliardo ePortioli, R. F. (2018). LiABlock_3D: A software tool for collapse mechanism analysis of historic masonry structures. Int. J. Archit. Herit. 14, 75–94. doi:10.1080/15583058.2018.1509155
Cattari, S., Lagomarsino, S., and Ottonelli, D. (2014). “Fragility curves for masonry buildings from empirical and analytical models,” in Proceedings of the 2nd Conference on Earthquake Engineering and Seismology, Istanbul, Turkey, 25–29.
Chiozzi, A., Milani, G., and Tralli, A. (2017). A Genetic Algorithm NURBS-based new approach for fast kinematic limit analysis of masonry vaults. Comput. Struct. 182, 187–204. doi:10.1016/j.compstruc.2016.11.003
Crowley, H.-., and Pinho eBommer, R. J. (2004). A probabilistic displacement-based vulnerability assessment procedure for earthquake loss estimation. Bull. Earthq. Eng. 2, 173–219. doi:10.1007/s10518-004-2290-8
Cusano, C., Angjeliu, G., Montanino, A., and Cennamo, G. Z. e. C. (2021). Considerations about the static response of masonry domes: A comparison between limit analysis and finite element method. Int. J. Mason. Res. Innovation 6, 502–528. doi:10.1504/ijmri.2021.118835
Cusano, C., Montanino, A., Cennamo, C., and Angelillo, G. Z. e. M. (2021). Geometry and stability of a double-shell dome in four building phases: The case study of santa maria alla sanità in naples. Int. J. Archit. Herit., 1–27. doi:10.1080/15583058.2021.1922954
Cusano, C., Montanino, A., Olivieri, C., and Paris eCennamo, V. C. (2021). Graphical and analytical quantitative comparison in the domes assessment: The case of san francesco di Paola. Appl. Sci. 11, 3622. doi:10.3390/app11083622
D'Ayala, D. (2013). “«Assessing the seismic vulnerability of masonry buildings,” in Handbook of seismic risk analysis and management of civil infrastructure systems. Editors K. Goda, and S. Tesfamariam, 334–365.
Dantzig, G. B., Orden, A., and Wolfe, P. (1955). The generalized simplex method for minimizing a linear form under linear inequality restraints. Pac. J. Math. 5 (2), 183–195. doi:10.2140/pjm.1955.5.183
De Angelis, A., Maddaloni, G., and Pecce, M. (2020). Seismic vulnerability assessment of a monumental masonry building. Infrastructures 5, 93. doi:10.3390/infrastructures5110093
DeJong, M. (2009). Seismic assessment strategies for masonry structures. Doctoral dissertation, Boston: Massachusetts Institute of Technology.
Dolce, M., Prota, A., Borzi, B., da Porto, F., Lagomarsino, S., Magenes, G., et al. (2021). Seismic risk assessment of residential buildings in Italy. Bull. Earthq. Eng. 19, 2999–3032. doi:10.1007/s10518-020-01009-5
Donà, M., Carpanese, P., Follador, V., and Sbrogliò eDa Porto, L. F. (2020). Mechanics-based fragility curves for Italian residenzial URM buildings. Bull. Earthq. Eng., 1–29. doi:10.1007/s10518-020-00928-7
DPCM (2011). Evaluation and reduction of the seismic risk of the cultural heritage with reference to the technical standards for buildings referred to in the Ministerial Decree of 14 January 2008.
Fajifar, P. (2000). A non-linear analysis method for performance-based seismic design. Earthq. spectra 16, 573–592. doi:10.1193/1.1586128
Folić, R., and Čokić, e. M. (2021). Fragility and vulnerability analysis of an RC building with the application of nonlinear analysis. Buildings 11, 390. doi:10.3390/buildings11090390
Fortunato, A., Babilio, E., Lippiello, M., Gesualdo, A., and Angelillo, M. (2016). Limit analysis for unilateral masonry-like structures. Open Constr. Build. Technol. J. 10, 346–362. doi:10.2174/1874836801610010346
Fortunato, A., Fraternali, F., and Angelillo, M. (2014). Structural capacity of masonry walls under horizontal loads. Ing. Sismica 31 (1), 41–49.
Fortunato, A., Gesualdo, A., Mascolo, I., and Monaco, M. (2022). P-Bézier energy optimisation for elastic solutions of masonry-like panels. Int. J. Mason. Res. Innovation 7, 1–125. doi:10.1504/ijmri.2021.10037508
Gesualdo, A., Calderoni, B., Iannuzzo, A., and Fortunato eMonaco, A. M. (2020). Minimum energy strategies for the in-plane behaviour of masonry. Frat. Ed. Integrità Strutt. 14 (51), 376–385. doi:10.3221/igf-esis.51.27
Gesualdo, A., Calderoni, B., Sandoli, A., and Monaco, M. (2019). Minimum energy approach for the in-plane shear resistance of masonry panels. Ing. Sismica 36, 42–53.
Giaquinta, M., and Giusti, E. (1985). Researches on the equilibrium of masonry structures. Archive Ration. Mech. Analysis 88 (4), 359–392. doi:10.1007/bf00250872
Gilbert, M., and Melbourne, C. (1994). Rigid-block analysis of masonry structures. Struct. Eng. 72, 21.
Gobbin, F., and Lemos, G. D. F. e. J. (2021). Numerical procedures for the analysis of collapse mechanisms of masonry structures using discrete element modelling. Eng. Struct. 246, 113047. doi:10.1016/j.engstruct.2021.113047
Grillanda, N., and Milani, M. V. e. G. (2020a). ANUB-aggregates: A fully automatic NURBS-based software for advanced local failure analyses of historical masonry aggregates. Bull. Earthq. Egnineering 18. doi:10.1007/s10518-020-00848-6
Grillanda, N., Valente, M., Milani, G., Chiozzi, A., and Tralli, A. (2020). Advanced numerical strategies for seismic assessment of historical masonry aggregates. Eng. Struct. 212, 110441. doi:10.1016/j.engstruct.2020.110441
Iannuzzo, A., Angelillo, M., De Chiara, E., De Guglielmo, F., De Serio, F., Ribera eGesualdo, F. A., et al. (2018). Modelling the cracks produced by settlements in masonry structures. Meccanica 53 (7), 1857–1873. doi:10.1007/s11012-017-0721-2
Iannuzzo, A., Block, P., Angelillo, M., and Gesualdo, A. (2021). «A continuous energy-based numerical approach to predict fracture mechanisms in masonry structures: CDF method. Comput. Struct. 257, 106645. doi:10.1016/j.compstruc.2021.106645
Iannuzzo, A., and VanMele eBlock, T. P. (2020). Piecewise rigid displacement (PRD) method: A limit analysis-based approach to detect mechanisms and internal forces through two dual energy criteria. Mech. Res. Commun. 107, 103557. doi:10.1016/j.mechrescom.2020.103557
Kao, G., Iannuzzo, A., Thomaszewski, B., Coros, S., and Van Mele eBlock, T. P. (2022). Coupled rigid-block analysis: Stability-aware design of complex discrete-element assemblies. Computer-Aided Des. 146, 103216. doi:10.1016/j.cad.2022.103216
Kooharian, A. (1952). Limit analysis of voussoir (segmental) and concrete archs. J. Am. Concr. Inst. 24 (4), 317–328. doi:10.14359/11822
Lagomarsino, S., and Podesta, S. (2004). «Seismic vulnerability of ancient churches: I. Damage assessment and emergency planning,» earthquake spectra. Earthq. Spectra 20, 377–394. doi:10.1193/1.1737735
Livesley, R. K. (1978). Limit analysis of structures formed from rigid blocks. Int. J. Numer. Methods Eng. 12 (12), 1853–1871. doi:10.1002/nme.1620121207
Malena, M., Portioli, F., GagliardoTomaselli, R. G., and De Felice, L. (2019). Collapse mechanism analysis of historic masonry structures subjected to lateral loads: A comparison between continuous and discrete models. Comput. Struct. 220, 14–31. doi:10.1016/j.compstruc.2019.04.005
Manfredi, V., Masi, A., Nicodemo, G., and Digrisolo, A. (2022). Seismic fragility curves for the Italian RC residential buildings based on nonlinear dynamic analyses. Bull. Earthq. Eng., 1–42. doi:10.1007/s10518-022-01605-7
Mehrotra, S. (1992). On the implementation of a primal-dual interior point method. SIAM J. Optim. 2 (4), 575–601. doi:10.1137/0802028
Milani, G. (2019). Fast vulnerability evaluation of masonry towers by means of an interactive and adaptive 3D kinematic limit analysis with pre-assigned failure mechanisms. Arch. Herit. 13, 941–962. doi:10.1080/15583058.2019.1645241
Ministero delle Infrastrutture e dei Trasporti (2018). Norme tecniche delle costruzioni. D.M.17 gennaio 2018.
Monaco, M., Aurilio, M., Tafuro, A., and Guadagnuolo, M. (2021). Sustainable mortars for application in the cultural heritage field. Materials 14, 598. doi:10.3390/ma14030598
Monaco, M., Bergamasco, I., and Betti, M. (2018). A no-tension analysis for a brick masonry vault with lunette. J. Mech. Mater. Struct. 13, 703–714. doi:10.2140/jomms.2018.13.703
Montanino, A., De Gregorio, D., and Olivieri eIannuzzo, C. A. (2022). The continuous airy-based for stress-singularities (CASS) method: An energy-based numerical formulation for unilateral materials. Int. J. Solids Struct. 255, 111954. doi:10.1016/j.ijsolstr.2022.111954
Montanino, A., Olivieri, C., and Angelillo, G. (2021). From stress to shape: Equilibrium of cloister and cross vaults. Appl. Sci. 11, 3846. doi:10.3390/app11093846
Mosek, A. P. S. (2010). «The MOSEK optimization software. Available at http://www.mosek.com.
Nodargi, N. A., and Bisegna, P. (2022). A finite difference method for the static limit analysis of masonry domes under seismic loads. Meccanica 57, 121–141. doi:10.1007/s11012-021-01414-3
Nodargi, N., and Bisegna, P. (2021). Collapse capacity of masonry domes under horizontal loads: A static limit analysis approach. Int. J. Mech. Sci. 212, 106827. doi:10.1016/j.ijmecsci.2021.106827
Nodargi, N., and Bisegna, P. (2021). Collapse capacity of masonry domes under horizontal loads: A static limit analysis approach. Int. J. Mech. Sci. 212, 106827. doi:10.1016/j.ijmecsci.2021.106827
Ochsendorf, J. (2022). Collapse of masonry structures. Doctoral dissertation, Cambridge: University of Cambridge.
OPCM, Ordinance of the President of the Council of Ministers, n (2006). General criteria for the identification of seismic zones and for the formation and updating of the lists of the same zones, 3519.
Poljansek, K., Casajus Valles, A., Marin Ferrer, M., De Jager, A., Dottori, F., Galbusera, L., et al. (2019). Recommendations for national risk assessment for disaster risk management in EU, EUR 29557 EN. Luxembourg: Publications Office of the European Union. doi:10.2760/147842
Portioli, F., and Cascini, L. (2017). Large displacement analysis of dry-jointed masonry structures subjected to settlements using rigid block modelling. Eng. Struct. 148, 485–496. doi:10.1016/j.engstruct.2017.06.073
Presidenza del Consiglio dei Ministri «DPCM "Approvazione dei modelli per il rilevamento dei danni, a seguito di eventi calamitosi, ai beni appartenenti al patrimonio culturale. Available at: https://www.gazzettaufficiale.it/eli/id/2006/03/07/06A02214/sg (Accesed January 9, 2023).
Presidenza del Consiglio dei Ministri (2013). «DPCM "Approvazione del manuale per compilare la scheda di rilievo del danno ai beni culturali. Available at: https://www.protezionecivile.gov.it/it/normativa/dpcm-del-13-marzo-2013 (Accesed January 09, 2023).
Riuscetti, M., Carniel, R., and Cecotti, C. (1997). Seismic vulnerability assessment of masonry buildings in a region of moderate seismicity. Ann. Geophys. 40, 5. doi:10.4401/ag-3877
Rossetto, T., Ioannou, I., and Grant, D. (2013). «Existing empirical fragility and vulnerability functions: Compendium and guide for selection,» in GEM technical report 2013–X, pavia. Gem. Found. 239, 112280. doi:10.1016/j.engstruct.2021.112280
Ruggieri, S., Calò, M., and Cardelicchio eUva, A. G. (2022). Analytical-mechanical based framework for seismic overall fragility analysis of existing RC buildings in town compartments. Bull. Earthq. Eng. 20, 8179–8216. doi:10.1007/s10518-022-01516-7
Shabani, A., Kioumarsi, M., and Zucconi, M. (2021). «State of the art of simplified analytical methods for seismic vulnerability assessment of unreinforced masonry buildings. » Eng. Struct. 239, 112280. doi:10.1016/j.engstruct.2021.112280
Torelli, G., D'Ayala, D., and Bartoli, M. (2019). «Analytical and numerical seismic assessment of heritage masonry towers. Bull. Earthq. Eng. 18, 969. doi:10.1007/s10518-019-00732-y
UNDRR Sendai framework for disaster risk reduction 2015-2030. Available at: https://www.undrr.org/publication/sendai-framework-disaster-risk-reduction-2015-2030.
Zuccaro eCacace, G. F. (2015). «Seismic vulnerability assessment based on typological characteristics. First level procedure S.A.V.E. Soil Dyn. Earthq. Eng. 69, 262–269. doi:10.1016/j.soildyn.2014.11.003
Zuccaro, G., Dato, F., Cacace, F., and De Gregorio eSessa, D. S. (2017). Seismic collapse mechanisms analyses and masonry structures typologies: A possible correlation. Ing. Sismica 34, 121–149.
Zuccaro, G., Dolce, M., Perelli, F., and Speranza, D. (2023). Cartis: A method for the typological-structural characterization of Italian ordinary buildings in urban areas. Sect. Earthq. Eng. 63, 102478. doi:10.1016/j.ijdrr.2021.102478
Keywords: seismic fragility curves, maaonry structures, vulnerability, risk assessment, limit analysis, piecewise rigid displacement
Citation: Perelli FL, De Gregorio D, Montanino A, Olivieri C, Maddaloni G and Iannuzzo A (2023) Energy-based modelling of in-plane fragility curves for the 2D ultimate capacity of Italian masonry buildings. Front. Built Environ. 9:1127523. doi: 10.3389/fbuil.2023.1127523
Received: 19 December 2022; Accepted: 24 January 2023;
Published: 17 February 2023.
Edited by:
Maria Zucconi, University Niccolò Cusano, ItalyReviewed by:
Francesco Clementi, Marche Polytechnic University, ItalySergio Ruggieri, Politecnico di Bari, Italy
Copyright © 2023 Perelli, De Gregorio, Montanino, Olivieri, Maddaloni and Iannuzzo. This is an open-access article distributed under the terms of the Creative Commons Attribution License (CC BY). The use, distribution or reproduction in other forums is permitted, provided the original author(s) and the copyright owner(s) are credited and that the original publication in this journal is cited, in accordance with accepted academic practice. No use, distribution or reproduction is permitted which does not comply with these terms.
*Correspondence: Antonino Iannuzzo, YW5pYW5udXp6b0B1bmlzYW5uaW8uaXQ=
 Francesca Linda Perelli
 Daniela De Gregorio
 Andrea Montanino
 Carlo Olivieri
 Giuseppe Maddaloni5
 Antonino Iannuzzo