
94% of researchers rate our articles as excellent or good
Learn more about the work of our research integrity team to safeguard the quality of each article we publish.
Find out more
ORIGINAL RESEARCH article
Front. Built Environ., 22 May 2023
Sec. Construction Management
Volume 9 - 2023 | https://doi.org/10.3389/fbuil.2023.1111563
This article is part of the Research TopicDoctoral Research in Construction ManagementView all 10 articles
 Yamini Kodavatiganti1
 Md Adilur Rahim2,3,4*
 Carol J. Friedland1,2,3
 Rubayet Bin Mostafiz2,3
 Arash Taghinezhad1,2,5
 Shandy Heil6
Residential foundation selection is critical for the lifetime performance of the project, but the type of foundation selected can depend on cost. This study aims to compare the new construction costs of residential slab-on-fill and four types of crawl space foundations for residential projects by quantifying the material quantities for each and exploring the effect of building characteristics on material quantities and total costs. The building characteristics selected are size (139 m2, 186 m2, and 232 m2), footprint aspect ratio (1:1, 1:2.5, and 1:5) and first floor elevation (0 m–1.2 m in 0.3 m increments). We find that material quantities and total costs change not only with building size and elevation, but also with footprint aspect ratio. Applying 2022 RSMeans Building Construction Cost data, the results show that for any building size, aspect ratio, or elevation, raised wood flooring on pier foundations ($118–$180 per m2) and slab on fill ($103–$211 per m2) are the least expensive, while crawl space foundations with stemwalls are the most expensive ($147–$280 per m2). The results of this study can be used by residential builders, developers and designers in evaluating foundation costs and design alternatives. The methodology may also be adapted for use in other applications such as flood mitigation or energy efficiency projects or environmental sustainability assessments.
This paper demonstrates a fundamental methodology to analyse the estimated construction costs of elevated foundation methods that are typical for single-family residential (SFR) structures. Structures that are elevated above probable flood risk are more likely to resist damages caused from hurricane storm surge, riverine flooding, and changes in future conditions, due to sea level rise and drainage impacts from increased development. (FEMA, 2013; Godfrey et al., 2015). Post flood remediation is often expensive (Taghinezhad et al., 2021) and homeowners often choose not to rebuild if the costs are very high (Gyourko and Saiz, 2004; Gallagher & Hartley, 2017). In addition, mitigating existing structures that have sustained past damage through elevation retrofit can prove to be cost-prohibitive for many property owners; validating the importance of proactively elevating SFR structures above probable or historic flood risk during new construction. Therefore, providing property owners an understanding of the construction costs associated with various foundation methods will aid in the selection of the optimal foundation configuration to meet design criteria and reduce potential future losses.
While several studies on construction cost estimation methodology have been identified, very few have focused on foundation costs. For example, Del Bianco et al. (2012) studied the cost and construction time for nine new residential construction projects in Alabama, United States, with raised floor foundations (slab-on-fill, concrete slab on stemwall with fill, and raised wood floor system on stemwall). Actual project costs were provided by the participating builders and contain region-specific material and labor prices. Since the SFR projects were from the same region and constructed approximately at the same time, the cost comparisons are valid. However, material and labor prices change with time and location, and independently of each other. Hence the results cannot be generally applied to other projects even though the findings provide a useful comparison of foundation costs for comparable projects.
Other studies have used computer modeling techniques such as neural networks and Case Based Reasoning to model overall project costs using either historical or simulated project information as input (e.g., Kim et al., 2004; Leśniak and Zima, 2018). These techniques have the advantage of being customizable for specific cost outputs such as foundation costs or exterior envelope costs. However, the accuracy of the analysis depends on having a large input dataset, which may not be practicable for all but the larger developers and construction firms (Juszczyk, 2017).
Econometric analyses predicting construction price indices have been proposed as a cost estimation method (Joukar & Nahmens, 2016; Rafiei and Adeli, 2018; Zhang et al., 2019; Mahdavian et al., 2021). While these methods may be useful to forecast commodity prices, they cannot be used to develop a generalized estimation methodology given the volatility of such indices. For instance, the National Association of Home Builders (NAHB) survey of home construction costs found that foundation costs were 10.8% of the total cost in 2017, but increased to 11.8% of total cost in 2019 owing in part to an increase in ready mix concrete prices (NAHB, 2019). Prices derived from commodity and labour prices based on economic trends are used in published construction cost databases such as Robert Snow Means (RSMeans, 2022). Such databases are typically national averages published for each year. However, such aggregate costs cannot be applied without adjusting for location and time using an inflation factor. Since material prices do not vary in tandem across time, a single inflation factor cannot represent actual current prices across the board. Additionally, construction material prices can vary with factors such as project scale and supplier discounts (Estes, 2016).
Given the drawbacks of published cost databases, material quantity based cost estimation is more accurate. Building Information Modelling (BIM) is an efficient tool given the quantity take-off and 4-D scheduling capabilities of several software (e.g., Elghaish et al., 2019; Lee et al., 2020). Design changes are also easily tracked and therefore cost estimate implications are easy to compare in different scenarios (Juszczyk et al., 2016). BIM based cost estimation is both faster and more accurate than manual cost estimation (Haider et al., 2020). However, relying on BIM at this juncture is premature due to the current limitations of the software. BIM requires participation from all parties in the construction process, which is not yet the case (Zhao and Wang, 2014). The costs of the software and lack of skills are also cited for low uptake of BIM (Ghaffarianhoseini et al., 2017). Additionally, the lack of universal coding structures has proved to be a hindrance to wider acceptance of BIM in the construction industry (Ying, 2019). BIM also requires a high level of integration and task coordination between various stakeholders. Since there is always a lag in level of completion between the entities, cost estimation is often delayed as the model does not have sufficient details for take-offs (Jordan, 2017).
This study aims to develop a methodological framework to calculate material quantity-based foundation cost estimates for a single-family home. This paper translates prescriptive International Residential Code 2015 (IRC, 2015, 2014) foundation requirements to a series of quantity take-off formulae and applies national RSMeans (2022) cost data. Material quantity formulae are developed for slab-on-fill (Figure 2) and crawl space foundations, with separate formulae for stemwall with concrete slab-on fill floor (Figure 3), stemwall with concrete slab on internal concrete masonry unit (CMU) piers (Figures 4, 5), stemwall with wood framed floor on internal CMU piers (Figure 6), and pier with wood framed floor foundations (Figure 7). Material quantities are calculated to demonstrate the methodology for representative buildings with footprint areas of 139, 186, and 232 m2 (1,500, 2,000 and 2,500 sq. ft.), aspect ratios of 1:1, 1:2.5, and 1:5, and first floor elevations (i.e., the top of the lowest floor of a residential building without a basement) of 0 m–1.2 m in 0.3 m increments (0–4 ft. in 1 ft. increments). RSMeans (2022) construction costs are applied to the quantity take-off data to estimate foundation costs. This offers a generalized methodology of applying construction cost data to material quantities.
There are many potential applications of the formulae and results developed in this paper. First, the formulae may be directly applied by anyone involved in material quantity take-off for IRC 2015-compliant foundations, including construction estimators and homeowners. The clear presentation and comprehensiveness of the formulae allow for usage by non-professionals and may be modified in the event of future code revisions. By separating material quantities from construction cost data, more comprehensive, location-based cost data may be applied to the derived quantities, resulting in improved cost estimates for residential construction professionals that are easily refined based on changes in labour and productivity. The results themselves are beneficial for many stakeholders in the residential construction decision making process. These derived quantities can also be used in the analysis of other building performance metrics such as carbon footprint (Matthews et al., 2016) and embodied energy (Bansal et al., 2020). Homeowners can use the results of this paper to understand the cost implications of selecting a particular foundation type or elevating their home at the time of construction. Building code officials and local decision makers may find value in this paper as it presents a comparison of costs that may be useful in better understanding cost considerations associated with changes in local building or floodplain ordinances. Finally, community resilience researchers will find tremendous value in this paper, as it provides a comprehensive methodology to estimate costs for different types of foundations and elevations. This paper provides a missing link by providing researchers a sound methodology to estimate new construction costs, thereby increasing the reliability of cost estimates at individual building and community scales and enabling optimization of flood hazard cost benefit approaches.
Material quantities and costs are modelled for three buildings representative of the existing housing stock in the US, with different areas (139 m2, 186 m2 and 232 m2), footprint aspect ratios (1:1, 1:2.5 and 1:5) and first floor elevations (0 m–1.2 m in 0.3 m increments). The incremental costs are calculated with respect to grade (elevation = 0 m).
Five commonly used foundation types were selected for analysis–slab-on-fill, and four crawl space foundation types. While the slab-on-fill and one of the crawl space foundations with structural fill are considered closed foundation types, the others are considered open foundation types as they allow the passage of flood water. This is vital in flood prone areas as the force of the moving water may cause catastrophic damage to the lower portions of the home. Where structural fill is used, the damage is not caused from the collapse of the foundation, but by scour and altered hydrological flows in the vicinity.
Historical construction records maintained since 1974 by the US Census Bureau (summarized in Table 1) indicate that the total liveable floor area of the median single-family home in the US has ranged from a low of 141 m2 (1,520 sq. ft.) in 1982 to a high of 229 m2 (2,467 sq. ft.) in 2015 (US Census Bureau, 2019) with an overall median of 182 m2 (1,966 sq. ft.). As these are median home sizes, they account for all the homes larger and smaller than the average for each region. This is why the maximum and minimum median home size for the entire United States do not always correspond to the maximum or minimum in any individual region for the same year. Since many of these homes are still in the existing housing stock in the US, this study considers home sizes of 139 m2 (1,500 sq. ft.), 186 m2 (2,000 sq. ft.) and 232 m2 (2,500 sq. ft.).
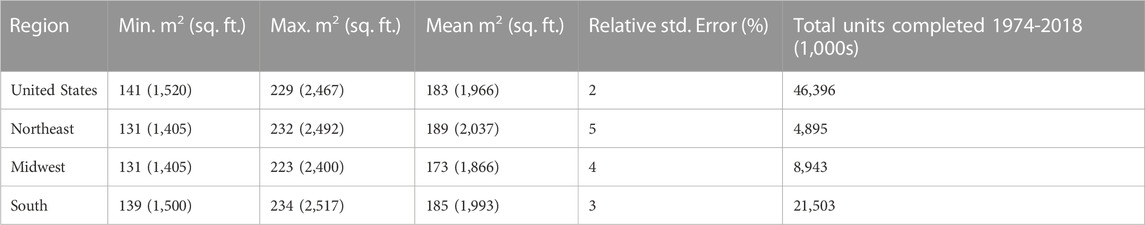
TABLE 1. Summary of the median new single-family home sizes in the US built between 1974 and 2018.
Additionally, the effect of building shape on material quantities is estimated by studying each building at three footprint aspect ratios (Length:Width)—square (1:1), intermediate (1:2.5) and linear (1:5). The aspect ratios selected are meant to represent the widest possible range of rectangular buildings from a square (1:1) to an extremely linear (1:5) configuration seen in standard manufactured homes. (A standard “single-wide” manufactured homes in the US has a width of 5.5 m (18 ft) or less and a length of 27.4 m (90 ft) or less (TenWolde, 1994; Zhou, 2013)). An arbitrary aspect ratio of 1:2.5 is selected as an intermediate size.
The elevation of the first floor (i.e., the lowest habitable floor of the home) is assumed to have an effect on the overall foundation material required and the cost. Therefore, material quantities are calculated in 0.3 m (1 ft) increments from 0 m to 1.2 m (4 ft).
For the purpose of this research, it is assumed that for each foundation type, the difference between a house with first floor at grade (0 m) and the same house at an elevation h above existing grade is only the amount of material used in the foundation. Therefore, the specific details of the building such as wall assemblies, interior finishes, roof and installed equipment are ignored, assuming the structural requirements of the building are unchanged and that the foundation material quantities are determined purely by the desired elevation of first floor above existing grade.
The homes modelled are assumed to be single storied with a rectangular footprint (Figure 1). This study considers slab-on-fill and four types of crawl space foundations. Slab-on-fill foundations are constructed directly on soil with under-floor building systems embedded in the soil. The elevation for this foundation type is modified by the use of additional structural fill. Crawl space foundations result in a raised first floor relative to adjacent grade. Although this can be achieved in several different ways, this study analyses the four common types as described in Table 2.
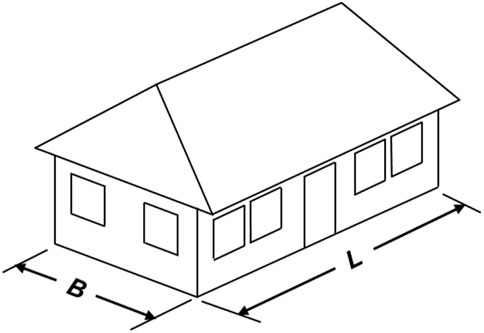
FIGURE 1. Building footprint.
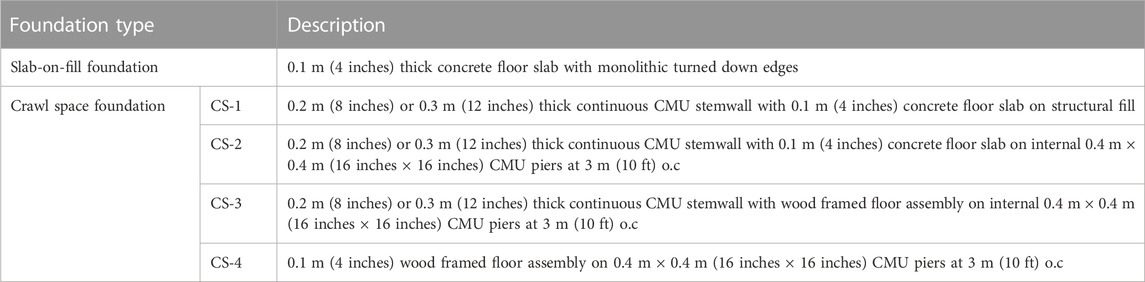
TABLE 2. Foundation types.
The homes are assumed to comply with the IRC, which establishes minimum requirements for single-family and town home residential construction, and is now used directly or as the basis for customized local construction codes in most jurisdictions in the US. Due to the lag in adoption of the latest versions of construction codes by local authorities, the 2015 version of the IRC is used as the basis for this study even though the current version is IRC 2021.
Appropriate equations are developed to calculate material quantities for specific items in the construction process for each foundation type using the assumed geometry of the building and standard foundation construction practices. A breakdown of the construction process for each foundation type from rough grading and excavation, to form-work and fill compaction gives a breakdown of materials and activities to ensure costs for each are included in the analysis. Foundation configurations are based on the IRC requirements where applicable, or on other industry sources. For instance, placement of insulation either in contact with grade or under raised flooring is as laid out in the US Department of Energy’s (DOE) Foundation Design Handbook (Carmody et al., 2013). Although this study only considers rectangular building footprints and a single storey, the methodology developed can be applied to other building shapes and number of stories through the derivation of appropriate material quantity equations. Finally, the effectiveness of each formula was independently verified by performing the calculations independently and comparing the resulting material quantities and costs.
The construction process for a new slab-on-grade foundation can be divided into six broad categories–rough grading of the site, installation and compaction of structural fill, excavation for edge beam, placing of gravel, installation of insulation and vapour barrier, and installation of edge beams and the slab.
Figure 2 shows the typical cross-section and plan configuration of a slab-on-fill foundation. The slab of thickness t with monolithic edge beams of depth D is installed on structural fill of height h. The fill is also assumed to have a level surface on top extending an equal distance a in all directions from the exterior face of the building. The structural fill is embanked for stability at a slope of 1:s. The embanked fill is typically stabilized using landscaping such as sod or other materials, which are not considered here.
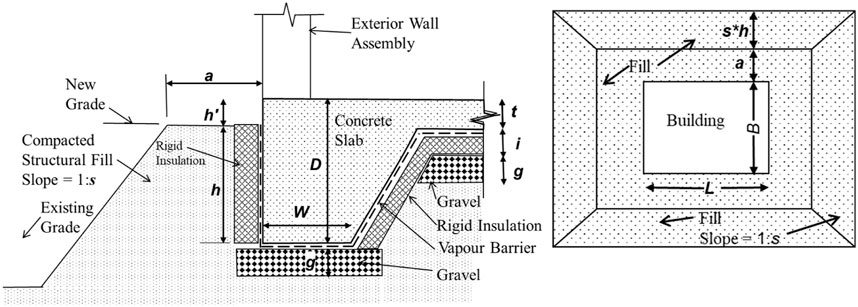
FIGURE 2. Cross-section detail and plan of slab-on-grade foundation.
Rough Grading of the site involves clearing of scrub, trees and other impediments and levelling the site to proceed with construction activities. Depending on the site conditions and the design intent, grading may involve moving excavated earth from higher parts of the site and filling the lower parts with the removed soil. In other cases, extra soil may need to be transported to the site either to achieve the grade required or amend the existing soil to meet the bearing capacity required by design. For this study, it is assumed that the site is already free of obstructions and only requires rough grading to receive the structural fill.
For a conservative estimate of the rough grading quantity for a slab-on-fill foundation, it is assumed that only the area directly under fill will be cleared and levelled. Therefore, given a fill height h, embankment slope 1:s (i.e., 1 vertical to s horizontal units), and fill extension around the building a, the total area of rough grading for a building of length L and width B is calculated using Eq. 1.
Structural fill is the additional fill that must be added to raise the existing grade below the building slab. This soil is typically selected to complement the existing soil in order to achieve the total design bearing capacity for the project and may vary depending on the overall finished slab level to be achieved. IRC 2015 (R401.4) indicates that soil tests to verify existing soil conditions may be required by the local authority having jurisdiction (AHJ) where expansive, compressible or shifting soils are suspected. According to general soil classification, the weakest soils are clay, sandy, silty clay, clayey silt, silt and sandy siltclay (CL, ML, MH and CH) with a bearing capacity of 7,320 kg/m2 (1,500 psf). Soil tests are recommended where soils are likely to have a lower bearing capacity, and the AHJ may require emendation or replacement of existing soils with imported fill (IRC 2015—Table R401.4.1). For this study, the structural fill is assumed to be common earth fill with a standard swell factor of 30%. The fill is assumed to extend to a distance a beyond the building footprint in each direction with an embankment slope of 1:s (i.e., 1 vertical to s horizontal units; see Figure 2).
The structural fill forms a truncated pyramid shape (frustum) and therefore, the volume is a function of the top and bottom areas of the frustum. Given building length L, building width B, top fill extension a, fill height h and embankment slope 1:s, the top and bottom areas, A1 and A2, respectively, are calculated using Eqs 2, 3.
The total height of fill adjacent to the building is different from within the building footprint as the fill below the slab must allow for the thickness of the slab (t), insulation (i) and gravel (g) layer, whereas the top of slab is raised above the finish exterior grade (h’). The volume of fill is given by Eq. 4, where σ is the soil swell factor of the fill. Swell factor is calculated from the bank and loose density of the soil expressed as a percentage (Iowa DOT, 2021).
Excavation of trenches for the slab edges takes place on the compacted structural fill and/or the undisturbed soil depending on the finish soil grade relative to existing grade. Given insulation thickness i, beam width W, beam depth D, gravel depth g, slab thickness t, and distance from finish exterior grade to top of slab h’, the volume of excavation is given by Eq. 5a when finish fill height is less than depth of floor assembly (0 ≤ h ≤ (t + i + g-h’)) and Eq. 5b otherwise (h ≥ (t + i + g-h’)).
Slab-on-grade foundations are susceptible to water intrusion from poorly drained soil. Therefore, a continuous, 10–15 cm (4–6 inches) deep layer of limestone or other suitable gravel is installed to improve drainage. Assuming layer depth g, the volume of gravel needed for a building of dimensions LxB is given by Eq. 6.
But since the unit cost of compacted gravel is given per unit area, the area of gravel required is given by Eq. 7.
Vapour barrier is installed continuous above the gravel as an additional moisture control measure. This is typically a layer of polyethylene or other moisture resistance sheeting and must be run vertically on the outside of the slab edge for proper moisture control (Figure 2). The total area of vapour barrier required is given by Eq. 8.
Insulation is installed under the slab in cold climates to protect the structure from frost damage but is optional in warmer climates. This is typically a continuous layer of rigid insulation installed between the gravel layer and the vapour barrier. The total area of material to be installed is given by Eq. 9.
Concrete slab-on-grade is typically cast-in-place resting on levelled and compacted earth (Figure 2). The volume of a concrete slab of thickness t for a building footprint of LxB is given by Eq. 10.
The thickened slab edge is poured monolithically with the slab to a depth of D from the top of the slab and having a bottom width W. The outer sides of the slab edge beam are formed using vertical forms, but the bottoms of the edge beams and slab are formed using the compacted substrate. The total running length of the concrete edge beam is given by Eq. 11.
Although there is no standard definition in the IRC for a crawl space, it is generally understood to be an under floor space between a raised first floor and the grade below. Crawl spaces are typically unoccupied and only used for access to under floor utilities such as plumbing and HVAC runs. Four types of crawl space foundations were considered for this study—1) CS-1: CMU stemwalls with a concrete slab-on-fill, 2) CS-2: CMU stemwalls with concrete slab on internal CMU piers, 3) CS-3: CMU stemwalls with wood frame floor assembly on internal CMU piers, and 4) CS-4: open foundation on CMU piers (Table 2). A finish material is typically applied to the outside of the stemwall. However, for the purpose of this study, this finish material is ignored.
The construction process for crawl space or raised floor foundations involves grading, excavation, placing gravel, pouring concrete footings, placing structural fill where used, installation of vapour barrier and insulation, construction of CMU stemwalls and/or piers, and installation of floor assembly. Since unvented crawl spaces are not recommended in flood prone areas, all crawl space foundations are assumed to be vented except where structural fill is used (CS-1). The quantities for the different crawl space foundation types are calculated using formulas described in the following sections.
This is a fully enclosed foundation type with no access to the crawl space other than masonry vents and weeps as required for moisture control (Figure 3). Structural fill is installed within the CMU stemwall enclosure and compacted to design specifications. The fill is topped with a layer of gravel with a vapour barrier and continuous rigid insulation board as a moisture and thermal barrier. The concrete floor slab is poured last. The foundation material quantities are calculated as follows.
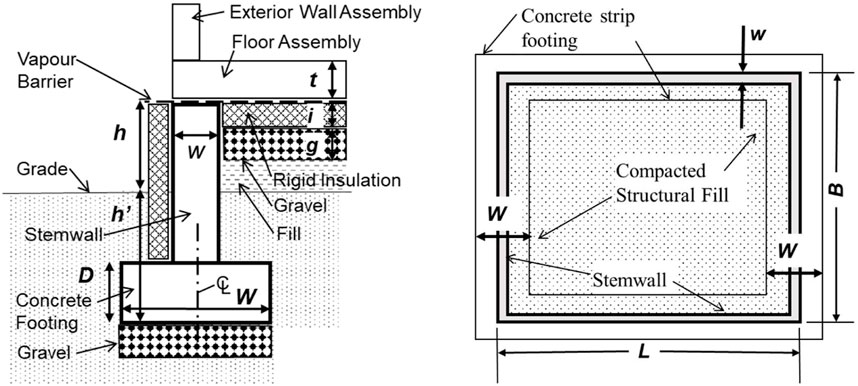
FIGURE 3. Cross section and plan of stemwall foundation with concrete slab-on-fill.
Rough grading is assumed to be required only to the extent of the building footprint and the grading area AR for a building of length L and breadth B is given by Eq. 12.
Excavation volume for the strip foundation of width W and at a depth of h’ and centered on the CMU stemwall of thickness w, for a building of length L and breadth B is given by Eq. 13a when fill height is less than depth of floor assembly (0 ≤ h ≤ (i + g)) and Eq. 13b otherwise (h ≥ (i + g)), where t is the depth of the floor assembly, i is the thickness of insulation, and g is the depth of the gravel layer.
Gravel quantity used is the sum of the layer below the strip footing and on top of the structural fill. The area of gravel layer of depth g for footing width W, stemwall thickness w, given building length L and breadth B is calculated by Eq. 14.
Concrete strip footing quantity is calculated in linear feet given a uniform footing width W and depth D for building of length L and breadth B by Eq. 15.
CMU quantity is calculated as the vertical area of the masonry stemwall for foundation embedment h’ from top of exterior grade to bottom of strip footing, elevation h, and footing depth D using Eq. 16.
Structural Fill volume (swell factor σ) installed between the stemwalls of width w given total embedment h’ from top of existing grade to bottom of strip footing, top of slab elevation h above exterior grade, insulation thickness i, and gravel layer thickness g, is given by Eq. 17.
Vapour Barrier is installed continuous under the slab to the exterior face of stemwall. The area required for building length L and breadth B, and stemwall thickness w is given by Eq. 18.
Rigid Insulation board is installed continuous below slab (between stemwalls) and also vertically at the exterior face of stemwall. The total area required for building footprint LxB, footing depth D, footing embedment h’ and elevation h is given by Eq. 19.
Concrete floor slab volume for slab thickness t for building of length L and breadth B is given by Eq. 10.
This is a fully enclosed foundation type with no access to the crawl space other than vents as required (Figures 4, 5). Internal CMU piers are supported on isolated concrete pads and located at regular intervals to support the structure above. A layer of gravel and a continuous vapour barrier are applied to the soil within the stemwall enclosure to improve drainage. Continuous rigid insulation board is applied to the bottom of the concrete slab.
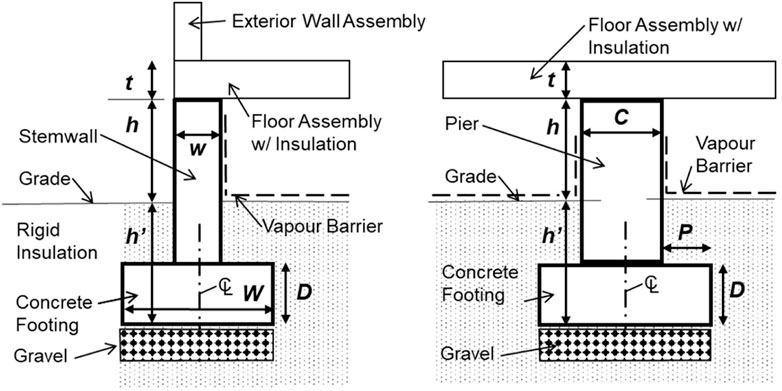
FIGURE 4. Cross section of stemwall foundation with internal piers.
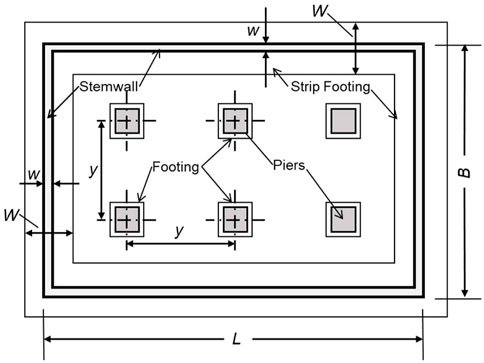
FIGURE 5. Plan of stemwall foundation with internal piers.
Rough grading is assumed to be required only to the extent of the building footprint and the area for a building of length L and breadth B is given by Eq. 12.
The total number of internal piers in each direction, along the building length L and breadth B are given by Eqs 20, 21, with y representing the pier spacing. Each of these numbers must be rounded to the nearest whole integer.
From Eqs 20, 21, total number of piers N is therefore given by Eq. 22.
Excavation volume for the foundation is the volume required for the strip footing as well as for the individual pier footings. Given strip footing of width W and embedment h’ centered on the CMU stemwall of thickness w, and N square internal CMU piers of width C and a footing toe projection P for building length L and breadth B, excavation volume is given by Eq. 23.
Area of gravel layer of depth g used for strip footing and N pier footings is calculated using Eq. 24.
CMU quantity for stemwalls is calculated as a vertical area of the masonry stemwall for foundation embedment h’ from top of exterior grade to bottom of strip footing, and elevation h using Eq. 16.
CMU piers of width C within the stemwall enclosure are measured per vertical height of each pier. Given the total number of internal piers N (Eq. 22), elevation h, foundation embedment h’, footing depth D, and floor assembly depth t, the total vertical height of all piers for a building of length L and breadth B, is given by Eq. 25.
Total footing quantities include concrete for the continuous strip footing at stemwalls as well as the individual pads at each internal CMU pier. Concrete footings pads of fixed size are typically priced by number, which is the same as the total number of piers N given by Eq. 22. The strip footing quantity is calculated as a running length given the footing width W and depth D using Eq. 15 as for crawl space foundation type CS-1.
Vapour Barrier is applied continuously on the soil and tuned up on the inside of the stemwall to create a continuous moisture barrier. Area of Vapour Barrier for building length L and breadth B, elevation h, and floor assembly depth t, is given by Eq. 26.
Rigid insulation is applied at the underside of the flood slab and vertically on the face of the stemwall and calculated by Eq. 27.
Concrete floor slab volume for slab thickness t for building of length L and breadth B is calculated using Eq. 10.
This foundation type is the same as foundation type CS-2, with the exception of the floor assembly. Here a wood floor assembly is considered, consisting of a framing system and sub-flooring material sufficient to provide a continuous weather resistant first floor assembly as part of the foundation system. The framing consists of wood girders or beams placed at regular intervals along the length of the building with joists overlaid perpendicular to the beams. The sub-floor typically consists of an exterior rated sheathing material such as plywood or Oriented Strand Board. Therefore, the materials quantities for all other elements such as stemwall, internal pier, and concrete footing are calculated using formulae developed for foundation type CS-2 (Figures 5, 6).
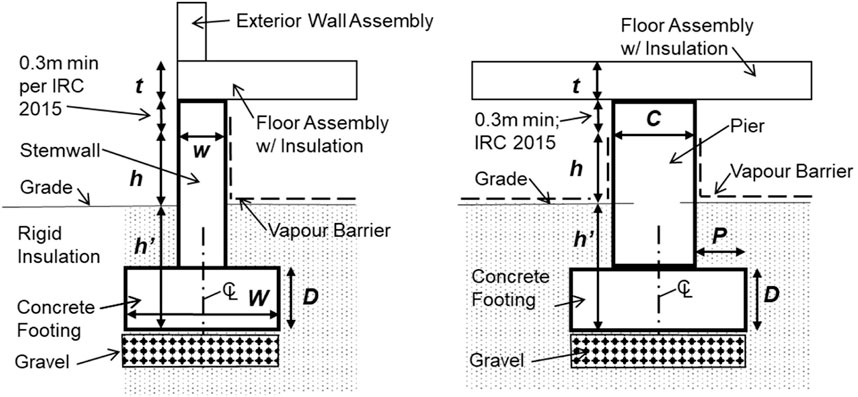
FIGURE 6. Cross section of stemwall foundation with internal piers.
Rough grading is assumed to be required only to the extent of the building footprint and the grading area R for a building of length L and breadth B is given by Eq. 12. Excavation volume E for the strip foundation of width W and depth D centered on the CMU stemwall of thickness w for building of length L and breadth B is given by Eq. 23. Gravel quantity used for strip footing and N pier footings is calculated the same as for foundation type CS-2 using Eq. 24. Concrete strip footing and pad footings at each internal pier are also calculated as for foundation type CS-2 using Eqs 15, 22, respectively. CMU quantity for the stemwall is calculated as a vertical area of the stemwall using Eq. 16. CMU pier quantities are calculated per unit height of given pier size as for foundation type CS-2 using Eq. 25. Vapour Barrier is installed the same as for foundation type CS-2 and the quantities are given by Eq. 26.
Since a raised wood floor requires sound as well as thermal and moisture control, the underfloor insulation consists of a layer of batt insulation installed between the joists enclosed with a continuous foil faced rigid insulation board installed to the underside of the floor framing. The area of underfloor insulation, AI is calculated using Eq. 28.
Wood Framing for the floor members consists of girders and joists. Girders are larger members typically placed spanning the shorter dimension of the building. Therefore, assuming the building length L is longer than its breadth B, the number of girders required is given by Eq. 29, where γ is the on center (o.c.) girder spacing. Eq. 30 gives the number of joists, which are laid on top of and perpendicular to the girders at ρ units o.c. Note that NWg and NWj must be rounded up to the next whole integer.
Using Eqs 29, 30, the total volume of girders and joists is given by Eq. 31, where αg and αj represent the unit volume of selected girders and joists, respectively
Wood sub-floor consisting of sheathing material is the same as the building area by Eq. 32
This is an open foundation type with access to the crawl space (Figure 7). The entire building is supported on regularly spaced CMU piers which are supported on isolated concrete pads. A layer of gravel below footings and a continuous vapour barrier applied to the soil help to improve drainage. Continuous batt insulation and rigid insulation board is applied to the bottom of the wood floor assembly for thermal insulation. The wood floor assembly consists of girders spanning the breadth of the building, with smaller joists installed on top and perpendicular to the girders similar to foundation type CS-3. A continuous exterior rated wood sheathing material such as plywood or Oriented Striated Board is installed over the joists as a sub-floor. Material quantities for this foundation type are calculates as follows.

FIGURE 7. Cross section and plan of pier foundation with wood framed floor.
Rough grading is assumed to be required only to the extent of the building footprint and the grading area AR for a building of length L and breadth B is given by Eq. 12.
The number of piers in each direction, along the building length L and breadth B are given by Eqs 33, 34, with y representing the pier spacing. Each of these numbers must be rounded to the nearest whole integer.
From Eqs 33, 34, total number of piers is given by Eq. 35.
Excavation volume for piers of width C with footing toe projection P with total number of piers, N, from Eq. 35, is given by Eq. 36, where h’ is the depth to the bottom of the footing from grade.
Gravel layer of depth g is installed at each footing pad and the area is calculated using Eq. 37.
CMU pier quantity is calculated as the vertical height of the masonry for piers of a given size. Using the total number of piers N (Eq. 35), CMU quantity is given by Eq. 25. Insulation installed continuous below the floor assembly as a thermal barrier and is given by Eq. 28. The wood floor assembly quantities are calculated as for foundation type CS-3. Wood Volume of wood framing including girders and joists is given by Eq. 31, and wood sub-floor consisting of sheathing material is calculated using Eq. 32.
Construction costs vary widely by location (Gyourko and Saiz, 2006; Estes, 2016). When estimating costs for a project bid package, contractors may use aggregated cost data from publications such as RSMeans or from their own database of previously completed projects. The types of cost information used may be a square foot cost, unit price per assembly or costs for individual materials used in the project. Typically, once the design is at the Construction Documents phase, exact material quantities are easily calculated and therefore, square foot and assembly prices are not used.
In the United States, RSMeans and other published construction cost data are useful for estimating the overall cost of a project. However, these are typically nationally aggregated mean costs and intended to be used with a local multiplier. Prior studies have found that locally adjusted RSMeans costs vary from actual local material prices. For example, Estes (2016) found that for a slab-on-grade foundation assembly with 0.1 m (4 inches) thick slab, vapour barrier and welded wire fabric in Baton Rouge, Louisiana, United States, concrete was found to be underestimated by 18% and vapour barrier by as much as 67%. Additionally, assembly costs for 0.1 m (4 inches) thick concrete slab were found to differ significantly (p = 0.004, α = 0.05) when comparing locally sourced costs and adjusted RSMeans cost data (Estes, 2016). Published cost data also lack accuracy due to the type and manner of data collected and represented. For example, RSMeans data do not account for variations caused by local codes, productivity rates, climate conditions, labour quality and availability, or costs related to land prices and permit fees (Ontario Construction Secretariat, 2001).
In order to eliminate the inconsistencies caused by regional cost variations, this study uses cost information available at RSMeans (2022) from Gordian. Table 3 summarizes the material, equipment and labour costs considered for each foundation element. The costs given represent the national average cost of material, labour and equipment per unit, including a 10% mark-up for installer’s profit and overhead, but excluding the general contractor’s profit and overhead.

TABLE 3. Foundation elements description and per-unit cost from RSMeans construction costs (2022).
The IRC requires crawl space foundations with walls to have either engineered or un-engineered openings to allow for free passage of flood waters. Engineered openings have pre-fabricated fenestrations which open with the force of the flood waters. Given that the engineered openings are optional per code, this study assumes most homeowners will avoid them and considers all such openings in the stemwall foundations as un-engineered.
Two-way ANOVA is used to examine the effects of first floor elevation and footprint aspect ratio on costs to test the following hypotheses:
Hypotheses 1:. Footprint aspect ratio has no effect on foundation costs
Hypotheses 2:. Elevation of first floor above adjacent grade has no effect on foundation costs
Hypotheses 3:. There is no interaction between first floor elevation and footprint aspect ratio
Supplementary Appendix SA1 gives the assumed values for all variables used to calculate the material quantities and costs in this study. These are based on a combination of IRC 2015 minimums and industry standard practice where the IRC does not prescribe a value or the industry standard exceeds the code minimum. For example, the minimum concrete slab thickness per IRC 2015 is 0.089 m (3.5 inches), but the industry standard is 0.1 m (4 inches).
Table 4 shows a comparison of material quantities for total concrete, total CMU and structural fill used for each SFR-Foundation model with the average quantity for each SFR model across all foundation types. For all the foundation types, concrete has the highest per unit cost and since it is used in all five foundation types, it is a critical element in any cost analysis. The volume of concrete required for all foundation types ranges from 0.04 to 0.18 m3 per m2 of building area (Supplementary Appendix SA2). Foundation types CS-4 and CS-3 require the least concrete since they only use concrete for pier footing pads and stemwall strip footing (Supplementary Appendix SA2). The overall volume of concrete is higher and quite similar in CS-1, CS-2, and slab-on-fill. The quantity of concrete required increases slightly with aspect ratio with square aspect ratio (1:1) requiring the least and linear aspect ratio (1:5) requiring the most, for the same building size. The total concrete volume increases but the per unit area quantity of concrete decreases with building size for the same aspect ratio. However, since concrete is used in these foundation types only as flooring and footing, the quantity is unaffected by change in first floor elevation (Supplementary Appendix SA2).

TABLE 4. Material quantities concrete, CMU and structural fill for all single-family residential-foundation models.
CMU foundation walls are typically estimated by square feet of vertical wall surface for a given wall thickness. Here, the overall volume of CMU is considered in order to compare total quantity across all foundation types (Supplementary Appendix SA3). The results indicate that for foundations with CMU stemwalls and/or piers, it requires between 0.01 m3 and 0.22 m3 per m2 building area (Supplementary Appendix SA4). As expected, 0.3 m (12 inches) thick CMU stemwalls require more volume of masonry than 0.2 m (8 inches) thick CMU stemwalls. The volume also increases slightly with aspect ratios for each building with square aspect ratio (1:1) requiring the least and linear aspect ratio (1:5) requiring the most CMU by volume. Additionally, CMU volume increases with change in elevation in crawl space foundations as the stemwall and pier configurations are directly affected by the first floor elevation. For every 0.3 m (1 ft) increase in elevation, there is an increase in CMU volume between 0.01 and 0.04 m3 per m2 floor area of CMU (Supplementary Appendix SA4).
Structural fill is only used in two foundation types–slab-on-fill and CS-1. Of these, the slab-on-fill foundation requires the greatest quantities of structural fill at any elevation due to the configuration of the fill. The rate of increase is especially great with respect to elevation in slab-on-fill foundations since the fill configuration for slab-on-fill requires an embanked slope for stability–about 0.62–0.93 m3 per m2 floor area for 0.3 m (1 ft) elevation. Square aspect ratios require less structural fill, when holding the building size and elevation constant (Supplementary Appendix SA4).
The results show that for smaller building areas, and at lower first floor elevations, slab-on-fill foundations are the least expensive, while CS-4 costs well below average when the material quantities increase, i.e., for larger buildings and at higher first floor elevations (Table 5). Crawl space foundations with CMU stemwalls are the most expensive and within these, 0.3 m (12 inches) thick CMU stemwalls are much more expensive than 0.2 m (8 inches) thick CMU stemwalls. This is apparent due to the higher material volume and the slightly higher unit cost of 0.3 m (12 inch) CMU. Costs also increase with the addition of structural fill whereas floor material does not appear to affect costs (Table 5). The total cost of all foundation types by building area, aspect ratio, and first floor elevation is presented at Supplementary Appendix SB1. The 0.3 m CMU CS-3 foundation is the most expensive one based on cost per unit building area, ranging from $147 per m2 to $280 per m2 (Supplementary Appendix SB2). In all cases, either slab-on-fill or CS-4 foundation is found to be the least expensive one.
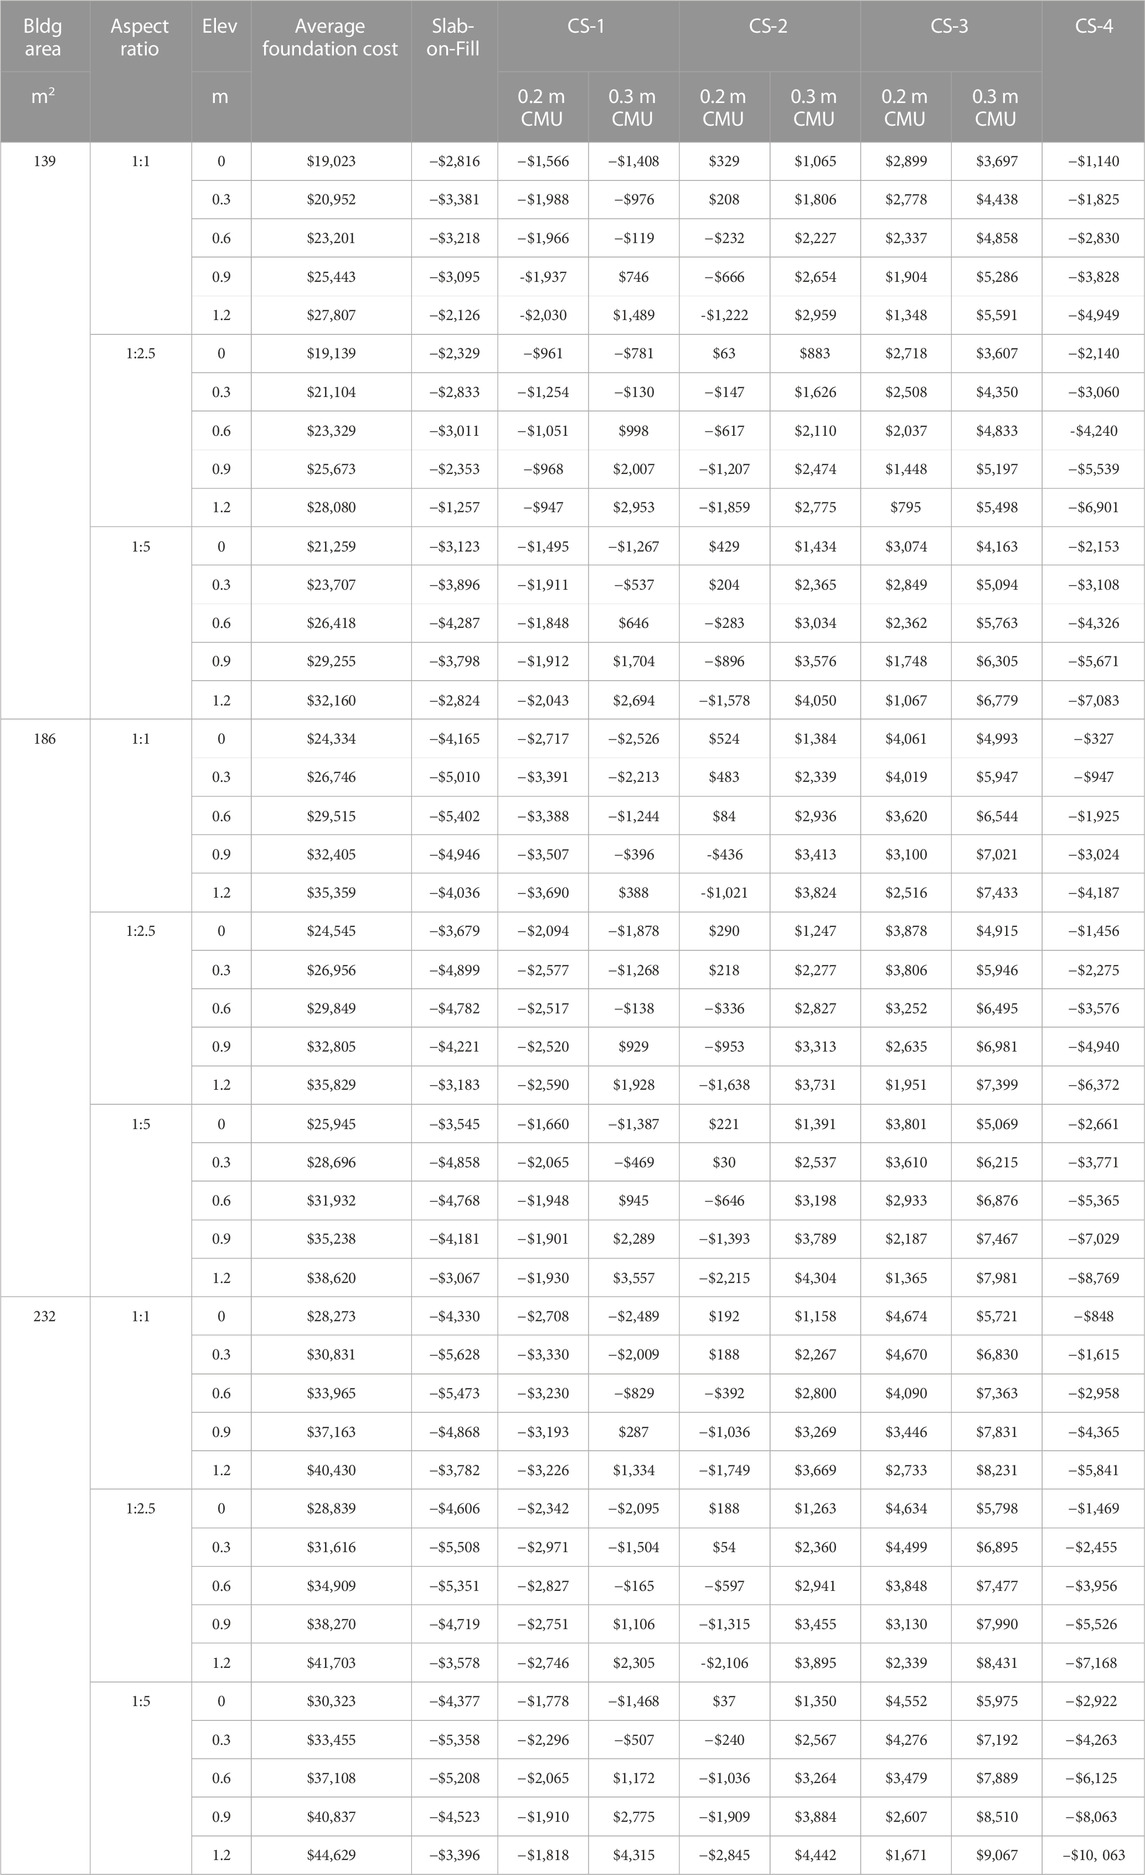
TABLE 5. Comparison of individual foundation costs to the average.
Per unit area costs given in Table 6 show the cost premium for increasing the first floor elevation from 0.3 m (1 ft) to 1.2 m (4 ft) elevations. The results indicate that CS-4 is the least expensive for all building sizes and aspect ratios except 0.3 m elevation for 1:1, 1:2.5, and 1:5 aspect ratio of 186 m2 and 1:1 aspect ratio of 232 m2 building area; where slab on fill was less expensive. In most cases, 0.3 m CMU CS-1 foundation is most expensive.

TABLE 6. Unit foundation cost increase with elevation.
The ANOVA results indicate that although both footprint aspect ratio and first floor elevation have a significant impact on cost (p < 0.0001, α = 0.05), while the interaction is not significant (Table 7). The QQ and residual plots indicate the assumptions for ANOVA are maintained, negating the need for non-parametric tests (Figure 8). The analysis was conducted using cost per unit floor area ($/m2) to standardize the data across all building sizes. The results are similar when the data is analysed by either foundation type or aspect ratio.

TABLE 7. Two-way ANOVA results.
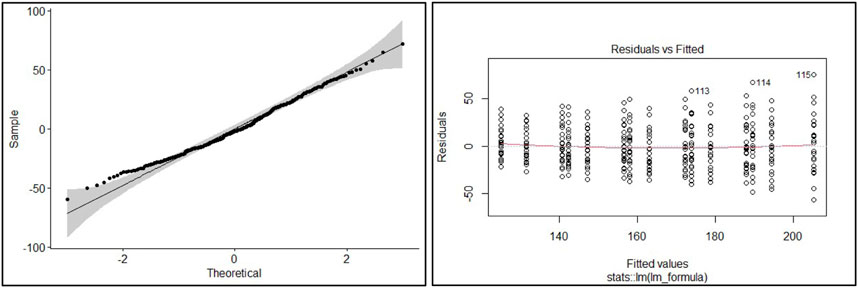
FIGURE 8. QQ and residuals plots.
A post-ANOVA means comparison using a p-adjusted Bonferroni Test indicates that the mean of linear aspect ratio (1:5) is significantly different (α = 0.05) at from both the square (1:1) as well as the intermediate (1:2.5) aspect ratios, whereas the means of the latter two groups are not significantly different (Table 8). On the other hand, all elevation levels have significantly different means.
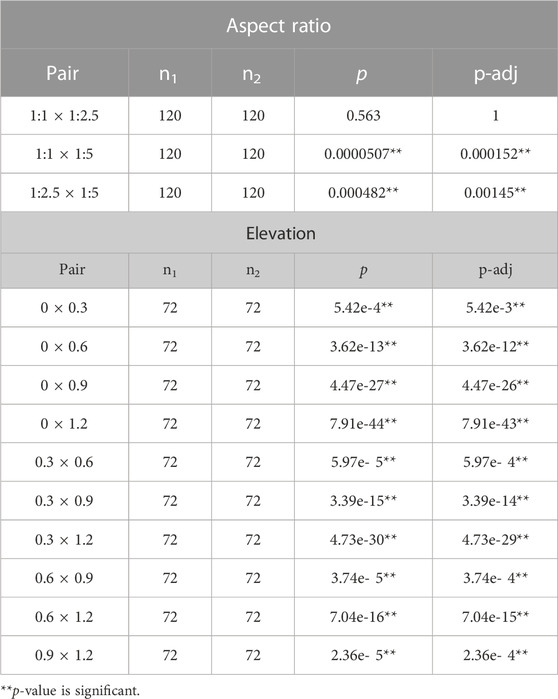
TABLE 8. Pair-wise test results.
The dynamic costs of a foundation are those that change with change in first floor elevation above adjacent grade. Of the foundation materials considered here, structural fill is sensitive to all three building characteristics studied–building area, footprint aspect ratio and first floor elevation. The greatest portion of this cost comes from the cost to haul the fill and therefore, costs are lower for a fill source closer to the site. In the case of the crawl space foundations, masonry has the largest dynamic cost, and this is more sensitive to elevation than building area or aspect ratio.
The static costs, consisting of all the other foundation elements, do not change with elevation. Of these, concrete accounts for the largest portion of total costs. Therefore, at lower elevations, concrete accounts for a greater portion of the total foundation cost but reduces with increase in elevation as the masonry and structural fill costs increases. The results confirm that material quantities increase with building size and first floor elevation. Also, square footprints require the least materials and so cost less than linear footprints for any given foundation type, building size and elevation. The results also confirm that for each foundation type, one or two foundation elements have the greatest cost impact either due to greater material quantity required (e.g., structural fill for slab-on-fill foundation) or due to a higher unit cost (e.g., concrete). However, in some cases, higher unit costs may be balanced by a greater quantity of cheaper material (e.g., structural fill in CS-1 vs. CMU piers in CS-2). Therefore, careful selection of foundation type is as critical as material selection.
Another source of cost variation comes from market fluctuations in material prices. For example, lumber costs in particular have increased dramatically recently from $677.97 per m3 in 2020 to $1,769.07 per m3 in 2022 (RSMeans, 2022). The National Association of Home Builders’ Construction Cost Survey results indicate that the slab-on-grade foundation for an average single-family unit cost $140 per m2 ($13 per sq. ft.) and accounted for 11.8% of total construction costs (NAHB, 2019). In comparison, our results show a lower unit cost at grade $108—$139 per m2 ($10.04–12.92 per sq. ft.), but this can increase for linear aspect ratios and higher elevations. For example, we see a 55%–60% increase in cost for each building size when comparing linear (1:5) aspect ratio at 1.2 m (4 ft) elevation and square (1:1) aspect ratio at grade. This corresponds to a 16%–17% increase in the fill quantity required per m2 of floor area per 0.3 m increase in elevation.
Slab-on-fill foundation is widely used in the US since it is considered easier to install, and though there is no clear evidence to make this assertion, it is the only reported foundation type in the NAHB cost survey. Our results indicate that at the lower elevations and for smaller building sizes, slab-on-fill and CS-4 are the least expensive. However, at higher elevations, CS-1, CS-2 and CS-3 costs are comparable to slab-on-fill foundation. Closed foundation types such as slab-on-fill and CS-1 (stemwall with structural fill) have been shown to change hydrological flows in the surrounding areas and it is prone to scour from severe flood events and storm surges (FEMA, 2001). There is ample evidence of exacerbated flooding caused by hydrological changes in rapid urbanization events (Zope et al., 2017). In addition to the avoided losses to other properties from displaced flood waters, open foundation is also less prone to scour and therefore, will have fewer events causing major damages over the life of the building. Therefore, if CS-4 foundation type is not suitable due to site or design conditions, an open crawl space foundation with stemwalls may be a better choice than slab-on-fill.
Raising the first floor elevation above the base flood elevation, also known as freeboard, is a recommended method of flood mitigation and has been shown to be a net benefit to homeowners (Gnan et al., 2022a; Al Assi et al., 2022; Gnan et al., 2022b; Gnan et al., 2022c; Al Assi et al., 2023a; Al Assi et al., 2023b; Friedland et al., 2023). Table 6 shows comparative cost premiums associated with freeboard for each foundation type, reiterating that raised wood floor on CMU piers (CS-4) is the least expensive while 0.3 m CMU stemwall foundation is the most expensive. These results offer a simple way of evaluating the costs and benefits of including different levels of freeboard during construction compared to raising an existing structure.
The formulae developed in this study focus on the material quantities of the different foundation types and therefore offer a variety of non-cost related analyses. For instance, the residential foundation contributes to a significant portion of the building’s embodied energy (Bansal et al., 2014). Therefore, these formulae can form the basis for evaluating the environmental footprint of residential projects.
This study is limited to IRC 2015 compliant, single-storey, rectangular structures of light weight stick construction. This construction method is typical for the US and therefore the foundation configurations considered here are specific to that country, as is the cost database used. The proposed methodology can be easily modified to compare material quantities for other construction methods, foundation types and building characteristics, as well as the use of any other appropriate cost information.
The building characteristics are not based on actual structural design calculations and foundation elements such as slab thickness and pier sizes and spacing are assumed to match what is used in typical residential projects. Doing so allows the results to be generalized more widely. Where an actual structural design is available, the material quantities can be calculated more precisely per the project specifications.
The cost data used in this study does not include margins for waste or General Contractor’s Overhead and Profit. These are generally assumed to be 10% and 15% in the industry, but these are not fixed and depend greatly on the project parameters and the contractor. Therefore, removing them from the analysis reduces some of the variability. Where such specifics are known (for, e.g., an average across several projects by the same General Contractor, including them in the analysis will increase accuracy. The results also do not consider lifetime performance of materials which would affect lifecycle costs.
There are several possible future directions for the work presented here. For example, the formulae presented can be modified for different building sizes and aspect ratios. These results can be used to develop a lifecycle cost assessment of these foundation types. The methodology may also be useful in the evaluation of alternative flood mitigation projects or in resource allocation decision making by flood plain managers. Another possible application is in the evaluation of energy efficiency measures such as sub-floor insulation materials and installation techniques.
Using basic quantity estimating techniques, this research quantifies the construction material and cost variations for a range of single-family residential foundations. The results show that raised wood floor on CMU piers (CS-4) is the least expensive foundation type, while crawl space foundations with 0.3 m (12 inch) CMU stemwalls are the most expensive. While some materials have a higher unit cost, selecting a foundation type with cheaper material does not necessarily translate to savings, as seen from the comparable overall costs of CMU stemwall crawl space foundations with structural fill (CS-1) and with internal piers (CS-2) for most building areas and footprint aspect ratios.
It is estimated that for 0.3 m (1 ft) increase in elevation, CMU quantity required increases by 0.01–0.04 m3 per m2 of building area for crawl space foundations. The total volume of concrete is not affected by change in elevation for any of the foundation types considered here. Crawlspace foundations require about 0.16 m3 of concrete per m2 of floor area where a concrete floor slab is used and about 0.06 m3 per m2 of building area where concrete is only used in the footings.
The major findings of this study are:
• Slab-on-fills are cost-effective at lower elevations and CMU pier foundations with wood frame floor (CS-4) are cost-effective at higher elevations.
• First floor elevation and footprint aspect ratio have a significant effect on the building material quantities and cost (p= <0.001, α = 0.05).
• The total cost increases but per unit foundation cost decreases with increasing building area.
Foundation costs generally increase with elevation, building size and slightly with footprint aspect ratio. For all foundation types, a square aspect ratio (1:1) requires the least quantity of construction materials, while a linear aspect ratio (1:5) requires the most material, for a given building size and elevation. Although the effect of the aspect ratio is statistically significant, first floor elevation has a greater effect on costs.
The original contributions presented in the study are included in the article/Supplementary Material, further inquiries can be directed to the corresponding author.
YK developed the methodology and the initial text for this paper and conducted the analyses. MR validated the methodology and results, prepared code for the analysis, and edited the text. CF proposed the original study idea and framework and edited the text. RM organized the paper and edited the text. AT provided guidance on analysis and editorial support. SH provided RSMeans (2022) data and edited the text.
This research was funded by the USDA National Institute of Food and Agriculture, Hatch project LAB 94873, accession number 7008346, the Louisiana Sea Grant College Program (Omnibus cycle 2020–2022; Award Number: NA18OAR4170098; Project Number: R/CH-03; Omnibus cycle 2022–2024; Award Number: NA22OAR4710105; Project Number: R/CH-05), the Gulf Research Program of the National Academies of Sciences, Engineering, and Medicine under the Grant Agreement number: 200010880 “The New First Line of Defense: Building Community Resilience through Residential Risk Disclosure,” and the U.S. Department of Housing and Urban Development (HUD; 2019–2022; Award No. H21679CA, Subaward No. S01227-1). Any opinions, findings, conclusions, and recommendations expressed in this manuscript are those of the author and do not necessarily reflect the official policy or position of the funders. The publication of this article is supported by the LSU AgCenter LaHouse Resource Center.
The author SH was employed by Stantec.
The remaining authors declare that the research was conducted in the absence of any commercial or financial relationships that could be construed as a potential conflict of interest.
All claims expressed in this article are solely those of the authors and do not necessarily represent those of their affiliated organizations, or those of the publisher, the editors and the reviewers. Any product that may be evaluated in this article, or claim that may be made by its manufacturer, is not guaranteed or endorsed by the publisher.
The Supplementary Material for this article can be found online at: https://www.frontiersin.org/articles/10.3389/fbuil.2023.1111563/full#supplementary-material
Al Assi, A., Mostafiz, R. B., Friedland, C. J., Rahim, M. A., and Rohli, R. V. (2022). Flood risk assessment for residences at the neighborhood scale by owner/occupant type and first-floor height. Front. Big Data 5, 997447. doi:10.3389/fdata.2022.997447
Al Assi, A., Mostafiz, R. B., Friedland, C. J., Rohli, R. V., and Rahim, M. A. (2023a). Homeowner flood risk and risk reduction from home elevation between the limits of the 100- and 500-year floodplains. Front. Earth Sci. 11, 1051546. doi:10.3389/feart.2023.1051546
Al Assi, A., Mostafiz, R. B., Friedland, C. J., Rohli, R. V., Taghinezhad, A., and Rahim, M. A. (2023b). Cost-effectiveness of federal CDBG-DR road home Program mitigation assistance in jefferson parish, Louisiana. Nat. Hazards. doi:10.1007/s11069-023-05904-3
Bansal, D., Minocha, V. K., and Kaur, A. (2020). Componentwise-embodied energy analysis of affordable houses in India. Asian J. Civ. Eng. 21 (1), 137–145. doi:10.1007/s42107-019-00184-4
Bansal, D., Singh, R., and Sawhney, R. (2014). Effect of construction materials on embodied energy and cost of buildings—A case study of residential houses in India up to 60 M2 of plinth area. Energy Build. 69, 260–266. doi:10.1016/j.enbuild.2013.11.006
Carmody, J., Mosiman, G., Handeen, D., Huelman, P., and Christian, J. (2013). Foundation design Handbook. Available at: https://foundationhandbook.ornl.gov/handbook/.
Del Bianco, M., McKeever, D. B., and Barta, L. (2012). Cost and time study for constructing raised wood floor systems in the Gulf coast region of the United States. Research paper FPL-RP-664. Madison, WI: US Dept. of Agriculture, Forest Service, Forest Products Laboratory. 18.
Elghaish, F., Abrishami, S., Hosseini, M. R., Abu-Samra, S., and Gaterell, M. (2019). Integrated project delivery with bim: An automated evm-based approach. Automation Constr. 106, 102907. doi:10.1016/j.autcon.2019.102907
Estes, J. P. (2016). Single-family housing construction cost in the greater Baton Rouge area. (MS). Baton Rouge, LA: Louisiana State University.
FEMA (2001). Ensuring that structures Built on fill in or near special floodhazard areas are reasonably safe from flooding. Washington D.C. Available at: https://www.fema.gov/media-library-data/20130726-1511-20490-3169/tb1001.pdf.
FEMA (2013). Recommended residential construction for coastal areas. (P550). Available at: https://www.fema.gov/media-library-data/20130726-1517-20490-3700/12_fema_p550_apndxe.pdf.
Friedland, C. J., Lee, Y. C., Mostafiz, R. B., Lee, J., Mithila, S., Rohli, R. V., et al. (2023). FloodSafeHome: Evaluating financial benefits and savings of freeboard for improved decision-making in flood risk mitigation. Front. Commun. 8, 1060901. doi:10.3389/fcomm.2023.1060901
Gallagher, J., and Hartley, D. (2017). Household finance after a natural disaster: The case of hurricane katrina. Am. Econ. J. Econ. Policy 9 (3), 199–228. doi:10.1257/pol.20140273
Ghaffarianhoseini, A., Tookey, J., Ghaffarianhoseini, A., Naismith, N., Azhar, S., Efimova, O., et al. (2017). Building information modelling (bim) uptake: Clear benefits, understanding its implementation, risks and challenges. Renew. Sustain. Energy Rev. 75, 1046–1053. doi:10.1016/j.rser.2016.11.083
Gnan, E., Friedland, C. J., Mostafiz, R. B., Rahim, M. A., Gentimis, T., Taghinezhad, A., et al. (2022a). Economically optimizing elevation of new, single-family residences for flood mitigation via life-cycle benefit-cost analysis. Front. Environ. Sci. 10, 889239. doi:10.3389/fenvs.2022.889239
Gnan, E., Friedland, C. J., Rahim, M. A., Mostafiz, R. B., Rohli, R. V., Orooji, F., et al. (2022b). Improved building-specific flood risk assessment and implications of depth-damage function selection. Front. Water 4, 919726. doi:10.3389/frwa.2022.919726
Gnan, E., Mostafiz, R. B., Rahim, M. A., Friedland, C. J., Rohli, R. V., Taghinezhad, A., et al. (2022c). Freeboard life-cycle benefit-cost analysis of a rental single-family residence for landlord, tenant, and insurer. Nat. Hazards Earth Syst. Sci. Discuss. Prepr. doi:10.5194/nhess-2022-222
Godfrey, A., Ciurean, R., Van Westen, C., Kingma, N., and Glade, T. (2015). Assessing vulnerability of buildings to hydro-meteorological hazards using an expert based approach–an application in nehoiu valley, Romania. Int. J. Disaster Risk Reduct. 13, 229–241. doi:10.1016/j.ijdrr.2015.06.001
Gyourko, J., and Saiz, A. (2006). Construction costs and the supply of housing structure. J. Regional Sci. 46 (4), 661–680. doi:10.1111/j.1467-9787.2006.00472.x
Gyourko, J., and Saiz, A. (2004). Reinvestment in the housing stock: The role of construction costs and the supply side. J. Urban Econ. 55 (2), 238–256. doi:10.1016/j.jue.2003.09.004
Haider, U., Khan, U., Nazir, A., and Humayon, M. (2020). Cost comparison of a building project by manual and bim. Civ. Eng. J. 6 (1), 34–49. doi:10.28991/cej-2020-03091451
IOWA DOT (2021). Earthwork essentials. I. D. o. Transport Design Manual. Iowa. Available at: https://iowadot.gov/design/dmanual/05a-02.pdf.
IRC 2015 (2014). ICC digital codes. Available at: https://codes.iccsafe.org/content/IRC2015.
Joukar, A., and Nahmens, I. (2016). Volatility forecast of construction cost index using general autoregressive conditional heteroskedastic method. J. Constr. Eng. Manag. 142 (1), 04015051. doi:10.1061/(asce)co.1943-7862.0001020
Juszczyk, M. (2017). The challenges of nonparametric cost estimation of construction works with the use of artificial intelligence tools. Procedia Eng. 196, 415–422. doi:10.1016/j.proeng.2017.07.218
Juszczyk, M., Tomana, A., and Bartoszek, M. (2016). Current issues of bim-based design change management, analysis and visualization. Procedia Eng. 164, 518–525. doi:10.1016/j.proeng.2016.11.653
Kim, G.-H., Yoon, J.-E., An, S.-H., Cho, H.-H., and Kang, K.-I. (2004). Neural network model incorporating a genetic algorithm in estimating construction costs. Build. Environ. 39 (11), 1333–1340. doi:10.1016/j.buildenv.2004.03.009
Lee, J., Yang, H., Lim, J., Hong, T., Kim, J., and Jeong, K. (2020). Bim-based preliminary estimation method considering the life cycle cost for decision-making in the early design phase. J. Asian Archit. Build. Eng. 19 (4), 384–399. doi:10.1080/13467581.2020.1748635
Leśniak, A., and Zima, K. (2018). Cost calculation of construction projects including sustainability factors using the case based reasoning (cbr) method. Sustainability 10 (5), 1608. doi:10.3390/su10051608
Mahdavian, A., Shojaei, A., Salem, M., Yuan, J. S., and Oloufa, A. A. (2021). Data-driven predictive modeling of highway construction cost items. J. Constr. Eng. Manag. 147 (3), 04020180. doi:10.1061/(asce)co.1943-7862.0001991
Matthews, E., Friedland, C. J., and Orooji, F. (2016). Optimization of sustainability and flood hazard resilience for home designs. Procedia Eng. 145, 525–531. doi:10.1016/j.proeng.2016.04.040
NAHB (2019). Cost of constructing a home. Available at: https://www.nahbclassic.org/generic.aspx?sectionID=734&genericContentID=271883&channelID=311 (accessed August 01, 2020).
Ontario Construction Secretariat (2001). A guide to construction cost sources. Toronto, Canada: University of Toronto.
Rafiei, M. H., and Adeli, H. (2018). Novel machine-learning model for estimating construction costs considering economic variables and indexes. J. Constr. Eng. Manag. 144 (12), 04018106. doi:10.1061/(asce)co.1943-7862.0001570
RSMeans (2022). RSMeans data from Gordian. Available at: https://www.rsmeansonline.com/.
Taghinezhad, A., Friedland, C. J., Rohli, R. V., Marx, B. D., Giering, J., and Nahmens, I. (2021). Predictive statistical cost estimation model for existing single family home elevation projects. Front. Built Environ. 7, 80. doi:10.3389/fbuil.2021.646668
TenWolde, A. (1994). Ventilation, humidity, and condensation in manufactured houses during winter. ASHRAE Trans. 100 (1), 103–115.
US Census Bureau (2019). Annual characteristics of new housing. Available at: https://www.census.gov/construction/chars/ (accessed October 01, 2020).
Ying, X. U. (2019). Compatibility between bim software and cost estimate tools: A comparison between two directions of solutions. PM World J. 8 (8), 1–17.
Zhang, R., Xing, J., Ye, K., Lu, W., and Shan, Y. (2019). Synchronicity of global construction cost indexes. Eng. Constr. Archit. Manag. 26. doi:10.1108/ECAM-02-2018-0045
Zhao, P. A., and Wang, C. C. (2014). “A comparison of using traditional cost estimating software and bim for construction cost control,” in 2014 International Conference on Construction and Real Estate Management, Kunming, China, 27-28 September 2014, 256–264.
Zhou, Y. (2013). The decision to purchase a manufactured home: A nested logit model of determinants. Int. J. Hous. Policy 13 (3), 268–287. doi:10.1080/14616718.2013.818784
Keywords: foundation costs, elevation cost, residential construction, construction quantities take-off, new construction
Citation: Kodavatiganti Y, Rahim MA, Friedland CJ, Mostafiz RB, Taghinezhad A and Heil S (2023) Material quantities and estimated construction costs for new elevated IRC 2015-compliant single-family home foundations. Front. Built Environ. 9:1111563. doi: 10.3389/fbuil.2023.1111563
Received: 25 December 2022; Accepted: 24 April 2023;
Published: 22 May 2023.
Edited by:
Zhen Chen, University of Strathclyde, United KingdomReviewed by:
John Schaufelberger, University of Washington, United StatesCopyright © 2023 Kodavatiganti, Rahim, Friedland, Mostafiz, Taghinezhad and Heil. This is an open-access article distributed under the terms of the Creative Commons Attribution License (CC BY). The use, distribution or reproduction in other forums is permitted, provided the original author(s) and the copyright owner(s) are credited and that the original publication in this journal is cited, in accordance with accepted academic practice. No use, distribution or reproduction is permitted which does not comply with these terms.
*Correspondence: Md Adilur Rahim, TXJhaGltQGFnY2VudGVyLmxzdS5lZHU=
Disclaimer: All claims expressed in this article are solely those of the authors and do not necessarily represent those of their affiliated organizations, or those of the publisher, the editors and the reviewers. Any product that may be evaluated in this article or claim that may be made by its manufacturer is not guaranteed or endorsed by the publisher.
Research integrity at Frontiers
Learn more about the work of our research integrity team to safeguard the quality of each article we publish.