 Jianxiang Huang
 Phillip Jones
 Xinyu He
95% of researchers rate our articles as excellent or good
Learn more about the work of our research integrity team to safeguard the quality of each article we publish.
Find out more
ORIGINAL RESEARCH article
Front. Built Environ. , 15 November 2022
Sec. Indoor Environment
Volume 8 - 2022 | https://doi.org/10.3389/fbuil.2022.986923
This article is part of the Research Topic Ventilation and Health: How much do we need and how do we achieve this? View all 6 articles
Two and half years into the COVID-19 pandemic, there is quite a lot of confusion over public health guidance necessary in order to reduce disease infection risks, from room air ventilation, the use of air cleaners, and type of mask and whether or not to wear a mask. This paper describes the development of a novel web-based calculator for use by the public to assess COVID-19 infection risks between a source and receiver in a typical room. The aim is to inform the disease infection risk in response to varying exposure times, mask-wearing, and viral variant in circulation. The calculator is based on the state-of-the-art research evidence, i.e., a room air ventilation model, mask infiltration efficiencies, room cleaner efficiencies, the quanta emission rates of various viral variants of COVID-19, and the modified Wells Riley equations. The results show that exposure times are critical in determining transmission risk. Masks are important and can reduce infection risk especially over shorter exposure times and for lower source emission quantum. N95 respirators are by far the most effective, especially for Omicron, and the results indicate that N95 respirators are necessary for the more infectious variants. Increasing fresh air ventilation rates from 2ac/h to 6ac/h can have a considerable impact in reducing transmission risk in a well-mixed space. Going from 6 ac/h to 12ac/h is less effective especially at lower exposure times. Venues can be classified in terms of risk, and appropriate high ventilation rates might be recommended for high-risk, speaking loudly and singing, such as classrooms and theatres. However, for low risk, quiet and speaking softly venues, such as offices and libraries, higher ventilation rates may not be required; instead, mechanical ventilation systems in combination with air cleaners can effectively remove small fraction size aerosol particles. The web-based calculator provides an easy-to-use and valuable tool for use in estimating infection risk.
Since the first reported case at the end of 2019, the SARS-CoV-2 pandemic has inflicted heavy burdens on economic activities globally. The viral particles transmit primarily through the dried residua of respiratory droplets exhaled from infected persons, which can suspend in the air for a prolonged period (CDC, 2020). Successive waves of COVID-19 have periodically disrupted social and economic activities. Indoor venues such as offices, schools, and restaurants are subject to repeated shutdown and reopening, in response to public health measures adopted at the local and state levels.
Public health measures remain largely incoherent, despite, or perhaps because of the rapidly emerging research evidence. There remain confusion over the effectiveness of building operational and personal hygiene practices, such as the rate of fresh air supply, whether or not to wear a mask, or whether to use air cleaners. For instance, there is an absence of agreement upon the rate of fresh air supply needed to mitigate disease transmission in an indoor environment. Six Air Changes per Hour (ACH) in indoor spaces has been recommended by the World Health Organization (WHO, 2020) and subsequently adopted by professional air ventilation guidelines in many countries (Guo et al., 2021). The effectiveness of such practice, however, remains disputed in literature. Recent studies have shown sufficient air ventilation alone may not prevent disease transmission (Huang et al., 2022); other parameters, from the mode of air ventilation to patterns of air movement in relation to particle dispersion and deposition, should also be of concern (Hussein et al., 2021). Further, there are uncertainties over the necessity of mask-wearing or the types of masks to be worn in order to mitigate the transmission of COVID-19. The US Centers for Disease Control and Prevention (CDC), for instance, has initially discouraged the public from wearing masks in early 2020. It has later reconsidered and recommend masks to be worn, including even some home-made cloth masks to address the shortage of mask supply (CDC, 2021). The CDC reversed the rules again in early 2022, with some 70% of Americans no longer required to wear a face mask in indoor environments, except in public transport conveyance such as subways, buses, and airplanes (Tanne, 2022). Similar relaxation in mask-wearing can also be found in the UK and elsewhere (Jackson and O’Connor, 2022). The types of masks recommendable by CDC also vary widely, from home-made cloth mask to N95 respirators (CDC, 2021). The volatile mask guidance appears to have been influenced by practical concerns rather than sound scientific evidence, such as mask supply and the public willingness to comply. Lastly, public health guidance remains equivocal over whether air cleaners, a portable device which removes a fraction of viral aerosol particles, should be adopted to protect citizens in indoor environments, and much less clear on whether they should be used in combination with enhanced mechanical ventilation systems, despite evidence from recent studies supportive of doing so (He et al., 2021; Saw et al., 2022).
This paper describes the results from an analysis of airborne infection risk between a source and receiver for a typical room with varying exposure times. The aim is to inform the public of disease transmission risks and appropriate mitigation measures, such as occupancy schedules, air ventilation rates, and the types of masks needed in order to reduce indoor transmission. Infection risk is estimated for a source and receiver for a range of fresh air ventilation rates and for different mask wearing situations. Three types of mask are considered, an N95 respirator (95% Inward and Outward Efficiency), a surgical mask (45% and 75% Inward and Outward Efficiency) and a less effective cloth mask (40% and 50% Inward and Outward Efficiency). The evaluation uses the Well-Riley equation, assuming the space is a single well-mixed zone. The formulas developed in this study have been developed into an online calculator accessible through the public domain.
The quantity of viral particles emitted by index cases, the concentration of airborne viral particles in an indoor environment, and the inhalation exposure and infection risks in relation to COVID-19, have been well established in the research literature. The quantities of viral aerosols emitted by index patients have been estimated and generally these values vary depending on the viral variant and the types of physical activities that the index cases are engaged in. For patients contracted with the original strain of COVID-19 (B.1.617), the rates of viral “quanta” have been estimated to be in the range of 4.9–31 quanta per hour (q/hr.) for patients engaged in light activities while speaking (Buonanno et al., 2020), 60 q/hr. during domestic activities (Huang et al., 2021), and over 100 q/hr. for speaking and walking (Buonanno et al., 2020). Higher estimates, in the range of 460 and 970 q/hr., although rare, have suggested during super-spreading events of COVID-19 (Miller et al., 2020; Prentiss et al., 2020). The quanta emission rate for Delta cases has been estimated between 4 and 31 q/hr during sedentary and quiet settings (Huang et al., 2022), and at 69.2 q/hr during speaking (Bertone et al., 2022). Details on the quanta emission rates of the Omicron variant are still emerging. Based on epidemiological data from South Africa, Yang and Shaman (2022) estimated that the Omicron variant is estimated to be 36% more transmissible than Delta, and 100% more than the original viral strain.
The concentration of airborne viral particles in an indoor environment have been reported by the engineering and public health literature, using various fluid mechanics models. For instance, Computational Fluid Dynamics (CFD) models have been employed to study airborne disease transmission in enclosed environments, including aircraft cabins (Liu et al., 2021), buses (Ou et al., 2022), a movie theatre (Liang et al., 2021), and multi-family residential buildings (Niu and Tung, 2008). Alternative zonal airflow network models, originally developed to assess heat and moisture content inside buildings (ASHRAE, 2009), have been used to study the concentration of airborne pathogens such as the SARS virus (Li et al., 2006), Influenza (Zhu et al., 2020), and COVID-19 (Huang et al., 2021).
The inhalation exposure of susceptible persons and the subsequent disease infection risks have been estimated in epidemiological studies. The most common approach is the Wells-Riley (WR) equation (Riley et al., 1978), which has been widely used in epidemiological studies of airborne diseases, such as Tuberculosis, influenza, and COVID-19 (NardellSze To and Chao, 2010; Nardell, 2016). Researchers used “quanta” as a hypothetical infectious dose unit, each quantum represents the minimum dose of inhaled airborne viral pathogens necessary to cause an infection (Wells, 1955), regardless of the numbers of infectious viral particles involved. An alternatively approach is to count the viral RNA copies exhaled by patients and those present in air samples (Milton et al., 2013; Yan et al., 2018), although the quantity of viable viral particles capable of inflicting new infections is difficult to measure precisely.
Published studies generally agree that inadequate fresh air ventilation is among the key factors enabling disease transmission in enclosed spaces (Morawska et al., 2020; Lendacki et al., 2021; Li et al., 2021). A WHO working group have suggested that 6 Air Changes per Hour (ACH) needs to be achieved broadly in indoor spaces, from schools to workplaces (WHO, 2020); similar guidelines have been adopted by various levels of governments and professional associations worldwide in order to enhance air ventilation (Guo et al., 2021).
A portable air cleaner is a small device capable of removing fine particles and purify the air. Their effectiveness remains debated, since their performance is considered unstable, depending on their location, operating schedule, the size of the room, and the ambient air ventilation conditions (Novoselac and Siegel, 2009; Shaughnessy and Sextro, 2006). Portable air cleaners have received growing attentions during the COVID-19 pandemic for their use in poorly ventilated spaces. For instance, He et al. (2021) studied the protective effect of air cleaners in a poorly ventilated classroom. They concluded that air cleaners can substantially reduce airborne transmission risk across the entire space, more so than increasing the air ventilation rates alone, although one needs to adjust the locations and number of air cleaners in order to achieve the optimal performance. In another study, Saw at al. (2022) modeled the effectiveness of portable air cleaners in a common hospital ward in Kuala Lumpur, Malaysia using Computational Fluid Dynamics. They concluded that a single device can achieve an aerosol particle removal efficiency under 25%, while multiple devices can achieve somewhat between 36.44% and 59.91%, depending on the location of cleaners and the air ventilation conditions of the room. Public health guidance has been slow in response to latest evidence, and portable air cleaners have been so far mentioned sparsely.
In this study, the estimation of indoor disease infection risks has been determined by the following steps: 1) estimation of viral aerosol generation, 2) calculation of indoor concentration, 3) calculation of inhalation exposure, and 4) computing infection risks (Figure 1).
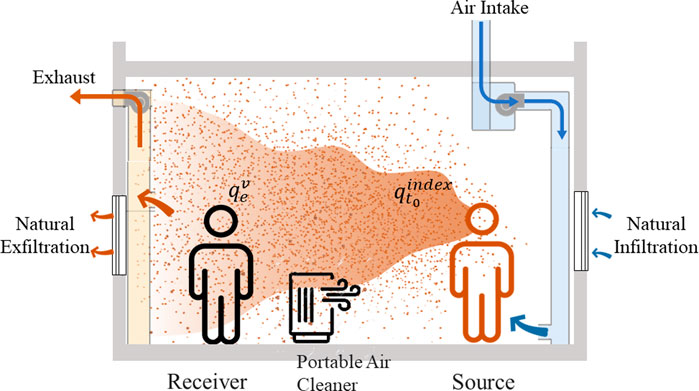
FIGURE 1. A conceptual diagram of airborne disease transmission of COVID-19 in an indoor room.
The rates of exhaled viral emission from an index case
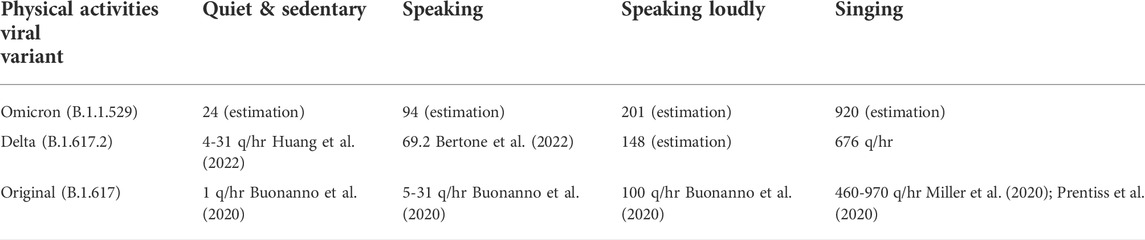
TABLE 1. The quanta emission rates from a primary patient by viral variant and levels of physical activities.
In cases where masks were worn, the viral emission rates become
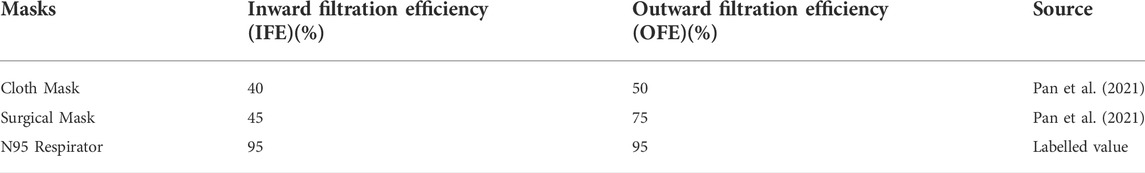
TABLE 2. Mask filtration efficiencies for particles of 2 µm by mask type.
The viral concentration
where
The quantity of viral aerosols inhaled by a susceptible person in the room
where
The disease infection risks
The air and viral particles inside the room are assumed to be well-mixed, following the basic assumption of the WR approach.
The disease infection risk for the original variant of SARS-CoV-2, considering the various levels of physical activities the index patient is engaged in and the various mask-wearing scenarios, are summarized in Figures 2–5 accordingly. Similar analyses are summarized in Figures 6–9 for the Delta variant and 10 to 13 for Omicron. The above results apply to a standardized room assumed to be 4 m × 4 m × 3 m, although the input volume of the room is allowed to vary in the web-based calculator. The four levels of activity may be taken to represent (a) quiet, (b) speaking, (c) speaking loudly and (d) singing.
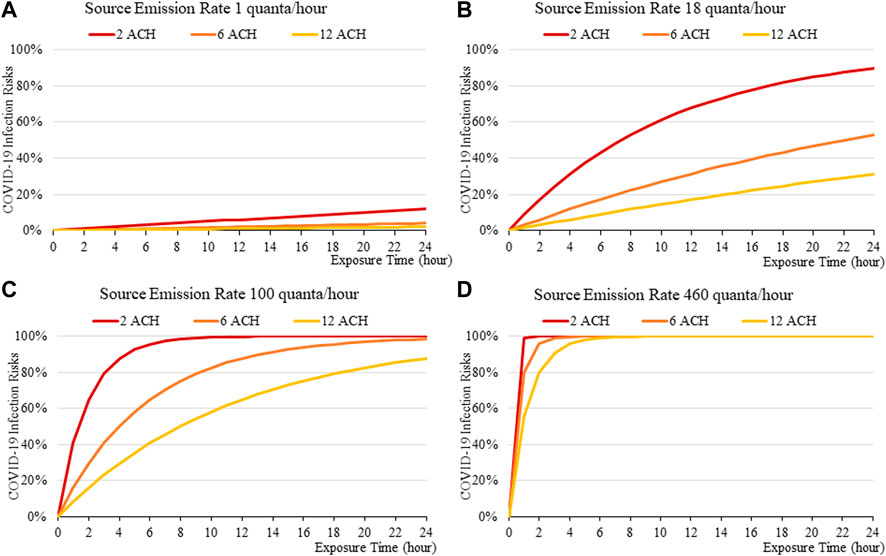
FIGURE 2. Disease infection risks for the original variant without face masks, assuming the exhale quanta emission rate of 1 (A), 18 (B), 100 (C), and 460 (D) quanta/hour for the Source.
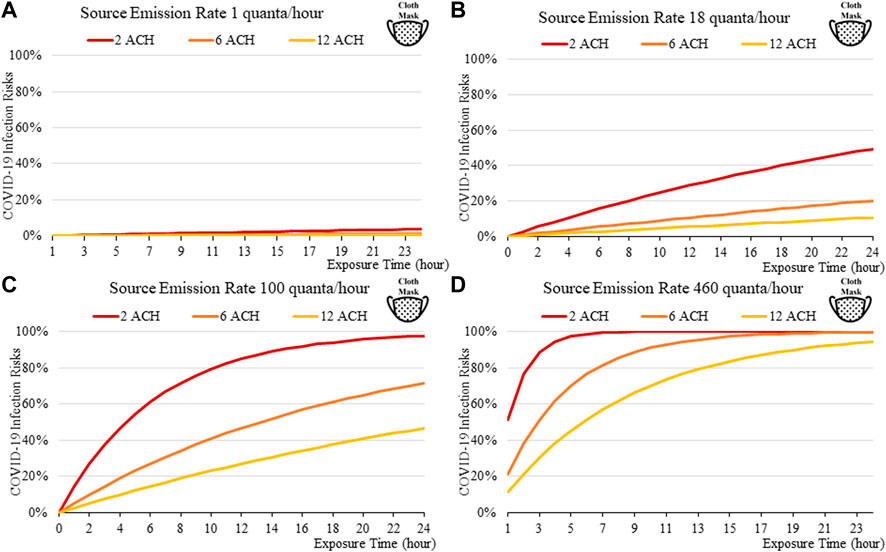
FIGURE 3. Disease infection risks for the original variant, assuming the receiver and the index patient are both wearing cloth masks with the exhale quanta emission rate of 1 (A), 18 (B), 100 (C), and 460 (D) quanta/hour for the Source.
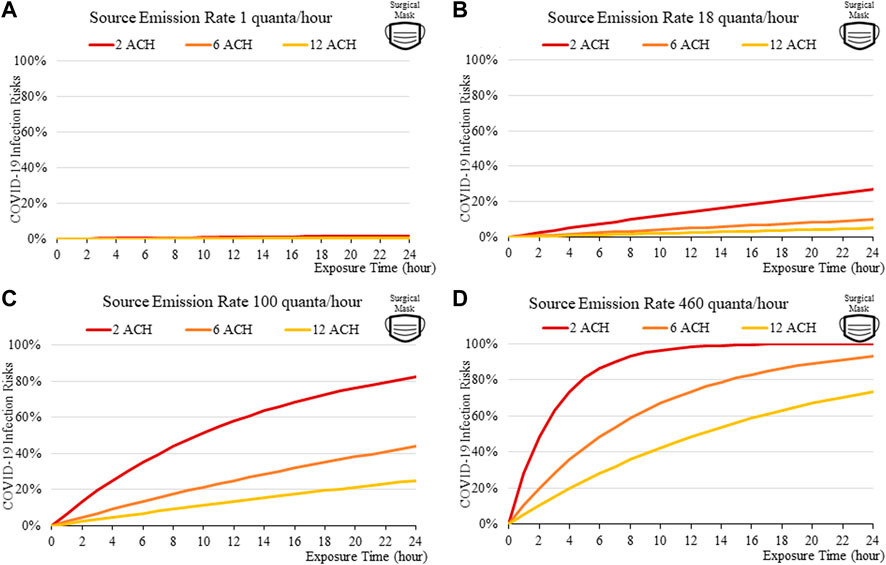
FIGURE 4. Disease infection risks for the original variant, assuming the receiver and the index patient are both wearing surgical masks with the exhale quanta emission rate of 1 (A), 18 (B), 100 (C), and 460 (D) quanta/hour for the Source.
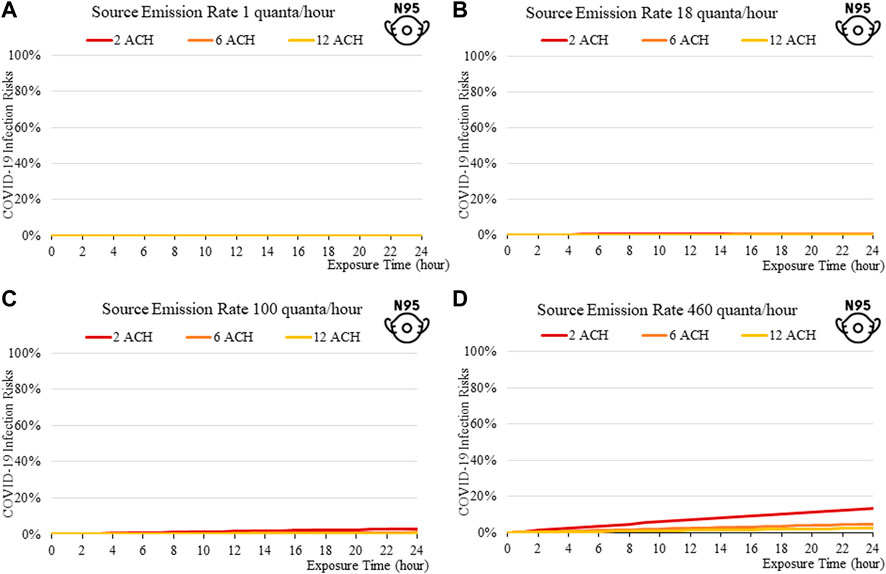
FIGURE 5. Disease infection risks for the original variant, assuming the receiver and the index patient are both wearing N95 respirators with the exhale quanta emission rate of 1 (A), 18 (B), 100 (C), and 460 (D) quanta/hour for the Source.
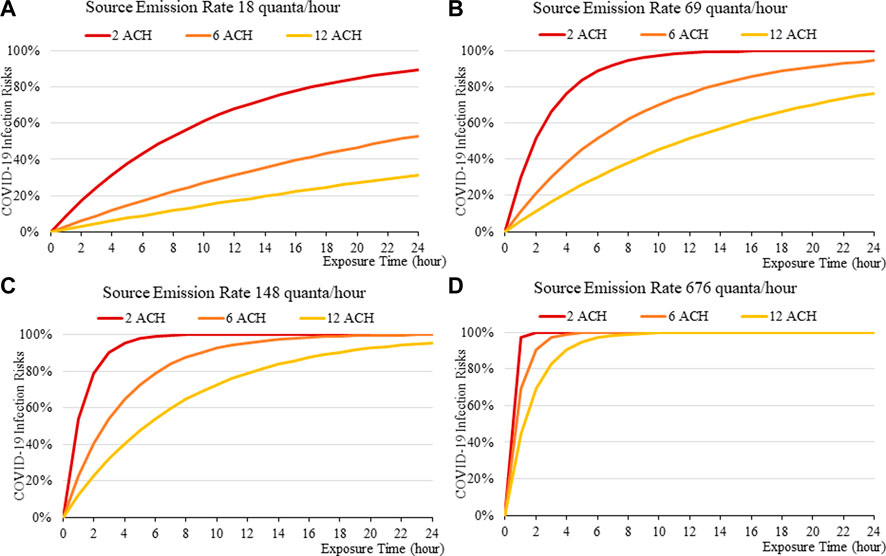
FIGURE 6. Disease infection risks for the Delta variant without face masks, assuming the exhale quanta emission rate of 18 (A), 69 (B), 148 (C), and 676 (D) quanta/hour for the Source.
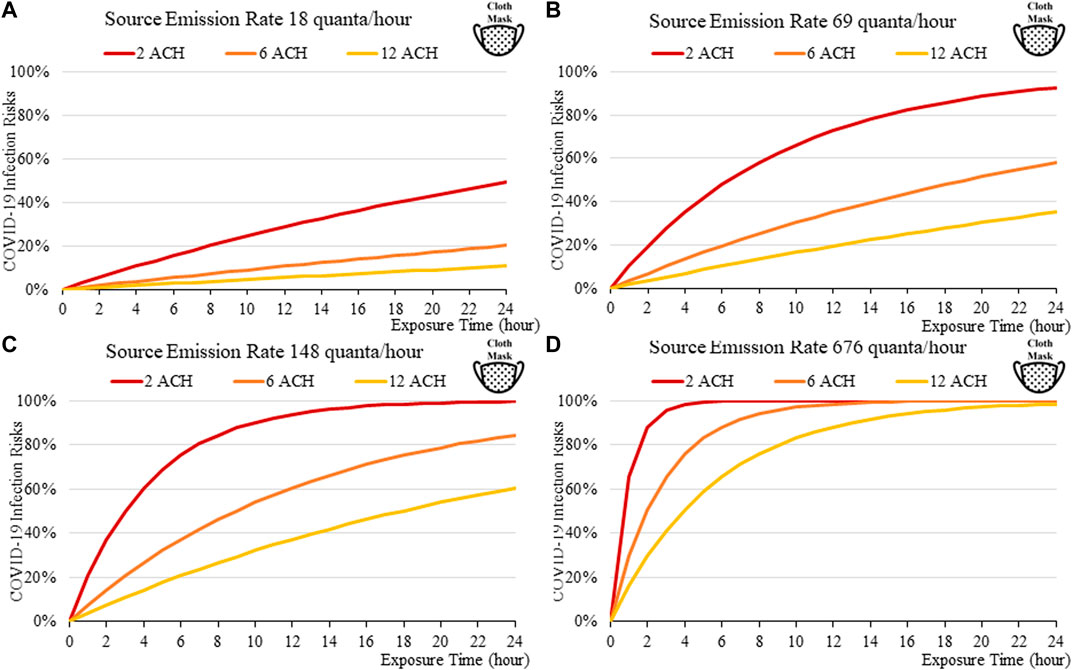
FIGURE 7. Disease infection risks for the Delta variant, assuming the receiver and the index patient are both wearing cloth masks with the exhale quanta emission rate of 18 (A), 69 (B), 148 (C), and 676 (D) quanta/hour for the Source.
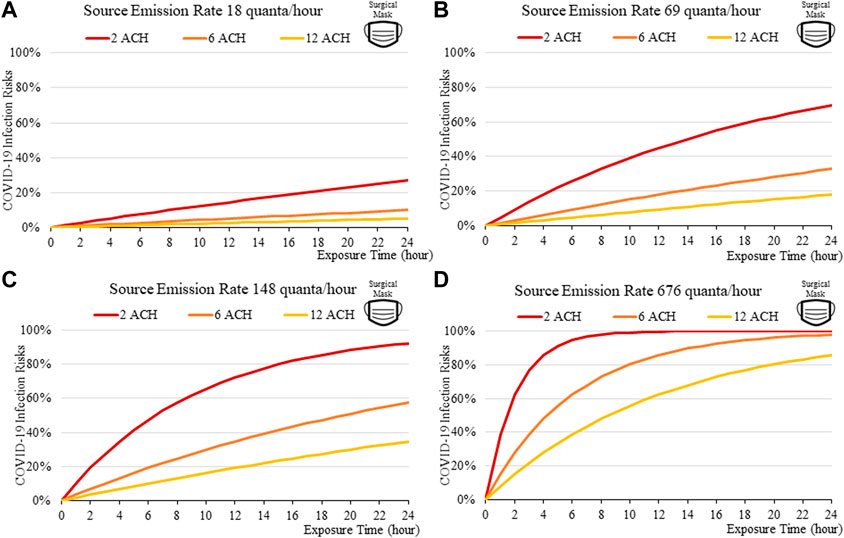
FIGURE 8. Disease infection risks for the Delta variant, assuming the receiver and the index patient are both wearing surgical masks with the exhale quanta emission rate of 18 (A), 69 (B), 148 (C), and 676 (D) quanta/hour for the Source.
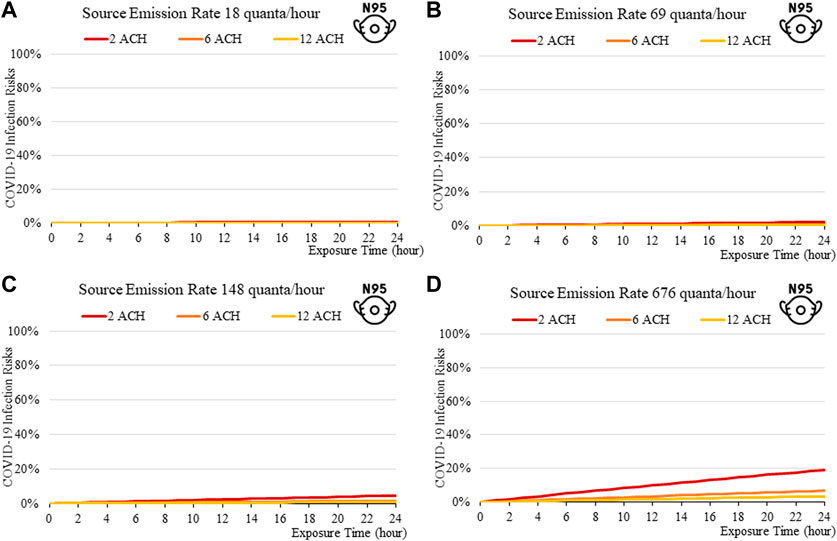
FIGURE 9. Disease infection risks for the Delta variant, assuming the receiver and the index patient are both wearing N95 respirators with the exhale quanta emission rate of 18 (A), 69 (B), 148 (C), and 676 (D) quanta/hour for the Source.
In general, the exposure times are found to be critical in determining transmission risks. An exposure of over 2–3 h results in a rapid increase in risk, which can be observed across all scenarios (Figure 2to13). Increasing fresh air ventilation rates from 2ac/h to 6ac/h can have a considerable impact in reducing transmission risk in a well-mixed space. Ventilation rates from 6 ac/h to 12ac/h are less effective especially at lower exposure times.
Masks are found to be important; the disease transmission risks are significantly higher without masks, even if the room is well ventilated. For a short exposure time (1 h), wearing a cloth or a surgical mask can effectively lower the disease infection risks to about 3% with low quanta emission rates from the source (Figure 3A), compared to some 10% without masks under similar conditions (Figure 4A). This suggests that it might be safer to operate venues such as offices, study rooms, and library, providing that mask-wearing is enforced, and the indoor space is well ventilation. Such protective effects decrease under higher source emission rates (Figures 3B–D), when the index patients are speaking loudly or singing, suggesting that wearing cloth or surgical masks are insufficient in high-risk public venues such as classrooms, lecture halls or theatres.
Venues can be classified in terms of risk, which can be observed by the consistent increase in infection risks from quiet (a) to speaking (b), to speaking loudly (c) and to singing (d) represented in Figures 2–14. This suggest that appropriate high ventilation rates might be recommended for high-risk, speaking loudly and singing, such as classrooms and theatres. However, for low risk, quiet and speaking softly venues, such as offices and libraries, higher ventilation rates may not be required. So, the recent 6ac/h WHO guideline (2020) intended for all types of venues may not be appropriate, as ventilation conditions are likely to depend on the levels of activities associated with each venue.
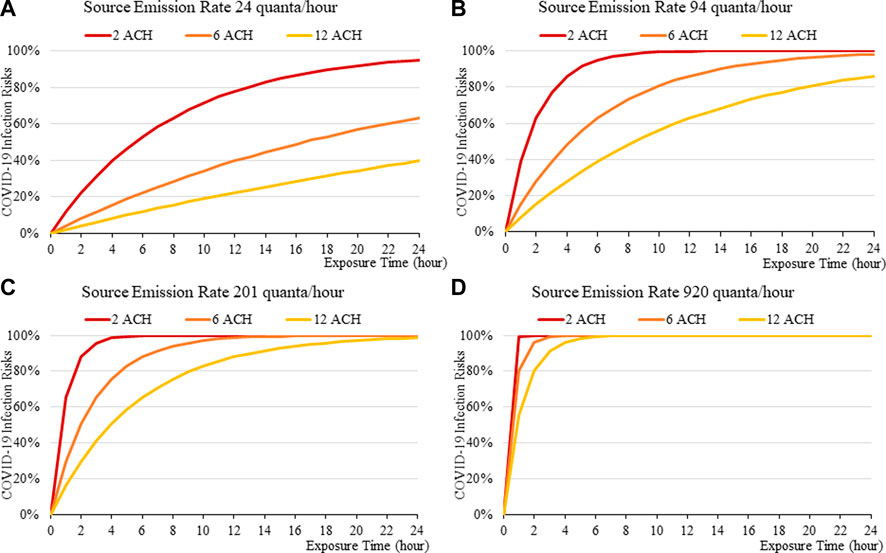
FIGURE 10. Disease infection risks for the Omicron variant without face masks, assuming the exhale quanta emission rate of 24 (A), 94 (B), 201 (C), and 920 (D) quanta/hour for the Source.
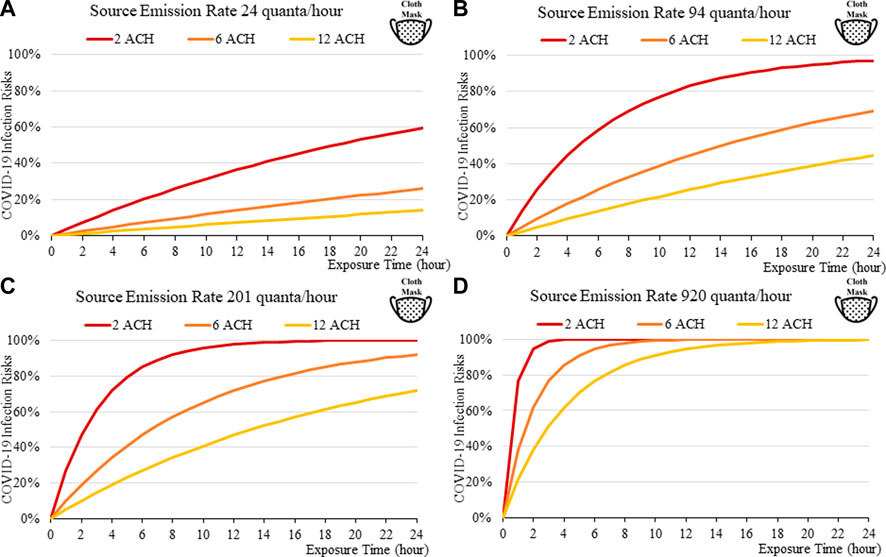
FIGURE 11. Disease infection risks for the Omicron variant, assuming the receiver and index patient are both wearing a cloth face mask (40% and 50% Inward and Outward Filtration Efficiencies): Assuming the exhale quanta emission rate of 24 (A), 94 (B), 201 (C), and 920 (D) quanta/hour for the Source.
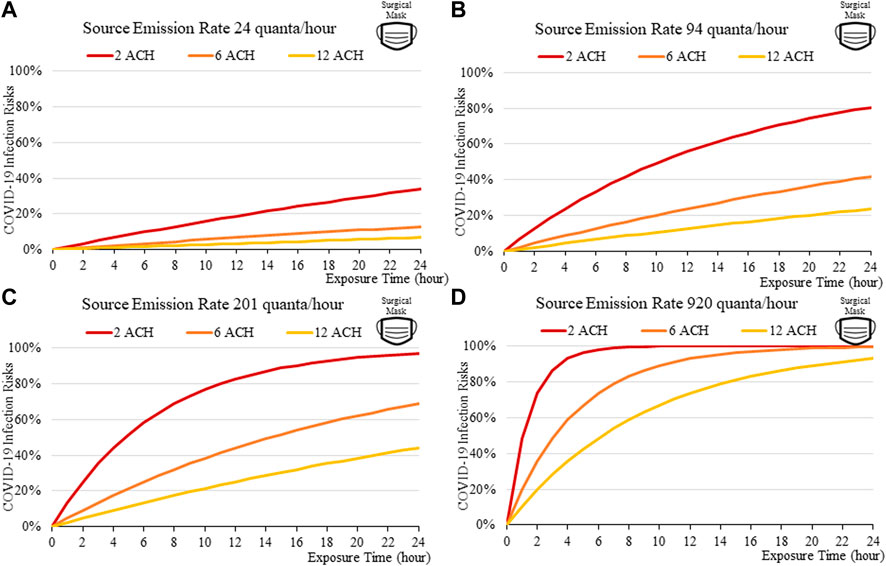
FIGURE 12. Disease infection risks for the Omicron variant, assuming the receiver and index patient are both wearing surgical face mask (55% and 75% Inward and Outward Filtration Efficiencies): Assuming the exhale quanta emission rate of 24 (A), 94 (B), 201 (C), and 920 (D) quanta/hour for the Source.
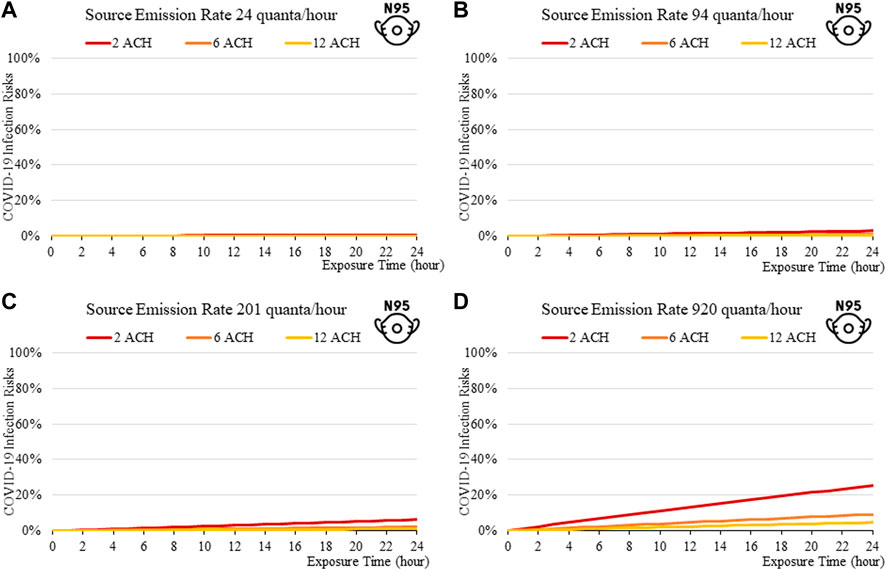
FIGURE 13. Disease infection risks for the Omicron variant, assuming the receiver and index patient are both wearing an N95 respirator face mask (99% Inward and Outward Filtration Efficiencies): Assuming the exhale quanta emission rate of 24 (A), 94 (B), 201 (C), and 920 (D) quanta/hour for the Source.
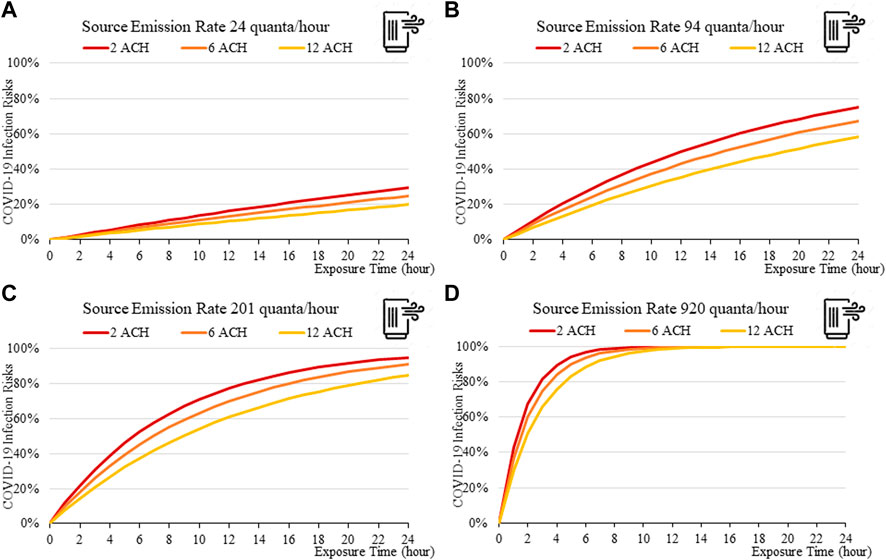
FIGURE 14. Disease infection risks for the Omicron variant with a portable air cleaner (and no mask): Assuming the exhale quanta emission rate of 24 (A), 94 (B), 201 (C), and 920 (D) quanta/hour for the Source.
The findings suggest that home-made cloth masks as previously advocated by the CDC guideline (2021) may not be sufficient in suppressing the more infections viral variants. The cloth masks become relatively less effective in reducing transmission of Delta (Figure 7) and Omicron (Figure 11), whereas disease infectious risk can exceed 10% during short exposure times in a poorly ventilated room (ventilation rate 2 ACH). Better protective effects can be found for surgical and N95 masks, in which disease infectious risks are about 5% and below 1% respectively under the above conditions (Figures 8, 9, 12, 13).
The more infectious variant, such as Omicron (Figure 10to13), constitutes higher transmission risks than the Delta (Figures 5–9), and higher still then the original variant (Figures 2–5). This is induced by the higher quanta emission rate of the index patients infected with the Delta and Omicron variant. An N95 respirator is by far the most effective mask, especially for Omicron, and is able to reduce infection risks to generally below 3% within an 8-hour period, and below 10% under a high source emission rate of 920 q/hr and 2 ACH (Figure 13). This finding would justify the recommendation that wearing an N95 mask is necessary for more infectious variants, provided that compliance is acceptable to the public. Also, the results suggest that venues could be classified in terms of risk and appropriate high ventilation rates recommended for high risk activities.
Increasing fresh air ventilation rates from 2ac/h to 6ac/h can have a considerable impact in reducing transmission risk in a well-mixed space, which can be more effective in reducing risks than going further from 6 ac/h to 12ac/h. This can be observed in Figures 2A–13A, in which the magnitude of risk reduction from the red line (2 ACH) to the orange line (6 ACH) is greater than those from the orange (6 ACH) to yellow (12 ACH). So, the recent 6ac/h guideline from WHO (2020) may not be necessary for all types of venue, especially for those of lower risks and short exposure time.
Portable air cleaners, according to modelled results, offer significant protection against disease infection. Computed disease infection risk for the Omicron variant for a room with a single air cleaner (Figure 14), is significantly lower than for a room without (Figure 10). For the small room used in this example, its protective effect is comparable to those of wearing a surgical mask for both the source and the receiver (Figure 12), although its effectiveness may be reduced when the cleaner is located further away from the source, as has been suggested by existing studies (He et al., 2021).
A web-based calculator has been developed and hosted at the following web address accessible to the public https://www.arch.hku.hk/research_project/covid-19-infection-risk-calculator. The graphical user interface of the calculator is shown in Figure 15 below. It was developed using the HTML programming language. The input parameters include the room volume (m3), the air change rate (ACH), the exposure time (min), the level of physical activity (i.e., quiet, speaking, speaking loudly, and singing), mask-wearing practice (no mask, cloth, surgical, and N95 mask), the use of a portable air cleaner, and the viral variant in circulation, currently including the Omicron (B.1.1.529), the Delta (B.1.617.2), and the original variant (B.1.617). The output is the disease infection risk for a susceptible person (%).
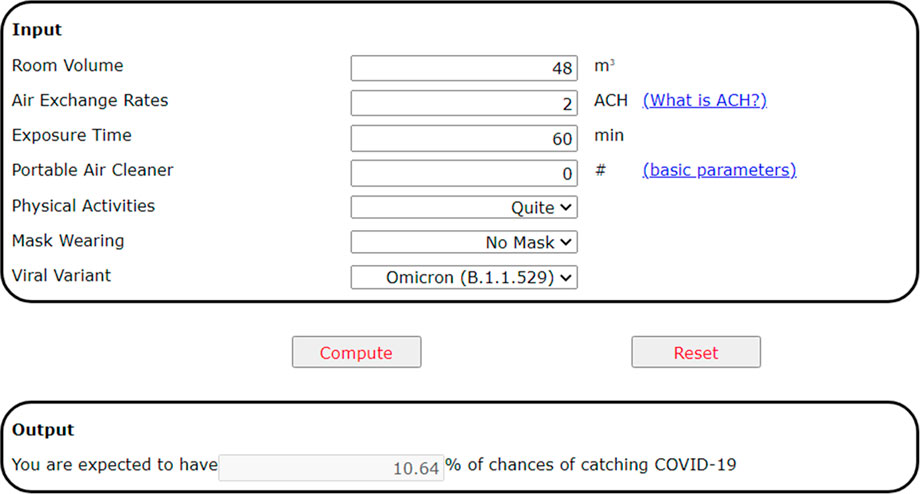
FIGURE 15. The web-based calculator of COVID-19 transmission risks in an indoor space, accessible at https://www.arch.hku.hk/research_project/covid-19-infection-risk-calculator/.
This paper describes the analysis of airborne infection risk between a source and receiver for a typical room with varying exposure times and mask-wearing assumptions. The results show that the Omicron variant has a much higher transmission risk than the Delta variant, which has a higher transmission risk than the original variant. Exposure times are critical in determining transmission risk with an exposure time over 2–3 h resulting in a rapid increase in risk. Masks are found to be important and can reduce infection risk especially over shorter exposure times and for lower source emission quantum. N95 respirators are by far the most effective, especially for Omicron, and the results indicate that N95 respirators are necessary for the more infectious variants. Increasing fresh air ventilation rates from 2ac/h to 6ac/h can have a considerable impact in reducing transmission risk in a well-mixed space. Going from 6 ac/h to 12ac/h is less effective especially at lower exposure times.
Venues may be classified in terms of risk, and appropriate high ventilation rates might be recommended for high-risk, speaking loudly and singing, such as classrooms and theatres. However, for low risk situations, quiet and speaking softly venues, such as offices and libraries, higher ventilation rates may not be required. So, the recent 6ac/h guideline from WHO (2020) may not be appropriate for all types of venue.
The study contributes to research literature in estimating indoor transmission risks of COVID-19. It is the first to include a wide range of indoor and occupant attributes in risk calculation, including various room air ventilation rates, source quanta emission rates, length of exposure, levels of activities, the types of masks worn by the index and susceptible person(s), and the use of portable air cleaners. The development of a novel web-based calculator can serve as a useful tool for use in estimating infection risk for the public.
The study is limited in several aspects. The removal of viral aerosol by deposition has not been accounted for, nor has the degree of mask fitness; the potential drop of infiltration coefficient due to incorrect facial seal is not factored in this study. Ventilation efficiency, a measure of the mixing behavior of air and the distribution of viral aerosols within the room, will have an effect in determining how much fresh air is delivered to the breathing zone, either mechanically or through natural infiltration; this has not been considered at this stage. For the reasons above, the study provides an approximation of risk and should be used with caution. The next step is to continuously update the web-based calculator, to include new research evidence, such as the quanta emission rates of new viral variants.
The original contributions presented in the study are included in the article/supplementary materials, further inquiries can be directed to the corresponding authors.
JH—Analysis, data curation, figures, manuscript writing PJ—Conception, manuscript writing, editing XH—Scripting of online calculator.
The work was supported in part by the National Natural Science Foundation of China (No. 51978594) and by a Theme-Based Research Scheme (TRS) grant from the Hong Kong Research Grants Council (T22-504/21-R).
The authors declare that the research was conducted in the absence of any commercial or financial relationships that could be construed as a potential conflict of interest.
All claims expressed in this article are solely those of the authors and do not necessarily represent those of their affiliated organizations, or those of the publisher, the editors and the reviewers. Any product that may be evaluated in this article, or claim that may be made by its manufacturer, is not guaranteed or endorsed by the publisher.
ASHRAE (2009). The 2009 ASHRAE handbook: Fundamentals. Atlanta, GA: American Society of Heating, Refrigeration and Air-Conditioning Engineers.
Bertone, M., Mikszewski, A., Stabil, L., Riccio, G., Cortellessa, G., D’Ambrosio, F. R., et al. (2022). Assessment of SARS-CoV-2 airborne infection transmission risk in public buses. Geosci. Front. 13, 101398. doi:10.1016/j.gsf.2022.101398
Buonanno, G., Morawska, L., and Stabile, L. (2020a). Quantitative assessment of the risk of airborne transmission of SARS-CoV-2 infection: Prospective and retrospective applications. Environ. Int. 145, 106112. doi:10.1016/j.envint.2020.106112
Buonanno, G., Stabile, L., and Morawska, L. (2020b). Estimation of airborne viral emission: Quanta emission rate of SARS-CoV-2 for infection risk assessment. Environ. Int. 141, 105794. doi:10.1016/j.envint.2020.105794
CDC. (2020). Scientific brief: SARS-CoV-2 and potential airborne transmission. Available at: https://www.cdc.gov/coronavirus/2019-ncov/more/scientific-brief-sars-cov-2.html#:∼:text=Airborne transmission is infection spread,and time (typically hours) (Accessed: November 1, 2020).
CDC. (2021). Wear a mask to protect yourself and others. Available at: https://www.cdc.gov/coronavirus/2019-ncov/prevent-getting-sick/masks.html (Accessed: February 2, 2022).
EPA, (2011). Exposure factors handbook: 2011 edition. Washington, DC: U.S. Environmental Protection Agency. EPA/600/R-090/052F.
Gammaitoni, L., and Nucci, M. C. (1997). Using a mathematical model to evaluate the efficacy of TB control measures. Emerg. Infect. Dis., 3 (3), 335–342. doi:10.3201/eid0303.970310
Guo, M., Xu, P., Xiao, T., He, R., Dai, M., and Miller, S. L. (2021). Review and comparison of HVAC operation guidelines in different countries during the COVID-19 pandemic. Build. Environ., 187, 107368. doi:10.1016/j.buildenv.2020.107368
He, R., Liu, W., Elson, J., Vogt, R., Maranville, C., and Hong, J. (2021). Airborne transmission of COVID-19 and mitigation using box fan air cleaners in a poorly ventilated classroom. Phys. Fluids 33 (5), 057107. doi:10.1063/5.0050058
Huang, J., Hao, T., Liu, X., Jones, P., Ou, C., Liang, W., et al. (2022). Airborne transmission of the Delta variant of SARS-CoV-2 in an auditorium. Build. Environ. 219, 109212. doi:10.1016/j.buildenv.2022.109212
Huang, J., Jones, P., Zhang, A., Hou, S. S., Hang, J., Spengler, J. D., et al. (2021). Outdoor airborne transmission of coronavirus among apartments in high-density cities. Front. Built Environ. 7, 48. doi:10.3389/fbuil.2021.666923
Hussein, T., Löndahl, J., Thuresson, S., Alsved, M., Al-Hunaiti, A., Saksela, K., et al. (2021). Indoor model simulation for Covid-19 transport and exposure. Int. J. Environ. Res. Public Health 18 (6), 2927. doi:10.3390/ijerph18062927
Jackson, M., and O’Connor, M. (2022). Covid: Face mask rules and Covid passes to end in england. BBBC. Available at: https://www.bbc.com/news/uk-60047438 (Accessed: March 31, 2022).
Lendacki, F. R., Teran, R. A., Gretsch, S., Fricchione, M. J., and Kerins, J. L. (2021). COVID-19 outbreak among attendees of an exercise facility — chicago, Illinois, august–september 2020. MMWR. Morb. Mortal. Wkly. Rep. 70 (9), 321–325. doi:10.15585/mmwr.mm7009e2
Li, Y., Qian, H., Hang, J., Chen, X., Cheng, P., Ling, H., et al. (2021). Probable airborne transmission of SARS-CoV-2 in a poorly ventilated restaurant. Build. Environ. 196, 107788. doi:10.1016/j.buildenv.2021.107788
Li, Y., Qian, H., Yu, I. T. S., and Wong, T. W. (2006). “Probable roles of bio-aerosol dispersion in the SARS outbreak in amoy gardens, Hong Kong,” in Population Dynamics and infectious diseases in asia. Editors A. Sleigh, C. H. Leng, B. S. Yeoh, P. K. Hong, and R. Safman (Singapore: World Scientific), 305–327. doi:10.1142/9789812773395_0016
Liang, C., Jiang, S., Shao, X., Wang, H., Yan, S., Yang, Z., et al. (2021). Is it safe to reopen theaters during the COVID-19 pandemic? Front. Built Environ. 7. doi:10.3389/fbuil.2021.637277
Liu, M., Liu, J., Cao, Q., Li, X., Liu, S., Ji, S., et al. (2021). Evaluation of different air distribution systems in a commercial airliner cabin in terms of comfort and COVID-19 infection risk. Build. Environ. 2021, 108590. doi:10.1016/j.buildenv.2021.108590
Miller, S. L., Nazaroff, W. W., Jimenez, J. L., Boerstra, A., Buonanno, G., Dancer, S. J., et al. (2020). Transmission of SARS-CoV-2 by inhalation of respiratory aerosol in the Skagit Valley Chorale superspreading event. Indoor Air 31, 314–323. doi:10.1111/ina.12751
Milton, D. K., Fabian, M. P., Cowling, B. J., Grantham, M. L., and McDevitt, J. J. (2013). Influenza virus aerosols in human exhaled breath: Particle size, culturability, and effect of surgical masks. PLoS Pathog. 9 (3), e1003205. doi:10.1371/journal.ppat.1003205
Morawska, L., Tang, J. W., Bahnfleth, W., Bluyssen, P. M., Boerstra, A., Buonanno, G., et al. (2020). How can airborne transmission of COVID-19 indoors be minimised? Environ. Int. 142, 105832. doi:10.1016/j.envint.2020.105832
Nardell, E. A. (2016). Wells revisited: Infectious particles vs. Quanta of Mycobacterium tuberculosis infection–don’t get them confused. Mycobact. Dis. 6 (5), 1000231. doi:10.4172/2161-1068.1000231
Niu, J., and Tung, T. C. W. (2008). On-site quantification of re-entry ratio of ventilation exhausts in multi-family residential buildings and implications. Indoor Air 18, 12–26. doi:10.1111/j.1600-0668.2007.00500.x
Novoselac, A., and Siegel, J. (2009). Impact of placement of portable air cleaning devices in multizone residential environments. Build. Environ. 44 (12), 2348–2356. doi:10.1016/j.buildenv.2009.03.023
Ou, C., Hu, S., Luo, K., Yang, H., Hang, J., Cheng, P., et al. (2022). Insufficient ventilation led to a probable long-range airborne transmission of SARS-CoV-2 on two buses. Build. Environ. 207, 108414. doi:10.1016/j.buildenv.2021.108414
Pan, J., Harb, C., Leng, W., and Marr, L. C. (2021). Inward and outward effectiveness of cloth masks, a surgical mask, and a face shield. Aerosol Sci. Technol. 55 (6), 718–733. doi:10.1080/02786826.2021.1890687
Prentiss, M., Chu, A., and Berggren, K. K. (2020). Superspreading events without superspreaders: Using high attack rate events to estimate No for airborne transmission of COVID-19. MedRxiv.
Riley, E. C., Murphy, G., and Riley, R. L. (1978). Airborne spread of measles in a suburban elementary school. Am. J. Epidemiol. 107, 421–432. doi:10.1093/oxfordjournals.aje.a112560
Saw, L. H., Leo, B. F., Lin, C. Y., Mokhtar, N. M., Ali, S. H. M., and Nadzir, M. S. M. (2022). The myth of air purifier in mitigating the transmission risk of SARS-CoV-2 virus. Aerosol Air Qual. Res. 22 (3), 210213. doi:10.4209/aaqr.210213
Shaughnessy, R. J., and Sextro, R. G. (2006). What is an effective portable Air cleaning device? A review. J. Occup. Environ. Hyg. 3 (4), 169–181. doi:10.1080/15459620600580129
Sze To, G. N., and Chao, C. Y. H. (2010). Review and comparison between the Wells–Riley and dose-response approaches to risk assessment of infectious respiratory diseases. Indoor Air 20 (1), 2–16. doi:10.1111/j.1600-0668.2009.00621.x
Tanne, J. H. (2022). Covid-19: CDC relaxes rules on mask wearing. BMJ Clin. Res. Ed.) 376, o524. doi:10.1136/bmj.o524
van Doremalen, N., Bushmaker, T., Morris, D. H., Holbrook, M. G., Gamble, A., Williamson, B. N., et al. (2020). Aerosol and surface stability of SARS-CoV-2 as compared with SARS-CoV-1. N. Engl. J. Med. Overseas. Ed. 0 (0), 1564–1567. doi:10.1056/NEJMc2004973
Wells, W. F. (1955). Airborne contagion and air hygiene. An ecological study of droplet infections. Cambridge, CA, USA: Harvard University Press.
Who, . (2020). Roadmap to improve and ensure good indoor ventilation in the context of COVID-19. Available at: https://www.who.int/publications/i/item/9789240021280.
Yan, J., Grantham, M., Pantelic, J., De Mesquita, P. J. B., Albert, B., Liu, F., et al. (2018). Infectious virus in exhaled breath of symptomatic seasonal influenza cases from a college community. Biol. Sci. 115, 1081–1086. doi:10.1073/pnas.1716561115
Yang, W., and Shaman, J. (2022). COVID-19 pandemic dynamics in South Africa and epidemiological characteristics of three variants of concern (Beta, Delta, and Omicron). medRxiv. doi:10.1101/2021.12.19.21268073
Keywords: air ventilation, indoor environment, COVID-19, viral variant, mask, web-based calculator
Citation: Huang J, Jones P and He X (2022) Masks, ventilation and exposure time: A web-based calculator of indoor COVID-19 infection risk. Front. Built Environ. 8:986923. doi: 10.3389/fbuil.2022.986923
Received: 05 July 2022; Accepted: 03 October 2022;
Published: 15 November 2022.
Edited by:
Yuexia Sun, Tianjin University, ChinaReviewed by:
Alessio Ricci, Eindhoven University of Technology, NetherlandsCopyright © 2022 Huang, Jones and He. This is an open-access article distributed under the terms of the Creative Commons Attribution License (CC BY). The use, distribution or reproduction in other forums is permitted, provided the original author(s) and the copyright owner(s) are credited and that the original publication in this journal is cited, in accordance with accepted academic practice. No use, distribution or reproduction is permitted which does not comply with these terms.
*Correspondence: Phillip Jones, Sm9uZXNQQGNhcmRpZmYuYWMudWs=
Disclaimer: All claims expressed in this article are solely those of the authors and do not necessarily represent those of their affiliated organizations, or those of the publisher, the editors and the reviewers. Any product that may be evaluated in this article or claim that may be made by its manufacturer is not guaranteed or endorsed by the publisher.
Research integrity at Frontiers
Learn more about the work of our research integrity team to safeguard the quality of each article we publish.