 Vladimir Shepelev
 Alexandr Glushkov
 Alexandr Gritsenko
 Dmitry Nevolin
 Andrey Vorobyev
- 1Department of Road Transport, South Ural State University, Chelyabinsk, Russia
- 2Department of Mathematical and Computer Modeling, South Ural State University, Chelyabinsk, Russia
- 3Department of Machine-Tractor Fleet Operation, South Ural State Agrarian University, Troitsk, Russia
- 4Department of Design and Operation of Vehicles, Ural State University of Railway Transport, Yekaterinburg, Russia
- 5Department of Organization and Traffic Safety, Moscow Automobile and Road Construction State Technical University (MADI), Moscow, Russia
Introduction
The rapid global development of urbanization has significantly complicated traffic flow management, which serves to reduce congestion, traffic accidents, and the health effects of traffic-related pollution. Increasing the traffic capacity of the road network (RN) with high-density traffic flows (TF) is one of the main priorities for road traffic organization in large cities. The most effective solution to this problem is to introduce traffic signal synchronization at intersections (Saha et al., 2019; Glushkov and Shepelev, 2021; Gorodokin et al., 2020; Patel et al., 2015). The development and widespread use of artificial intelligence methods, fuzzy logic, and computer vision has made it possible to obtain real-time data on the parameters of the TF (speed, types of vehicles, and their number) (Dai et al., 2020; Gu et al., 2020; Shen et al., 2020; Shepelev et al., 2020; Glushkov et al., 2021; Shepelev et al., 2021; Wang et al., 2022; Zhou et al., 2021). Models to control traffic at intersections are being developed based on empirical data to minimize delays and, as a result, to reduce harmful traffic-related emissions and save fuel consumption (Araghi et al., 2015; Biswas et al., 2018; Jeon et al., 2018; Ren et al., 2021). The development of such models is complicated because each intersection is geometrically unique (Karnati et al., 2022), and the traffic capacity also depends on weather conditions, which can change rapidly and randomly (Agbolosu-Amison et al., 2004; Zhao et al., 2015). We should take into account the presence or absence of a vehicle queue and its structure at regulated intersections (Chen et al., 2014), since traffic capacity differs significantly based on whether vehicles are passing through an intersection freely or in a uniformly-accelerated manner.
The purpose of our research is to develop the foundations for constructing a system for the dynamic monitoring of the traffic capacity of an urban transport network. The system should form a real-time map of traffic flow intensity and contribute to the formation of management decisions to prevent peak traffic loads based on estimates of the maximum traffic capacity of network junctions.
The first step in achieving these goals is to construct a mathematical model to assess the maximum capacity of the most typical traffic lanes at regulated urban intersections—through traffic lanes. Based on this model, we can construct a complete model of traffic capacity for the entire intersection. Moreover, these models will allow us to estimate the peak values of traffic-related emissions, which is a crucial task of municipal government (Shepelev et al., 2022).
The methodology of our research consists of several stages: selecting determinant variables and initial data collection; mathematical modeling of traffic lane capacity at regulated intersections; predictive estimates of traffic capacity using fuzzy logic; using the resulting models to estimate the peak values of emissions at intersections.
Selection of Variables and Initial Data Collection
We collected data for our study at several large urban intersections in Chelyabinsk (Russia) (Author Anonymous, 2022). Initially, we selected through lanes at several large intersections for observation. We recorded both the geometric parameters of the lanes themselves and the structure of the intersections as a whole. At intersections, vehicles pass through at a constant speed or accelerate after a complete stop at the stop line. Therefore, to construct an adequate model of the traffic lane capacity at regulated intersections, both the geometry of the intersection itself and the nature of the traffic at the intersection should be taken into account as input data.
Twenty-four lanes were selected from ten major urban intersections, including those with tram tracks. Data were collected on passenger vehicles; ten measurements were taken for vehicles passing through an intersection and ten for uniformly-acceleration after stopping at the traffic light. A total of 480 measurements were taken for several initial variables characterizing the dynamics of passing through an intersection.
To form the database, we selected a set of initial variables obtained from the video stream and acting as primary variables in the research, as well several secondary calculated variables characterizing two types of traffic at a regulated intersection:
• Lpr—distance from the stop line to the exit from the intersection (m);
• tsv—travel time through the intersection (from stop line to the exit of the intersection) without stopping (s);
• tost—travel time through the intersection for vehicles accelerating after a complete stop (s);
• Vsv—vehicle speed from the stop line to the exit from the intersection (km/h);
• Aost—vehicle acceleration from the stop line to the exit from the intersection after a complete stop (m/s2);
• Sij—saturation flow of the ith lane during the jth regulation phase (equivalent units/h);
• Cij—traffic capacity of the ith lane during the jth regulation phase (equivalent units/h).
Notably, the estimated lane capacity at a regulated intersection is determined by the formula (Highway Capacity Manual, 2022):
where Сij is the capacity of the lane i during the regulation phase j, equivalent units/h; Sij is the saturation flow of the lane i during the regulation phase j, equivalent units/h; gej is the effective duration of the regulation phase j, s; C is the duration of the regulation cycle, s.
where S0 is the ideal saturation flow taken equal to 1,800 (equivalent units/h); N is the number of traffic lanes; fW is the coefficient accounting for the width of the traffic lane; fHV is the coefficient accounting for commercial vehicles; fG is the coefficient accounting for gradients; fP is the coefficient accounting for parking; fBB is the coefficient accounting for the interference created by buses; fA is the coefficient accounting for the area type; fRT is the coefficient accounting for right turns (i.e. interference created by passengers); fLT is the coefficient accounting for left turns.
To calculate Sij and Cij, we also investigated the structure and geometry of both the intersections and the individual analyzed traffic lanes using the presented formulas. After collecting and processing the initial data and calculating the secondary variables, we formed an initial data array, including data for seven variables for 24 traffic lanes at urban intersections.
The proposed list of initial variables represents an integrated approach to assessing the capacity of traffic lanes. It includes both assessment parameters (Sij, Cij) based only on the structure of the intersection ignoring the actual nature of the traffic flow movement, as well as the parameters characterizing free passing through the intersection (Lpr, tsv, Vsv) and uniformly-accelerated passing after a complete stop at the stop line (Lpr, tost, Aost). This set of initial data will allow us to construct the most reliable model of traffic lane capacity at a regulated intersection.
Construction of a Mathematical Model
We used statistical methods to process and analyze data obtained from stationary street cameras monitoring traffic at urban intersections. These methods characterize the quantitative regularities of TF in close connection with their qualitative content. We completed a multiple regression analysis and verified the statistical significance of the obtained results and correlation analysis. The initial data were processed using the SPSS (Statistical Package for Social Sciences) software.
Multiple regression analysis selects the variables from the initial set with the most significant impact on the traffic capacity of intersections during traffic congestion. In addition, it ranks the selected variables according to their degree of impact on the traffic capacity of intersections and quantifies the degree of this impact. The multiple regression built as a result of our analysis also predicts the capacity of traffic lanes in terms of specific values of their initial parameters, which is essential for the practical application of traffic models.
The dependent variable is the maximum number of passing vehicles (Highway Capacity Manual, 2022) since this variable is a criterion of the traffic lane capacity. The remaining initial variables are taken as independent. The “multiple linear regression analysis” option was selected for our analysis in the SPSS statistical software suite.
The mathematical model is presented as a regression equation relating the traffic capacity Cij to the initial variables:
for which the numerical values of the coefficients ki are determined but have no statistical meaning. The values of these coefficients will be necessary to obtain forecasts of the ca-pacity of new traffic lanes. The standardized coefficients ki stand of model (3) showing their relative weight of impact on the dependent variable Cij have a useful information load. As expected, the saturation flow of the traffic lane Sij (k5stand = 0.788) and the time of free passing through an intersection tsv (k2stand = 0.466) have the greatest impact on the traffic capacity. Other standardized coefficients of the model have significantly lower numerical values, so we can consider their impact as secondary.
To confirm our findings, we also carried out a correlation analysis, which showed similar results. We calculated the Pearson parametric correlation coefficients rxy and their corresponding levels of statistical significance αi, which should not exceed 5% to confirm a statistically significant correlation. The calculations both confirmed the findings of the regression analysis and presented a more detailed picture of the impact of the initial variables. Thus, only two variables—Vsv (α4 = 26.3%) and Aost (α5 = 9.3%)—have a statistically insignificant impact on the traffic capacity with weak correlation coefficients. The strongest impact on the traffic capacity Cij was exerted by the variable Sij (rxy = 0.819), while the impact strength of the other initial variables is average: for Lpr and rxy = −0.513; for tsv and rxy = −0.452; for tost and rxy = −0.498.
The statistical significance of the obtained regression model (as calculated by the Fisher criterion) is 0.00%, which is again significantly less than the limiting level of 5%. This indicates that model (3) has a high level of statistical significance.
The quality of the regression model is determined by the following series of calculated values. The multiple correlation coefficient R reflects the relationship of the dependent variable Cij with a set of independent variables. The numerical value of R is 0.862, which is considered a strong correlation. The multiple determination coefficient R Square is 0.742. This means that the linear regression explains 74.2% of the data variance, which is a good result, as it exceeds the generally accepted minimum level of 70%. Durbin-Watson statistic d is 2.079, which is between two critical values 1.5 < d < 2.5. This means that there is no first-order linear autocorrelation in the initial multiple linear regression data and reflects the good quality of multiple regression model (3).
Notably, the constructed model allows us to predict the dependent variable Cij. For example, after examining the parameters of many new traffic lanes (to expand the traffic flow monitoring network map), we can use the model (3) to estimate the peak value of the maximum traffic capacity of new intersections as junctions of this RN. This will also require empirical measurements of the average characteristics of traffic flows.
Fuzzy Logic Method
The constructed multiple model for calculating traffic lane capacity does not take into account a host of unpredictable random factors, such as a rapid changes due to weather conditions, damaged sections of the road, etc. In this case, it is advisable to use situation prediction methods based on fuzzy logic algorithms, which integrally take into account the impact of many unpredictable factors. Accounting for the impact of such random factors separately is difficult due to the complicated collection of initial data needed to analyze their impact.
This method uses E. Mamdani’s algorithm based on fuzzy logical inference, which avoids an excessively large number of calculations. Notably, the validation of a knowledge-based fuzzy system requires careful testing since fuzzy systems are incapable of machine learning and pattern recognition such as a neural network. Accordingly, in this practical study, which is the initial stage of assessing the traffic capacity at intersections in the conditions of several uncertainties, we do not obtain insight on the solution of several basic questions concerning consistency in the complete system of rules or the type of fuzzy membership functions. We instead aimed to obtain preliminary forecasts of the output variable in the field of our estimates based on the practical studies of traffic flows.
As noted previously, the actual traffic capacity is taken as the dependent variable Cij. In our data, this variable ranged from 250 to 1,050 design vehicles per hour. The multiple regression analysis has shown that the dependent variable is most affected by the independent variable Sij (the saturation flow), which ranges from 1,500 to 1850 vehicles per hour. As already noted, in contrast to theoretical assessments, the actual traffic situation is characterized by the initial parameters of the vehicles crossing an intersection and the geometry of the intersection itself. Therefore, to make forecasts that are closest to the actual situation, we single out two more independent variables: tsv—travel time through an intersection without stopping at the stop line (varies from 1.9 to 7.1 s) and Lpr—the length of the intersection (varies from 30 to 57 m).
The selected variables allow us to construct a model based on the fuzzy mathematical method and the fuzzyTECH software to predict the dependent variable Cij depending on the values of the independent variables Lpr, tsv, Sij. We assume there are three levels of membership functions in predictive modeling (low, medium, high) for the dependent and three independent variables. The distribution of the values of all the variables should be determined by the normal law rather than the linear law, which best corresponds to the real traffic processes, since the Gaussian fuzzification is most consistent with the consideration of the problem in the stochastic version. The parameters of the Gaussian terms of the three levels of the membership functions are also determined according to our estimates based on the practical work with observation camera data.
The relationship between the dependent and independent variables was established using the program Spreadsheet to edit rules (the matching rules unit contains 27 entries for three levels of all variables); a fuzzy logical model was developed to predict the values of the dependent variable.
Experimental studies of the constructed model can predict the output variable based on the actual values of the input variables and create a graphic representation of the distribution field of their mutual impact in the form of volumetric surfaces. Figure 1 shows the dynamics of the traffic lane capacity with a varying saturation flow of 0% (minimum); 50% (average); 100% (maximum values) within its actual variation range (from 1,500 to 1,850 design vehicles per hour).
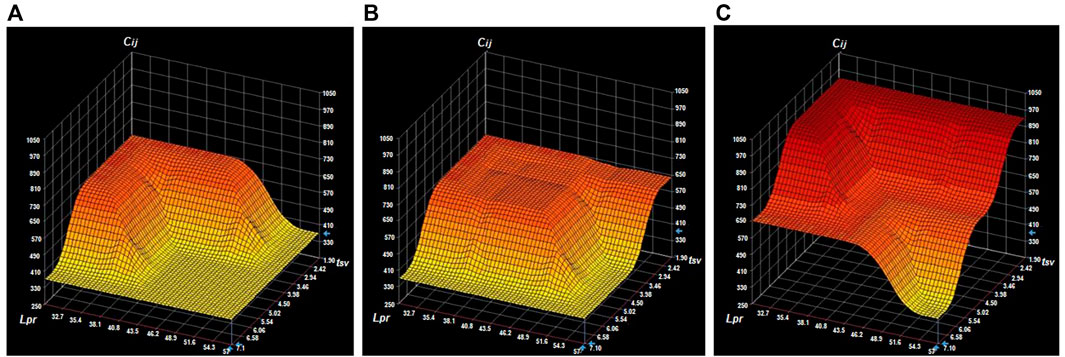
FIGURE 1. The dynamics of the distribution field for the traffic lane capacity (A) Sij = 0%; (B) Sij = 50%; (C) Sij = 100%.
The modeling results clearly demonstrate the nature of the impact of the geometry of the intersection Lpr and the travel time through the intersection tsv (horizontal axes) on the traffic capacity, as well as the determining nature of the impact of the saturation flow Sij of the traffic lane at the intersection. This research can serve as a good foundation for making grounded decisions on the redistribution of loads on the urban transport network and motivate to change the geometry of intersections.
Discussion
This paper discusses the construction of an urban monitoring system capable of real-time tracking of TF and calculating traffic-related emissions. To this end, we investigated several traffic lanes of regulated intersections both in terms of their geometry and the nature of vehicle movement. Based on the results of a regression analysis of our initial data, we constructed a statistically-reliable model of traffic lane capacity, which will further allow us to evaluate the strong and weak sections of urban road networks. Fuzzy logic methods were used to predict the traffic lane capacity depending on the variations in the geometry of the intersection and the nature of the vehicle movement. This research is essential for constructing a unified urban RN to monitor TF and can serve as a basis for the redistribution of TF during peak loads.
Conclusion
To construct the most adequate model of the traffic lane capacity at regulated intersections, we proposed an integrated approach that accounts for the structure of the intersection and the nature of traffic flow movement. The traffic flow movement is divided into two types—passing through at a constant speed or accelerating after a complete stop at the stop line.
The initial database was formed by processing video records from stationary street video surveillance cameras for 24 traffic lanes at regulated intersections. After processing the initial data, we obtained a statistically-reliable multiple regression model allowing us to estimate the traffic capacity. The correlation analysis confirmed the general trends in the determining impacts of the initial variables on the traffic capacity.
To complete our study, we presented a general forecast for assessing the traffic lane capacity at regulated intersections using fuzzy logic methods. The modeling results clearly showed the nature of the impact of both the geometry of the intersection and the travel time of vehicles and the determining nature of the impact of the saturation flow size for traffic lanes at the intersection on the traffic capacity.
The base of estimates of the maximum traffic capacity at urban transport network junctions based on the obtained mathematical model will contribute to management decision-making to prevent peak traffic loads.
Further studies are focused on all traffic lanes (including turn lanes) at a regulated intersection to estimate the traffic capacity for the entire intersection. We also plan to participate in the construction of a system for the dynamic monitoring of the traffic capacity of the urban transport network.
Author Contributions
All authors listed have made a substantial, direct, and intellectual contribution to the work and approved it for publication. VS and AGl: Conceptualization, methodology, investigation, AV and DN: Visualization, writing—review and editing, supervision. AGr: Software, validation, writing—original draft, AGl: Data curation, writing—original draft.
Funding
This research was supported by Russian Science Foundation, grant number 22-21-20057.
Conflict of Interest
The authors declare that the research was conducted in the absence of any commercial or financial relationships that could be construed as a potential conflict of interest.
Publisher’s Note
All claims expressed in this article are solely those of the authors and do not necessarily represent those of their affiliated organizations, or those of the publisher, the editors and the reviewers. Any product that may be evaluated in this article, or claim that may be made by its manufacturer, is not guaranteed or endorsed by the publisher.
References
Agbolosu-Amison, S. J., Sadek, A. W., and ElDessouki, W. (2004). Inclement Weather and Traffic Flow at Signalized Intersections: Case Study from Northern New England. Transp. Res. Rec. 1867, 163–171. doi:10.3141/1867-19
Araghi, S., Khosravi, A., and Creighton, D. (2015). A Review on Computational Intelligence Methods for Controlling Traffic Signal Timing. Expert Syst. Appl. 42 (3), 1538–1550. doi:10.1016/j.eswa.2014.09.003
Author Anonymous, (2022). Real-Time Monitoring (Chelyabinsk City, Russia). Available at: http://aims.susu.ru/view (Accessed April 22, 2022).
Biswas, S., Chakraborty, S., Ghosh, I., and Chandra, S. (2018). Saturation Flow Model for Signalized Intersection Under Mixed Traffic Condition. Transp. Res. Rec. 2672 (15), 55–65. doi:10.1177/0361198118777407
Chen, P., Liu, H., Qi, H.-S., and Wang, F.-J. (2014). Incorporating Nonuniform Arrivals in Delay Variability Modeling at Signalized Intersections. J. Cent. South Univ. 21 (10), 4021–4032. doi:10.1007/s11771-014-2391-8
Dai, Z., Song, H., Liang, H., Wu, F., Wang, X., Jia, J., et al. (2020). Traffic Parameter Estimation and Control System Based on Machine Vision. J. Ambient. Intell. Hum. Comput. doi:10.1007/s12652-020-02052-5
Glushkov, A., and Shepelev, V. (2021). Development of Reliable Models of Signal-Controlled Intersections. Transp. Telecommun. 22 (4), 417–424. doi:10.2478/ttj-2021-0032
Glushkov, A., Shepelev, V., Vorobyev, A., Mavrin, V., Marusin, A., and Evtykov, S. (2021). Analysis of the Intersection Throughput at Changes in The Traffic Flow Structure. Transp. Res. Procedia 57, 192–199. doi:10.1016/j.trpro.2021.09.042
Gorodokin, V., Shepelev, V., Buyvol, P., and Shepeleva, E. (2020). Method of Non-Stop Passage of Signal-Controlled Intersections Using Dynamic Signs and Computer Vision. Transp. Res. Procedia 50, 174–181. doi:10.1016/j.trpro.2020.10.022
Gu, H., Yu, Y., Li, Z., Liu, N., and Wang, Z. (20202020). The Study of Fixed-Time Signal Intersection Speed Control Strategy Based on Cooperative Vehicle Infrastructure. SAE Tech. Pap. doi:10.4271/2020-01-5212
Highway Capacity Manual(2022). A Guide for Multimodal Mobility Analysis. 7th ed. The Washington, DC: National Academies Press.
Jeon, H., Lee, J., and Sohn, K. (2018). Artificial Intelligence for Traffic Signal Control Based Solely on Video Images. J. Intelligent Transp. Syst. 22 (5), 433–445. doi:10.1080/15472450.2017.1394192
Karnati, Y., Sengupta, R., Rangarajan, A., and Ranka, S. (2022). Subcycle Waveform Modeling of Traffic Intersections Using Recurrent Attention Networks. IEEE Trans. Intell. Transp. Syst. 23 (3), 2538–2548. doi:10.1109/TITS.2021.3121250
Patel, P. N., Dhamaniya, A., and Katti, B. K. (2015). Effect of Mixed Traffic Characteristics on Saturation Flow and Passenger Car Units at Signalised Intersections. Eur. Transp. Trasp. Eur. 59.
Ren, W., Zhang, J., Li, L., and Zhou, Q. (20212021). An Intersection Platoon Speed Control Model Considering Traffic Efficiency and Energy Consumption in CVIS. Math. Problems Eng. 2021, 1–17. doi:10.1155/2021/2891247
Saha, A., Chandra, S., and Ghosh, I. (2019). Modeling Platoon Dispersion at Signalized Intersections in Mixed Traffic Scenario. Arab. J. Sci. Eng. 44 (5), 4829–4838. doi:10.1007/s13369-018-3568-5
Shen, Z., Wang, W., Shen, Q., Zhu, S., Fardoun, H. M., and Lou, J. (2020). A Novel Learning Method for Multi-Intersections Aware Traffic Flow Forecasting. Neurocomputing 398, 477–484. doi:10.1016/j.neucom.2019.04.094
Shepelev, V., Aliukov, S., Glushkov, A., and Shabiev, S. (2020). Identification of Distinguishing Characteristics of Intersections Based on Statistical Analysis and Data from Video Cameras. J. Big Data. 7 (1). doi:10.1186/s40537-020-00324-7
Shepelev, V., Glushkov, A., Bedych, T., Gluchshenko, T., and Almetova, Z. (2021). Predicting the Traffic Capacity of an Intersection Using Fuzzy Logic and Computer Vision. Mathematics 9 (20), 2631. doi:10.3390/math9202631
Shepelev, V., Zhankaziev, S., Aliukov, S., Varkentin, V., Marusin, A., Marusin, A., et al. (2022). Forecasting the Passage Time of the Queue of Highly Automated Vehicles Based on Neural Networks in the Services of Cooperative Intelligent Transport Systems. Mathematics 10 (2), 282. doi:10.3390/math10020282
Wang, S., Patwary, A. U. Z., Huang, W., and Lo, H. K. (2022). A General Framework for Combining Traffic Flow Models and Bayesian Network for Traffic Parameters Estimation. Transp. Res. Part C Emerg. Technol. 139, 103664. doi:10.1016/j.trc.2022.103664
Zhao, H.-T., Nie, C., and Li, J.-R. (2015). Cellular Automaton Model for Traffic Flow Under Ice and Snowfall Conditions. Jiaot. Yunshu Xit. Gongcheng Yu Xinxi J. Transp. Syst. Eng. Inf. Technol. 15 (1), 87–92.
Keywords: traffic flows, mathematical model, traffic lane capacity, fuzzy logic, saturation flow
Citation: Shepelev V, Glushkov A, Gritsenko A, Nevolin D and Vorobyev A (2022) Assessing the Traffic Capacity of Urban Road Intersections. Front. Built Environ. 8:968846. doi: 10.3389/fbuil.2022.968846
Received: 14 June 2022; Accepted: 23 June 2022;
Published: 14 July 2022.
Edited by:
Katarzyna Gdowska, AGH University of Science and Technology, PolandReviewed by:
Evgeniy Chikishev, Tyumen Industrial University, RussiaJozef Stoklosa, University of Economics and Innovation, Poland
Copyright © 2022 Shepelev, Glushkov, Gritsenko, Nevolin and Vorobyev. This is an open-access article distributed under the terms of the Creative Commons Attribution License (CC BY). The use, distribution or reproduction in other forums is permitted, provided the original author(s) and the copyright owner(s) are credited and that the original publication in this journal is cited, in accordance with accepted academic practice. No use, distribution or reproduction is permitted which does not comply with these terms.
*Correspondence: Vladimir Shepelev, c2hlcGVsZXZ2ZEBzdXN1LnJ1