 Peter J. Marcotullio
 Carsten Keßler2
94% of researchers rate our articles as excellent or good
Learn more about the work of our research integrity team to safeguard the quality of each article we publish.
Find out more
ORIGINAL RESEARCH article
Front. Built Environ., 31 October 2022
Sec. Urban Science
Volume 8 - 2022 | https://doi.org/10.3389/fbuil.2022.947496
This article is part of the Research TopicTheories, Models and Observations of Urban Spatial Expansion: Patterns, Drivers, Impacts and Vulnerabilities of Future Urban WorldsView all 5 articles
Over the past decades, the world has experienced increasing heatwave intensity, frequency, and duration. This trend is projected to increase into the future with climate change. At the same time, the global population is also projected to increase, largely in the world’s cities. This urban growth is associated with increased heat in the urban core, compared to surrounding areas, exposing residents to both higher temperatures and more intense heatwaves than their rural counterparts. Regional studies suggest that Asia and Africa will be significantly affected. How many people may be exposed to levels of extreme heat events in the future remains unclear. Identifying the range in number of potentially exposed populations and where the vulnerable are located can help planners prioritize adaption efforts. We project the ranges of population exposed to heatwaves at varying levels to 2,100 for three future periods of time (2010–2039, 2040–2069, 2070–2099) using the Shared Socio-Economic Pathways (SSPs) and the Representative Concentration Pathways (RCPs). We hypothesize that the largest populations that will be exposed to very warm heatwaves are located in Asia and Africa. Our projections represent the warmest heatwaves for 15 days during these three periods. By the 2070–2099 period, the exposure levels to extreme heatwaves (>42°) exceed 3.5 billion, under the sustainability scenario (RCP2.6-SSP1). The number of those exposed in cities climbs with greater projected climate change. The largest shares of the exposed populations are located in Southern Asia and tropical countries Western and Central Africa. While this research demonstrates the importance of this type of climate change event, urban decision-makers are only recently developing policies to address heat. There is an urgent need for further research in this area.
Heatwaves can be characterized by intensity, frequency, duration, timing and spatial extent, and there are multiple ways in which each of these characteristics can be examined (Perkins-Kirkpatrick and Lewis, 2020). This has led to a number of different measures for these events (Perkins et al., 2012; Perkins, 2015; Horton et al., 2016) with different indices commonly used to identify them (Dosio et al., 2018). The IPCC finds all the characteristics of heatwaves have increased in most parts of the world (Pörtner et al., 2022). Within the US, for example, from the 1960s to the 2010s, the frequency of heatwaves has increased from 2 per year to over 6, the average length of days for a heatwave has increased from 2.99 days to 3.96 days and the intensity has increased from 1.99°F (1.1°C) to 2.46°F (1.4°C) above local thresholds.1
Heatwaves are one of the most important urban climate change phenomena, but are not new to cities. For example, long duration heatwaves of 13 and 23 days were experienced in the US during the early 1900s and 1930s. In 1936, cities across 12 states experienced all-time highs (clearing 49°C). The 2003 European heatwave that covered much of that region lasted for more than a week in some locations. In 2019, deadly heatwaves occurred around the world, seasonally early and record breaking in duration and intensity. In May of that year, heatwave temperatures reached 51°C in northern India and Pakistan and the heatwave in India was the longest ever recorded in that country at that time. In June 2019, heatwave temperatures exceeded 45°C in parts of Western Europe. The 2022 heatwave in South Asia exceeded April average maximum temperature for northwest and central India since recordings began 122 years ago, as temperatures have reached 35.9°C and 37.8°C, respectively. The Pakistani cities of Jacobabad and Sibi in the country’s southeastern Sindh province recorded highs of 47°C (Mogul et al., 2022).
Intense and long heatwaves have devastating consequences to public health (Patz et al., 2005). Recent evidence suggests that for public health the duration of the heatwave is more important than the intensity (D'Ippoliti et al., 2010). Heatwaves also impact a number of different human activities including, inter alia, agriculture (Lobell and Field, 2007; Thornton et al., 2009; Kornhuber et al., 2020), workplace productivity (Kjellstrom, 2016; Rao et al., 2020), wildfire intensity and frequency (Westerling et al., 2006) and public infrastructure (McEvoy et al., 2012; Rübbelke and Vögele, 2011). Heatwaves pose a high risk to urban residents given that temperatures are exacerbated in cities by the urban heat island effect (Oke et al., 2017).
Climate change experts warn that heatwaves will continue to grow in frequency, intensity and duration (Meehl and Tebaldi, 2004; IPCC, 2012, 2013; Perkins-Kirkpatrick and Lewis, 2020). Given the importance of these phenomena to those living in cities we examine the potential global urban resident exposure of extreme (Heat Index >42°C) for 15-day heatwave events including total, sensitive and low-income populations. We use the representative concentration pathways (RCPs) and the shared socio-economic pathways (SSPs) along with modeled simulations of urban land use growth to estimate the range of urban populations exposed during three future periods of time 2010–2039, 2040–2069, and 2070–2099.
Our findings suggest that under global policy conditions that address climate change and under the so-called “sustainability” pathway, best estimates of urban populations that experience extreme 15-day heatwaves of >42°C and >46°C could increase 3 and 4-fold, respectively, by the end of the century. We project that by the end of the century (2070–2099), the numbers of those exposed to heatwaves >42°C 15-day heatwaves will rise to over 3.58 billion (range: 3.05–4.04 billion) and include over 56% of the global urban population. Those exposed to extreme heatwaves of >46°C 15-day heatwaves will rise to over 2.6 billion (range: 1.86–3.35 billion) and include 41% of the global urban population. Under conditions of stronger climate change and associated socio-economic development (RCP4.5-SSP2) by the 2070–2099 period, the numbers of those exposed to 15-day heatwaves of >42°C could exceed 4.5 billion (range: 4.02–5.09 billion). This will include 64% of the global urban population. Under the high fossil fuel scenario (RCP8.5-SSP5), urban residents exposed to extreme 15-day heatwaves >42°C is projected to rise to 5.12 billion (range: 4.43–5.78 billion). In this scenario, over 74% of the global urban population is projected to experience these events. The lion’s share of the projected exposed population across all scenarios is in Southern Asia and Western and Central Africa. In the scenarios with greater climate change the location of exposed resident populations spreads to South America, Oceania and North America.
In the next, second section we review the background on the RCPs and SSPs, heatwave projections, the urban impact of heatwaves, urban growth modeling and heatwave vulnerability. The third section provides the methods and materials used in the study. The fourth section presents our findings, and the fifth section provides a discussion. In the last section we conclude with a summary of the study.
The SSPs and RCPs were developed to compare ranges of future outcomes for climate and society, and provide insight into the potential drivers of change (Ebi et al., 2014). The SSPs describe plausible alternative trends in the evolution of society and natural systems at the regional and global levels through narrative descriptions and quantifications of socioeconomic variables (such as population, urbanization, gross domestic product, demographic structure) from 2010 to 2,100. All SSPs are called “reference” pathways and assume no climate change or climate impacts during development, and no new climate policies after 2010 (Kriegler et al., 2014), but they are classified by their interactions with climate (Riahi et al., 2017). The five SSPs define a variety of social developments that create challenges to mitigating climate change (for example, high use of fossil fuels in energy systems) and challenges to adapting to climate change (for example, low adaptive capacity).
Briefly, SSPs 1 and 5 envision optimistic trends as the world invests in education and health. Many nations experience rapid economic growth under well-functioning institutions. SSP5 assumes energy intensive, fossil-based economic growth. Alternatively, SSP1 assumes increasing sustainable practices, hence it is called the sustainability pathway. SSPs 3 and 4 include less optimistic trends, with lower comparable investment in education and health, accompanied by fast growing population, and increasing inequalities. In SSP3, nations prioritize regional security and promote a “nation first” attitude. In SSP4 large inequalities within and across countries emerge. In both SSP3 and SSP4, societies become increasingly vulnerable to climate change. The SSP2 projects a middle pathway in which trends continue their historical patterns without substantial deviations (O’Neill et al., 2016).
A new set of SSP-RCP relationships are currently being developed, which together can be linked to climate policies. These linked SSP-RCPs provide outcomes to the end of the current century and beyond (O’Neill et al., 2016). Several are used in the latest IPCC report. For example, a low emission SSP1 was necessary to link to the new RCP1.9 in order to achieve a pathway to 1.5°C by the end of the century (Rogelj et al., 2018), which was used in the IPCC 1.5°C Report (IPCC, 2018).
Note that while the SSP1 is considered the “sustainability” pathway it is different from a sustainable development pathway. The IPCC 1.5°C Report uses the low emission scenario (RCP1.9) linked to SSP1 as a sustainable development pathway to identify how to halt anthropogenic global warming and significantly reduce climate impacts compared to a global increase in temperature of 2°C. The report also suggests that reaching this goal can be accomplished through a variety of different portfolios of mitigation measures (IPCC, 2018). Another example has been provided by Soergel et al. (2021), who find, using a scenarios framework that includes the SSPs, that sustainable development pathways that addresses the UN’s sustainable development goals can be achieved, but includes strong policy interventions.
The RCPs represent trajectories of climate-related emissions from society. The concentrations of these emissions in the atmospheric creates the effects of the pathways on the global climate system. A fossil fuel intensive future is described in RCP8.5, which could lead to 4–5°C warming by 2,100. This pathway is given the “business-as-usual” moniker, meaning that current trends continue without change into the future, although there is debate over whether this scenario is the most likely outcome (Hausfather and Peters, 2020). RCP2.6 describes a world in which global warming is kept at or below 2°C and is the best possible climate change pathway among the group of original 4 RCPs discussed herein. RCP4.5 and RCP6.0 represent alternative worlds of varying responses to climate change. We present a range of scenarios to better communicate the potential range of outcomes. Specifically, we link SSP1 with RCP2.6, SSP2 with RCP4.5, SSP3 with RCP6.0 and SSP5 with RCP8.5, loosely following O’Neill et al. (2016).
Heatwaves have already increased in all parts of the world, including Africa, Asia, Europe and North America (Christidis et al., 2015; Pörtner et al., 2022; Rahmstorf and Coumou, 2011; Sun et al., 2014), including in major global urban areas (Mishra et al., 2015; Matthews et al., 2017). In Africa, studies demonstrate that heatwaves are increasing in intensity and frequency (Ceccherini et al., 2017). Asia has also experienced increasing heatwaves (Dash and Mamgain, 2011; Rohini et al., 2016; Panda et al., 2017). A recent global study finds that humid-heat extremes have increased disproportionately in over-populated regions (∼5.0 days per-person per-decade) relative to global land-areas (∼3.6 days per-unit-land-area per-decade) and population exposure to humid heat has increased at a faster rate than to dry-heat, highlighting the danger for vulnerable populations in these areas (Rogers et al., 2021). Another study suggests that global exposure to daily maximum wet bulb globe temperatures of 30°C increased nearly 200% from 1983 to 2016, which by the period’s end comprised 23% of the planet’s population (1.7 billion people) (Tuholske et al., 2021).
Climate change research suggests that maximum heatwave temperatures are expected to increase more than global temperatures (Seneviratne et al., 2016; Dosio et al., 2018) and that heatwaves will increase in intensity and number (Meehl and Tebaldi, 2004; Russo et al., 2014; Perkins-Kirkpatrick and Lewis, 2020). Even at 1.5°C warming, a significant increase in heatwave magnitude is expected over Africa, South America, and Southeast Asia and under 2°C warming the frequency of extreme heatwaves is projected to double over most of the globe (Dosio et al., 2018). Mora et al. (2017) uses temperature and humidity projections to identify land areas where these conditions cause mortality. The mortality threshold used in the study is based upon a review of 783 cases of excess human mortality associated with heat from 164 cities in 36 countries. The results suggest that around 30% of the world’s population is currently exposed to this threshold for about 20 days a year, but by 2,100 the percentage exposed will increase to between 48 and 74%, depending on the greenhouse gas emission scenario. Others have projected that urban exposure to >42°C heatwaves lasting for 15 days in the largest 20 cities of the world can exceed 1 billion by 2,100 (Marcotullio et al., 2020). This threshold may even be crossed under the SSP1 pathway due to the projected population growth in areas characterized by warm climate (Marcotullio et al., 2020). Projections for heat in urban Africa suggest the potential for large increases in resident exposure to extreme heatwaves (Marcotullio et al., 2021). Another urban study of Africa, confirms these results suggesting that the most exposed cities are located in Western and Central Africa, although several Eastern African cities showed an increase of more than 2,000 times the current level by the 2090s, due to the emergence of dangerous heat conditions combined with steady urban population growth (Rohat et al., 2019). Studies in Asia project significant increases in future heat events (Mishra et al., 2015; Pal and Eltahir, 2015; Mishra et al., 2017) with impacts on the region’s cities (Marcotullio and Schmeltz, 2021).
Climate related heat concern is exacerbated by the higher temperatures in urban core areas compared to suburban and exurban surroundings. This is called the urban heat island (UHI) effect. UHI was identified 200 years ago by (Howard, 1818) and has been identified around the world (Oke et al., 2017). Analysts consider UHI one of the major environmental problems of the twenty-first century (Arnfield, 2003; McKendry, 2003; Stone, 2012). While there are different types of UHI, canopy UHI, measured between the surface and the tree canopy or below the average building height of the city, is of most interest to this study and UHI hereafter refers to canopy UHI. UHIs are typically around 3–4°C (Oke, 1997; Voogt, 2002), but can vary between 0.4 and 12°C (Santamouris, 2015). Current research suggests that UHI has an upper limit of 12°C (Oke et al., 2017), but little is known of how the urban atmosphere will react as cities grow to enormous size, as projected (Hoornweg and Pope, 2016), dwarfing current mega-city (10 million) status.
In many cases, the highest UHI occurs during the summer or warmer seasons (Makrogiannis et al., 1998; Wang and Hu, 2006; Erell and Williamson, 2007). Maximum UHI intensities are typically experienced during the evenings to early morning periods. Driving forces for UHI include local climatology, street geometry, building fabric and anthropogenic activities. Given the importance of urban form and human activities, UHI intensities for individual cities change as they grow. In the UHI literature, one commonly used indicator for the level of UHI is city size, measured by population, city area or diameter (Oke et al., 2017). Several studies have identified the positive relationship between the urban population and UHI (Roth, 2007; Santamouris, 2015; Oke et al., 2017). Exactly how global climate change will affect UHI is a current topic of research, but much remains unknown (Huebler et al., 2007; Roy et al., 2011). A recent study suggests that UHI will increase across all SSPs for RCP4.5 due to urban expansion (Huang et al., 2019). Others find that both climate change and future urban population size and other factors will determine UHI (Tran et al., 2006; Shastri et al., 2017; Manoli et al., 2019). While difficult to project, a study of future urbanization and heatwaves is incomplete without the inclusion of UHI.
While a range of heat levels create human comfort, high heat levels have significant health impacts (Gasparrini et al., 2016; Xu et al., 2016; Hoegh-Guldberg et al., 2018). Humidity also contributes to heat impacts. In an attempt to address the heat-humidity confluence of risk, scholars measure potential harmful heat and more generally human discomfort, using an air temperature and humidity index (Anderson et al., 2013). Theoretically, the heat index takes into account the body’s ability to cool itself. When the body gets hot, it uses evaporative cooling through perspiration to regulate. When the humidity in the atmosphere it high, however, the rate of evaporation decreases, lowering the ability of sweat to evaporate and hence potential cooling. Thus, there is a direct relationship between heat, humidity and thermal comfort. Recent research suggests an upper limit on heat and humidity research suggests that all humans and mammals have upper limits to adaptation, and that these thresholds could be breached in the future (Sherwood et al., 2010). The human body’s ability to shed heat has an upper physiological limit at approximately a wet-bulb temperature of 35°C (Raymond et al., 2020).
The threshold level for dangerous heat also varies across localities, as cultures may react to heat differently (Patz et al., 2005). Globally, the minimum mortality temperature (MMT) collected from 658 communities in 43 countries varies widely between 14.2°C and 31.1°C decreasing by latitude (Tobias et al., 2021). A study in 11 large cities in the US suggests that MMT for heat varies between 65.2°F (18.4°C) and 90.4°F (32.4°C) with higher temperatures at lower latitudes (Curriero et al., 2002). Research in this area generally provides evidence for heat adaptation over time (for a review see Sheridan and Allen, 2018), although the time it takes to adapt is not well understood. A long-term historical study for New York that examined adaptation patterns by analyzing daily temperature suggests the decade-specific relative risk of mortality at 29°C vs 22°C declined from 1.30 in the 1910s (95% confidence interval [CI] = 1.25–1.36) to 1.09 (CI = 1.05–1.12) in the 2000s (Petkova et al., 2015). Alternatively, a cross-country examination of changes in MMT risk during the summer seasons from 1985 to 2012 found that the relative risks for the 99th percentile versus the minimum mortality temperature dropped from a range of 1.15–2.03 in early summer to a range of 0.97–1.41 in the later summer (Gasparrini et al., 2016). Reduction of heat-related mortality risk could be attributed to true acclimatization, adaptive behaviors (such as increased use of air conditioning), or harvesting effects.
Early warning systems, created by government offices, such as the US National Oceanic and Atmospheric Administration (NOAA) have identified heat thresholds. NOAA uses a common method to present a combined temperature and humidity index, originally developed by Steadman and others (Steadman, 1979a, 1979b; Rothfusz, 1990; Anderson et al., 2013). NOAA’s National Weather Service Heat Index Likelihood of Heat Disorder with Prolonged Exposure or Strenuous Activity 2 chart includes defined categories entitled, “Caution”, “Extreme Caution”, “Danger” and “Extreme Danger”. The heat indices for these categories start at 27°C, 33°C, 41°C, and 50°C, respectively. Alternatively, the India Meteorological Department (IMD) defines a heatwave if the daily temperature is 6°C above its long-term average or greater than 45°C and the heatwave will continue as long as the temperature exceeds the thresholds (Murari & Ghosh, 2019). These examples suggest heatwaves with heat indices above 42°C are considered extreme events. Moreover, our previous study used 42°C for heatwaves as a threshold (Marcotullio et al., 2021). Given the use of 46°C by some South Asian nations and the use by NOAA of the 50°C threshold, we also report the population numbers greater than these values. While all local heat warning systems, which define heat exposure levels, consider local meteorology, demographics and urban structure, there are lower thresholds used in different localities and we have not found a locality that has an extreme heat warning threshold above 46°C. Moreover, the duration of heatwaves is also important. A higher effect of heatwaves of longer duration and high intensity is shown in most cities suggesting that duration may be more important than intensity (D'Ippoliti et al., 2010). In regions that experience high heat, such as India, most heatwaves are less than 10 days although in a few locations they have lasted 15 or more days (Pai et al., 2017). We argue that 15-day heatwaves of >42°C can be classified as extreme events.
To develop urbanization simulations, a good understanding of the current areal extent of urban areas is vital. Definitions of what characterizes a city differ, especially when comparing countries at varying levels of development (for an example of different definitions see UN, 2018). Research on cities identifies stages of urban development with significant differences in urban form and area (Newman and Kenworthy, 1999; Wheeler, 2015). One important factor for defining cities is urban density, whether defined by residential population, built structures, employment or otherwise, is generally regarded as a defining urban characteristic (Boyko and Cooper, 2011). At the one end of the density spectrum, urban sprawl describes the expansion of urban settlements away from the urban core into low density developments with high per capita transportation energy use in outer areas (Ewing and Cervero, 2010). Alternatively, compactness defines high density, walkable and sustainable urban settlement patterns (Newman and Kenworthy, 1999). Given these distinctions, urban densities are often used to measure urban forms (Cheng, 2010; Güneralp et al., 2017). There is also evidence that urban forms associated with different densities create different environmental conditions. For example, compactness is related to a lower energy use and lower rates of increase in heat events over time (Stone et al., 2010) and therefore urban form may create differential conditions for heat exposure and general livability (Beattie and Haarhoff, 2018).
It should be noted that indoor temperatures are often warmer than ambient temperatures. This is critical as people typically spend most of their time in buildings (Klepeis et al., 2001). Studies have demonstrated that indoor areas can be over 1.5°C warmer than ambient air (Luu et al., 2021). While we recognize the importance of indoor conditions, we do not include this influence in this study.
The evaluation of the vulnerability of heatwaves is a complex task and is approached with different framings and methods (O’Brien et al., 2009). Scientific framings define vulnerability as a function of the intensity of the shock, the exposure of the population or infrastructure, the sensitivity of the population or infrastructure to that shock and the adaptive capacity of the system to avoid or ameliorate the shock (IPCC, 2014). Exposure includes the numbers of persons or the amount of infrastructures that are confronted with the climate shock. While the event will affect all persons and local structures, some are more susceptible to impact than others. These population and infrastructures are sometimes called climate sensitive. For example, the shares of the population younger than 5 or older than 64 are considered among the heatwave sensitive population (Kovats and Hajat, 2008; Sheridan and Allen, 2018). Adaptive capacity is defined as the ability to address the impacts of a shock event (promote, inhibit, stimulate, dampen, or exaggerate), either by preparatory or subsequent actions. While difficult to measure, most studies suggest that societal adaptive capacity increases with the level of management (particularly governance and strength of institutional responses), access to resources and demonstrated successful historical coping experiences (Smit et al., 2001; Yohe and Tol, 2002). The general financial resources available to a society provides a small, but important glimpse to adaptive capacity, although the use of this indicator is limited because, inter alia, it does not include the distribution of incomes within nations. Within wealthy countries, there is evidence of significant disparities of urban household incomes (Timberlake et al., 2012; Gornig and Goebel, 2016).
Alternatively, contextual framings of vulnerability are based on multidimensional views of climate-society interactions. These studies focus on the political, institutional, economic and social structures, their interactions and how they condition the context for exposure, sensitivity and capacity to address climate events (Kelly and Adger, 2000; O’Brien et al., 2009). Notwithstanding differences in framings, vulnerability assessments typically aggregate indices and almost all include economic indicators (Brooks et al., 2005; Cinner et al., 2018). At the same time, the different approaches prioritize different types of knowledge, can lead to different types of responses, and therefore require explicit recognition. This study uses a scientific framing of vulnerability. However, it is further limited by data availability. Scientific studies of vulnerability often estimate the potential monetary cost, morbidity or mortality associated with heatwaves, and assess the potential ability of societies to cope with or adapt to these events (see, for example Li et al., 2015; García-León et al., 2021).
The methods used in this study include urban growth simulations, generation of future heatwave projections, the identification of UHI effects by size of urban population, the identification of heat sensitive populations and a process by which these methods are combined to identify locations of populations exposed to extreme heatwaves. We briefly discuss each component and the materials involved. Details of the methods in this study are presented in a previous paper (Marcotullio et al., 2021).
The research questions are: what are the future ranges in populations exposed to 15-day heatwaves >42°C and where will these populations be located. We hypothesize, based upon the literature review above, that the future numbers of exposed populations will vary by climate change intensity and will be very large (in the billions). The second hypothesis, also based upon the literature above is that the largest share of these populations will be in Asia and Africa. These are also the locations of the largest projected population increases during the 21st Century among all regions of the globe (UN, 2022).
We start the analysis with urban land use expansion scenarios. Rather than attempting to predict urban growth, our intent is to provide two extreme cases, high and low urban land use growth. The idea is to provide a plausible range of urban expansion, which would mean that the range includes the results of other global urban land use growth models. The simulations use quantitative data from the Shared Socio-Economic Pathways (SSPs) 1,2,3 & 5 (Moss et al., 2008; Riahi et al., 2017), and project population across nations using a simple distinction between urban and non-urban. The sprawled model begins with the Global Rural-Urban Mapping Project (GRUMP) (Balk, 2009) urban extents layer. GRUMP is a global raster that contains either urban or non-urban cells for every country. The GRUMP model suggests that in 2000, urban areas accounted for approximately 3% of terrestrial land cover. The compact model starts with the European Space Agency’s Global Land Cover Map (GlobCover) (Bontemps et al., 2011) layer. GlobCover data is classified into 24 land cover classes. Urban cells were those classified as artificial surfaces and associated urban areas. The GlobCover model suggests that in 2000, urban areas accounted for approximately 0.3% of terrestrial land cover. The GRUMP, henceforth sprawled, and GlobCover, henceforth compact, urban models are at opposing extremes of current global urban land use estimations (Schneider et al., 2009). In addition to these two core layers, we also use a nations grid that identifies the country in each cell by ISO/UN numeric identifier codes, 3 as well as a map that contains the area for each grid cell. This area map is necessary to be able to calculate population densities, as cells decrease in size with increasing latitude. All layers were scaled to a resolution of 30 arc-seconds (∼1 km at the Equator).
We first identified the increase in population from 2000 to 2010 for every SSP and account for that growth in our land use models. Thereafter, we used SSP data to simulate we simulated urban growth in 10-year steps starting from 2010 to 2,100. As each SSP comes with specific urban and non-urban populations, we added these populations to their respective land use areas in each step for each country. The urban extent layer from the previous year was compared to the next step year in terms of total urban population per country. The population in the forward layer was then adjusted to match the projections from the SSP under consideration, such that population is randomly added to (or removed from) the urban and non-urban areas of each country. This was performed such that the urban and non-urban totals always match the specific SSP projections at the national level for each year.
During the process, a control mechanism was implemented to make sure that population density in a cell does not exceed a realistic limit. This limit was set to the mean of the 50 highest-density urban cells in a given country. Moreover, every 10 years, we multiplied the highest-density value from the previous step by a thinning factor of 0.95 to lower density levels over time. We lowered densities in conformance to research findings of this worldwide trend (Angel et al., 2010). All cells that had a density higher than this threshold were set to the threshold value, and their excess population was pushed to neighboring cells. After this adjustment, urban expansion is simulated by urbanizing cells, i.e., turning them from non-urban to urban in the urban extents layer. Urbanization of land use occurred at the same rate as urban population growth. An illustration of the steps by which we applied population for a given combination of SSP, RCP and urbanization scenario can be found in a previous publication (Marcotullio et al., 2021). Figure 1 presents an example of the results of our two urban land use simulations for the rift valley in Africa.
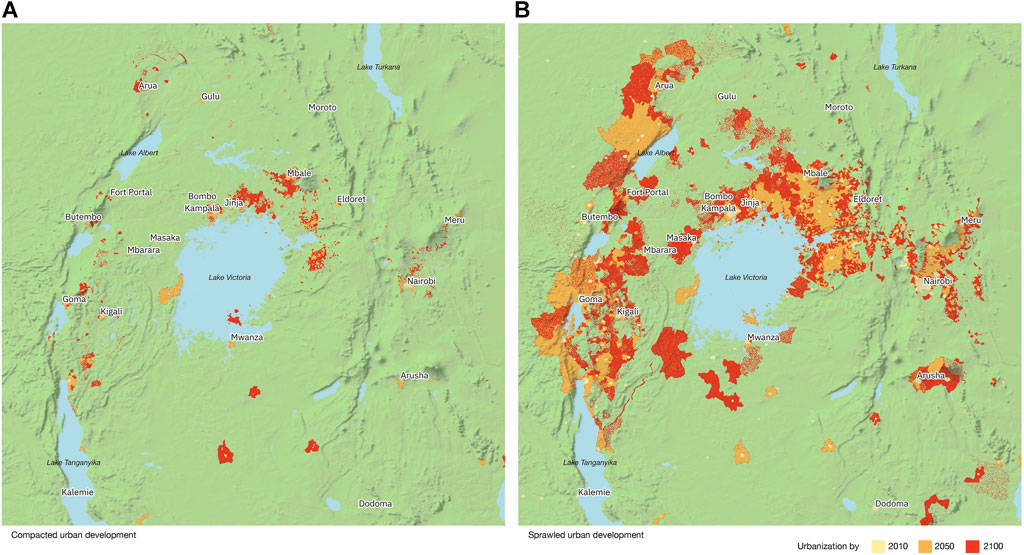
FIGURE 1. Image of the two different urban growth simulation outputs for the Lake Victoria Region, Africa. The figure incorporates SSP4 urban population growth across the region for the compact (A) and sprawled (B) urban growth models. Highlighted are the results of simulations runs for the years 2010, 2050 and 2,100. The image demonstrates the significant urban land use differences between the two simulations.
The results of the global analysis provide plausible ranges given already published global urban growth estimates. A first published estimate starts with 652,000 km2 urban areas in 2000 and projects a doubling by 2030 to 1,210,000 km2 (Seto et al., 2012). A second study estimate starts with approximately half the urban coverage (300,000 km2) and by 2050 project between 1,114,000 and 3,114,000 km2 of urban areas (Angel et al., 2005). A third example starts with approximately 600,000 km2 of urban area and reaches between approximately 900,000–1,900,000 km2 depending upon the SSP (Chen et al., 2020). Both the starting points and the end points of all these global studies are within our range between compact and sprawled models during these periods (Figure 2). This confirms our intent to bookend previous results.
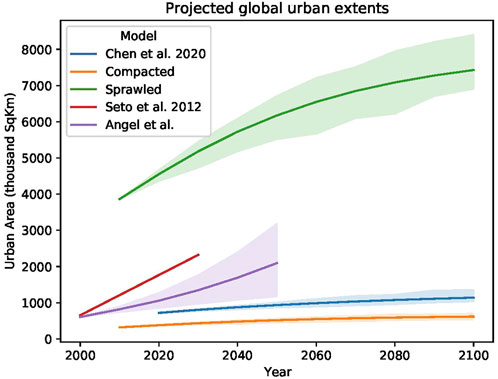
FIGURE 2. Projected global urban extents. The graph demonstrates the difference in urban land use amongst competing global urban growth models. The intent of the study was not to generate one model simulation for urban growth, but to create two models with very different outcomes that would include the results of other models. In this way, our study provides a range of potential population exposure to heatwaves that occur across the landscape. Our model simulations are green (sprawled) and orange (compact). The other global urban model growth results in the chart are from Seto et al. (2012), Angel et al. (2010) and Chen et al. (2020) also are included.
We use CMIP54 climate projections from the Inter-Sectorial Impact Model Intercomparison Project (ISIMIP) comprehensive compilation of five Global Circulation Model outputs GCM/Earth System models (Warszawski et al., 2014). The ISIMIP five are global circulation models representing 1950–2009 (historical period) and future projections up to 2099 which provide daily time series for all meteorological variables consistently bias corrected (Hempel et al., 2013) so the model results from different contributing groups yield comparable baselines for the contemporary period and only deviate in their future projections. We use mean daily temperatures and relative humidity. Using the mean temperatures and not the maximum daily temperatures provide conservative estimates of heatwaves. Also, urban heat island temperatures are often also provided as means. According to UHI research, urban and rural temperatures were approximately equal during mid-day to early afternoon, which was approximately when urban ambient temperatures were highest. That means that UHI values may not affect maximum temperatures as much as minimum and mean temperatures. UHI intensities, however, affected minimum and mean daily temperature and arguably, the UHI intensities can be added to these means to achieve a heat index that roughly approximates the UHI impact.
We used an established technique to create a heat index (Rothfusz, 1990) by combining mean daily temperature and relative humidity (Anderson et al., 2013) from the daily gridded time series at a 0.5° spatial resolution using all five ISIMIP models for the 1950–2099 period. During each period, we examined the deviations in heat indices during the 15-day running means and used the daily values as a measure of whether the heatwave events are regularly interrupted by periods of cooler temperatures or whether they are consistent. We then retrieved the highest computed heat index per cell for each multi-decadal period (1950–2009, 2010–2039, 2040–2069, 2070–2099). The 1950 to 2009 period serves as the contemporary baseline relative to which we evaluate future (near, midrange and far future) periods. We group the extreme heatwaves into the following categories, >42°C, >46°C and >50°C. We present the results for 15-day heatwaves >42°C.
We obtained average UHI intensities by city size from a review of 131 studies for 135 cities around the world, which resulted in over 110 UHI values (see also, Manoli et al., 2019). We identified these studies through a 3-step process. First, we identified UHI research reviews from 1979 to 2018. Second, we selected for canopy UHI studies. Third, we identified the urban population for each city and extracted mean UHI values. If the study did not include a population size, we used the UN sources to estimate the urban population at the time of the study. We then averaged the UHI values by city population size (Table 1). The UHI increased with the size of the urban population, as expected.
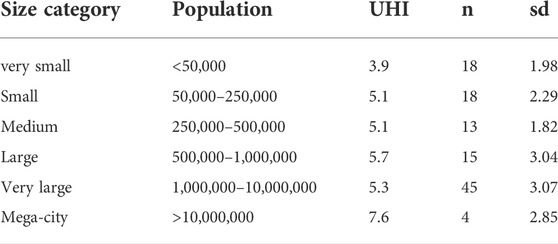
TABLE 1. UHI estimates by city population size. This table presents the results of our literature review on ambient temperature UHI observations for over 110 cities across the world. The values are the means (degrees Celsius) and standard deviations of the samples aggregated by urban population size. We based our analysis on Manoli, et al. (2019).
Data for national GDP per capita was also available by SSP from the results of the IIASA GDP model (PPP at US$2005). To identify the nations which might have resources for mitigation, we used the World Bank’s 2010 threshold for low-middle income of approximately US$4,000 PPP GDP per capita. This cutoff, applied to the GDP per capita data from the SSPs for 2010, identified approximately the same share of countries as did the World Bank during that year (World Bank’s share was around 37% of 218 nations and ours was about 41% of 167 nations) (World Bank, 2021). We applied a similar allocation of low-income status share to urban and rural populations. We then used this threshold across time, suggesting that this low-income indicator did not change, although some studies suggest that poverty levels shift upward over time (Hoy, 2016).
The sensitive population was identified as the share of population in each country of a certain age (younger than 5 and older than 64). Given that the population age structure was available for each SSP by gender for each 10-year step, we calculated the numbers of people in this category for each nation. We then applied the share of sensitive population uniformly across urban and non-urban cells.
After spatially allocating urban population derived from the SSPs, we overlaid the heat indices derived from the 5 ISIMIP GCMs for each RCP to identify the number, areal size, and location of urban areas and projected urban sensitive, low-income and resident population exposure to different levels of heat indices. We compared results along RCP-SSP groups to estimate how climate impacts play out under different socio-economic futures (Ebi et al., 2014; O’Niell et al., 2016). We present four plausible futures including RCP2.6-SSP1, RCP4.5-SSP2, RCP6.0-SSP3 and RCP8.5-SSP5. Because SSP1 is considered the sustainability pathway (Jiang and O’Neill, 2017), we highlight these results, but also report figures for the other RCP-SSP combinations. The range values include both the results of the heatwave heat indices from the 5 different GCMs and the range in populations exposed from the sprawled and compact simulations.
Projections involve several sources of uncertainty. Within each SSP, uncertainty in the quantitative projections arise both from varying interpretations of the SSP narratives, as well as from the models that have generated the quantitative projections (Riahi et al., 2017). Population (KC and Lutz, 2017) and urbanization (Jiang and O’Neill, 2017), are used as scenario drivers and reported without uncertainty ranges within each SSP, so that these numbers have been used under the assumption that uncertainty is limited to the variations across the SSPs.
There is also uncertainty in the projections of urban expansion. This is particularly challenging to deal with since the definition of urban varies by country. In order to address this issue, we identified two extreme representations of urban extents available that should encompass most urban land use projections. From these two representations we simulate urban expansion based on projected levels of urbanization per SSP, assuming urban expansion follows urban population growth rates. Our modeling approach also depends on a binary distinction between urban and non-urban areas rather than a gradient of urbanization. There are several sources of uncertainty in this approach, most notably the reduction of urbanization to population density, as well as the limited resolution of 30 arc-second grid cells, which entails a significant simplification of the urban structure within a cell to a simple distinction between urban and non-urban.
The output of the population and urbanization models discussed above is then combined with the RCPs (van Vuuren et al., 2014). The four RCPs already summarize a wide range of model outputs and encompass the whole range of modeling uncertainties (van Vuuren et al., 2011). We span the spectrum of joint model outputs by combining each projected population distribution and the corresponding urban extents with each RCP. For the assessment of future heat stress, however, several choices had to be made concerning the definition of heatwaves in terms of both threshold temperatures and kind of temperature measured as well as the minimum duration to qualify as a heatwave. Different choices for these criteria will inevitably lead to higher or lower numbers of exposed populations. We present the uncertainty measures as the range in model outputs around an ensemble mean estimate combined with the range in estimates for the populations exposed given the different urban land use simulations.
Our urban land growth simulations suggest high and low urban land use coverage (Table 2). In 2010, the high, or sprawled model, starts with approximately 3.85 million km2 of urban land use globally. By 2,100, the mean urban land use across SSPs is 7.40 million km2. Depending upon the SSP urban land use ranges from 6.75–8.37 million km2. The compact model, in 2010, suggests global urban land use is 317 thousand km2. By the 2070–2099 period, the mean urban land use across SSPs is 615 thousand km2. Depending upon the SSP urban land use ranges from 531–710 thousand km2.
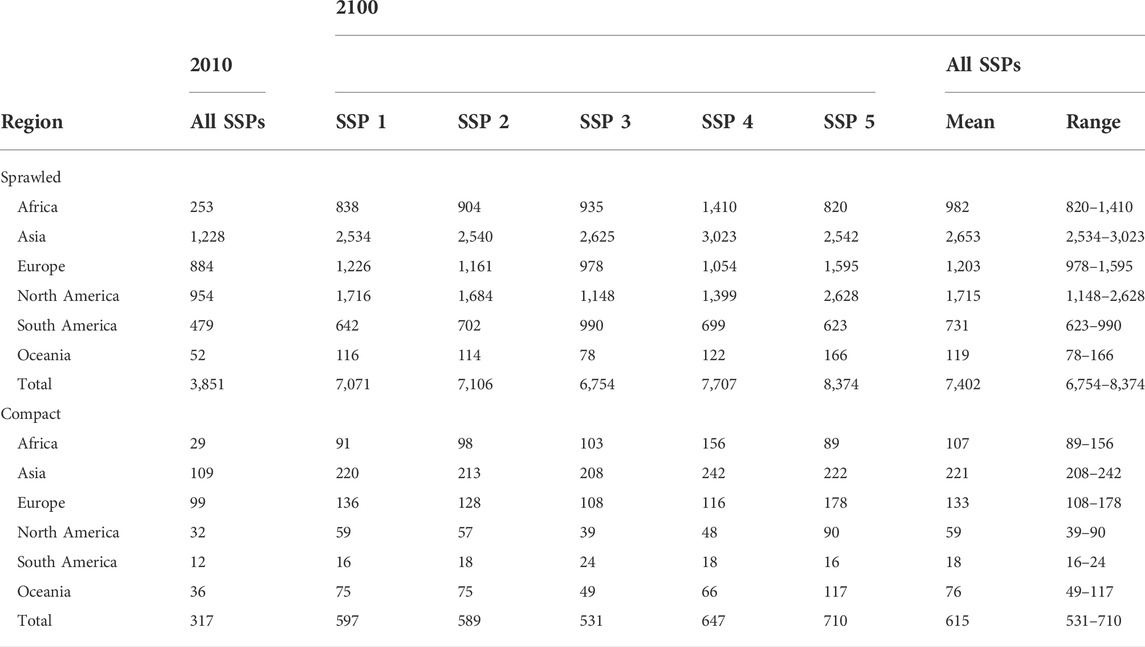
TABLE 2. Projected urban land use by region.
The shares of total by region vary from the sprawled to compact model simulations. In 2010, under the compact model simulation, Europe and Oceania have larger shares of total urban land use (31% and 11%) compared to the sprawled model (23% and 1%). North and South America have smaller shares of total urban land use in the compact model simulation (10% and 4%) compared the sprawled model (25% and 13%). Africa and Asia have similar shares between models (7–9% and 32–34%) (Table 3).
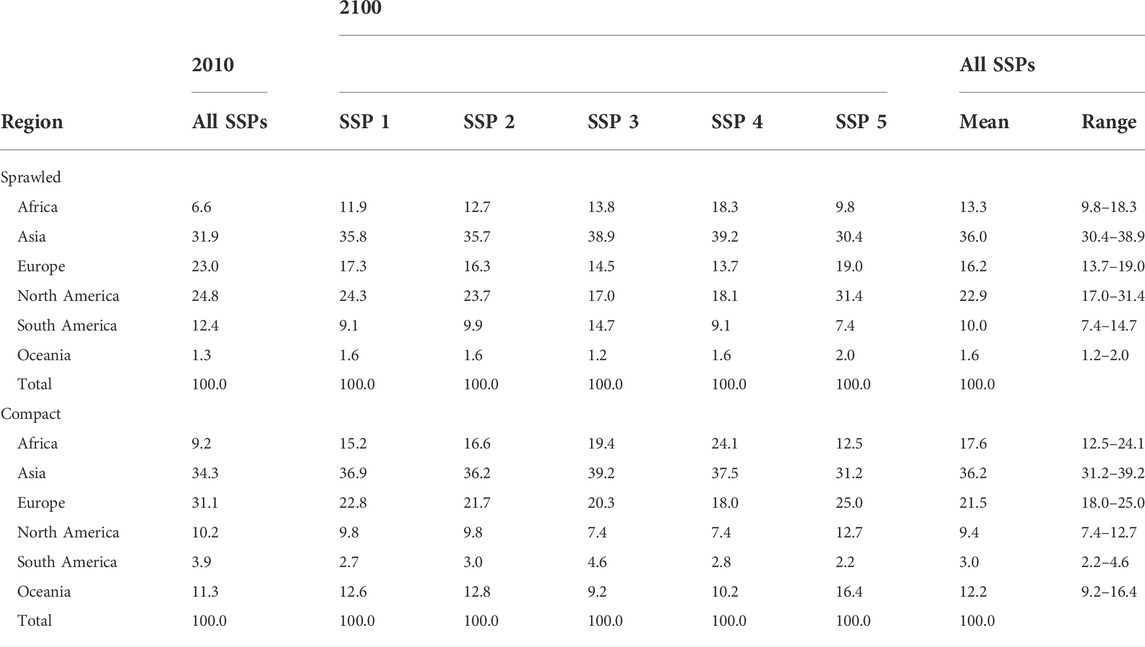
TABLE 3. Projected shares of total urban land use by region.
By 2,100, urban land use for SSP1 increases to 7.1 million km2 (83% increase) in the sprawled model and to 597 thousand km2 in the compact model (88% increase). By the 2070–2099 period, for SSP5 urban land use increases the most to 8.37 million km2 (117% increase) for the sprawled model. By the end of the current century, for SSP5, urban land use increases to 710 thousand km2 in the compact mode. Across all SSPs Asia retains the largest share of urban land use and African urban land use increases by the largest percent.
Over the course of the century, the projections suggest that 15-day heatwaves will increase in intensity across the globe. During the 1950–2009 period, the average, warmest global 15-day heatwave was 30.5°C (range: 30.3–30.8°C). For RCP2.6-SSP1, by the 2070–2099 period, the average global, warmest 15-day heatwave is projected to rise to as high as 32.6°C (range: 31.7–33.1°C) or by approximately 2.1°C. For RCP8.5-SSP5 the mean urban heat index for the average warmest 15-day heatwaves will rise to 39.7°C (range: 36.2–42.0°C) or by approximately 9.2°C. The projected increases in mean extreme 15-day heatwaves heat indices over the coming century for RCP4.5-SSP2 and RCP6.0-SSP3 are 4.0°C and 5.2°C, respectively (Figure 3).
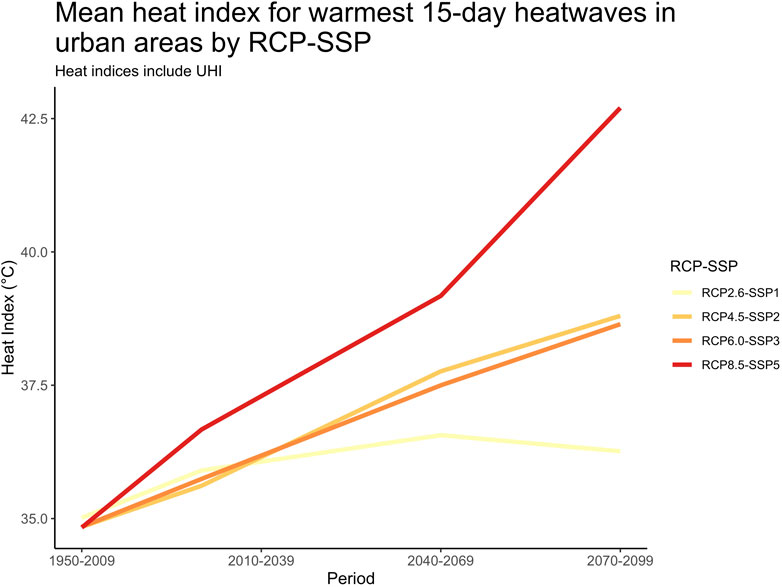
FIGURE 3. Mean heat index for warmest 15-day heatwaves in urban areas by RCP-SSP. This chart presents the average warmest 15-day heatwaves for the different periods by RCP-SSP pair. It demonstrates that for increasing climate change, the average 15-day heatwave heat index climbs. It also demonstrates that for RCP2.6-SSP1 the warmest 15-day heatwaves remain fairly constant in terms of intensity after 2010–2039 period, while in the other RCP pathways, the mean heat index for 15-day heatwaves continues to increase throughout the century.
The warmest 15-day heatwave extreme events are projected to occur in Asia and Africa, followed by South America and Oceania (Figure 4). These averages, however, hide extreme cases, as the 15-day heatwaves can reach extremely high levels over 49°C during the century in some locations.
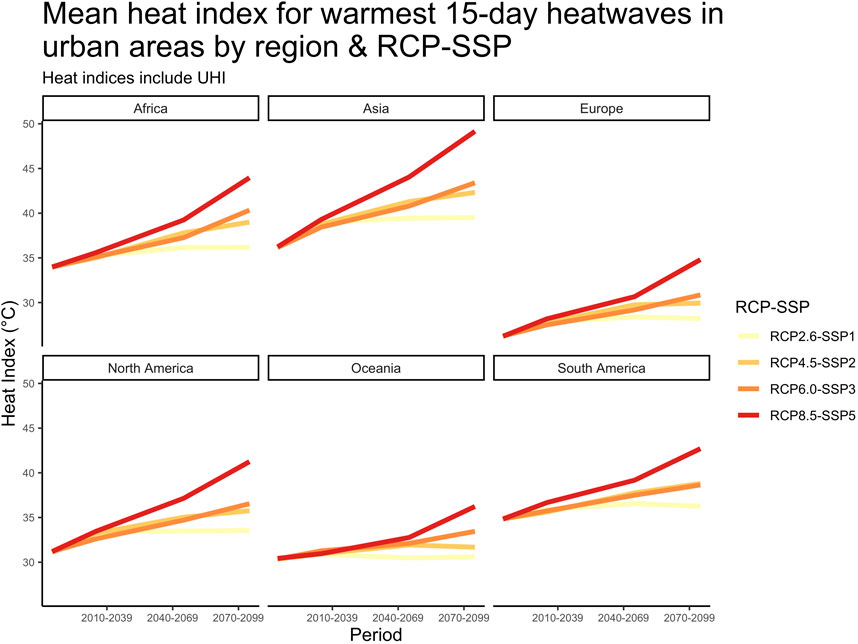
FIGURE 4. Mean heat index for warmest 15-day heatwaves in urban areas by region & RCP-SSP. This chart presents the projected changes in mean global heat indices for 15-day heatwaves by RCP-SSP for all continental regions. It demonstrates that Asia and Africa have the highest 15-day heatwave heat indices followed closely by South America and then North America.
As of 2009, approximately 36.1% of the global urban population had experienced 15-day heatwaves of 42°C and higher. Over the course of the century, the projections suggest that the total numbers and shares dramatically increase. For example, under the RCP2.6-SSP1 scenario, by the end of the century, the share of the total urban population exposed heatwaves of >42°C increases to 56.2% (3.58 billion, range: 3.01–4.04 billion). Under RCP4.5-SSP2, in the 2070–2099 period, the population share of those exposed to heatwaves >42°C rises to 64.0% (4.59 billion, range: 4.03–5.09 billion) in the 2079–2099 period. In the RCP6.0-SSP3 scenario, by 2,100, the projected share exposed to heatwaves of >42°C rises to 67.9% (5.01 billion, range: 4.37–5.59 billion). Finally, during the 2070–2099 period, in the RCP8.5-SSP5 scenario, those exposed to 15-day heatwaves of >42°C exceed 5.12 billion (range: 4.43–5.78 billion) or 74% of the global urban population (Figure 5; Table 4).
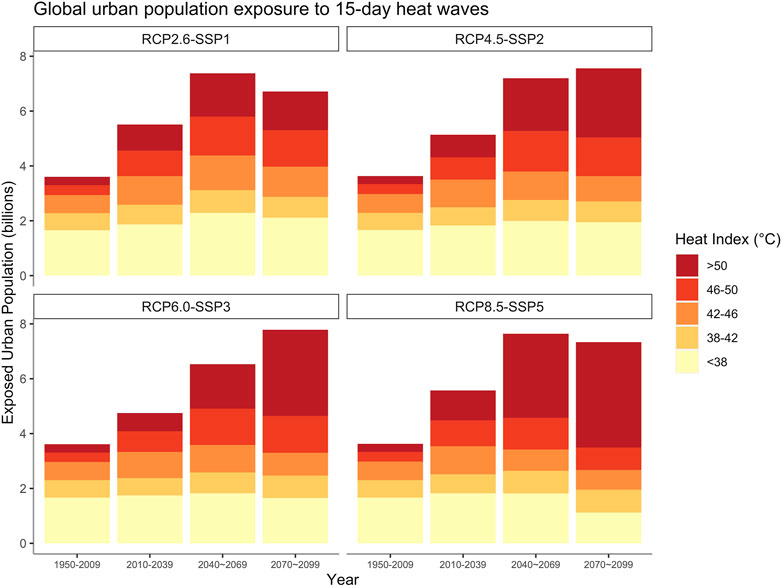
FIGURE 5. Global urban population exposure to extreme heatwaves. This chart presents the mean global urban population projected to be exposed to 15-day heatwaves of >42°C by RCP-SSP pairs.
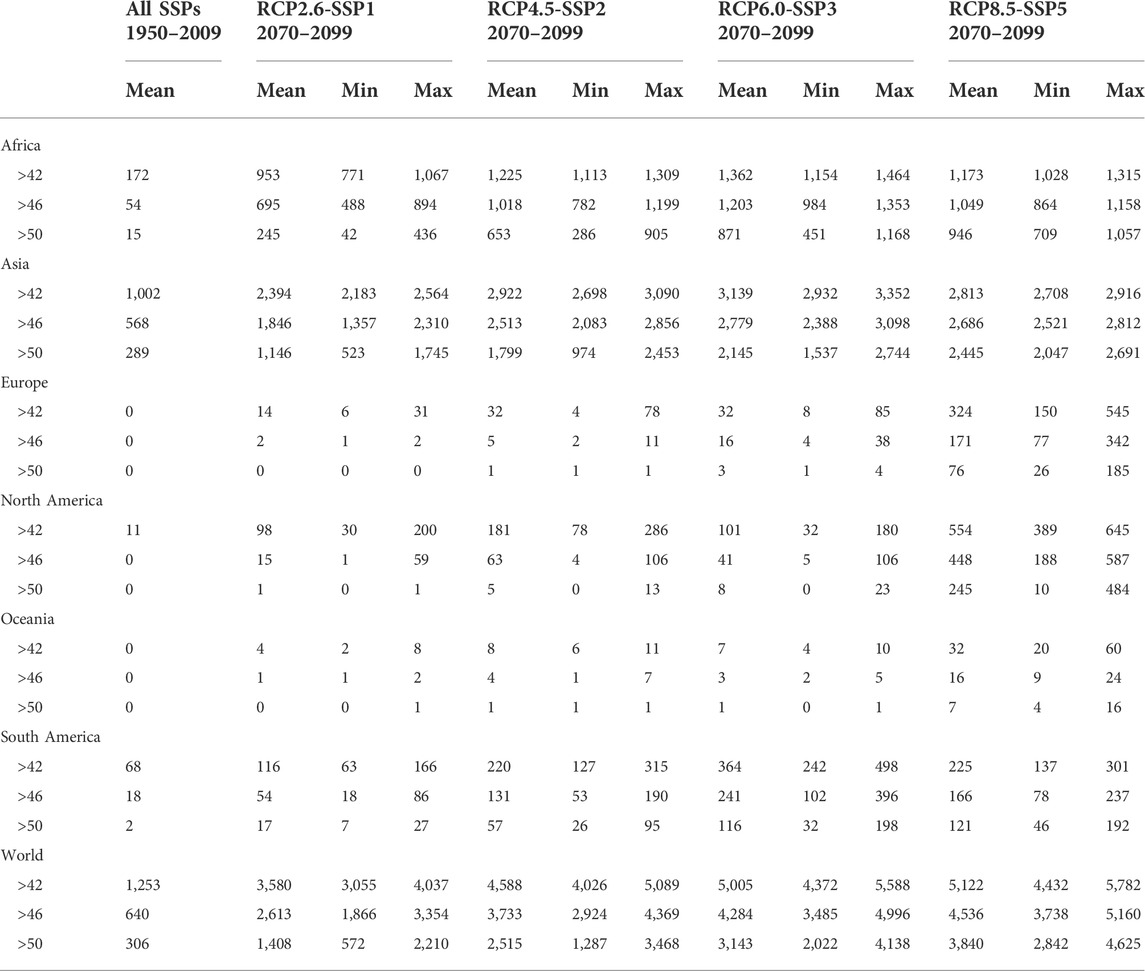
TABLE 4. Total urban population exposed to extreme heatwaves by region. This table presents the mean and range of total projected urban residents exposed to 15-day heatwaves of >42°C. The data are presented by region and for the world.
The location of the exposure level is highly skewed geographically. During current conditions, Asian has approximately 80% of those exposed to urban heatwave conditions of >42°C. However, the projections suggest that this could shift with population growth and climate change. While all RCP projections across all linked SSPs suggest that most of those urban populations projected to experience heatwaves >42°C are expected to be living in Asia, the share of those living in Africa is projected to be significant. Under current conditions approximately 13.7% of those experiencing 15-day heatwaves of >42°C live in African cities. This African share of exposed populations rises variably to between 22.9% and 27% and the Asian share of the urban population exposed drops to 54.7%–66.9% by the 2070–2099 period, depending upon the RCP-SSP combination (Table 4). The nations with the highest consistent projected populations exposed to 15-day heatwaves of >42°C are India, China, Nigeria, Pakistan, Indonesia, Bangladesh and the Philippines, although several countries are occasionally on the list of top ten countries, including the United States, Japan, Republic of Congo, Iraq, Brazil and Egypt (Figure 6). For RCP2.6-SSP1, by the 2070–2099 period, the top ten countries account for between 60 and 67% of the global urban population exposed to these heatwaves.
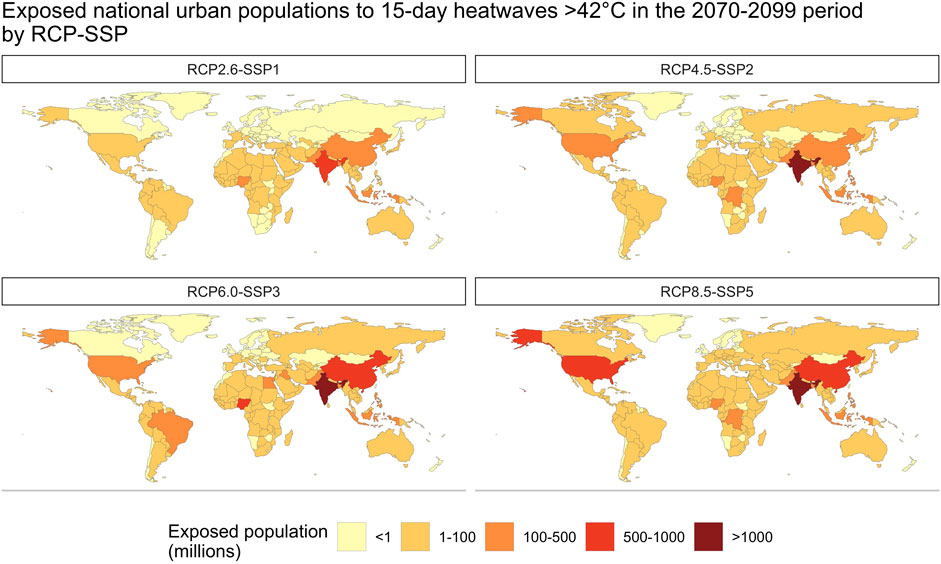
FIGURE 6. Exposed national urban populations to 15-day heatwaves >42°C in the 2070–2099 period by RCP-SSP. This map presents the mean projected numbers of urban residents exposed to extreme 15-day heatwaves by RCP-SSP pairs in countries by the 2070–2099 period. The top countries that are consistently are projected to have the highest urban resident exposure to extreme heatwaves include India, China, Nigeria, Pakistan, Indonesia, Bangladesh and the Philippines, although several countries are occasionally on the list of top ten countries, including the United States, Japan, Republic of Congo, Iraq, Brazil and Egypt.
Of those exposed to extreme heatwaves, our models project that percentages of total in the sensitive category (under 5 years of age and over 65 years of age) increase across all RCP-SSPs (Figure 7). During the current period for those urban populations exposed to heatwaves of >42°C include over 202 million elderly and young, which accounts for approximately 5.8% of the total urban population and 16.2% of the exposed population. This number jumps to 1.76 billion (range: 1.50–1.98 billion) by the 2070–2099 period in RCP2.6-SSP1, which is over 27% of the total urban population and 49.1% of the exposed urban population. For the other RCP-SSP combinations, the numbers of elderly exposed exceed 1 billion and reach 2.4 billion in RCP8.5-SSP5 by the 2070–2099 period. For that scenario, the exposed elderly and young account for over 35.6% of the global urban population and approximately 47.6% of the exposed urban population (Table 5).
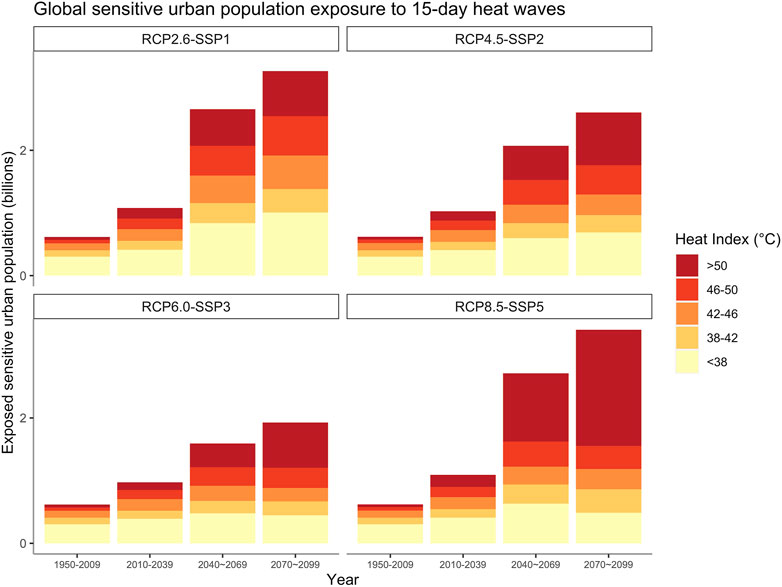
FIGURE 7. Global sensitive urban population exposure to extreme heatwaves. This chart presents the mean global urban sensitive population (<5 and >64 years of age) projected to be exposed to 15-day heatwaves of >42°C by RCP-SSP pairs.
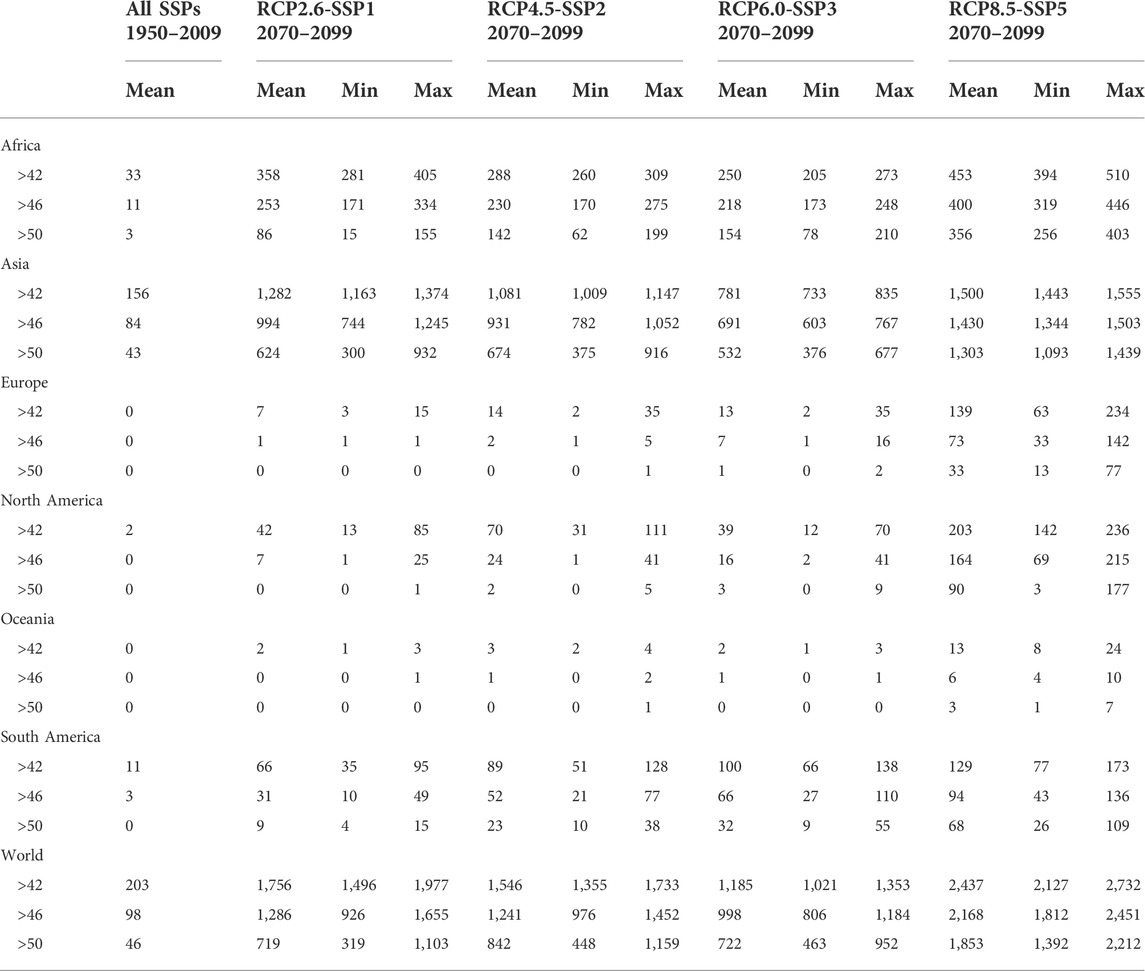
TABLE 5. Urban sensitive population exposed to extreme heatwaves by region. This table presents the mean and range of urban residents that are sensitive to heat (<5 and >64 years of age) and projected to be exposed to 15-day heatwaves of >42°C. The data are presented by region and for the world.
The numbers and percentages of the exposed population in low-income conditions varies with RCP-SSP combination (Figure 8). In general, the numbers of low-income populations come down over the course of the century across all SSPs among our scenarios, except in SSP3. Currently, there are approximately 644 million urban residents living, by our definition, in low-income conditions and exposed to extreme heatwaves. By the 2070–2099 period under RCP2.6-SSP1 conditions there are only 233 million low-income urban residents and of these only 76 million (range: 38–120 million) are projected to be exposed to 15-day heatwaves of >42°C (2.5% of total exposed urban residents). These numbers also are projected to be low for RCP4.5-SSP2 and RCP8.5-SSP5 by the end of the century. However, for RCP6.0-SSP3, by the 2070–2099 period, the total numbers of those in low-income conditions that are projected to be exposed to 15-day heatwaves of >42°C rises to approximately 788 million (range: 699–859 million), which accounts for 15.8% of the total exposed urban population (Table 6).
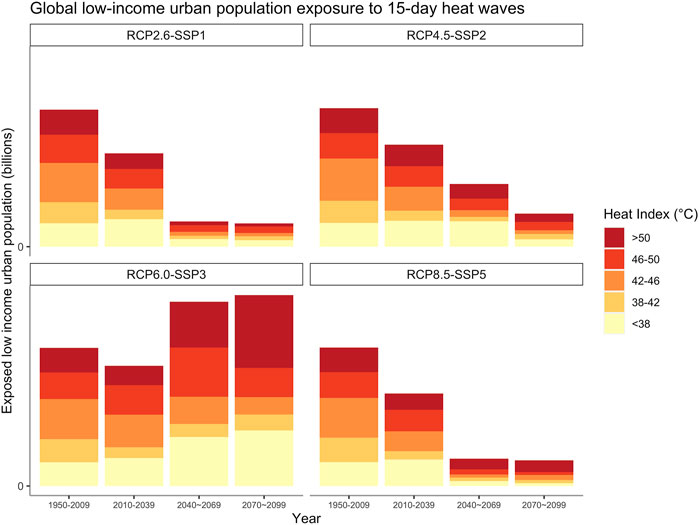
FIGURE 8. Global low-income urban population exposure to extreme heatwaves. This chart presents the mean global urban low-income population (those in countries with a GDP <$4,000 per capita) projected to be exposed to 15-day heatwaves of >42°C by RCP-SSP pairs.
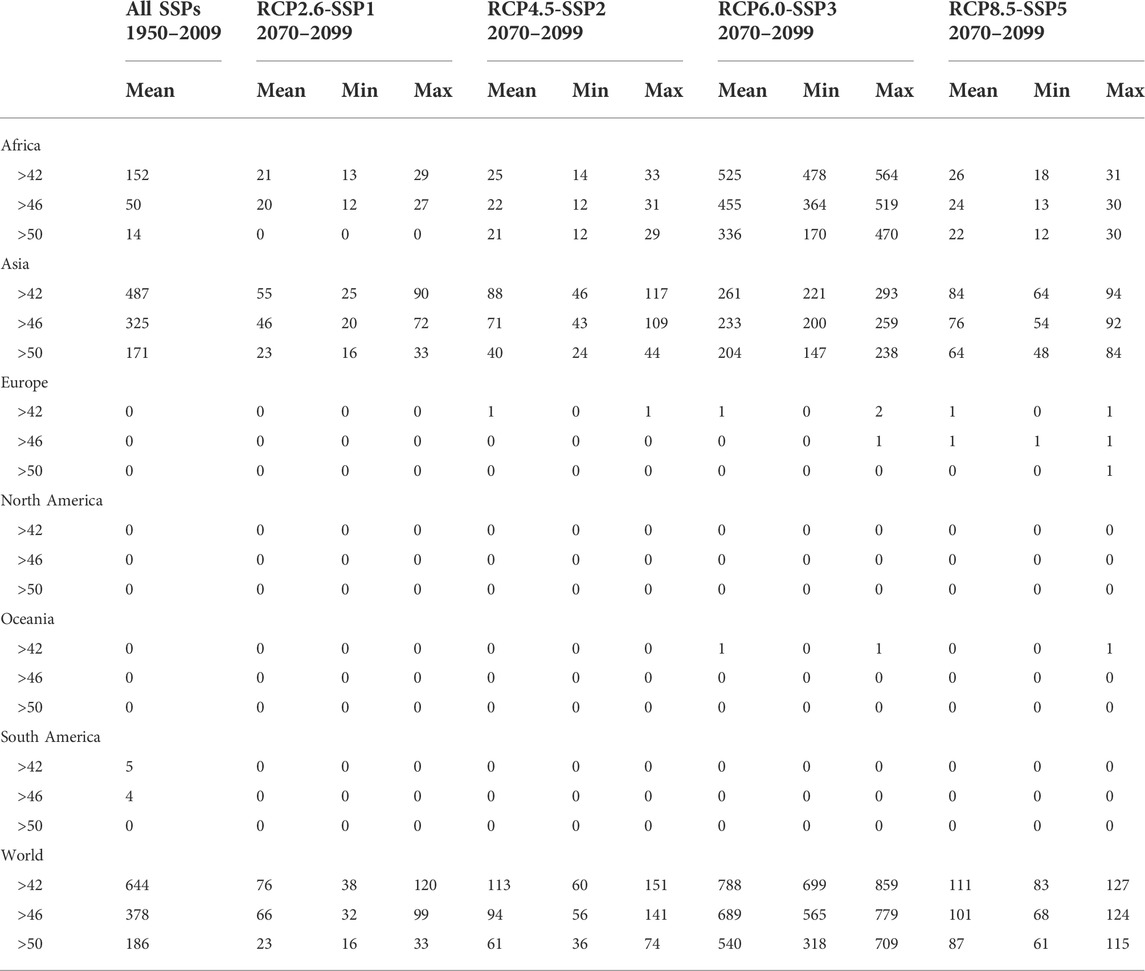
TABLE 6. Urban low-income population exposed to extreme heatwaves by region. This table presents the mean range of urban residents that are considered low-income (national GDP of <$4,000 per capita) projected to be exposed to 15-day heatwaves of >42°C. The data are presented by region and for the world.
The projected increase in heat index of extreme event 15-day heatwaves corresponds to the expected rise in global temperatures, although the intensities rise much higher than the global temperatures. For example, in RCP2.6 the expected mean heat indices for the extreme 15-day heatwaves increase from the current to the 2070–2099 period by approximately 2.1°C and the expected increase in global temperature increase for this RCP is between is 0.9–2.3°C. The projected increases in mean extreme heatwaves heat indices for RCP4.5 and RCP6.0 are 4.1°C and 5.4°C and the expected rise in global temperatures for these pathways are 1.7–3.2°C and 2.0–3.7°C, respectively. Finally, the expected rise in mean extreme 15-day heatwave for RCP8.5 from 2010 to 2,100 is 9.2°C and the expected rise in global temperature is 3.2–5.4°C (Global Carbon Project, 2015).
The projected exposure numbers to these extreme events are impressive. With such high numbers of persons exposed, we suggest several possible outcomes. First and foremost, these extreme events could be associated with high mortality and morbidity. Generally, studies have demonstrated the impact of heatwave on urban populations. Recent heatwaves in the region have accompanied heat-related deaths, mostly among children and the elderly (Diboulo et al., 2012; Russo et al., 2014; Moron et al., 2016). A review of epidemiological evidence of heatwaves in low- and middle-income countries finds positive associations between heat and human morbidity and mortality in a majority of studies (Green et al., 2019). This study also finds that the most vulnerable are the elderly, women and low-income residents. As mentioned, while there is an upper physiological limit to heat and humidity (Raymond et al., 2020), much lower heat indices, however, case havoc on populations. Populations across the world are affected at various and seemingly low temperatures (Tobias et al., 2021). What has been interesting is that MMT falls with increasing latitude suggesting those that live in the tropics have higher abilities to cope with hot weather. It seems that there is some evidence for heat adaptation over time (for a review see, Sheridan and Allen, 2018), although the time it takes to adapt is not well understood. No doubt however, that if the events presented in this paper materialize, they will accompany potential high morbidity and mortality.
The world has already experienced mass deaths from heat. Examples include the 2003 European heatwave. While in the past extreme cold has taken more lives than heat, the balance is shifting as standardized heat related deaths have been climbing in comparison to cold-related deaths (Zhao et al., 2021). Heatwaves of the magnitude projected in the study will have significant health impacts on those urban residents exposed to such conditions.
Besides the direct effects of high intensity heat, there are further cascading effects that can plague populations exposed to extreme heatwaves. A few examples included extended heat in cities is positively related to air pollution such as PM2.5 concentrations and ground level ozone formation (Zhang et al., 2017) with impacts on human respiratory systems (Sun et al., 2014). A modeling exercise in the US (2.8 million residents across Atlanta, Georgia; Detroit, Michigan; and Phoenix, Arizona) finds that a simulated compound heatwave and grid failure event of recent intensity and duration would expose between 68 and 100% of the urban population to an elevated risk of heat exhaustion and/or heat stroke (Stone et al., 2021).
With higher temperatures and the effects on both urban and rural life, there also could be increases in migration. Migration as a mitigation measure to escape the adverse effects of global warming is sometimes referred to as climate migration, or, more generally, climate mobility. Prolonged, warmer, and more frequent heatwaves affecting both urban and rural life could lead to an increase in migration, as people strive to resettle to milder climates. There are a number of reasons climate migration besides increased exposure to heatwaves (Boas et al., 2019), as a plethora of factors will influence the individual decision to migrate, including access to mitigation measures such as air conditioning, financial capacity for migration, and existing diasporas, to name but a few. Moreover, the current global legal system does not warrant asylum seeker status to anyone displaced due to global warming, be it due to a slow-onset disaster such as a prolonged drought or a sudden-onset disasters such as flooding. Existing projections of increasing numbers of so-called climate migrants (Missirian and Schlenker, 2017) therefore seem speculative. As McLeman (2018) points out, there are several thresholds that need to be crossed for a decision to migrate. Drawing the line between migration because of climate change and migration in search for better economic livelihood is difficult, especially since the effects of climate change first and foremost manifest as economic hardship among the affected populations. Current research is exploring how to integrate and explain this kind of mobility with existing work on migration theory, such as the classical Push-Pull framework (Hochleithner and Exner, 2018) or the New Economics of Labor Migration (Stark and Bloom, 1985; Eklund et al., 2016; de Sherbinin et al., 2022). Despite uncertainty, however, increased heat will impact a number of factors related to migration, including impacts on agriculture, economic productivity, energy generation and human health.
This study is one of the first to quantify the range in global urban population exposure to very warm heatwave events and locate these populations across continental regions. We hypothesized that there would be large populations exposed to heatwaves in the future and that the projected numbers would grow with increasing climate change. We find very large populations projected to be exposed to heat indices of >42°C ranging from 3.5 to over 5.1 billion by the end of the century. Our projections suggest that even under the sustainability pathway (SSP1), which is defined by socio-economic development that includes sustainability actions and fairly low levels of greenhouse gas emissions (RCP2.6), there will be large numbers of urban residents exposed to these 15-day very warm heatwaves.
As an accompanying objective, this research also attempted to identify where the largest populations exposed to heatwaves >42°C might be located. Our findings suggest that the bulk of the exposed populations are projected to reside in Southern Asian and Western and Central Africa. These are also the locations of high projected populations during the current century. However, under some scenarios (i.e., RCP8.5-SSP5), the projections suggest that there will be significant populations exposed to the heatwaves of >42°C located around the world.
This research suggests that high levels of heat will increasingly be part of city life, certainly in the tropical and sub-tropical areas, but also elsewhere. With projected increases in populations that will be sensitive to such events, it is critical for urban planners to identify strategies to mitigate impacts.
Publicly available datasets were analyzed in this study. This data can be found here: <https://www.isimip.org https://previous.iiasa.ac.at/web/home/research /researchPrograms/Energy/Databases.en.html http://www.ciesin.org http://due.esrin.esa.int/page_globcover.php.
Concept (PM, CK, BF), data collection and analysis (PM, CK, BF), manuscript writing (PM) manuscript editing (PM, CK).
The authors declare that the research was conducted in the absence of any commercial or financial relationships that could be construed as a potential conflict of interest.
All claims expressed in this article are solely those of the authors and do not necessarily represent those of their affiliated organizations, or those of the publisher, the editors and the reviewers. Any product that may be evaluated in this article, or claim that may be made by its manufacturer, is not guaranteed or endorsed by the publisher.
1See, www.epa.gov/climate-indicators
2See https://www.weather.gov/safety/heat-index.
3See https://unstats.un.org/unsd/methodology/m49
4Coupled Model Intercomparison Project Phase 5 http://cmip-pcmdi.llnl.gov/cmip5/bias corrected GCM data are available from multiple servers participating in the Earth System Grid Federation (https://esgf.llnl.gov).
Anderson, G. B., Bell, M. L., and Peng, R. D. (2013). Methods to calculate the Heat Index as an exposure metric in environmental health research. Environ. Health Perspect. 121 (10), 1111–1119. doi:10.1289/ehp.1206273
Angel, S., Parent, J., Civco, D., and Blei, A. M. (2010). The persistent decline in urban densities: Global and historical evidence of “sprawl”. Cambridge, MA: Lincoln Institute of Land Policy. Available at: https://www.lincolninst.edu/publications/working-papers/persistent-decline-urban-densities.
Angel, S., Sheppard, S. C., and Civco, D. L. (2005). The dynamics of global urban expansion, Transport and Urban Development Department. Washington, DC: The World Bank. Available at: https://nyuscholars.nyu.edu/en/publications/the-dynamics-of-global-urban-expansion.
Arnfield, A. J. (2003). Two decades of urban climate research: A review of turbulence, exchanges of energy and water, and the urban heat island. Int. J. Climatol. 23 (1), 1–26. doi:10.1002/joc.859
Balk, D. (2009). “More than a name: Why is global urban population mapping a GRUMPy proposition?,” in Global mapping of human settlements: Experiences, datasets and prospects. Editors P. Gamba, and H. Herold (Boca Raton, FL: CRC Press), 145–161. https://www.worldcat.org/title/global-mapping-of-human- settlement-experiences-datasets-and-prospects/oclc/659500536.
Beattie, L., and Haarhoff, E. (2018). Urban growth, liveability and quality urban design: Questions about the efficacy of urban planning systems in auckland, New Zealand. Contemp. Urban Aff. 2 (2), 12–23. doi:10.25034/ijcua.2018.3667
Boas, I., Farbotko, C., Adams, H., Sterly, H., Bush, S., Van der Geest, K., et al. (2019). Climate migration myths. Nat. Clim. Chang. 9 (2), 901–903. doi:10.1038/s41558-019-0633-3
Bontemps, S., Defourny, P., Van Bogaert, E., Arino, O., Kalogirou, V., and Perez, J. R. (2011). Globcover 2009 – products description and validation report. Louvain, Belgium: UC Louvain and EST. https://core.ac.uk/download/pdf/11773712.pdf.
Boyko, C. T., and Cooper, R. (2011). Clarifying and re-conceptualising density. Prog. Plan. 76 (1), 1–61. doi:10.1016/j.progress.2011.07.001
Brooks, N., Adger, W. N., and Kelly, P. M. (2005). The determinants of vulnerability and adaptive capacity at the national level and the implications for adaptation. Glob. Environ. Change 15, 151–163. doi:10.1016/j.gloenvcha.2004.12.006
Ceccherini, G., Russo, S., Ameztoy, I., Marchese, A. F., and Carmona-Moreno, C. (2017). Heat waves in Africa 1981–2015, observations and reanalysis. Nat. Hazards Earth Syst. Sci. 17, 115–125. doi:10.5194/nhess-17-115-2017
Chen, G., Li, X., Liu, X., Chen, Y., Liang, X., Leng, J., et al. (2020). Global projections of future urban land expansion under shared socioeconomic pathways. Nat. Commun. 11, 537. doi:10.1038/s41467-020-14386-x
Cheng, V. (2010). “Understanding density and high density,” in Designing high-density cities for social and environmental sustainability. Editor E. Ng (Oxfordshire, OX and New York, NY: Earthscan), 3.
Christidis, N., Jones, G. S., and Stott, P. A. (2015). Dramatically increasing chance of extremely hot summers since the 2003 European heatwave. Nat. Clim. Chang. 5 (1), 46–50. doi:10.1038/nclimate2468
Cinner, J., Adger, W. N., Allison, E. H., Barnes, M. L., Brown, K., Cohen, P. J., et al. (2018). Building adaptive capacity to climate change in tropical coastal communities. Nat. Clim. Chang. 8, 117–123. doi:10.1038/s41558-017-0065-x
Curriero, F. C., Heiner, K. S., Samet, J. M., Zeger, S. L., Strug, L., and Patz, J. A. (2002). Temperature and mortality in 11 cities of the eastern United States. Am. J. Epidemiol. 155 (1), 80–87. doi:10.1093/aje/155.1.80
D'Ippoliti, D., Michelozzi, P., Marino, C., de'Donato, F., Menne, B., Katsouyanni, K., et al. (2010). The impact of heat waves on mortality in 9 European cities: Results from the EuroHEAT project. Environ. Health 9 (1), 37. doi:10.1186/1476-069x-9-37
Dash, S. K., and Mamgain, A. (2011). Changes in the frequency of different categories of temperature extremes in India. J. Appl. Meteorol. Climatol. 50 (9), 1842–1858. doi:10.1175/2011jamc2687.1
de Sherbinin, A., Grace, K., McDermid, S., Van Der Geest, K., Puma, M. J., and Bell, A. (2022). Migration theory in climate mobility research. Front. Clim. 78. doi:10.3389/fclim.2022.882343
Diboulo, E., Sié, A., Rocklöv, J., Niamba, L., Yé, M., Bagagnan, C., et al. (2012). Weather and mortality: A 10-year retrospective analysis of the nouna health and demographic surveillance system, Burkina Faso. Glob. Health Action 5, 6–13. doi:10.3402/gha.v5i0.19078
Dosio, A., Mentaschi, L., Fischer, E. M., and Wyser, K. (2018). Extreme heat waves under 1.5 ◦C and 2 ◦C global warming. Environ. Res. Lett. 054006, 827. doi:10.1088/1748-9326/aab827
Ebi, K. L., Hallegatte, S., Kram, T., Arnell, N. W., Carter, T. R., Edmonds, J., et al. (2014). A new scenario framework for Climate Change Research: Background, process, and future directions. Clim. Change 122 (3), 363–372. doi:10.1007/s10584-013-0912-3
Eklund, L., Romankiewicz, C., Brandt, M., Doevenspeck, M., and Samimi, C. (2016). Data and methods in the environment-migration nexus: A scale perspective. DIE ERDE–Journal Geogr. Soc. Berlin 147 (2), 139–152. doi:10.12854/erde-147-10[
Erell, E., and Williamson, T. (2007). Intra-urban differences in canopy layer air temperature at a mid-latitude city. Int. J. Climatol. 27 (9), 1243. doi:10.1002/joc.1469
Ewing, R., and Cervero, R. (2010). Travel and the built environment: A synthesis. J. Am. Plan. Assoc. 76, 265. doi:10.3141/1780-10
García-León, D., Casanueva, A., Standardi, G., Burgstall, A., Flouris, A. D., and Nybo, L. (2021). Current and projected regional economic impacts of heatwaves in Europe. Nat. Commun. 12, 5807. doi:10.1038/s41467-021-26050-z
Gasparrini, A., Guo, Y., Hashizume, M., Lavigne, E., Tobias, A., Zanobetti, A., et al. (2016). Changes in susceptibility to heat during the summer: A multicountry analysis. Am. J. Epidemiol. 183 (11), 1027–1036. doi:10.1093/aje/kwv260
Global Carbon Project (2015). Global carbon budget Earth system science data. Availabelat: https://www.globalcarbonproject.org/carbonbudget/archive.htm.
Gornig, M., and Goebel, J. (2016). Deindustrialisation and the polarisation of household incomes: The example of urban agglomerations in Germany. Urban Stud. 55, 790–806. doi:10.1177/0042098016669285
Green, H., Bailey, J., Schwarz, L., Vanos, J., Ebi, K., and Benmarhnia, T. (2019). Impact of heat on mortality and morbidity in low and middle income countries: A review of the epidemiological evidence and considerations for future research. Environ. Res. 171, 80–91. doi:10.1016/j.envres.2019.01.010
Güneralp, B., Zhou, Y., Ürge-Vorsatz, D., Gupta, M., Yu, S., Patel, P. L., et al. (2017). Global scenarios of urban density and its impacts on building energy use through 2050. Proc. Natl. Acad. Sci. U. S. A. 114 (34), 8945. doi:10.1073/pnas.1606035114
Hausfather, Z., and Peters, G. P. (2020). Emissions – The ‘business as usual’ story is misleading. Nature 577, 618. doi:10.1038/d41586-020-00177-3
Hempel, S., Frieler, K., Warszawski, L., Schewe, J., and Piontek, F. (2013). A trend-preserving bias correction – The ISI-mip approach. Earth Syst. Dyn. 4 (1), 219–236. doi:10.5194/esd-4-219-2013,
Hochleithner, S., and Exner, A. (2018). Theories of migration in and from rural sub-saharan Africa: Review and critique of current literature, Swedish international centre for local democracy (ICLD). Available at: https://icld.se/app/uploads/files/wp14-theories-of-migration-2018-published.pdf.
Hoegh-Guldberg, O., Jacob, D., Taylor, M., Bindi, M., Brown, S., and Camilloni, I. (2018). “& al., eImpacts of 1.5°C global warming on natural and human systems,” in An IPCC special report on the impacts of global warming of 1.5°C above pre-industrial levels and related global greenhouse gas emission pathways, in the context of strengthening the global response to the threat of climate change Global warming of 1.5°C. Editors Masson-DelmotteV., P. Zhai, H.-O. Portner, D. Roberts, J. Skea, P. R. Shuklaet al. 175–311. https://www.ipcc.ch/sr15/chapter/chapter-3/
Hoornweg, D., and Pope, K. (2016). Population predictions for the world's largest cities in the 21st century. Environ. Urban. 29 (1), 195. doi:10.1177/0956247816663557
Horton, R. M., Mankin, J. S., Lesk, C., Coffel, E., and Raymond, C. (2016). A review of recent advances in research on extreme heat events. Curr. Clim. Change Rep. 2 (4), 242–259. doi:10.1007/s40641-016-0042-x
Howard, L. (1818). “The climate of london, deduced from meteorological observations made at different places in the neighborhood of the metropolis, in two volumes,”. Editor W. Phillips. George Yard.
Hoy, C. (2016). Projecting national poverty to 2030. London: ODI. https://cdn.odi.org/media/documents/10355.pdf.
Huang, K., Li, X., Liu, X., and Seto, K. C. (2019). Projecting global urban land expansion and heat island intensification through 2050. Environ. Res. Lett. 14, 114037. doi:10.1088/1748-9326/ab4b71
Huebler, M., Klepper, G., and Peterson, S. (2007). Costs of climate change.” in The effects of rising temperatures on health and productivity in Germany, Kiel Institute for the World Economy.doi:10.1016/j.ecolecon.2008.04.010
IPCC (Ed (2012). Managing the risks of extreme events and disasters to advance climate change adaptatio: Cambridge and New York, NY: Cambridge University Press. https://www.ipcc.ch/report/managing-the-risks-of-extreme-events-and-disasters-to -advance-climate-change-adaptation/.
IPCC. (2013). Climate change 2013: The Physical Science Basis.” in Contribution of working group I to the fifth assessment report of the intergovernmental panel on climate change. Editors T. F. Stocker, D. Qin, G.-K. Plattner, M. Tignor, S. K. Allen, J. Boschunget al. (Chichester and New York, NY: Cambridge University Press). https://www.ipcc.ch/report/ar5/wg1/.
IPCC. (2014). Climate change 2014: Impacts, adaptation, and vulnerability. Part A: Global and sectoral aspects. Contribution of working group II to the fifth assessment report of the intergovernmental panel on climate change. Editors C. B. Field, V. R. Barros, D. J. Dokken, K. J. Mach, M. D. Mastrandrea, T. E. Biliret al. : Summary for policymakers Cambridge University Press).
IPCC. (2018). Global Warming of 1.5°C. An IPCC Special Report on the impacts of global warming of 1.5°C above pre-industrial levels and related global greenhouse gas emission pathways, in the context of strengthening the global response to the threat of climate change, sustainable development, and efforts to eradicate poverty. Editors V. Masson-Delmotte, P. P.Zhai, H.-O. Pörtner, D. Roberts, J. Skea, P. R. Shuklaet al. (Cambridge and New York, NY: Cambridge University Press). https://www.ipcc.ch/sr15/.
Jiang, L., and O’Neill, B. C. (2017). Global urbanization projections for the shared socioeconomic pathways. Glob. Environ. Change 42, 193–199. doi:10.1016/j.gloenvcha.2015.03.008
Kc, S., and Lutz, W. (2017). The human core of the Shared Socioeconomic Pathways: Population scenarios by age, sex and level of education for all countries to 2100. Glob. Environ. Change 42 , 181–192. doi:10.1016/j.gloenvcha.2014.06.004
Kelly, P. M., and Adger, W. N. (2000). Theory and practice in assessing vulnerability to climate change and facilitating adaptation. Clim. Change 47, 325–352. doi:10.1023/a:1005627828199
Kjellstrom, T. (2016). Impact of climate conditions on occupational health and related economic losses: A new feature of global and urban health in the context of climate change. Asia Pac. J. Public Health 28, 28S–37S. doi:10.1177/1010539514568711
Klepeis, N. E., Nelson, W. C., Ott, W. R., Robinson, J. P., Tsang, A. M., Switzer, P., et al. (2001). The national human activity pattern survey (NHAPS): A resource for assessing exposure to environmental pollutants. J. Expo. Sci. Environ. Epidemiol. 11, 231. doi:10.1038/sj.jea.7500165
Kornhuber, K., Coumou, D., Vogel, E., Lesk, C., Donges, J. F., Lehmann, J., et al. (2020). Amplified Rossby waves enhance risk of concurrent heatwaves in major breadbasket regions. Nat. Clim. Chang. 10, 48–53. doi:10.1038/s41558-019-0637-z
Kovats, R. S., and Hajat, S. (2008). Heat stress and public health: A critical review. Annu. Rev. Public Health 29, 41–55. doi:10.1146/annurev.publhealth.29.020907.090843
Kriegler, E., Edmonds, J., Hallegatte, S., Ebi, K. L., Kram, T., Riahi, K., et al. (2014). A new scenario framework for climate change research: The concept of shared climate policy assumptions. Clim. Change 122 (3), 401–414. doi:10.1007/s10584-013-0971-5
Li, M., Gu, S., Bi, P., Yang, J., and Liu, Q. (2015). Heat waves and morbidity: Current knowledge and further direction-A comprehensive literature review. Int. J. Environ. Res. Public Health 12 (5), 5256–5283. doi:10.3390/ijerph120505256
Lobell, D. B., and Field, C. B. (2007). Global scale climate–crop yield relationships and the impacts of recent warming. Environ. Res. Lett. 01400, 014002–019326. doi:10.1088/1748-9326/2/1/014002
Luu, T. H., Rojas-Arias, J.-C., and Laffly, D. (2021). The impacts of urban morphology on housing indoor thermal condition in hoi an city, vietnam. J. Contemp. Urban Aff. 5 (2), 183–196. doi:10.25034/ijcua.2021.v5n2-4
Makrogiannis, T., Santamouris, M., Papanikolaou, N., Koronaki, I., Tselepidaki, I., and Assimakopoulos, D. (1998). The Athens urban climate experiment - temperature distribution. ACTA Univ. Lodz. Folia Geogr. Phys. 3, 33
Manoli, G., Fatichi, S., Schlapfer, M., Yu, K., Crowther, T. W., Meili, N., et al. (2019). Magnitude of urban heat islands largely explained by climate and population. Nature 573, 55. doi:10.1038/s41586-019-1512-9
Marcotullio, P. J., Kessler, C., and Fekete, B. (2020). “Future megacity-regions and heatwave exposure,” in Handbook of megacities and megacity-regions. Editors D. Labbé, and A. Sorensen (Cheltenham and Northampton, MA: Edward Elgar Publishing, Inc), 309.
Marcotullio, P. J., Kessler, C., and Fekete, B. (2021). The future urban heat-wave challenge in Africa: Exploratory analysis. Glob. Environ. Change 66, 102190. doi:10.1016/j.gloenvcha.2020.102190
Marcotullio, P. J., and Schmeltz, M. (2021). Future heat risk in South Asia and the need for ecosystem mitigation.” in Ecosystem-based disaster and climate risk resilience, integration of blue-green infrastructure in sustainable development. Editors M. Mukerjee, and R. Shaw (Springer), 225
Matthews, T. K. R., Wilby, R. L., and Murphy, C. (2017). Communicating the deadly consequences of global warming for human heat stress. Proc. Natl. Acad. Sci. U. S. A. 114 (15), 3861–3866. doi:10.1073/pnas.1617526114
McEvoy, D., Ahmed, I., and Mullett, J. (2012). The impact of the 2009 heat wave on Melbourne’s critical infrastructure. Local Environ. 17, 783–796. doi:10.1080/13549839.2012.678320
McKendry, I. G. (2003). Applied climatology. Prog. Phys. Geogr. Earth Environ. 27 (4), 597–606. doi:10.1191/0309133303pp397pr
McLeman, R. (2018). Thresholds in climate migration. Popul. Environ. 39 (4), 319–338. doi:10.1007/s11111-017-0290-2
Meehl, G. A., and Tebaldi, C. (2004). More intense, more frequent, and longer lasting heat waves in the 21st century. Science 305 (5686), 994–997. doi:10.1126/science.1098704
Mishra, V., Ganguly, A. R., Nijssen, B., and Lettenmaier, D. P. (2015). Changes in observed climate extremes in global urban areas. Environ. Res. Lett. 10. doi:10.1088/1748–9326/10/2/024005
Mishra, V., Mukherjee, S., Kumar, R., and Stone, D. A. (2017). Heat wave exposure in India in current, 1.5 ◦C, and 2.0 ◦C worlds. Environ. Res. Lett. 12 (12), 124012. doi:10.1088/1748-9326/aa9388
Missirian, A., and Schlenker, W. (2017). Asylum applications respond to temperature fluctuations. Science 358 (6370), 1610–1614. doi:10.1126/science.aao0432
Mogul, R., Mitra, E., Suri, M., and Saifi, S. (2022). India and Pakistan heatwave is ‘testing the limits of human survivability,' expert says, CNN. Available at: https://www.cnn.com/2022/05/02/asia/india-pakistan-heatwave-climate-intl-hnk/index.html.
Mora, C., Dousset, B., Caldwell, I. R., Powell, F. E., Geronimo, R. C., Bielecki, C. R., et al. (2017). Global risk of deadly heat. Nat. Clim. Chang. 7 (7), 501–506. doi:10.1038/nclimate3322
Moron, V., Oueslati, B., Pohl, B., Rome, S., and Janicot, S. (2016). Trends of mean temperatures and warm extremes in northern tropical Africa (1961–2014) from observed and PPCA reconstructed time series. J. Geophys. Res. Atmos. 121, 5298–5319. doi:10.1002/2015jd024303
Moss, R., Babiker, W., Brinkman, S., Calvo, E., Carter, T., Edmonds, J., et al. (2008). Towards new scenarios for analysis of emissions, climate change, impacts, and response strategies. Noordwijkerhout, Netherlands: Technical summary. Intergovernmental panel on climate change. https://library.wmo.int/?lvl=notice_display&id=296#.YzNXMy-B0h4.
Murari, K. K., and Ghosh, S. (2019). Future heat wave projections and impacts.” in Climate change signals and response A strategic knowledge compendium for India. Editors C. Venkataraman, T. Mishra, S. Ghosh, and S. Karmakar (Springer), 91–108. doi:10.1007/978-981-13-0280-0
Newman, P., and Kenworthy, J. (1999). Sustainability and cities: Overcoming automobile dependence. Washington, DC: Island Press.
O’Brien, K., Eriksen, S., Nygaard, L. P., and Schjolden, A. (2009). Why different interpretations of vulnerability matter in climate change discourses. Clim. Policy 7, 73–88. doi:10.1080/14693062.2007.9685639
Oke, T. R. (1997). “Urban Climates and Global Environmental Change,” in Applied Climatology: Principles and Practice. Editors A. Perry, and R. D. Thompson (London: Routledge), 273–287.
Oke, T. R., Mills, G., Christen, A., and Voogt, J. A. (2017). Urban climates. Cambridge University Press. doi:10.1017/9781139016476
O’Neill, B. C., Tebaldi, C., Vuuren, D., Eyring, V., Friedlingstein, P., Hurtt, G., et al. (2016). The scenario model Intercomparison project (ScenarioMIP) for CMIP6. Geosci. Model. Dev. 9, 3461–3482. doi:10.5194/gmd-9-3461-2016
Pai, D. S., Srivastava, A. K., and Nair, S. A. (2017). Heat and cold waves over India.” in Observed climate variability and change over the Indian region. Editors M. N. Rajeevan, and S. Nayak (Springer), 51.
Pal, J. S., and Eltahir, E. A. B. (2015). Future temperature in southwest Asia projected to exceed a threshold for human adaptability. Nat. Clim. Chang. 6 (2), 197–200. doi:10.1038/nclimate2833
Panda, D. K., Kouchak, A. A., and Ambast, S. K. (2017). Increasing heat waves and warm spells in India, observed from a multiaspect framework. J. Geophys. Res. Atmos. 122 (7), 3837–3858. doi:10.1002/2016jd026292
Patz, J. A., Campbell-Lendrum, D., Holloway, T., and Foley, J. A. (2005). Impact of regional climate change on human health. Nature 438, 310–317. doi:10.1038/nature04188
Perkins, S. E. (2015). A review on the scientific understanding of heatwaves—their measurement, driving mechanisms, and changes at the global scale. Atmos. Res. 164, 242–267. doi:10.1016/j.atmosres.2015.05.014
Perkins, S. E., Alexander, L. V., and Nairn, J. R. (2012). Increasing frequency, intensity and duration of observed global heatwaves and warm spells. Geophys. Res. Lett. 39, 53361. doi:10.1029/2012GL053361
Perkins-Kirkpatrick, S. E., and Lewis, S. C. (2020). Increasing trends in regional heatwaves. Nat. Commun. 11, 3357. doi:10.1038/s41467-020-16970-7
Petkova, E. P., Gasparrini, A., and Kinney, P. L. (2015). Heat and mortality in New York city since the beginning of the 20th century. Epidemiology 25, 554–560. doi:10.1097/ede.0000000000000123
Pörtner, H.-O., Roberts, D. C., Adams, H., Adler, C., Aldunce, P., Ali, E., et al. (2022). in Climate change 2022: Impacts, adaptation, and vulnerability. Contribution of working group II to the sixth assessment report of the intergovernmental panel on climate change. Editors H.-O. Pörtner, D. C. Roberts, E. S. Poloczanska, K. Mintenbeck, M. Tignor, A. Alegríaet al. (Cambridge, UK: Summary for policy makers). https://www.ipcc.ch/report/sixth-assessment-report-working-group-ii/.
Rahmstorf, S., and Coumou, D. (2011). Increase of extreme events in a warming world. Proc. Natl. Acad. Sci. U. S. A. 108 (44), 17905–17909. doi:10.1073/pnas.1101766108
Rao, K. K., Kumar, V. L., Kulkarni, A., Ho, C. H., Mahendranath, B., Desamsetti, S., et al. (2020). Ho, c. H., Mahendranath, B., Desamsetti, S., patwardhan, S., Dandi, A. R., Barbosa, H., & Sabade, Sprojections of heat stress and associated work performance over India in response to global warming. Sci. Rep. 10, 16675. doi:10.1038/s41598-020-73245-3
Raymond, C., Matthews, T., and Horton, R. M. (2020). The emergence of heat and humidity too severe for human tolerance. Sci. Adv. 6, eaaw1838. doi:10.1126/sciadv.aaw1838
Riahi, K., Kriegler, E., Edmonds, J., O’Neill, B. C., Fujimori, S., et al. (2017). The Shared Socioeconomic Pathways and their energy, land use, and greenhouse gas emissions implications: An Overview. Glob. Environ. Change 42, 153–168. doi:10.1016/j.gloenvcha.2016.05.009
Rogelj, J., Popp, A., Calvin, K. V., Luderer, G., Emmerling, J., Gernaat, D., et al. (2018). Scenarios towards limiting global mean temperature increase below 1.5 °C. Nat. Clim. Chang. 8, 325–332. doi:10.1038/s41558-018-0091-3
Rogers, C. D. W., Ting, M., Li, C., Kornhuber, K., Coffel, E. D., Horton, R. M., et al. (2021). Recent increases in exposure to extreme humid-heat events disproportionately affect populated regions. Geophys. Res. Lett. 48, e2021GL094183. doi:10.1029/2021gl094183
Rohini, P., Rajeevan, M., and Srivastava, A. K. (2016). On the variability and increasing trends of heat waves over India. Sci. Rep. 6, 26153. doi:10.1038/srep26153
Roth, M. (2007). Review of urban climate research in (sub)tropical regions. Int. J. Climatol. 27 (14), 1859–1873. doi:10.1002/joc.1591
Rothfusz, L. P. (1990). The heat index “equation” (or, more than you ever wanted to know about heat index), national oceanic and atmospheric administration, national weather Service. Fort Worth, TX: NWS Southern Region Headquarters. https://www.weather.gov/media/ffc/ta_htindx.PDF.
Roy, J., Chakrabarti, A., and Mukhopadhyay, K. (2011). Climate change, heat stress and loss of labor productivity: A method for estimation. Kolkata: Jadavpur University.
Rubbelke, D., and Vogele, S. (2011). Impacts of climate change on European critical infrastructures: The case of the power sector. Environ. Sci. Policy 14, 53. doi:10.1016/j.envsci.2010.10.007
Russo, S., Dosio, A., Graversen, R. G., Sillmann, J., Carrao, H., Dunbar, M. B., et al. (2014). Magnitude of extreme heat waves in present climate and their projection in a warming world. J. Geophys. Res. Atmos. 119 (22), 12500–12512. doi:10.1002/2014jd022098
Santamouris, M. (2015). Analyzing the heat island magnitude and characteristics in one hundred Asian and Australian cities and regions. Sci. Total Environ. 512-513, 582–598. doi:10.1016/j.scitotenv.2015.01.060
Schneider, A., Friedl, M. A., and Potere, D. (2009). A new map of global urban extent from MODIS satellite data. Environ. Res. Lett. 4, 044003. doi:10.1088/1748-9326/4/4/044003
Seneviratne, S. I., Donat, M. G., Pitman, A. J., Knutti, R., and Wilby, R. L. (2016). Allowable CO2 emissions based on regional and impact-related climate targets. Nature 529 (7587), 477–483. doi:10.1038/nature16542
Seto, K. C., Güneralp, B., and Hutyra, L. (2012). Global forecasts of urban expansion to 2030 and direct impacts on biodiversity and carbon pools. Proc. Natl. Acad. Sci. U. S. A. 109 (40), 16083–16088. doi:10.1073/pnas.1211658109
Shastri, H., Barik, B., Ghosh, S., Venkataraman, C., and Sadavarte, P. (2017). Flip flop of day-night and summer-winter surface urban heat island intensity in India. Sci. Rep. 7 (1), 40178. doi:10.1038/srep40178
Sheridan, S. C., and Allen, M. J. (2018). Temporal trends in human vulnerability to excessive heat. Environ. Res. Lett. 043001, 043001. doi:10.1088/1748-9326/aab214
Sherwood, S. C., Huber, M., and Emanuel, K. A. (2010). An adaptability limit to climate change due to heat stress. Proc. Natl. Acad. Sci. U. S. A. 107 (21), 9552–9555. doi:10.1073/pnas.0913352107
Smit, B., Pilifosova, O., Burton, I., Challenger, B., Huq, S., Klein, R. J. T., et al. (2001). “Climate Change 2001: Adaptation to climate change in the context of sustainable development and equity,” in Impact, adaptation and vulnerability. Editors J. J. Mccarthy, O. F. Canziani, N. A. Leary, D. J. Dokken, and K. S. White (Cambridge: Cambridge University Press). https://www.ipcc.ch/report/ar3/wg2/chapter-18-adaptation-to-climate- change-in-the-context-of-sustainable-development-and-equity/.
Soergel, B., Kriegler, E., Weindl, I., Rauner, S., Dirnaichner, A., Ruhe, C., et al. (2021). A sustainable development pathway for climate action within the UN 2030 Agenda. Nat. Clim. Chang. 11, 656–664. doi:10.1038/s41558-021-01098-3
Stark, O., and Bloom, D. E. (1985). The new economics of labor migration. Am. Econ. Rev. 75, 173–178. https://www.jstor.org/stable/1805591.
Steadman, R. G. (1979a). The assessment of sultriness. Part I: A temperature-humidity index based on human physiology and clothing science. J. Appl. Meteor. 18 (7), 861–873. doi:10.1175/1520-0450(1979)018<0861:taospi>2.0.co;2
Steadman, R. G. (1979b). The assessment of sultriness. Part II: Effects of wind, extra radiation and barometric pressure on apparent temperature. J. Appl. Meteor. 18 (7), 874–885. doi:10.1175/1520-0450(1979)018<0874:taospi>2.0.co;
Stone, B. (2012). The city and the coming climate: Climate change in the places we live. New York, NY: Cambridge University Press.
Stone, B., Hess, J. J., and Frumkin, H. (2010). Urban form and extreme heat events: Are sprawling cities more vulnerable to climate change than compact cities? Environ. Health Perspect. 118 (10), 1425–1428. doi:10.1289/ehp.0901879
Stone, B., Mallen, E., Rajput, M., Gronlund, C. J., Broadbent, A. M., Krayenhoff, E. S., et al. (2021). Compound climate and infrastructure events: How electrical grid failure alters heat wave risk. Environ. Sci. Technol. 55, 6957–6964. doi:10.1021/acs.est.1c00024
Sun, Y., Zhang, X., Zwiers, F. W., Song, L., Wan, H., Hu, T., et al. (2014). Rapid increase in the risk of extreme summer heat in Eastern China. Nat. Clim. Chang. 4 (12), 1082–1085. doi:10.1038/nclimate2410
Thornton, P. K., van de Steeg, J., Notenbaert, A., and Herrero, M. T. (2009). The impacts of climate change on livestock and livestock systems in developing countries: A review of what we know and what we need to know. Agric. Syst. 101, 113–127. doi:10.1016/j.agsy.2009.05.002
Timberlake, M., Sanderson, M. R., Ma, X., Derudder, B., Winitzky, J., and Witlox, F. (2012). Testing a global city hypothesis: An assessment of polarization across US cities. City Community 11, 74–93. doi:10.1111/j.1540-6040.2011.01394.x
Tobias, A., Hashizume, M., Honda, Y., Sera, F., Ng, C. F. S., Kim, Y., et al. (2021). Geographical variations of the minimum mortality temperature at a global scale. Environ. Epidemiol. 5, e169. doi:10.1097/ee9.0000000000000169
Tran, H., Uchihama, D., Ochi, S., and Yasuoka, Y. (2006). Assessment with satellite data of the urban heat island effects in Asian mega cities. Int. J. Appl. Earth Observation Geoinformation 8 (1), 34–48. doi:10.1016/j.jag.2005.05.003
Tuholske, C., Caylor, K., Funk, C., Verdin, A., Sweeney, S., Grace, K., et al. (2021). Global urban population exposure to extreme heat. Proc. Natl. Acad. Sci. U. S. A. 118 (41), e2024792118. doi:10.1073/pnas.2024792118
UN. (2022). World population prospects, 2022 revision. New York, USA: United Nations, Department of Economic and Social Affairs. Available at: https://population.un.org/wpp/.
UN. (2018). World urbanization prospects, 2018 revision.” in Department of economic and social affairs. New York, USA: United Nations. Available at: https://esa.un.org/unpd/wup/.
van Vuuren, D. P., Edmonds, J., Kainuma, M., Riahi, K., Thomson, A., Hibbard, K., et al. (2011). The representative concentration pathways: An overview. Clim. Change 109 (1-2), 5–31. doi:10.1007/s10584-011-0148-z
van Vuuren, D. J., Kriegler, E., O’Neill, B. C., Ebi, K. L., Riahi, K., Carter, T. R., et al. (2014). A new scenario framework for climate change research: Scenario matrix architecture. Clim. Change 122 (3), 373–386. doi:10.1007/s10584-013-0906-1
Voogt, J. (2002). “Urban heat island,” in Encyclopedia of global environmental change, volume III causes and consequences of global environmental change. Editors I. Douglas, and T. Munn (Chichester and New York, NY: John Wiley & Sons), 660
Wang, Y., and Hu, F. (2006). Variations of the urban heat island in summer of the recent 10 years over Beijing and its environment effects. Chin. J. Geophys. 49 (1), 59–67. doi:10.1002/cjg2.812
Warszawski, L., Frieler, K., Huber, V., Piontek, F., Serdeczny, O., and Schewe, J. (2014). The inter-sectoral impact model Intercomparison project (ISI-mip): Project framework. Proc. Natl. Acad. Sci. U. S. A. 111 (9), 3228–3232. doi:10.1073/pnas.1312330110
Westerling, A. L., Hidalgo, H. G., Cayan, D. R., and Swetnam, T. W. (2006). Warming and earlier spring increase Western US forest wildfire activity. Science 313, 940–943. doi:10.1126/science.1128834
Wheeler, S. M. (2015). Built landscapes of metropolitan regions: An international typology. J. Am. Plan. Assoc. 81 (3), 167–190. doi:10.1080/01944363.2015.1081567
World Bank (2021). DataBank, World Bank indicators. Available at: https://databank.worldbank.org/source/world-development-indicators.
Xu, Z., FitzGerald, G., Guo, Y., Jalaludin, B., and Tong, S. (2016). Impact of heatwave on mortality under different heatwave definitions: A systematic review and meta-analysis. Environ. Int. 89 (90), 193–203. doi:10.1016/j.envint.2016.02.007
Yohe, G., and Tol, R. S. J. (2002). Indicators for social and economic coping capacity - moving toward a working definition of adaptive capacity. Glob. Environ. Change 12, 25–40. doi:10.1016/s0959-3780(01)00026-7
Zhang, H., Wang, Y., Park, T. W., and Deng, Y. (2017). Quantifying the relationship between extreme air pollution events and extreme weather events. Atmos. Res. 188, 64–79. doi:10.1016/j.atmosres.2016.11.010
Zhao, Q., Guo, Y., Ye, T., Gasparrini, A., Tong, S., Overcenco, A., et al. (2021). Global, regional, and national burden of mortality associated with non-optimal ambient temperatures from 2000 to 2019: A three-stage modelling study. Lancet Planet. Health 5, e415–e425. doi:10.1016/s2542-5196(21)00081-4
Keywords: urban, heat wave, climate change, exposure, scenarios
Citation: Marcotullio PJ, Keßler C and Fekete BM (2022) Global urban exposure projections to extreme heatwaves. Front. Built Environ. 8:947496. doi: 10.3389/fbuil.2022.947496
Received: 18 May 2022; Accepted: 04 October 2022;
Published: 31 October 2022.
Edited by:
Mahua Mukherjee, Indian Institute of Technology Roorkee, IndiaReviewed by:
Kazuaki Tsuchiya, National Institute for Environmental Studies (NIES), JapanCopyright © 2022 Marcotullio, Keßler and Fekete. This is an open-access article distributed under the terms of the Creative Commons Attribution License (CC BY). The use, distribution or reproduction in other forums is permitted, provided the original author(s) and the copyright owner(s) are credited and that the original publication in this journal is cited, in accordance with accepted academic practice. No use, distribution or reproduction is permitted which does not comply with these terms.
*Correspondence: Peter J. Marcotullio, cGV0ZXIubWFyY290dWxsaW9AaHVudGVyLmN1bnkuZWR1
Disclaimer: All claims expressed in this article are solely those of the authors and do not necessarily represent those of their affiliated organizations, or those of the publisher, the editors and the reviewers. Any product that may be evaluated in this article or claim that may be made by its manufacturer is not guaranteed or endorsed by the publisher.
Research integrity at Frontiers
Learn more about the work of our research integrity team to safeguard the quality of each article we publish.