 Leigh A. Provost
 Eve R. Eisemann
 Carlton P. Anderson3
94% of researchers rate our articles as excellent or good
Learn more about the work of our research integrity team to safeguard the quality of each article we publish.
Find out more
ORIGINAL RESEARCH article
Front. Built Environ., 26 October 2022
Sec. Coastal and Offshore Engineering
Volume 8 - 2022 | https://doi.org/10.3389/fbuil.2022.907608
This article is part of the Research TopicNatural and Nature-Based Features for Flood Risk ManagementView all 17 articles
Natural and nature-based features have become increasingly popular in recent years for several reasons including reduced costs and maintenance, sustainability, and ecological benefits. One such nature-based feature which contributes to coastal resiliency is dune systems. Extensive research shows that dune systems provide great value for coastal protection, with vegetation and belowground biomass emerging as crucial factors for dune stability. Alternative dune construction and dune maintenance methods are needed to improve the resilience and stability of these dune systems. Wrack, vegetation and macroalgae that naturally washes up along the coast, is often removed during routine beach maintenance, but could serve to increase dune biomass, sand trapping, and overall dune resiliency. This manuscript documents preliminary results following the placement of wrack along constructed dunes on the Mississippi mainland coast. Terrestrial lidar surveys were used to evaluate morphological responses of a 550 m stretch of the beach, with varying raking and wrack management practices implemented in designated sections. Elevation and volumetric change calculated from these data were compared across storm erosion and fair-weather recovery periods to quantify the potential benefits of utilizing natural wrack material in the dunes and reducing beach raking.
• A net volume increase over the entire study period was only observed in the ramp morphologic region of the ungroomed zone and the ungroomed and wrack-treated zone. Although volume was lost from the dunes in all zones, the greatest net volume loss was observed in the dune of the control zone.
• Major events that brought the highest water levels, Hurricane Zeta and Hurricane Ida, contributed to large volume loss across all zones, but the ungroomed and wrack-treated dune remained intact, and the dune toe remained stable throughout the entire study period. In contrast, both the control and ungroomed dune were flattened after Hurricane Ida.
• Through the unprecedented 2020 hurricane season, all storms caused notable volume changes, but not all storms caused net erosion. The response is complicated, suggesting that some events even lead to significant net deposition, particularly on the berm. The relatively minor events even contributed volume to the dunes in some cases. This variability is largely attributed to differences in wind and wave dynamics, but given limited data availability within the region, such direct comparisons could not be made.
Increased emphasis is being placed on utilizing natural and nature-based features (NNBF) as a means for improving flood-risk protection both in coastal and inland environments. Beach dunes are a primary example of one such feature that can provide protection from coastal flooding (Borsje et al., 2011). Coastal dunes have a storied history in their importance to the coast both ecologically, and from a flood-risk perspective. By acting as a physical barrier, dunes provide protection from inundation and wave action (Hanley et al., 2014). As the frequency and intensity of tropical storm events continue to increase, utilizing these natural features advantageously is critical.
One such area of specific need for coastal resiliency is the United States Gulf Coast. The Gulf Coast has a history of being subject to severe storm events. From 2010 to 2020, the Gulf Coast from the southernmost point of Texas through the Florida Keys, experienced roughly 30 tropical events, a third of which occurred in 2020 (NOAA, 2022). Of these storms, 2 made direct landfall on the Mississippi coastline, while others, though not direct hits, caused storm surge and large waves in the area. Tropical Storm Cristobal, which made landfall in Louisiana June 7th of 2020, contributed as much as 1.88 m of storm surge to some Louisiana locations. In Mississippi, a peak water level of 1.74 m MHHW was recorded at Bay Waveland Yacht Club (Berg, 2021).
Harrison County, Mississippi, is located along the Mississippi coast, with undeveloped barrier islands (Gulf Islands National Seashore) > 10 km offshore of the populated mainland coast. The focus of this study is the populated mainland coast, stretching along the Mississippi Sound. The Mississippi Sound is a protected, shallow (1–3 m deep) estuary between the mainland and the barrier islands (Blumberg et al., 2001; Byrnes et al., 2013). The wave climate on the outer barrier islands is low-energy, with modeled wave transformations indicating breaking wave heights less than 0.6 m, leaving the Mississippi Sound behind these islands exposed to very minimal wave energy (Cipriani & Stone, 2001). Under these conditions, Harrison County mainland coastline, along with the rest of the mainland Mississippi coast, is naturally a muddy, shallow-sloped coastline, fringed by marsh. This is evidenced by the few remaining unaltered sections of coast (e.g., the Hancock County Marsh Coastal Preserve, and the Grand Bay National Estuarine Research Reserve, Figure 1).
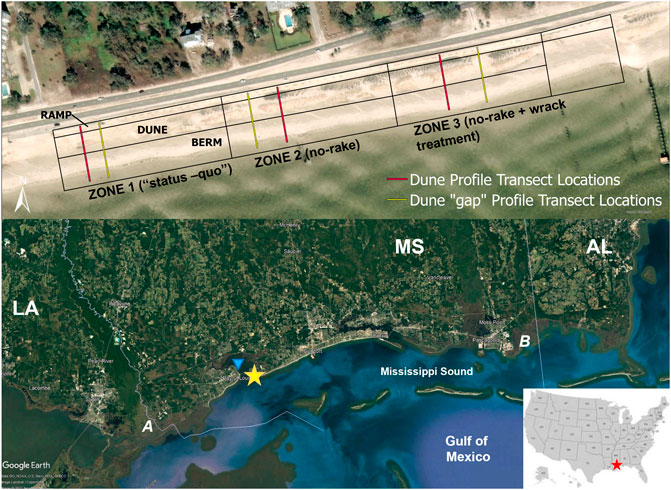
FIGURE 1. (Top): Study area polygon, broken down by geomorphologic region (ramp, dune, berm) and zone, with transect locations shown in yellow. (Bottom): Satellite image showing the location of study area as a yellow star. The NOAA water level station is indicated by the blue triangle. A indicates Hancock County Marsh Coastal Preserve and B indicates Grand Bay National Estuarine Research Reserve. The small inset map shows the location of this region relative to the United States.
In the 1920s, a seawall was constructed along the Hancock and Harrison County mainland shoreline (Schmid, 2002) and beach sand was placed sound-ward of the seawall beginning in 1967 (Hancock County Historical Society, 2022). As the wave energy is too low to naturally produce sandy beaches along the mainland MS coast, the only sand source is nourishment, and sand loss occurs via hydrodynamic processes during erosive events and via aeolian transport as material is blown further landward. Samples taken from the berm in November 2020 showed a D50 of 0.61–0.67 mm (coarse sand), with the finer fraction likely being blown on to the dunes or lost on to the road that lies landward of the seawall. Thus, the area must be periodically re-nourished to maintain beach width.
Tropical cyclones frequently impact the Mississippi Coast, with an average return period of 11 years for all hurricanes and 26 years for major hurricanes within 50 nautical miles of the Mississippi coast (NOAA, 2020). In the past five hurricane seasons (2016–2021), five named storms have impacted within this radius, far exceeding the average return period (NOAA, 2022). Several major Hurricanes have heavily damaged the beaches and seawall of Hancock and Harrison Counties in recorded history, including Hurricane Camille in 1969 and most recently Hurricane Katrina in 2005. Following Katrina, the beach was re-nourished along Hancock and Harrison Counties and dune features were created and planted with dune grasses as part of the Mississippi Coastal Improvements Program (MsCIP), with the goal of providing enhanced protection from storm events as well as additional habitat for shore and migratory birds.
Bryant D. B. et al., 2019 demonstrated in a laboratory experiment the role of vegetation in dune response to wave attack. It was reported that vegetation, including both below and aboveground biomass contributes significantly to reducing sediment loss under extreme events. Within the same works, it is also noted that innovating dune construction methods by incorporating biomass material within the construction phase may improve dune stability under extreme events. This has further been evaluated by follow-on laboratory studies which demonstrated that increased below-ground biomass can contribute greatly to sediment retention of a dune under wave attack (Bryant D. et al., 2019). The results of these works suggest that periodic incorporation of natural biomass material into dune systems may increase their sediment retention ability.
Like many coastal regions, the Harrison County coastline experiences frequent accumulation of vegetative detritus, composed typically of sea or marsh grasses, commonly referred to as “wrack” (Figure 2A). Wrack is any organic material that is deposited on the beach along the swash line. It is typically composed of macroscopic algae, seagrass, driftwood, and marsh grasses (Hemminga and Nieuwenhuize, 1990; Dugan and Hubbard, 2010; Sigren et al., 2015). This material can trap windblown sand on its own, but often also contains the seeds and live rhizomes of dune vegetation species, enabling the growth and initiation of the bio-geomorphic interaction that forms dunes (Godfrey, 1977). In regions which experience excessive of wrack accumulation, beach raking or grooming is often used to remove the material (Provost et al., 2022). The purpose, most commonly, being to maintain clean, safe beaches for recreation. However, the availability of this material locally offers a unique source of biomass material that can be used to encourage natural dune growth. Dugan & Hubbard, 2010 as well as Hemminga and Nieuwenhuize, 1990 emphasize the importance of wrack to both sediment trapping as well as dune formation. Experimental studies performed by the University of Florida, demonstrated the use of surrogate wrack to improve both sediment accumulation and plant growth (Hooton et al., 2020). Ecological benefits of wrack material have been well documented as well, with several studies citing its importance to water quality, the coastal food chain, and species richness and abundance to organisms such as shorebirds and macrofauna (Harrison and Mann, 1975; Duggins et al., 1989; Dugan, 1999; Elias et al., 2000; Dugan et al., 2003; Orr et al., 2005; Heerhartz et al., 2016). Further summarization of both ecological and geomorphological impacts of wrack is reviewed in Provost et al., 2022.
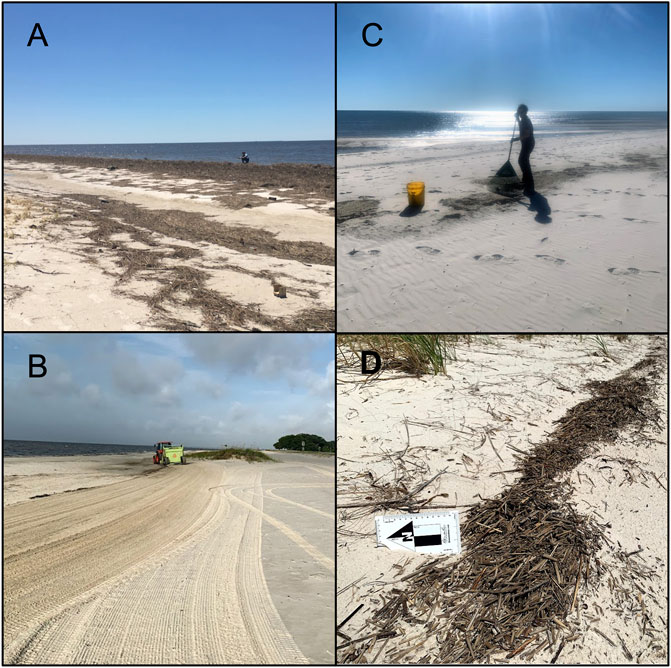
FIGURE 2. (A) Wrack observed at the field site on 12 June 2020. This large amount of marsh grass and other organic material was deposited during Tropical Storm Cristobal. (B) Beach grooming in progress at the field site, with visible rake lines and equipment. Photo taken September 1, 2020. (C) Gathering wrack from the berm for placement. (D) Wrack on the dune toe post-placement with sand gathering visibly on the seaward side.
Harrison County, MS receives frequent wrack deposition along the beach. This stretch of coast provides an ideal site to test alternative wrack management strategies and the usefulness of wrack for dune improvements along the constructed and managed dune system that stretches the length of the county. This study investigates the response of periodic wrack placements on a test segment of the constructed dunes and evaluated the change in response relative to extreme storm events and recovery periods. Local biomass material, consisting primarily of aquatic and marsh vegetation was collected from the wrack line (high-water line) of the beach, and placed at the dune toe to promote aeolian deposition and encourage natural dune growth. Terrestrial lidar surveys conducted quarterly were used to evaluate dune stability following tropical events, as well as dune recovery during periods of fair weather. At the time of this publication, the area was monitored for a total of 19 months, with the initial survey beginning in June of 2020.
To evaluate the effectiveness of utilizing beach wrack to enhance dune stability, a field study was implemented in Pass Christian, Mississippi (Figure 1). A 550 m section of beach, near Henderson Point Beach, was selected as the study location through collaboration with the county Sand Authority. This project site encompassed the beach starting at coordinates 89.27853W, 30.30473N and ending at coordinates 89.27303W, 30.30579 N. The study site was divided into three zones, each 183 m, with Zone 1 as the control, Zone 2 being left un-groomed, and Zone 3 both un-groomed and treated with wrack material (Figure 1). In addition to the study zones, each zone was further broken down into key geomorphological areas to allow changes to be observed separately in each sub-zone. These areas include the berm, the dune, and the ramp (the area between the dune and the seawall). The ramp area is often the site of aeolian ramp built up against the seawall (Figure 1), whose height is roughly 3 meters along this section of beach. Monitoring of the study location began in June of 2020 and is ongoing as of the publication of this paper. Monitoring of the study location began in June of 2020 and the final survey was conducted in 2022.
Beach grooming (or raking) is the processes of using mechanical equipment to remove debris from the beach. Grooming practices regularly performed by the county Sand Authority include using tractors to rake the beach between the water line and the dune toes. The beach is also raked between dune segments and behind the dunes up to the seawall. Beach grooming in the area occurs in order to keep the beach safe and accessible for beach-goers by clearing any trash that is deposited or debris that may wash ashore in addition to wrack (Figure 2). The frequency of grooming is typically associated with the frequency of wrack or debris deposition, which is variable by storm and most regularly seen during hurricane season (Figure 2A).
Zone 1, which begins at coordinates 89.27853W, 30.30473N and ends at coordinates 89.27663 W, 30.30509 N, was designated as the “Status-Quo” (i.e., existing state) control zone. In this section of beach, the standard beach grooming practices were allowed to continue. As such, the tractors are used to rake between the water line and the dune toe, between dune segments, and behind the dune (Figure 2B).
In Zones 2 and 3, grooming is limited to the berm only, and the rakes are not allowed to come into contact with the dune toe. Grooming is continued on the berm in these zones, as the county wishes to keep that portion clear of debris for beach-goers. Zone 2, beginning at the end of Zone 1 and ending at coordinates 89.27476 W, 30.30545 N, is considered the “No-Rake” zone. The area directly in front of, in-between, and behind the dunes will be left undisturbed. Zone 3 begins at the end of Zone 2 and ends at coordinates 89.27303, 30.30579 N. This zone was designated as the no-rake and treatment zone. In this zone, the dunes will again be left undisturbed and wrack material that is deposited will be placed at the dune toe. Signage was posted at the start and ends of each zone to indicate to raking crews the areas to avoid.
In Zone 3, wrack material was collected and placed along the dune toe (Figures 2C). Wrack typically deposits on the seaward edge of the beach berm, and the goal was to move this material directly to the dune toe to enhance sand trapping and reduce problematic sand loss from the beach (Figures 2D, 3). Prior to beach grooming, conducted by the local sand beach authority, wrack material available at the wrack line on the berm was collected and cleared of non-organic debris and trash. The material was raked and gathered in 5-gallon buckets by hand, then transferred directly to the dune toe. Alongshore concentration of wrack placed on the toe was kept approximately the same as that originally deposited (i.e., wrack was moved from the wrack line directly to the toe without adding additional material per length of shoreline). The volume of wrack placed was tracked utilizing the 5-gallon buckets (0.023 m3 each) (Figure 2C). Placement dates and volumes are recorded for comparison with storm events and survey times (Figure 4). In addition to wrack placements, the timeline also presents the dates of terrestrial lidar surveys, as well as storms which occurred during the study periods. Wrack placements were performed pending local site conditions and material availability.
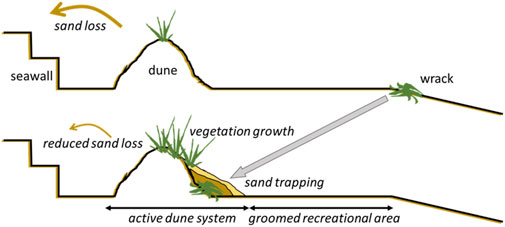
FIGURE 3. Diagram displaying typical wrack deposition location, and the placement location on a dune and expected behavior.
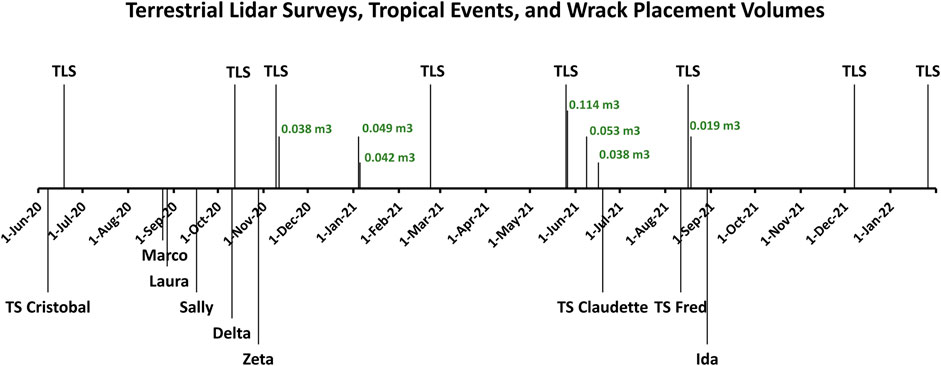
FIGURE 4. Project timeline depicting terrestrial lidar survey (TLS) dates, named storm events, and wrack treatments with the placed volumed.
The data collection for this effort was supported by the US Army Corps of Engineers Coastal and Hydraulics Lab Field Data Collection and Analysis Branch (FDCAB) and the University of Southern Mississippi’s Gulf Coast Geospatial Center (GCGC).
Beach and dune monitoring surveys using terrestrial Light Detection and Ranging (LiDAR) were conducted quarterly by the GCGC from October 2020 to January 2022 (Table 1), with the preliminary survey performed in June of 2020 by the FDCAB. A total of eight surveys were completed during this time, each collecting high-resolution LiDAR elevations across the entire study area. To ensure maximum precision and accuracy as well as consistency among surveys, a control mark was established using a semi-permanently installed marker centrally located within the study site along the seawall (seawall face). An integrated approach of Global Navigation Satellite System (GNSS)/Total station surveying was used to establish LiDAR scan stations approximately 50 m apart along the seawall face and between the shoreline and dunes. A Trimble SX10 Scanning Total Station and 360 Prism were used for Electronic Distance Measurements (EDM), and a Trimble R10 was used for GNSS measurements (Trimble Inc., 2016). A single resection total station setup was performed using two GNSS measurements to establish the initial point of beginning (POB) located at the site’s established control mark for each monitoring survey. GNSS positions for the two resection measurements were corrected real time to ±2 cm horizontal and vertical precision using the University of Southern Mississippi Gulf Coast Geospatial Center Real Time Network (University of Southern Mississippi Gulf Coast Geospatial Center, 2022). All positions referenced the North American Datum 1983 (2011) and NAVD83. LiDAR scan stations were subsequently established along each survey face using EDM total station leveling. LiDAR scans were then collected to create a seamless point cloud of the study site for each complete survey.
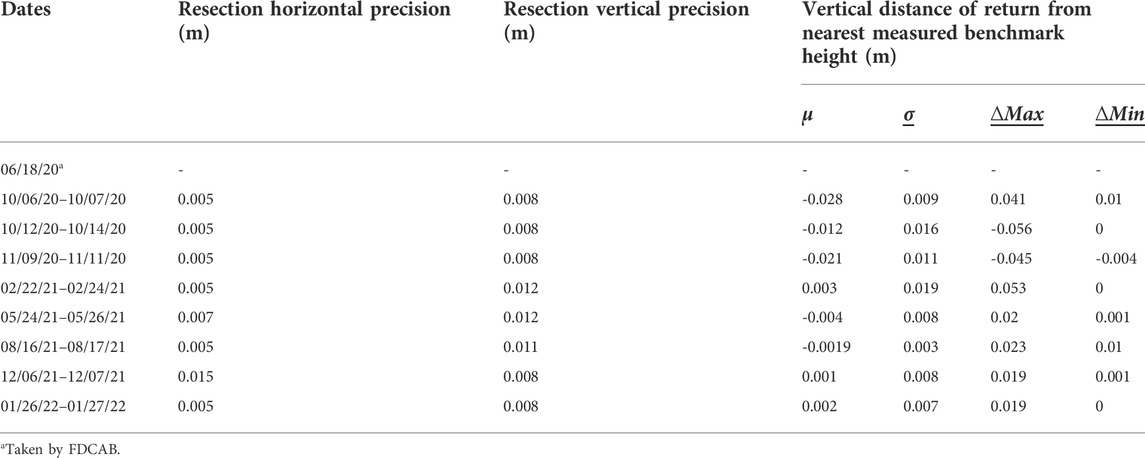
TABLE 1. Survey dates, including beginning and end date for each full survey, and associated precisions/accuracies.
Post-processing of the scan data was completed in Trimble Business Center. All scan station setup positions were quality checked and accuracy assessments were performed on LiDAR point clouds. The vertical distance of twenty individual returns along the top of the seawall from two permanently encased benchmarks were measured to assess vertical error, with the ten closest returns to each benchmark assessed. The surface of the seawall was assumed to be of constant height surrounding each benchmark. Point clouds were colorized using panoramic photos obtained by the SX10 at time of each scan. Noise was removed and the point clouds were classified using Trimble Business Center’s automated classification algorithm, with classes coded in accordance with American Society for Photogrammetry and Remote Sensing (ASPRS) Standard LiDAR Point Classes (Point Data Record Format 6–10) specified by LAS Format Version 1.4 (ASPRS - American Society for Photogrammetry & Remote Sensing, 2019). The classified point cloud was quality checked and adjusted using field panoramas. Classes included Ground, Low Vegetation, User Defined: Signage, Benches, Fencing, and Garbage Cans, and Debris. Positional accuracy of the final point cloud was validated based on two topographic control points measured at the permanent benchmarks along the seawall (Table 2). Finalized point clouds were exported in LAS v1.4 and projected to UTM Zone 16N in ArcGIS Pro.
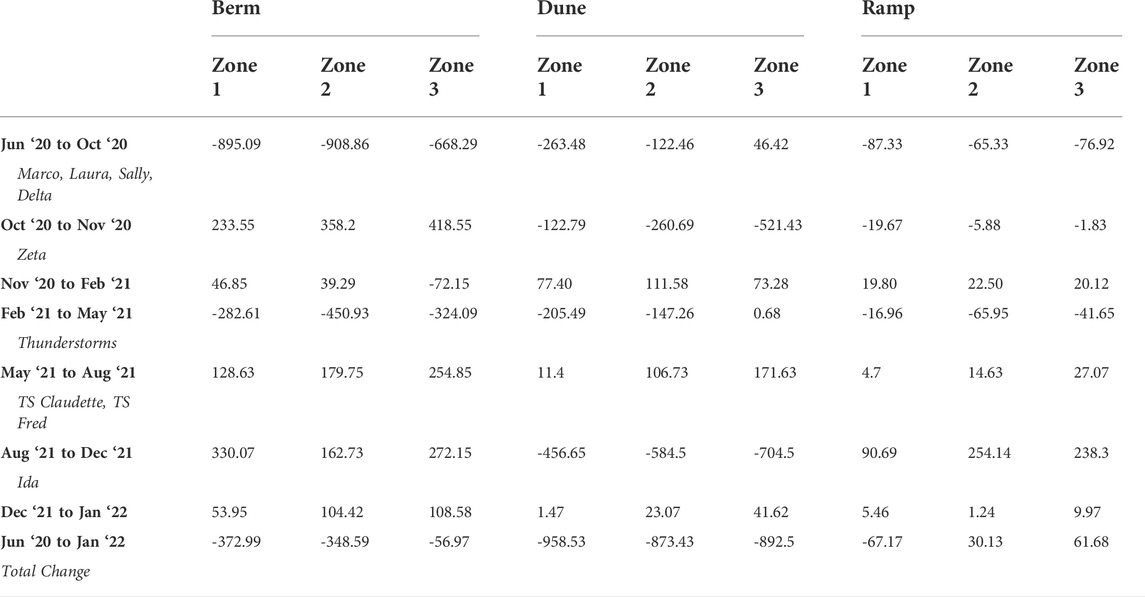
TABLE 2. Total Volume Change (m3) in each geomorphological division and zone by survey date comparison. For each set of dates, the values are calculated by subtracting the temporally first date from the second so that positive values represent accretion, and negative represent erosion. The last row shows total volume change from first to last survey.
Digital Elevation Models (DEMs) were created in ArcGIS Pro from the ground class of the post-processed point cloud at 0.2-m resolution using the mean of the ground values in each cell. Data voids were filled using a natural neighbor method. All finalized DEMs are referenced to NAVD88.
Each main zone (1–3) is divided into three polygons representing the major morphological sections in the cross shore, as previously mentioned (Figure 1). Elevation change is calculated by subtracting one DEM from another to produce an elevation change raster with the same cell size as the original DEMs. Positive changes are associated with accretion, whilst negative change is associated with erosion. Elevation changes within each polygon are summed to find the net volume change between the two survey dates. Two cross-shore profile transects from each zone are used to observe profile changes over the course of the study (Figure 1). In each zone, a profile crosses the center of a dune segment (Figure 1, red transect line), and the center of a gap between dune segments (Figure 1, yellow transect line). All elevation and elevation change values are represented in meters, and volumes are in meters cubed. Volumetric and profile analyses and their visualizations were conducted in ESRI ArcGIS Pro and Python in ArcGIS Pro.
The influence of the wrack treatment and changes in beach grooming practices were evaluated by calculating volume changes in the berm, dune, and ramp of each zone as well as comparing profile shape and elevation changes between surveys. These results were considered relative to storm events and fair-weather periods between June 2020 and January 2022 (first and last survey dates).
Nine named tropical cyclones and one notable thunderstorm system passed close enough to impact the site during the study period (Figure 4). The project site is located in a region protected by barrier islands. As such, hydrodynamics in this region varies from those in the open Gulf. To better understand local storm impacts, NOAA wind and water level data from a nearby station located slightly inside the mouth of the St. Louis Bay estuary (Figure 1, triangle) was used to observe changes during storm events impacting the survey area. Given the limited availability of station locations within the region protected by the barrier island, this station was selected for comparison though it is further inland than desirable. From this station, water level, wind speed and wind direction time series were developed for the length of the study (Figure 5). The NOAA station did not report wind data between August and mid-December of 2020, which excludes most of the 2020 hurricane season when some of the strongest storms impacted. Water level data was available for the entire study period, however, and provides some comparison between relative severity of all the events that impacted the area during this time (Figure 5, top).
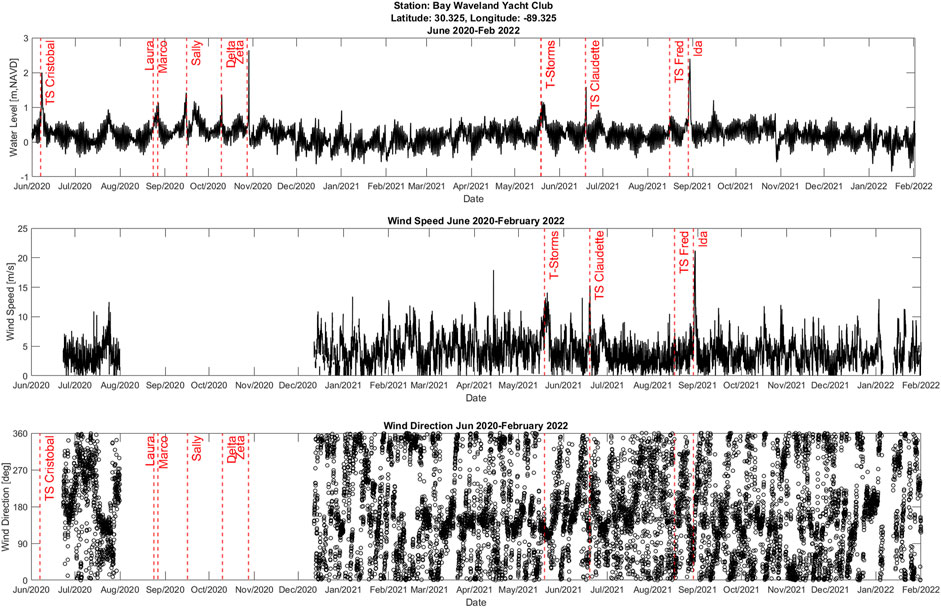
FIGURE 5. Water Level, wind speed, and wind direction time series from June 2020 to February 2022. Red dotted lines indicate storm events within recorded timeframe. NOAA Station 8747437 at the Bay Waveland Yacht Club, Bay St. Louis, MS, 30.325N, 89.325 W.
Water level spikes appear during the passage of the tropical cyclones and the severe thunderstorms, with a peak water level of 2.64 m occurring during Hurricane Zeta’s impact. The National Weather Service of New Orleans reported maximum wind gust speeds in the nearby city of Gulfport at 45 m/s. As demonstrated by the time-series, winds in the region are highly variable with no clear dominant direction, though densities of the scatter show that wind directions from between 90 and 180° (i.e., from the southeast, on-shore) may occur more frequently. Sustained wind speeds generally ranged between 0 and 10 m per second throughout the study period, but were occasionally exceeded, typically during weather-events such as the thunderstorm event, Tropical Storm Claudette, Tropical Storm Fred, and Hurricane Ida, with a maximum sustained wind speed during Hurricane Ida over 20 m/s. To further understand the variability of the wind data, the wind directions were sorted relative to the Beaufort Wind Scale (World Meteorological Organization and Commission for Maritime Meteorology, 1970) The Beaufort Wind Scale empirically classifies wind intensity based on condition observations. Using the range of wind speeds identified by the Beaufort Wind Scale, the time series data wind data was sorted into bins for each wind speed category to determine if dominate wind directions were associated with wind speed. From this, it was noted that in “calm” to “light breeze” conditions, i.e. wind speeds less than 3.1 m/s, wind direction varied greatly. However, in stronger wind conditions, with speeds greater than 3.1 m/s, a dominant direction from the southeast was evident, which is indicative of tropical events from the Gulf of Mexico being the most frequent source of elevated wind speeds.
All elevation change observations, including change values for each cell between each pair of surveys, are examined as distributions for each zone and geomorphological division (Figure 6). A Mann-Whitney test compared all elevation change observations from Zones 2 and 3 (n = 1.82 million and n = 1.73 million respectively) individually with Zone 1 (n = 1.79 million). The null hypothesis that the elevation change distribution observed in Zones 2 and 3 is statistically the same as that of Zone 1 was rejected with 95% confidence in both cases, meaning that there is no evidence that the elevation changes observed in Zones 2 and 3 are statistically the same as those in Zone 1.
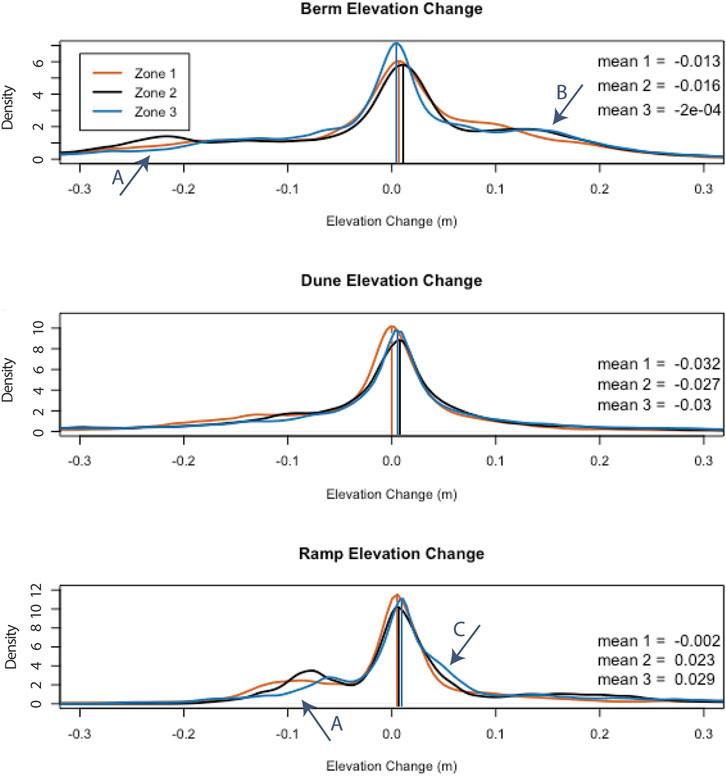
FIGURE 6. Probability density functions displaying the cumulative elevation change density over the entire study period in meters within the berm, dune, and ramp regions for each zone. The probability density functions show the shape of the frequency histogram for each dataset. Mode values are indicated by the vertical lines, and mean values are included on each plot. Arrows A: highlight a secondary mode in erosion. Arrow B: highlights a secondary mode in deposition. Arrow C: highlights skewness into deposition from the main mode.
When broken into individual geomorphic zones, the elevation change mode values are consistently above zero in zones 2 and 3, with both slightly higher than that of zone 1 in the dune and the ramp. In the dune, the distributions are dominated by a single mode, with lower occurrence of erosion or deposition above 0.1 m compared with the berm and ramp. Within the dune, zones 2 and 3 show slightly positive modes, whereas zone 1 showed ∼ 0 elevation change over the study period. Berm and ramp elevation change frequencies are also dominated by a single mode,but show small secondary modes in erosion and deposition. Zone 3 shows the smallest erosion signal in the berm and ramp (Figure 6, arrows A). Zone 3 also shows a higher frequency of deposition in the ramp at ∼0.5 m (Figure 6, arrow C). Within the berm, zone 2 shows a peak in erosion and zones 2 and 3 both peak in deposition (Figure 6, arrow B).
Overall, the elevation change density distributions are dominated by peaks near zero elevation change or slightly above zero, indicating that the most cells experienced a net-zero or slightly net positive change over the entire study period. In the berm and dune, the mean values are slightly negative, indicating a negative skew. Only the ramp of zones 2 and 3 show slight positive means. The approximately zero dominant mode on all of these datasets does not reflect on the overall volume change, as lower frequencies in the larger deposition or erosion values can outweigh the mode value.
From the terrestrial lidar data, volumetric calculations between zones and their individual geomorphological areas (berm, dune, and ramp), Figure 1 were performed to quantify how sediment accretion and erosion varied between zones throughout the study period (Table 2). Elevation change rasters were created, and volume change was calculated from these between each survey, as well as between the first and last survey of the study period to find the total change (Figure 7; Table 2). Total volumetric change over the study period shows net erosion in the dune in all three zones, with the most occurring in Zone 1 (∼960 m3) and the least erosion occurring in Zone 2 (∼870 m3), the un-groomed and untreated zone (Figure 7, bottom). In the berm region, again net erosion occurred in all zones, with the greatest volume loss observed in Zone 1 (∼370 m3), and the smallest volume loss in Zone 3 (∼60 m3). In the ramp region, erosion occurred in Zone 1 (∼70 m3), however accretion occurred on the ramp in Zones 2 and 3, with a maximum volume gain of ∼60 m3 in Zone 3 (Figure 8).
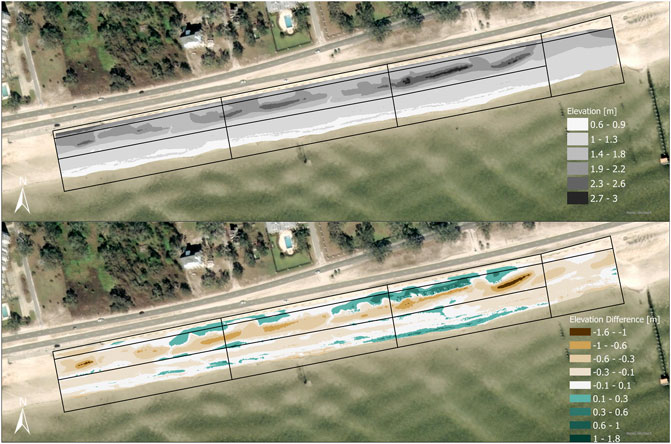
FIGURE 7. A (top): Elevation raster from the survey taken at the beginning of the study period. The survey was performed by the US Army Corps of Engineers Engineer Research and Development Center Field Data Collection and Analysis Branch, 18 June 2020. B (bottom): Elevation change between the initial survey on 18 June 2020 and final survey 26 Jan 2022. Positive values indicate accretion. All units in meters, NAVD88.
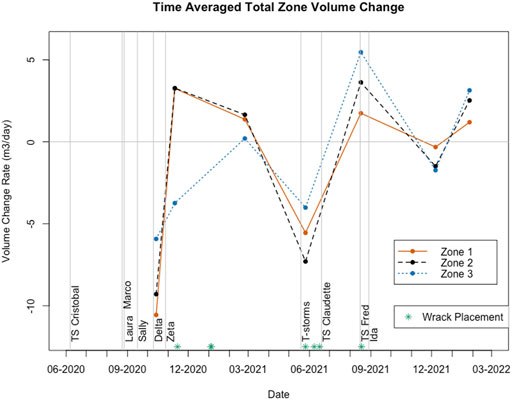
FIGURE 8. Total time-averaged volume change in each zone (Berm, dune, and ramp combined). The data point is plotted at the time of the second survey.
A number of the survey comparisons captured storm events and offer unique insight into the grooming reduction and wrack treatments’ potential ability to improve resiliency of the dune (Table 2). To account for variable periods of time between surveys, data is examined as net volume change but also volume change rate (Figure 8). The first survey comparison, between 18 June 2020 and 12 October 2020 captured the impacts of Hurricanes Marco, Laura, Sally, and Delta. Within these dates, all zones saw net erosion, and regions, with the exception of the Zone 3 dune, eroded (Figure 8, Table 2). During this period, in the berm, the smallest volume loss was observed in Zone 3 (∼668 m3). In the dune region, accretion occurred in Zone 3 (∼46 m3), and erosion occurred in Zones 1 and 2 however less erosion occurred in the ungroomed zone, Zone 2 (∼263 m3 and ∼122 m3). In the ramp region, erosion was seen in all zones, with the least erosion occurring in Zone 2 (∼65 m3).
Hurricane Zeta impacted the coast between the following two surveys, October 12th and November 9th of 2020. Hurricane Zeta brought the largest increase in water level (2.64 m) observed during the study period (Figure 5). During this time, accretion was seen in all zones in the berm region, with the greatest volume increase in Zone 3 (∼420 m3). This berm accretion was significant enough to lead to net volume increase during this period in Zones 1 and 2 (Figure 8, Table 2). Sediment loss, however, occurred in all zones of the dune region, with the most loss occurring in Zone 3 (loss of ∼520 m3), leading to a net loss in this zone overall. In the ramp region, erosion occurred in all zones as well, but sediment loss was minimal, ranging from ∼20 m3 to ∼2 m3.
Severe thunderstorms impacted the study area between the February and May surveys of 2021. These caused erosion in nearly all sections of all zones, with the maximum erosion occurring in the Zone 2 Berm (∼450 m3). Despite large volume loss in the dunes of Zone 1 and 2 (∼200 m3 and 150 m3 respectively), the Zone 3 dune neither gained or lost significant volume (slight gain of 0.7 m3).
Between the May and August surveys of 2021, Tropical Storms Claudette and Fred impacted, but no zones were eroded during this time. All zones experienced volume increases, with Zone 3 seeing the largest net volume increase observed during the study (Figure 8, Table 2). Volume gain was observed across all geomorphic areas, with a maximum gain in the berm, with Zone 3 gaining 250 m3. The smallest volume gain for each geomorphological area was consistently observed in Zone 1, and the largest volume gain observed in Zone 3. In the dune, for example, Zone 3 gained fifteen times more sediment than Zone 1.
Hurricane Ida brought the second largest surge and second highest wind speeds to the area during the study period. This impact was captured between the August and December surveys of 2021, with all zones losing volume (Figure 8, Table 2). The greatest volume loss observed was in the dune of Zone 3 with >700 m3 eroded, and the greatest dune volume loss observed throughout all individual survey differences. In contrast to this dune erosion, the berm and ramp both saw accretion in all zones.
Two periods between surveys did not receive a notable event; November 2020 to February 2021, and December 2021 to January 2022. These fair weather periods should allow time for the beach and dunes to naturally accrete sediment, via wave delivery to the beach and aeolian transport into the dunes. During the first period, between 9 November 2020 and 22 February 2021, minor deposition occurred across most areas, with a maximum gain of ∼100 m3 in the Zone 2 dune. This is the largest dune volume gain observed in the study. ∼70 m3 of sediment was lost from the Zone 3 berm, while minimal gains were observed in the other berm zones.
During the second recovery period, between 6 December 2021 and 26 January 2022, all regions within all zones saw accretion. Within both the dune and ramp region, Zone 3 saw the largest accretion. The largest volume gains within each zone was observed in the berm, with the largest in Zone 3 with a ∼100 m3 increase. Moderate volume increases in the dune and ramp were observed, with most below 10 m3, but Zones 2 and 3 gained ∼20 and ∼40 m3 respectively in the dune.
Elevation profiles are plotted for select dune and dune “gap” (spaces between dune segments) transects (Figure 9). These comparisons provide context for the volume change results, with morphological changes resulting from dune erosion or accretion appearing clearly in the profile change.
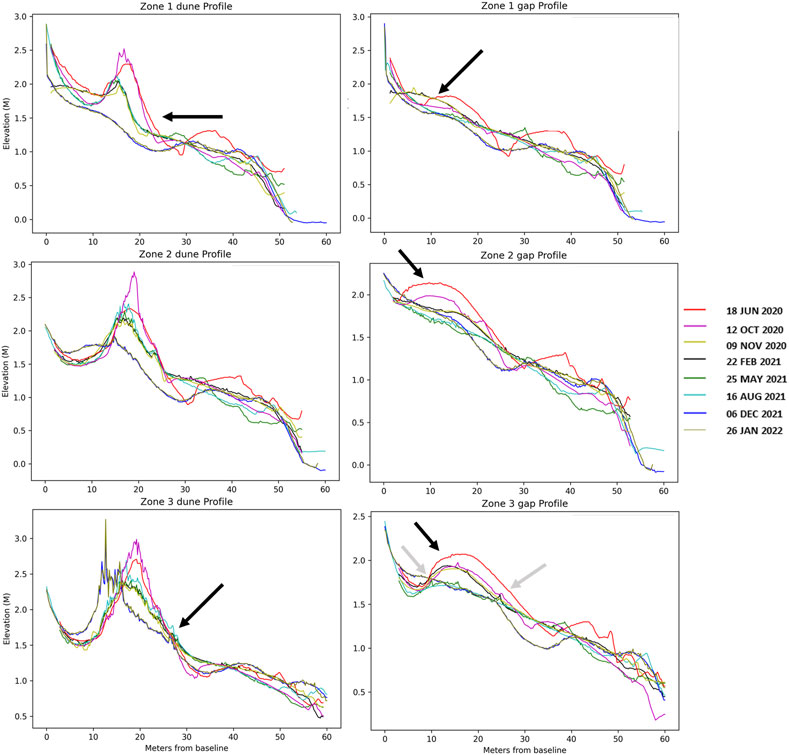
FIGURE 9. Elevation profiles at select transect locations (see Figure 2) showing changes in a dune and gap location in each zone. Seaward is to the right in all figures. Notable changes are highlighted in the figure with arrows.
Over the study period, the Zone 1 dune profile lost significant elevation in the dune itself, and the dune toe retreated significantly (Figure 9, Zone 1 dune profile arrow). There is slight erosion at the toe of the dune between June 2020 and October 2020, followed by significant erosion of the dune face during Hurricane Zeta as evident by the November 2020 survey. There is little change between November 2020 at the dune face during the passage of Tropical Storms Claudette and Fred in the summer of 2021. The dune along this transect is then nearly completely flattened by December 2021, during the time slice encompassing the Hurricane Ida impact. Though a number of months passed between Ida’s impact and the following survey, no other significant erosional events occurred during this window. Site visits to the area confirmed that the significant erosion observed during this time was caused by Hurricane Ida. As such, the majority of change which occurred during that time is attributed to that event.
The dune profile in Zone 3 shows a different response from that of Zone 1. Zone 3 received wrack placements to the toe, and raking was limited. The dune maintains elevation over the course of the study, and the dune toe remains relatively stationary in contrast with the significant retreat observed in Zone 1. Some seaward dune expansion is observed, which does not occur during any periods in the Zone 2 or Zone 1 dune profiles (Figure 9, Zone 3 dune profile, black arrow). There is elevation loss in the dune crest during the October to November 2020 period, encompassing Hurricane Zeta’s impact, as well as the August to December 2021 period, including Hurricane Ida. The dune crest (the highest point on the dune) and the dune heel (the landward edge of the dune) move landward with each of these events.
In the Zone 2 where wrack was not placed, but raking was limited, the dune did not retain as much elevation as Zone 3, however, it retained more than its raked counterpart. Clear elevation changes in the dune face are still limited to October to November 2020 and August to December 2021; Hurricane Zeta and Hurricane Ida. Similar to Zone 3, the dune toe remains stable through Hurricane Zeta’s passage, however, the toe does retreat significantly, and the dune appears to be completely flattened by December 2021, after Hurricane Ida.
Alternatively, transects taken between the dune segments, or “gaps” were compared. In all zones there are noticeable changes in elevation over time near the landward limit of the profiles. The initial profiles in all zones (June 2020) show a similar feature, highlighted by black arrows. By the end of the study, the gap profiles all approach a flat slope. This flattening occurred most rapidly in Zone 1, whereas in Zone 2 elevation was maintained until November of 2020. In Zone 3 however, much more of the elevation remained until May of 2020. Within Zone 3 as well, as indicated by the left-most gray arrow, the profile regained some volume, shown by the slight change between the pink line representing the October 2020 survey, versus the yellow and black lines, from the November 2020 and February 2021 surveys. The right-most gray arrow indicates a slight elevation increase on the seaward side of the gap. Overall, from the transect profiles provided, the starkest difference in elevation change was seen in Zone 1.
Results presented in this manuscript demonstrate morphological changes to the beach over a duration of approximately 19 months. Notable results can be summarized by the following:
• A net volume increase over the entire study period was only observed in the ramp of Zones 2 and 3. Although volume was lost from the dunes in all zones, the greatest net volume loss was observed in the dune of Zone 1.
• Major events that brought the highest surges, Hurricane Zeta and Hurricane Ida, contributed to large volume loss across all zones, but the Zone 3 dune remained intact, and the dune toe remained stable throughout the entire study period. In contrast, both the Zone 1 and Zone 2 dune was completely flattened after Hurricane Ida (Figure 9).
• Through the unprecedented 2020 hurricane season, all storms caused notable volume changes, but not all storms caused net erosion. The response is complicated, suggesting that some events even lead to significant net deposition, particularly on the berm. The relatively minor events even contributed volume to the dunes in some cases (Table 2).
Dune resiliency is imperative for coastal infrastructure protection as well as the preservation of ecological benefits of a healthy beach and dune system (Hemminga & Nieuwenhuize, 1990; Dugan, 1999; Dugan & Hubbard, 2010). This manuscript provides an overview of preliminary monitoring results from the trial of alternative management strategies on a constructed beach and dune system. Results suggest that a reduction in beach grooming, and the incorporation of natural wrack material into the dune system can encourage natural resilience even in the face of major hurricane impacts and may reduce sand volume loss in the long term.
Although the net change over the full study period is erosive in most areas, and modal elevation change observations always hover around 0 (Table 2; Figure 6), Zones 2 and 3 separate themselves from Zone 1 on the deposition side of the distribution, especially in the Berm and the Ramp. Volume change and profile data from individual storm and fair-weather periods throughout the study also come together to clearly illustrate the impact of the reduced grooming practices in Zones 2 and 3, and possible impacts of wrack placement. Considering volume changes alone, Zones 2 and 3 consistently fared better than Zone 1 during the relatively minor tropical events, including Hurricanes Marco, Laura, Sally, and Delta as well as Tropical Storms Claudette and Fred.
The larger impacts, from Hurricanes Zeta and Ida, brought a much larger surge. Hurricane Zeta was the first event of the season, and likely the first event in many years, that completely overtopped all the dune crests. The highest dunes in the study area before Zeta were in Zone 3 at ∼3 m NAVD 88, the seawall height in the area is ∼3 m NAVD88 and the surge during Zeta reached 2.6 m. This surge with additional waves on top easily eroded the dune crests across the study site, whereas previous events were only able to scarp these highest dunes (e.g., Tropical Storm Cristobal). Dunes in Zones 2 and 3 were eroded down to a similar elevation with those in Zone 1 during Zeta (Figure 9). Zone 3 dunes were able to maintain dune crest elevation even through hurricane Ida, which mostly flattened the dunes of Zone 1 and 2 (Figure 9). Although these large events led to more dune volume loss in the zones with reduced raking, these dunes were initially much higher so had more volume to lose and maintained some dune-crest elevation and a relatively stationary dune toe, while the continually raked dunes were flattened and de-stabilized.
Overall, Zone 3 dunes were also able to maintain and transfer some of their volume landward, while raking in Zone 1 likely re-distributed this material after one grooming. This pattern of distributing volume landward is also evident in the elevation differences provided by Figure 7. Like the cross-shore profiles, the LiDAR image representing elevation change demonstrates a reduction in elevation at the dunes, with an elevation gain immediately behind the dune segments, suggesting an overall migration of the material inland.
The stability of the Zone 3 dune during both Zeta and Ida suggests that not only the reduction in raking, but the addition of wrack material had an impact. Both un-raked zones maintained a stationary dune toe during Hurricane Zeta, but only Zone 3 (un-raked and with added wrack) maintained a stationary dune toe during Ida as well. The added wrack material on the toe even led to slight dune toe progradation/accretion in Zone 3 during the fair-weather period following Zeta (Figure 9). The wrack material was observed to begin trapping sand shortly after placement both on the dune toe, and in the gaps between dunes. The gaps between dune segments focus the wave and surge energy during high water events, leading to lobate wash over fan deposition. These fans show up as the broad rounded features visible in the profiles. Accretion on the placed wrack-line is visible in the gap transect for Zone 3, and this added material likely led to the greater stability of the fan feature in Zone 3 (Figure 9, Zone 3 gap Profile, gray arrow). However, though the wrack placements are evident in the transect profiles, it is critical to note that overall accretional changes within Zone 3 could also be due to the dunes in Zone 3 having been more established dune systems at the inception of the study, thus existing vegetation and biomass within the system may play a larger role it its ability to trap sediment.
With increased dune toe stability, and greater maintenance of dune crest elevation in the un-raked zones as well as visible deposition on the placed wrack line of Zone 3, the benefits of these practices are clear. If these practices were put in place long term, especially during years with fewer major hurricane impacts, the benefits would likely compound, leading to larger and more stable dunes in areas with reduced raking and added wrack biomass.
The nearshore environment is incredibly complex with regard to both hydrodynamic and geomorphologic behavior. Wind dynamics are critical in evaluating aeolian transport, however, due to lack of data, several storm events, including hurricanes Laura, Marco, Sally, Delta and Zeta, could not be explicitly compared with survey results, and as such comparisons with those storms were investigated from a hydrodynamic standpoint. As mentioned previously, the hydrodynamic data referenced, was recorded at an inland bay, and as such still does not offer full insight to the site hydrodynamics such as wave height and direction, at the project site and only water level alone could be evaluated. Though greater wind speeds were associated with directions from the southeast, day to day winds varied greatly, which may have contributed to the variability in accretive trends associated with the recovery periods. Improved wind and hydrodynamic data availability on this coastline, would be of great benefit to improving interpretation of both this and similar monitoring studies, especially considering the complexities provided by the barrier islands protecting the region.
By dividing the site into zones and geomorphologic segments, a broader picture of the physical processes occurring throughout the study duration can be lost. For example, some survey results demonstrated erosion at the dune region, even in the treated zone. However, as water inundated the region, it is anticipated that though erosion is occurring at the dune, there is a net transport of sediment onshore. This is evident in the results displayed comparing profiles before and after Hurricane Ida, between August 16th of 2021 and December 6th of 2021. As noted in Table 2, volumetrically, Zone 3 in the dune region saw a loss of ∼705 m3 of material, whilst the ramp region is Zone 3, saw accretion of ∼240 m3. Observational data taken during a site visit following the passage of Ida noted volumes of sand further along the sea wall and into the roadway area, suggesting additional material potentially was transported well beyond the cross-shore measured in the study region. This pattern of inland transport may contribute to larger accretive changes occurring directly behind the dune segments, while the dunes showed erosion across each zone (Figure 7, bottom).
It is also probable wind and wave direction played a large role in lateral transport. As previously mentioned, wind and wave data were limited, however this trend can again be seen in the comparison of surveys taken before and after Hurricane Ida between August and December of 2021. In this case, Zone 3 saw greater volumes of sediment erosion compared to Zones 1 and 2. This potentially suggests a transport of material along shore from Zone 3, into Zones 1 and 2. However, as noted previously larger erosion of Zone 3 may also be attributed to a larger starting elevation of the dunes in that zone.
Following analysis of the terrestrial lidar data, evidence in the survey collected in January of 2022 suggests that prior to this survey, raking may have occurred in the no-raking zone of the study area. This largely may have been due to beach signage being washed away following Hurricane Ida, thus the study zones were not as clearly indicated to grooming crews. No evidence of raking in the no-rake zones were found in the previous survey results, given the authors were not present during grooming there is the potential it may have occasionally occurred, especially if it was a matter of maintaining beach safety in the region.
Being a field study, a variety of environmental, as well as social factors can occur throughout the experiment, impacting its implementation. As noted in Figure 4, seven wrack placements occurred throughout the study period, one in November of 2020, two in early January of 2021, and the remainder in the summer of 2021. Though the volumes of wrack placed throughout the study were low relative to volumes accumulated on the beach, the material that was placed is notable regarding the alternative methods of biomass development including dune plantings. In placing wrack material, though most is dead vegetation, biomass is incorporated into the dune system instantaneously, whereas the same level of biomass could take years to establish through root growth on its own. As noted, total volume change varied greatly across the study area, however, the treated zone saw a greater positive volume change in the zone entirety by the final survey.
Wrack placement was impacted by several factors, including availability of material as well as beach accessibility following severe events. As an example, Hurricane Ida not only brought a significant surge to the area, resulting in road closures, but damages in surrounding areas resulted in an influx of people to the area in search of gasoline and food, ultimately resulting in severe traffic. Furthermore, though copious amounts of wrack material often accumulated during severe weather events, not all material could be placed at the dune. In many cases, hazardous debris (i.e. scrap material such as wood with nails) was incorporated in the material and required removal to maintain safe beach conditions, or the wrack material was washed inland beyond the seawall and road. As such, though large amounts of wrack accumulated during storms, not all material could be placed at the dune toe.
Sandy coastal environments invoke complex hydrodynamic and geomorphological processes. This study serves to document a new nature-based management practice of placing wrack on existing constructed dunes. Additionally, reduction in beach grooming around the dunes is considered. Deposition and erosion patterns varied in a complex way through storm events and across the study area. Clear differences emerged in the response of dunes in the zones with reduced grooming and with added wrack material, both to storm impacts and the fair-weather periods between them. To further understand the response of wrack to dune resiliency, it is suggested that monitoring data of treatments be expanded both spatially and temporally. Incorporating a longer test section of coast, as well as varying coastal locations, could contribute to understanding of how wrack placements and reduced grooming affect the dunes and the beach profile. In addition, longer temporal datasets may provide additional insight into wrack-placement-specific benefits, as well as offer more insight into whether sediment processes are altered primarily by wrack placements or by the alteration in grooming patterns.
The raw data supporting the conclusions of this article will be made available by the authors, without undue reservation.
All authors listed have made a substantial, direct, and intellectual contribution to the work and approved it for publication.
This work was funded through the US Army Corps of Engineers Regional Sediment Management Program, research task “Field Implementation of Belowground Biomass (BGB) for Increased Dune Stability and Resiliency”.
The authors would like to acknowledge and thank the USACE Mobile District and the Harrison County Sand Beach authority for both their permission in executing this effort, as well as their involvement and assistance in its successful execution.
The authors declare that the research was conducted in the absence of any commercial or financial relationships that could be construed as a potential conflict of interest.
All claims expressed in this article are solely those of the authors and do not necessarily represent those of their affiliated organizations, or those of the publisher, the editors and the reviewers. Any product that may be evaluated in this article, or claim that may be made by its manufacturer, is not guaranteed or endorsed by the publisher.
ASPRS - American Society for Photogrammetry & Remote Sensing. (2019). LAS specification 1.4-R14 release information. November 2011, 1–50. Available at: http://www.asprs.org/wp-content/uploads/2019/03/LAS_1_4_r14.pdf.
Berg, R. (2021). National hurricane center tropical cyclone report: Tropical storm cristobal (AL032020). National hurricane center. Available at: https://www.nhc.noaa.gov/data/tcr/AL032020_Cristobal.pdf.
Blumberg, A. F., Ahsan, Q., Li, H., Kaluarachchi, I. D., and Lewis, J. K. (2001). “Circulation, sediment and water quality modeling in the northern Gulf of Mexico,” in World Water and Environmental Resources Congress, ASCE, Orlando, Florida, May 20–24 2001. doi:10.1061/40569(2001)257
Borsje, B. W., van Wesenbeeck, B. K., Dekker, F., Paalvast, P., Bouma, T. J., van Katwijk, M. M., et al. (2011). How ecological engineering can serve in coastal protection. Ecol. Eng. 37, 113–122. doi:10.1016/j.ecoleng.2010.11.027
Bryant, D. B., Bryant, M. A., and Grzegorzewski, A. S. (2017). Erosion of coastal foredunes: A review on the effect of dune vegetation. (Vicksburg, MS: U.S. Army Engineer Research and Development Center). ERDC/CHL CHETN-I-94. doi:10.21079/11681/21464
Bryant, D. B., Bryant, M. A., Sharp, J. A., Bell, G. L., and Moore, C. (2019). The response of vegetated dunes to wave attack. Coast. Eng. 152, 103506. doi:10.1016/j.coastaleng.2019.103506
Bryant, D., Hoch, C., Provost, L., Bell, G., and Bryant, M. (2019). The role of belowground biomass on short term dune evolution. Coast. Sediments 2019, 1188–1202.
Byrnes, M. R., Rosati, J. D., Griffee, S. F., and Berlinghoff, J. L. (2013). “Historical sediment transport pathways and quantities for determining an operational sediment budget: Mississippi sound barrier islands,” in Understanding and predicting change in the coastal ecosystems of the northern Gulf of Mexico. Editors J. C. Brock, J. A. Barras, and S. J. Williams (Charlotte, NC: Coastal Education & Research Foundation), 63, 166–183. Coconut Creek (Florida), ISSN 0749-0208.
Cipriani, L. E., and Stone, G. W. (2001). Net Longshore Sediment Transport and Textural Ch iments along the Southwest Alabama and Mississippi Barrier Islands, U.S.A. J. Coast 17, 458. West Palm Beach (Florida), ISSN 0749–0208.
Dugan, J. (1999). Utilization of sandy beaches by shorebirds: Relationships to population characteristics of macrofauna prey species and beach morphodynamics. Santa Barbara, California: Coastal Research Center, Marine Science Institute, University of California. MMS OCS Study 99–0069.
Dugan, J. E., and Hubbard, D. M. (2010). Loss of coastal strand habitat in Southern California: The role of beach grooming. Estuaries Coasts 33, 67–77. doi:10.1007/s12237-009-9239-8
Dugan, J. E., Hubbard, D. M., McCrary, M. D., and Pierson, M. O. (2003). The response of macrofauna communities and shorebirds to macrophyte wrack subsidies on exposed sandy beaches of Southern California. Estuar. Coast. Shelf Sci. 58, 25–40. doi:10.1016/s0272-7714(03)00045-3
Duggins, D. O., Simenstad, C. A., and Estes, J. A. (1989). Magnification of secondary production by kelp detritus in coastal marine ecosystems. Science 245 (4914), 170–173. PMID: 17787876. doi:10.1126/science.245.4914.170
Elias, S. P., Fraser, J. D., and Buckley, P. A. (2000). Piping Plover Brood Foraging Ecology on New York Barrier Islands. J. Wildl. Manag. 64 (2), 346–354. doi:10.2307/3803232
Godfrey, P. (1977). J.: Climate, plant response and development of dunes on barrier beaches along the US East Coast. Int. J. Biometeorol. 21, 203–216. doi:10.1007/bf01552874
Hancock County Historical Society. (2022). Vertical Files - Beach History. Available at: http://www.hancockcountyhistoricalsociety.com/reference/vf.php?t=subjects&vf=Beach%20History. [Accessed October 28, 2019].
Hanley, M. E., Hoggart, S. P. G., Simmonds, D. J., Bichot, A., Colangelo, M. A., Bozzeda, F., et al. (2014). Shifting sands? Coastal protection by sand banks, beaches, and dunes. Coast. Eng. 87, 136–146. doi:10.1016/j.coastaleng.2013.10.020
Harrison, P. G., and Mann, K. H. (1975). Detritus formation from eel-grass (Zostera marina L.): the relative effects of fragmentation, leaching and decay. Limnol. Oceanogr. 20, 924–934. doi:10.4319/lo.1975.20.6.0924
Heerhartz, S. M., Toft, J. D., Cordell, J. R., Dethier, M. N., and Ogston, A. S. (2016). Shoreline Armoring in an Estuary Constrains Wrack-Associated Invertebrate Communities. Estuaries Coasts 39, 171–188. doi:10.1007/s12237-015-9983-x
Hemminga, M. A., and Nieuwenhuize, J. (1990). Seagrass wrack-induced dune formation on a tropical coast (Banc d'Arguin, Mauritania). Estuar. Coast. Shelf Sci. 31, 499–502. doi:10.1016/0272-7714(90)90040-x
Hooton, N., Miller, D. L., Thetford, M., and Claypool, S. (2020). Building Coastal Dunes with Sea Oats and Surrogate Wrack: WEC364/UW409, 2/2016. EDIS 2016 (7), 4. Available at: https://journals.flvc.org/edis/article/view/128002.
Martínez, M. L., Psuty, N. P., and Lubke, R. A. (2004). “A perspective on coastal dunes,” in Coastal dunes: Ecology and conservation,. Editors M. L. Martínez, N. P. Psuty, and R. A. Lubke (Berlin: Springer), 3–10.
NOAA. (2022). Historical Hurricane Tracks. Available at: https://coast.noaa.gov/hurricanes/#map=4/32/-80 (Accessed June 2022).
NOAA. (2020). Tropical Cyclone Climatology. Available at: https://www.nhc.noaa.gov/climo/ (Accessed June 2022).
Orr, M., Zimmer, M., Jelinski, D. M., and Mews, M. (2005). Wrack deposition on different beach types: spatial and temporal variation in the pattern of subsidy. Ecology 86 (6), 1496–1507. doi:10.1890/04-1486
Provost, L. A., Bryant, M. A., Eisemann, E. R., and Bryant, D. B. (2022). Coastal resilience: Benefits of wrack and dune systems and current management practices. ERDC/TN RSM-22-6. (Vicksburg, MS: U.S. Army Engineer Research and Development Center). doi:10.21079/11681/45282
Schmid, K. (2002). Biennial report of sand beaches; Harrison county. 2001. (United States: Mississippi Office of Geology), 33. Open-File Report 111B.
Sigren, J. M., Figlus, J., and Armitage, A. R. (2015). Coastal sand dunes and dune vegetation: Restoration, erosion, and storm protection. Shore Beach 82 (4), 5–12.
Trimble Inc. (2016). Datasheet - Trimble SX10 Scanning Total Station. Available at: https://geospatial.trimble.com/sites/geospatial.trimble.com/files/2019-10/Datasheet-SX10ScanningTotalStation-EnglishUSL-Screen.pdf.
University of Southern Mississippi Gulf Coast Geospatial Center (USM GCGC). (2022). GCGC Real Time Network. Available at: www.rtn.usm.edu.
Keywords: wrack, terrestrial LIDAR, dunes, biomass, field study, beach management
Citation: Provost LA, Eisemann ER, Anderson CP and Waldron MCB (2022) Wrack placement to augment constructed dunes: A field investigation. Front. Built Environ. 8:907608. doi: 10.3389/fbuil.2022.907608
Received: 29 March 2022; Accepted: 28 September 2022;
Published: 26 October 2022.
Edited by:
Jens Figlus, Texas A&M University, United StatesReviewed by:
Christine Angelini, University of Florida, United StatesCopyright © 2022 Provost, Eisemann, Anderson and Waldron. This is an open-access article distributed under the terms of the Creative Commons Attribution License (CC BY). The use, distribution or reproduction in other forums is permitted, provided the original author(s) and the copyright owner(s) are credited and that the original publication in this journal is cited, in accordance with accepted academic practice. No use, distribution or reproduction is permitted which does not comply with these terms.
*Correspondence: Leigh A. Provost, bGVpZ2guYS5wcm92b3N0QHVzYWNlLmFybXkubWls
Disclaimer: All claims expressed in this article are solely those of the authors and do not necessarily represent those of their affiliated organizations, or those of the publisher, the editors and the reviewers. Any product that may be evaluated in this article or claim that may be made by its manufacturer is not guaranteed or endorsed by the publisher.
Research integrity at Frontiers
Learn more about the work of our research integrity team to safeguard the quality of each article we publish.