 Jens Figlus
 Jacob M. Sigren2
 Rusty A. Feagin
 Anna R. Armitage
94% of researchers rate our articles as excellent or good
Learn more about the work of our research integrity team to safeguard the quality of each article we publish.
Find out more
ORIGINAL RESEARCH article
Front. Built Environ., 12 July 2022
Sec. Coastal and Offshore Engineering
Volume 8 - 2022 | https://doi.org/10.3389/fbuil.2022.904837
This article is part of the Research TopicNatural and Nature-Based Features for Flood Risk ManagementView all 17 articles
Vegetated coastal sand dunes can be vital components of flood risk reduction schemes due to their ability to act as an erosive buffer during storm surge and wave attack. However, the effects of plant morphotypes on the wave-induced erosion process are hard to quantify, in part due to the complexity of the coupled hydrodynamic, morphodynamic, and biological processes involved. In this study the effects of four vegetation types on the dune erosion process under wave action was investigated in a wave flume experiment. Sand dune profiles containing real plant arrangements at different growth stages were exposed to irregular waves at water levels producing a collision regime to simulate storm impact. Stepwise multivariate statistical analysis was carried out to determine the relationship of above- and below-ground plant variables to the physical response. Plant variables included, among others, fine root biomass, coarse root biomass, above-ground surface area, stem rotational stiffness, and mycorrhizal colonization. Morphologic variables, among others, included eroded sediment volume, cross-shore area centroid shift, and scarp retreat rate. Results showed that vegetation was able to reduce erosion during a collision regime by up to 37%. Although this reduction was found to be related to both above- and belowground plant structures and their effect on hydrodynamic processes, it was primarily accounted for by the presence of fine root biomass. Fine roots increased the shear strength of the sediment and thus lowered erosional volumes and scarp retreat rates. For each additional 100 mg/L of fine roots (dry) added to the sediment, the erosional volume was reduced by 6.6% and the scarp retreat rate was slowed by 4.6%. Coarse roots and plant-mediated mycorrhizal colonization did not significantly alter these outcomes, nor did the apparent enhancement of wave reflection caused by the fine roots. In summary, fine roots provided a unique ability to bind sediment leading to reduced dune erosion.
Coastal sand dunes form a protective buffer for many coastal communities around the world, protecting infrastructure and homes from damaging storm surges and waves. The economic storm protection benefits of dunes are substantial (e.g., Sigren et al., 2016; Sigren, 2017), warranting investment in restoring and maintaining these coastal ecosystems. This is in line with most published work on wave erosion of vegetated dunes suggesting reduced erosion due to the presence of plants (e.g., Silva et al., 2016; Feagin et al., 2019; Maximiliano-Cordova et al., 2019 and 2021). However, questions remain on whether dune vegetation is meaningful to dune storm protection beyond promoting long term accretional processes (i.e., building up dune size over time) (Feagin et al., 2015) since the potential for enhanced scouring due to accelerated flow around plant stems or uprooting of entire plants exists. Small-scale flume studies have indicated the potential for dune vegetation to reduce wave-induced erosion (e.g., Sigren et al., 2014; Silva et al., 2016), lending support to the idea that dune vegetation could play an active role in erosion resistance during storm surges. However, only few studies have addressed the specific biophysical mechanisms and interactions between vegetation, sediment, and water that drive this erosion resistance and storm protection. Mendoza et al. (2017) for example, studied implications of the dune plant Ipomoea pes-caprae at various densities and under various hydrodynamic forcing conditions on dune morphology evolution in a sediment wave flume, showing that the vegetation slowed the erosion process by adding small, localized perturbations to the flow. Both above- and belowground vegetation aspects likely play a role, enhancing complexity of the problem. The objective of this paper is to analyze and assess the specific interactions between vegetation, sediment, and hydrodynamics in a controlled flume setting to form statistical models for the role of vegetation in dune erosion resistance. Quantifiable information on effects of vegetation parameters on physical processes associated with dune erosion could help optimize the practice of dune restoration and the management of vegetated dune systems.
The above- and belowground components of vegetation affect hydrodynamics and sediment properties in multiple transitional and coastal ecosystems (e.g., marshes, mangroves, seagrass and kelp beds, riparian banks), reducing erosion in the process (Thampanya et al., 2006; Gedan et al., 2011; Coops et al., 1996). Though coastal dunes in some ways differ from these other ecosystems (e.g., different shore geometries/morphology, sediment characteristics, swash and surf zone/wave breaking dynamics), the interactions observed in other ecosystems can provide context for the kinds of interactions that may occur between dune vegetation and sediment/water during direct wave impact. Aboveground interactions are hydrodynamic in nature, occurring between moving water and plant stems and leaves. In marshes, aboveground plant structures reduce tidal flow and turbulent velocities (Leonard and Luther, 1995). Such reductions in velocities lower the overall amount of energy in the water column that is available to entrain and move sediments, tending to promote the settling of sediments and reduce erosion. Other energy dissipation by plant structures has been observed in coastal ecosystems in the form of wave energy dissipation (e.g., Ysebaert et al., 2011; Yang et al., 2012). The amount of energy dissipation that occurs depends on the type of vegetation and the rigidity and surface area/density of the aboveground plant structures (Augustin et al., 2009; Bouma et al., 2010). Similar hydrodynamic interactions may occur between aboveground dune plant structures, water flow, and waves during elevated water levels where wave breaking and runup affect the dune face.
Belowground, plant roots and their associated microbial communities bind sediments and strengthen sediment structure. Soil binding and aggregation influences the general erodability of sediment and can take place over decades in dune sediment (Forster and Nicholson, 1981). The process involves bacterial and fungal decomposition, secretion of adhesive compounds, and entanglement of sediment particles by root hairs and fungal hyphae (Miller & Jastrow, 1990). The ratio of surface area and mass is reduced in water-stable conglomerates, conceivably causing behavior under hydrodynamic stresses comparable with larger particles. The described soil binding would therefore increase the dune sediment’s “effective grain size” and resistance to movement via water-borne forces. Potentially, higher amounts of mycorrhizal activity and roots present in a soil could increase this binding of sediment and erosion resistance.
De Baets et al. (2008) and Fan & Su (2008) point out the increased shear strength for sediments interspersed with roots from vegetation. In dunes, certain surge and wave collision scenarios (Sallenger, 2000) cause a dune scarp (cliff) to form as waves erode the base of the dune (Roelvink et al., 2009). Gravity acts on the overhanging sand of the dune scarp, inducing cantilever action and shear stress across the dune sediment and potentially causes slumping. Genet et al. (2007) pointed out that the tensile strength of roots can help delay the slumping process through the provided increased resistance to shear stress. It is hypothesized that, to a certain extent, as root density increases, so does the resistance of vegetated dunes to erosion.
These above- and belowground processes provide a conceptual framework for how dune vegetation could influence erosion but depend on observations made about plants in other ecosystems. To fill this knowledge gap concerning coastal dunes, the overall objective of the research in this paper was to determine the importance of dune vegetation in erosion resistance and to explore which aspects of vegetation (e.g., surface area and rigidity of plant stems, root biomass, mycorrhizal activity) are linked to various physical processes in the coastal zone (e.g., turbulence, swash velocity, wave reflection, shear stress reinforcement, sediment binding, erosion, dune scarp retreat). Controlled flume experiments were conducted varying both above- and belowground vegetation parameters to accomplish the objective. Four specific dune plant morphotypes at different growth stages were embedded into the dune face of a model sand dune and subjected to elevated water levels and irregular waves to simulate the dune collision impact regime. This approach allowed the physical interactions between waves, the dune substrate, and vegetation to be statistically modeled (multivariate regression). Understanding these biophysical linkages could inform dune restoration and management practices and allow for the optimization of protective aspects of vegetation for the use in Engineering with Nature™ projects. Furthermore, optimized vegetation strategies may be a valuable tool to combat climate change threats to coastal areas, such as increased erosion resulting from future elevated water levels and more intense or frequent storms.
The overarching approach taken for this experiment was to generate variation in plant characteristics that may be relevant to dune swash hydrodynamics, sediment properties, and erosion and to test those variable plant characteristics in a simulated storm surge and wave attack while measuring physical response variables. This variation in plant characteristics was generated by testing four different species of dune plants at three different growth intervals (time allotted for the plants to grow in a greenhouse). Five plant metrics were measured through these tests: above-ground plant surface area, plant stem rotational stiffness/rigidity, fine root biomass, coarse root biomass, and mycorrhizal colonization. Six physical response metrics were also measured: near-bed swash flow velocity, turbulent kinetic energy (TKE), wave reflection (proxy for wave energy dissipation), sediment shear strength, sediment aggregation/effective grain size, and morphodynamic evolution of the vegetated dune profile. The influence of plant metrics on physical response variables was statistically evaluated using multivariate regression analysis. Several confounding variables were also analyzed and are thoroughly detailed in the Appendix.
Four different species of plants, each a unique morphotype (tall grasses, shrubs, vines, and short grasses–each representative of plants that live throughout the US Gulf Coast), were tested in different flume trials (Figure 1). Panicum amarum (P. amarum) represented the morphotype of tall dune grasses (Figure 1A). This plant features relatively rigid stems and can grow in excess of 1 m in vertical extent. However, most of the plant did not interact with waves because it was taller than the maximum water depth of the swash zone of the wave flume. This species also has a dense, adventitious root system featuring large rhizomes (>1 cm in diameter). Dune forbs/shrubs were represented by Rayjacksonia phyllocephala (R. phyllocephala). For flume testing seedlings between 5 and 10 cm in height were transplanted, but it is common for this plant to grow up to 50 cm in height in nature. This species has a woody stem and tap root with few fine roots (Figure 1B). The species Sesuvium portulacastrum (S. portulacastrum) represents the morphotype of spreading dune vines in this experiment (Figure 1C). This species forms a dense matrix of structures close to the ground (typically not higher than 5 cm) but is flexible compared to the other species. S. portulacastrum grows primary roots from nodes on stolons. Moderately dense networks of fine roots radiate from these larger primary roots. The last represented morphotype was Sporobolus virginicus (S. virginicus). This dune plant is characterized as a short grass with relatively low stem rigidity and a dense network of adventitious fine roots (Figure 1D). Its typical growth height ranges from 5 to 15 cm.
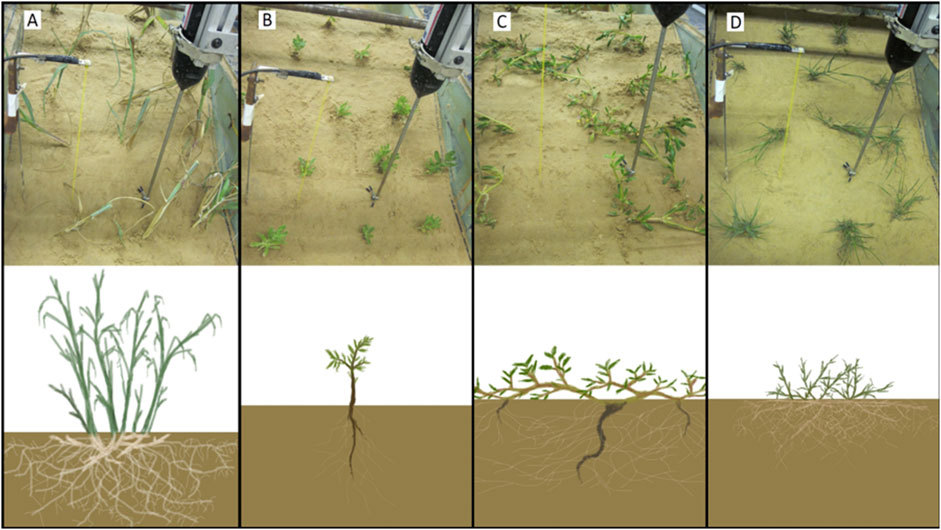
FIGURE 1. Photos (top panels) and schematics (bottom panels) of plants used in sediment wave flume experiment. Four species/morphotypes of plants were used for this experiment: A tall grass (A: P. amarum), a small forb (B: R. phyllocephala), a spreading vine (C: S. portulacastrum), and a short grass (D: S. virginicus). Photos depict initial dune profile conditions for vegetated trials using 3-week-old transplants. Schematics highlight differences in above- and below-ground structure of the four different plant morphotypes.
In addition to the variations in plant morphotype, transplant age at the time of flume testing was varied as a measure of the length of time a plant has had to grow and develop. The procedure to grow and transplant the vegetation into the sand dune of the wave flume is described next. Cylindrical plastic pots, 16 cm in both diameter and height, were filled with the same sediment that was used to form the dune in the wave flume. Over the spring and summer months, cuttings from each plant species were watered and fertilized in an identical fashion in a nearby greenhouse to allow for the development of above- and belowground plant features. After set growth periods of 3, 6, and 9 weeks the entire content of the respective pots was transplanted into the dune for testing. This was accomplished by removing an identical cylindrical volume of sediment from an initial bare dune in the flume and replacing it with the content of a pot. The sediment surface was then smoothed by hand to provide a seamless dune surface. Once transplanted, the contents from the pots (15 per trial) formed a staggered grid of five rows and three columns (see Figure 1). A total of 15 wave flume trials were conducted, three controls trials without plants and 12 trials with plants (4 species × 3 growth intervals).
All tests were conducted in a 15 m long × 1.3 m deep × 0.6 m wide wave flume (Figure 2). Sediment within the flume consisted of sand from a Texas sand pit with a median grain diameter of 152 microns. The sediment’s grain size distribution resembles that of native material along upper Texas coast beaches (see Sections 2.4, 2.5 for more details) and was determined using sieve analysis. The seaward facing dune slope was 1/2 (
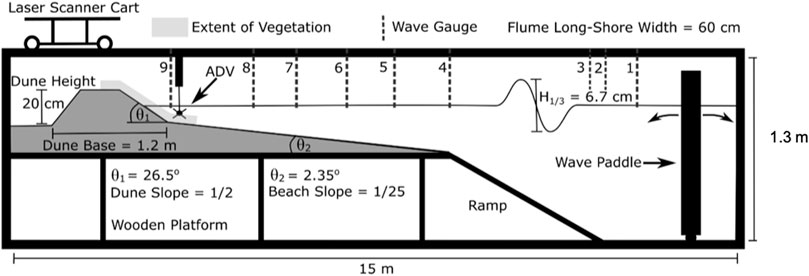
FIGURE 2. Schematic of sediment wave flume setup including the area of vegetation plantings.
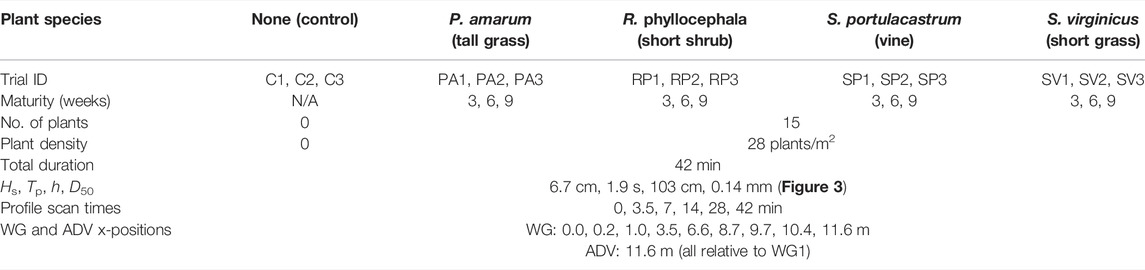
TABLE 1. Summary of wave flume experiment parameters.
Data on above- and belowground vegetation parameters were obtained for each plant that had been part of the wave flume experiment. Once each trial had been completed, all included plants were carefully removed from the flume followed by a thorough wash to remove any attached sediment. Further processing involved separation into aboveground and belowground components and determination of dry biomass. The total aboveground vegetation surface area (stems and leaves) interacting with wave up- and downrush on the dune face was quantified via spectral image analysis. Based on measured water depth time series on the dune face, only the lowest 5 cm of the aboveground plant structure were deemed to contribute to flow-vegetation interactions in this experiment. Stems and leaves from five of the used plants in each trial were photographed against a white background with length scale markings. Care was taken to make sure no plant structures were stacked on top of one another. Images were then spectrally analyzed in ArcMap where any non-white pixel was considered plant area. Total plant surface area was then calculated by converting the sum of all vegetation pixels up to 5 cm in plant height to an actual surface area value. Both average surface area per plant as well as total surface area per wave flume trial were determined. Belowground plant parameters were divided into two categories and included fine roots with a diameter less than 1 mm and coarse roots with a diameter larger than 1 mm.
Rotational stiffness (RS) of plant stems was determined via a cantilever beam setup by measuring the angle of deflection (
Where:
RS = Rotational stiffness
F = Magnitude of the force applied to the plant stem
D = Distance of the applied force from the anchor of the plant stem
Five different stems for each plant species were used to determine the respective average RS. The level of mycorrhiza presence on roots was quantified using Trypan Blue to stain the fine roots of each plant species following Morton & Amarasinghe (2006). By examining the roots under a microscope (magnification factor 200) in 1-cm length increments, the percentage of root length showing signs of mycorrhiza was recorded. Each 1-cm increment of roots displaying either hyphae, spore structures, arbuscule, or vacuole was taken to have active mycorrhiza.
The swash zone water velocity was collected for every wave run and trial at 200 Hz sampling frequency with a Nortek Vectrino Plus acoustic Doppler velocimeter (ADV) in “side-looker” configuration. The ADV relies on Doppler shifts in reflected acoustic bursts to determine the velocity of particles moving in water. When exposed to air, the ADV records only noise. Therefore, bubbles in the water column or backwash occurrences that exposed the ADV would cause erroneous readings. Both sources of error were filtered out. Because the ADV sensor head was placed in the swash zone, good data were logged intermittently during full sensor submergence. Based off each ADV dataset’s collocated wave gauge data, velocity data were removed when the local water free surface elevation was less than 0.5 cm below the still water level. As reference, the center of the ADV head was roughly 1 cm above the initial sediment bed and the tips of the top-most receiver prongs were roughly at the surface of the water (Figure 3). The 0.5 cm below still-water mark was the minimum level at which the ADV sensor head could record data. This technique filtered out the noise generated by air exposure for the ADV data so that turbulence and velocity calculations could be made. It should be noted that even though the center of the ADV sensor head was on average around 1 cm above the sediment bed over the course of all trials and wave runs, the sediment bed would shift slightly at this location (+/− 1 cm). For this reason, the distance from the sediment bed to the ADV sensor-head was used as a confounding variable for multivariate modeling of swash velocity and turbulent kinetic energy.
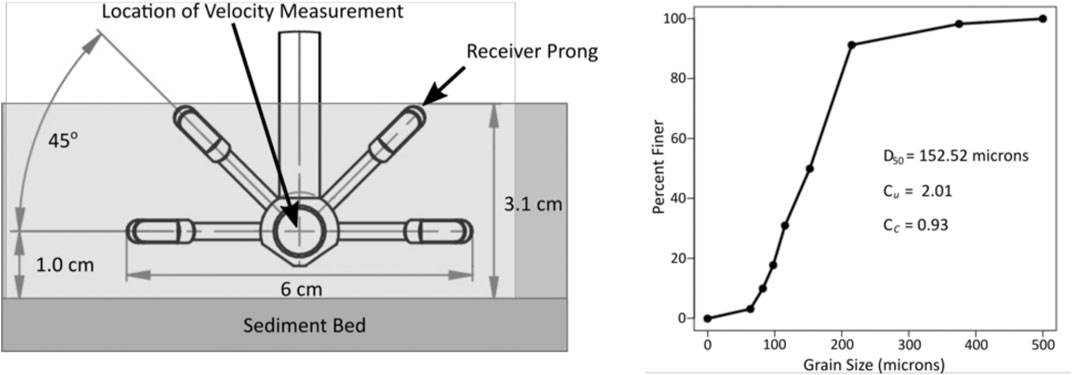
FIGURE 3. Schematic side view of ADV sensor head placement relative to the initial sediment bed (left panel). Cumulative grain size distribution of the sediment used to build the dunes in the sediment wave flume (right panel). D50 is the median grain size, Cu is the coefficient of uniformity, and Cc is the coefficient of curvature.
Turbulent velocity fluctuations
Turbulent kinetic energy (TKE) was calculated using the post-processed data of each wave run (2) where time-averaging is denoted by overbars. The absolute value of the mean flow velocity in the cross-shore direction was taken to be representative of the velocity magnitude of both the uprush and downrush during swash motion.
where:
TKE = Mean turbulent kinetic.
Nine capacitance wave gauges collected data for every wave run in every trial at 20 Hz and were used to calculate the wave reflection coefficient and other wave parameters. Wave reflection coefficients were obtained from the records of the three wave gauges furthest offshore (WG1 – WG3, see Figure 2) following the technique by Mansard and Funke (1980). Wave reflection coefficients were calculated for every 400-s window of wave action.
where R is the wave reflection coefficient, and Hr and Hi are the reflected and incident wave height, respectively.
Data were collected for two sediment properties: sediment shear strength and sediment aggregation. As these two properties could not be sampled from the wave flume before or after a trial without interrupting the trial or being disrupted by wave action, samples were taken from a harvested pot representative of each plant trial (control samples were simply collected from the flume sediment without plants present). Shear strength was measured by applying shear forcing across a 6 cm long, 7 cm diameter core using a horizontal soil shear apparatus. Cores were sheared at a speed of approximately 1 mm per second over a distance of 2.5 cm. Shear curves were created by video analysis of an attached force gauge display. Both peak shear and cumulative shear (the area under the shear curve) were calculated from the recorded data. In addition, the fine and coarse root biomass from each core was measured. Sediment aggregation was measured from a small sample (∼50 g) of sediment obtained from the same harvested plant that was run through a sieve tower submerged in water and placed on an INNOVA 2100 platform shaker at 80 RPM for 20 min. The advantage of using a water submerged tower was that unaltered sediment could be used (not dried, frozen, or ground up). Unaltered sediment is assumed to have binding properties (adhesive compounds, mycorrhizal entanglements, etc.) intact. The resulting grain size distribution represents the sediment’s effective grain size during a water-based forcing event. The sieve sizes of 63, 125, 180, and 250 microns were used and provided high resolution for this sediment’s grain size distribution.
Three-dimensional dune and beach morphology changes were measured using a combination of a laser line scanner (Acuity AP820-1000) mounted on a movable cart and a laser range finder (Acuity AR 2000). The elevation of the evolving morphology was scanned six times per trial, including the initial scan and subsequent scans following wave runs 1, 2, 4, 8, and 12 (or 3.5, 7, 14, 28, 42 min, respectively). Scans consisted of a 50-cm alongshore swath along the center transect (5 cm were excluded on each side to minimize interference with the walls of the wave flume) at 1-cm cross-shore increments. Plant structures measured by the laser were consistently removed from all profile scans. After filtering out plant elevations, the three-dimensional sediment surfaces were averaged at each cross-shore increment to yield representative 2D cross-shore profiles for calculation of the eroded volume of sediment from the dune area. For every final and initial profile comparison, there is a point near the base of the initial dune which marks the transition between erosion and accretion areas. All erosion that occurred landward of this point was summed and multiplied by the width of the flume.
The correlation between plant characteristics and physical response variables was determined via stepwise multivariate regression analysis. However, due to the large number of variables, a dredge algorithm (Barton, 2015) was used to narrow the list of predictor variables from the large pool. This algorithm is a type of automated model selection that creates all possible models (every combination of predictive/independent variables) and produces a ranking of the best possible fit models (based off R2). Stepwise forwards and backwards modeling techniques along with collinearity assessments (Variable Inflation Factors - VIFS) were then used on the dredge-optimized models to create a coherent model with only significant (α < 0.05) predictive variables. This statistical analysis also accounted for confounding variables which could influence physical response variables. These confounding variables arose due to differential patterns of erosion and sediment redistribution as a trial proceeded and due to slight user-based variation in the initial setup of dune/beach morphology and wave conditions. The Appendix includes additional details on the specific confounding variables that were analyzed in conjunction with the plant metrics.
Some predicted variables were modeled by the number of trials (n = 15) while others were modeled by the number of wave runs (n = 180). This sample size discrepancy is because dune morphological change variables and sediment data (shear strength, aggregation, eroded volume) only had one data point per trial (based off differences between beginning and end profile of each respective run). Alternatively, hydrodynamic data (TKE, swash velocity, wave reflection) were collected for each wave run and though there were repeated vegetation conditions for some wave runs, these hydrodynamic data were independent of each other. For example, measured TKE for any given wave run depends on profile, wave, and vegetation characteristics of that wave run and was modeled as such. It is possible in this type of analysis, however, that a certain variable (vegetation as well as confounding variable) does not show up as a significant predictor for a specific outcome simply because the tested range was not adequate. Additionally, if two plant variables were collinear, the modeling techniques used in this analysis cannot detect the independent importance of each plant variable with respect to a predicted variable.
As waves approached the shoreline, they shoaled and eventually broke between 40 (for the smallest waves) and 80 cm (for the largest waves) from the toe of the dune. The surf zone transitioned into the swash zone with swash runup passing through the first row of vegetation before reaching the location of the ADV sensor head. Vegetation structures had a visible effect on water flow, forming wakes behind stems indicating turbulence generation and energy dissipation. The average swash zone cross-shore velocity component
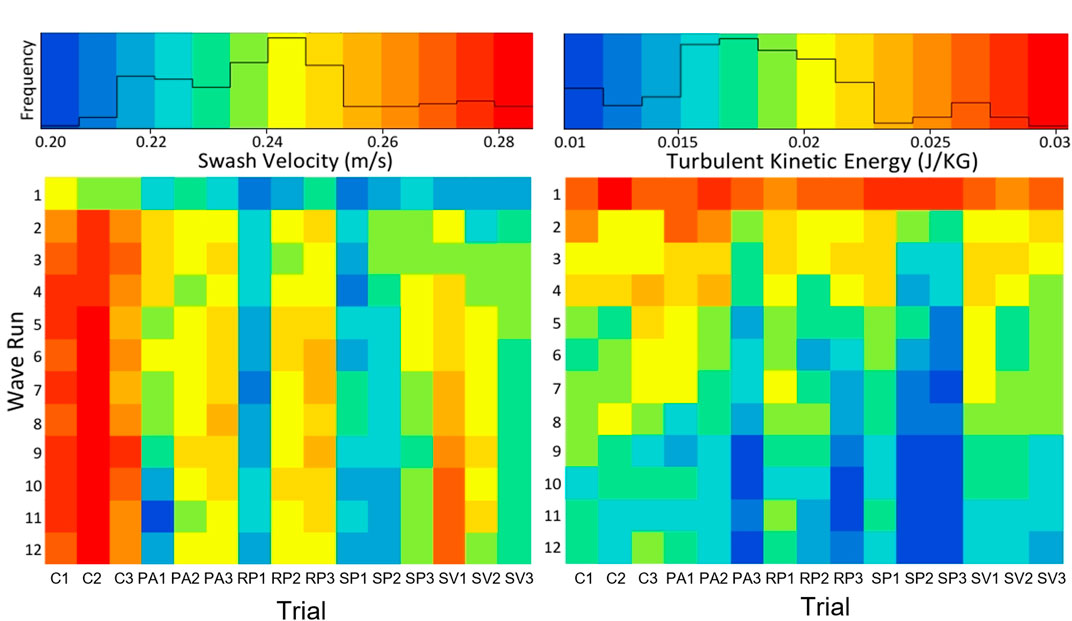
FIGURE 4. ADV-measured cross-shore swash velocity component
As waves began washing up onto the dune during the first wave run, dune sediment became wet and was pulled offshore into the swash zone by the return flow (downrush). By the end of the first wave run, rapid erosion of the seaward dune face had taken place forming a pronounced vertical scarp. Typically, this dune scarp started between the third and fourth rows of vegetation with a vertical extent between 5 and 6 cm. During the second wave run, the erosion dynamic shifted due to the adjusted profile featuring a growing offshore bar that aided in wave energy dissipation further away from the vegetation line. Thus, smaller waves from the JONSWAP spectrum began having less impact, barely running up to the base of the scarp. Larger waves, however, still interacted with the vegetation and substrate and collided with the base of the dune scarp continuing to erode sediment. This dynamic created a scarp overhang which would eventually slump into the swash zone as the base was undermined by attacking waves. The occurrence of intermittent slumping therefore appeared to be a dominant driver of erosion. When the overhang remained intact, minimal amounts of sediment were carried offshore from the dune. When the overhang collapsed, sediment slumped into attacking waves and the active swash zone. This sediment was then moved offshore by wave action and the previous dynamic of scarp overhang and base erosion commenced.
For trials without plants, two or three major slumping events would take place over the duration of the whole series of wave runs. For plant trials, often no or only one major slumping event occurred. As slumping occurred during plant trials, large cracks formed on the dune crest and plant roots were observed to span these cracks, providing a source of attachment of the slumping sediment to the rest of the dune. Plant trial slumping events would generally be prolonged and less violent than those observed in control trials. The eroded dune volume (E) and the scarp retreat (S) since the start of the respective experiment trial are listed in Table 2. Trial IDs correspond to those explained in Table 1. For the three bare dune control trials (C1-3) the average values are given. Time in minutes indicates the duration after the start of each trial at which profile scans were conducted.
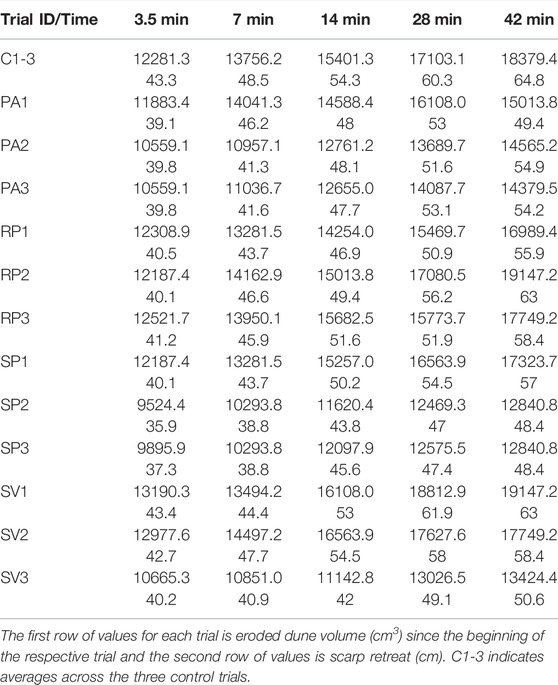
TABLE 2. Eroded dune volume and scarp retreat.
The 5-spoke star plots in Figure 5 are a tool to visualize variations of a select set of five vegetation parameters across the different plant species and growth durations. The five parameters included are the fine (FR) and coarse (CR) root mass, respectively, percent of roots with mycorrhiza colonization (MC), the plant surface area (SA) in contact with the flow, and the rotational stiffness (RS) of plant stems starting at the top of the star and proceeding in a counterclockwise direction. Parameter values relative to all other trials are indicated on the respective spokes of the star plots where the maximum value observed is shown at the point along the spoke farthest away from the center of the star. Connecting all the values to form a shaded 5-point area allows for easy comparison of dominant vegetation characteristics among various trials and to baseline control tests without vegetation.
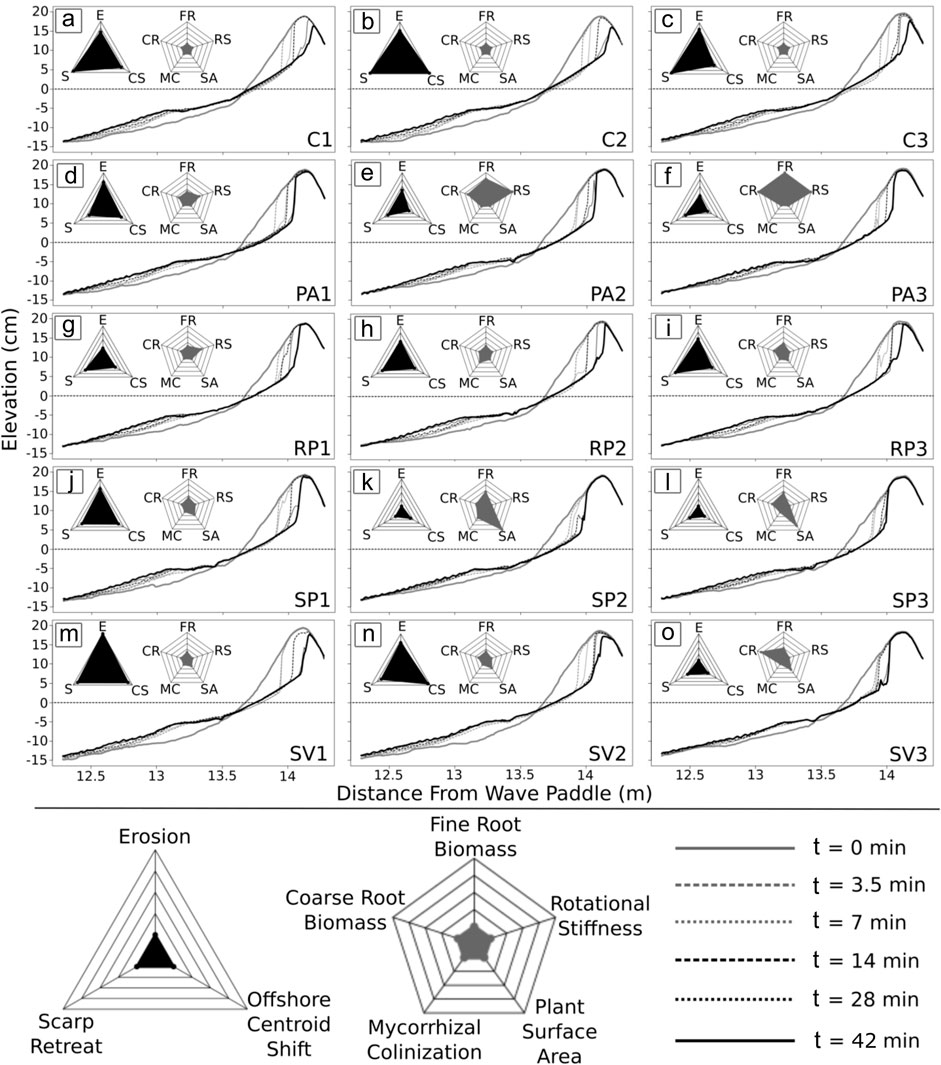
FIGURE 5. Evolution of beach and dune profiles for all wave runs. Panel letters (A–O) indicate each of the 15 individual experiment trials with specific trial ID given in the lower right corner of each panel as detailed in Table 1. Profiles are plotted at set times t in minutes as indicated in the legend with the initial profile depicted as a solid gray line and the final profile as a solid black line. Star plots summarizing beach/dune morphological change (three spokes) and plant (five spokes) data between initial and final run for each trial are also shown in each panel with individual spoke parameters explained in the legend at the bottom.
The star plots reveal contrasts in plant parameters between vegetation types, but also changes based on growth duration. For example, a substantial increase in fine roots (FR), coarse roots (CR), and rotational stiffness (RS) was observed for P. amarum as growth duration increased from 3 (PA1) to 6 (PA2) and eventually 9 (PA3) weeks, while at the same time mycorrhizal colonization (MC) and plant surface area (SA) remained low (Figure 5). This behavior can be explained in part by specific plant morphotype growth. P. amarum grows relatively tall with individual stems increasing in rigidity over time while maintaining a relatively low stem density (number of stems per unit area). Since most of the stem and leaf growth occurs above the elevation where flow interactions are expected, the aboveground changes in P. amarum over time do not significantly affect SA. Both the amount of fine (FR) and coarse (CR) roots of this plant, however, seem to have flourished with increasing growth duration to maximum levels across all tested plant morphotypes. In contrast, the dune forb R. phyllocephala did not show significant amounts of change in any of the vegetation parameters over the allotted growth time in this experiment, leading to continued small star plot area for all tests. Fine roots (FR), coarse roots (CR), surface area (SA), as well as stem rotational stiffness (RS) increased less than 5% of the respective maximum value for each parameter. A relatively moderate increase in fine roots (FR) and coarse roots (CR) in combination with the largest increase in surface area (SA) while maintaining low rotational stiffness (RS) was observed for S. portulacastrum. These observations make sense as this plant remains low to the ground as it spreads out over time (i.e., increased surface area in contact with the flow) without necessarily increasing its stem rigidity. The plant type S. virginicus did also not increase its rotational stiffness (RS) significantly over time but displayed a relatively large value for coarse roots (CR) by the 9-week mark (13.2 g/L for SV3) with only moderate increase in fine root (FR) and plant surface area (SA) values. Mycorrhiza presence remained relatively low for all tested morphotypes and growth durations, varying only between zero and 34.6% with a mean value of 5.4%. In general, the gray area formed by the 5-spoke star plots allows grouping of trial runs into three broad categories: Control trials without any vegetation present (C1, C2, C3), trials with relatively low vegetation influence (PA1, RP1, RP2, RP3, SP1, SV1, SV2), and trials with high vegetation influence (PA2, PA3, SP2, SP3, SV3).
The erosion response of the beach-dune system to hydrodynamic forcing is captured by the 3-spoke star plots shown in Figure 5. Parameters displayed include the eroded volume (E), the dune scarp retreat (S), and the cross-shore shift in profile area centroid (CS). A larger black triangle area indicates a more substantial erosion response with individual parameter values relative to all trials shown along the respective parameter spoke of the star. The highest values for erosion response parameters were measured in the bare dune control trials without any vegetation. Average values across all three control trials for E, S, and CS were 18379.4 cm3, 64.8 cm, and 11.9 cm, respectively. The trials listed above with measurable but still relatively low vegetation influence produced average erosion response values for E, S, and CS of 17588.5 cm3, 57.9 cm, and 10.7 cm, respectively, a notable reduction across the board. The trials considered to have high vegetation influence further decreased the overall erosion response. For these trials, the average values for parameters E, S, and CS were 13610.1 cm3, 51.3 cm, and 6.6 cm, respectively.
Multivariate statistical modeling of these vegetation variables with regards to erosion and other physical processes will add specificity to these generalizations and are detailed in the next sections. It should be noted that several of the plant variables were collinear with one another. Fine and coarse root biomass were strongly and positively correlated to one another. Both fine and coarse root biomass were also strongly and positively correlated to rotational stiffness. Lastly, mycorrhizal colonization showed a moderate correlation to plant surface area.
Data were collected over 15 flume trials on plant characteristics (plant surface area, rotational stiffness, fine root biomass, coarse root biomass, and mycorrhizal colonization) as well as physical response variables (average swash velocity, TKE, wave reflection coefficient, shear strength, sediment aggregation, erosion, profile centroid shift, and dune scarp retreat rate). To evaluate whether vegetation aspects affected physical properties during the experiments, multivariate regression analyses were conducted for all predictive and response variables (Table 3). Minus signs mark negative relationships and plus signs note positive relationships (asterisks show the level of significance of the relationship based on statistical p-values; N/A indicates “not applicable”; N/S indicates “not significant”).
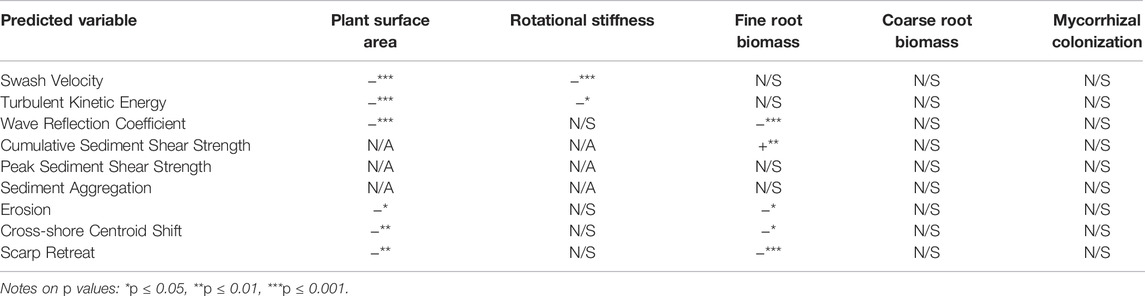
TABLE 3. Summary of all multivariate models.
Three hydrodynamic parameters were modeled during the flume trials: TKE (Supplementary Appendix Table SA1), average swash velocity (cross-shore direction, absolute value, Supplementary Appendix Table SA2), and wave reflection (Supplementary Appendix Table SA3). The aboveground plant surface area of stems and leaves were negatively and significantly related to swash velocity, TKE, and wave reflection coefficient. In other words, wave runs with more abundant aboveground structures had reduced flow velocities and turbulence in the swash zone. Plant structures also caused less wave energy to be reflected (a more dissipative shoreline). Rotational stiffness also had a similar negative relationship with mean flow velocity and swash zone TKE. Additional statistical model specifications for these models, including the influence of confounding variables, can be found in the Appendix (Supplementary Appendix Tables SA1–SA3).
Data were collected on two sediment properties: shear strength and effective grain size (aggregation). For shear testing, both peak shear (Supplementary Appendix Table SA4) and cumulative shear, i.e., the area under a shear curve (Supplementary Appendix Table SA5), were evaluated for relationships with root properties within tested cores. Fine root biomass was positively and significantly related to peak shear and cumulative shear and displayed a stronger relationship than coarse root biomass or total root biomass. Figure 6 shows a comparison of sediment shear curves between a core taken from S. virginicus at 9 weeks (SV3, the plant/growth increment with the highest cumulative shear as well as the highest fine root density) and a control core from trial C3. The two shear curves have similar peaks (the core with plant roots being slightly higher) but the core with plant material resisted a continuously high shear stress throughout the full length of the shear test, basically providing a more ductile failure mode. In contrast, the control core essentially crumbled when shear stress built up, failing rather rapidly. No significant trend was found between sediment aggregation (effective grain size) and mycorrhizal colonization or fine root biomass. Additional information on sediment shear models can be found in the Appendix (Supplementary Appendix Tables SA4–SA5).
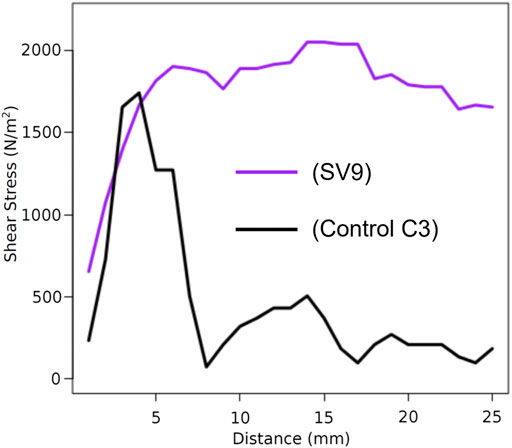
FIGURE 6. Comparison between shear curves produced from a core of control trial C3 and SV3 (S. virginicus at 9 weeks maturity).
The three erosion response parameters (E, S, and CS) all had similar relationships with respect to plant characteristics. Specifically, FR (fine root biomass) and SA (aboveground plant surface area) showed a significant negative correlation with eroded sediment volume (E) in that trials with high parameter values of FR and SA led to significant erosion reduction. For each additional 100 mg/L of fine roots (dry), erosion volume was reduced by roughly 1.2k cm3 or about 6.6% of the average erosion volume that occurred during the control trials. Erosion volume was reduced by roughly 380 cm3 (∼2.1% of the average erosion volume that occurred during the control trials) for each cm2 of plant surface area per alongshore centimeter of shoreline (Supplementary Appendix Table SA6).
Similarly, the erosion response parameter S (scarp retreat distance) showed a significant negative correlation with FR and SA. For each additional 100 mg/L of fine roots (dry), scarp retreat was reduced by roughly 3 cm or about 4.6% of the average retreat that occurred in the control trials. Scarp retreat was reduced by roughly 1.1 cm (∼1.7% of the average scarp retreat that occurred during the control trials) for each cm2 of plant surface area per alongshore centimeter of shoreline (Supplementary Appendix Table SA7). Consistent with the other measures of erosion, offshore centroid shift (CS) was also significantly and negatively correlated with FR and SA (Supplementary Appendix Table SA7). In trials with more fine roots, stems, or leaves, the offshore shift of sediment was reduced. For each additional 100 mg/L of fine roots (dry), offshore centroid shift was reduced by roughly 1.1 cm or about 9.6% of the average centroid shift that occurred in the control trials. Cross-shore centroid shift was reduced by roughly 0.2 cm (∼1.8% of the average off-shore centroid shift that occurred during the control trials) for each cm2 of plant surface area per alongshore centimeter of shoreline. Additional details on all three erosion models are given in the Appendix (Supplementary Appendix Tables SA6–SA7).
The presented physical model experiment data indicate that aboveground as well as belowground components of plants contribute to a dune and beach system’s resistance against erosion, as has been seen in similar and related studies. For example, the present study found that the rotational stiffness of plant stems and structures contributed to reductions of turbulence and swash flow velocity, though rotational stiffness could not be statistically tied to erosion reduction. This calming effect in both turbulence and flow velocity has been reported from measurements in hydrological settings including emergent vegetation in wetlands (Leonard and Luther, 1995) and beach macroalgae (Innocenti et al., 2018), and related to differing dune plant structures (Maximiliano-Cordova et al., 2019; Oderiz et al., 2020; Innocenti et al., 2021).
The results of the present study also found that the surface area of aboveground plant structures created a more dissipative shoreline and a less energetic swash zone, and that this was indeed related to less erosion. Feagin et al. (2019) similarly found erosion reduction by aboveground structures that are connected to belowground structures, as found in this study and as in the field, but further explained that the belowground structures alone provided still better protection. Their findings implied that while the aboveground structures do dissipate wave energy and reduce velocities, they also provide a cantilever upon which waves can begin to leverage a plant. This cantilever effect can ultimately uproot a plant, extract sediment, and offset the erosion reduction provided by the energy dissipation effect. While the current study did not similarly partition aboveground versus belowground structures into separate treatments, it points to the importance of belowground structures in a novel way.
In particular, the present study shows that the fine roots of plants are a key determinant of erosion reduction. The results show that for erosion reduction, the fine roots are more important than coarse roots, mycorrhizal colonization, or aboveground plant structures. Moreover, these fine roots provide a unique mechanism that binds the sediment grains together and prevents gravity-driving slumping and collapse. Fine roots uniquely enhance the sediment shear strength.
It should be noted that with regards to statistical modeling, beach and dune morphological variables (such as the location and size of the sandbar, or the distance of the ADV head to the sediment surface) were accounted for during the statistical modeling process, implying that plant surface area played a causal role. In other words, it was not some feedback mechanism between plant surface area and shoreline morphology that modified swash hydrodynamics. Rather, plant surface area reduced swash velocity, TKE, and wave reflection independently of confounding shoreline features (see Appendix for additional details on the interplay between confounding variables and plant variables). This means that even in the absence of changes in morphological parameters, the surface area of the plants contributes to wave energy dissipation.
The effect of vegetation on erosion was substantial under the presented experiment conditions (based off Model A6, see Appendix). Erosion reduction of up to approximately 1/3 (37%) of the erosion experienced by the control trials could be achieved if the aboveground plant surface area of trial SP3 and the biomass of fine roots of trial PA3 were combined. Kobayashi et al. (2013), Sigren et al. (2014), and Silva et al. (2016), among others, have obtained similar values of erosion reduction in physical model studies due to the presence of vegetation (real or surrogate) on the seaward dune face. The temporal aspect of this erosion reduction by vegetation should also enter flood risk management considerations since the time to a complete breach during storm impact is extended. A prolonged dune breach could mean that vegetation will enhance dune storm damage mitigation with regards to homes and infrastructure, though that would depend on the flume results scaling to larger systems (see section 4.3).
Taking the findings from this study a step further, dune management and restoration practices could consider adopting a combination of multiple native plant morphotypes with specific beneficial characteristics to reduce storm damage and erosion and further enhance the observed effects of vegetation. For example, a combination of species targeting extensive fine root system development as well as substantial low-elevation aboveground surface area may maximize desired benefits. Those plant morphotypes that err on the side of root production would be more important in areas where a scarp forms (i.e., the dune ridge and slopes) because of their contribution to sediment shear strength (at least for a wave collision scenario that is similar to the one that was used in this flume experiment).
There were some limitations to the approach taken in this experiment. Due to the usage of a small-scale wave flume, the obtained results are not directly transferrable to larger dune systems or longer temporal events. First, if a comparable amount of S. portulacastrum was growing in situ as was used in this experiment’s S. portulacastrum 9 week trial (SP3), it would likely not reduce erosion by the same amount as was observed in the flume (∼26%) during a real-life storm surge. This discrepancy occurs because the wave parameters and shoreline profile were scaled down for the experiment, while the plants were not. However, the general trends that were observed in the flume should take place in situ (i.e., more roots would reduce more erosion). However, the true magnitude of the erosion reducing effects in scaled up dune and beach systems remains undetermined.
Second, the obtained results do not account for the dynamics that may occur during a longer temporal event, such as during a hurricane. At time scales of hours to days, such events progress through multiple regimes of erosion (Sallenger Jr., 2000), often beginning with swash and runup, then transitioning into collision, and finally resulting in overtopping or inundation of the dune. The obtained results solely apply to the dynamics that occur during the wave collision regime.
Third, the vegetated trials did not include replicates to allow for some form of ensemble averaging or determination of variability. While this is certainly a limitation the choice to run experiments on four different plant morphotypes at three different transplant age levels showed significant trends detailed in the conclusions that would likely not change even if replicate trials were conducted. The minimal variability observed across the three control trial replicates further underscores that point.
There were also some statistical limitations to the approach taken in this experiment. For example, if a variable was not a significant determinant of erosion or a physical process, this does not necessarily mean that it was irrelevant for in situ dune systems. Rather, the methodology utilized to model these variables could have tested an inadequate range of variation. For example, sediment aggregation should, in concept, lead to less erosion in sand dunes. If a substantial amount of sediment particles is bound together in a water-stable manner as to shift that sediment’s effective grain size distribution, less erosion would take place. Such sediment binding caused by mycorrhizal fungi has been measured in dune systems (Forster and Nicholson, 1981), but may take place over many years as organic materials build up in soil and mycorrhizal fungi increase in abundance. The time allotted for plant growth in this experiment (3–9 weeks) was probably not a long enough time for these soil structures to develop. Therefore, sediment aggregation could be important in dune erosion, but the range of parameters tested in this experiment failed to yield statistically significant results.
Additionally, the collinear relationship of certain plant parameters means that statistical modeling techniques could not verify each variable’s independent effect on dependent variables. Fine and coarse roots, for example, were collinear during this experiment. Fine root biomass density was found to be a more significant predictor of dune erosion during statistical modeling but both variables could be important to dune erosion resistance. Further testing of a broader range of variable combinations (a non-collinear dataset) would need to be conducted to parse the independent contribution of these two belowground variables.
The physical model experiment conducted in a wave flume led to the conclusion that plant-related parameters that change aboveground as well as belowground properties of a vegetated dune can significantly influence dune erosion. Their net effect was to reduce wave-induced erosion volume by up to 37%. The surface area of aboveground plant structures was related to decreases in turbulence and uprush/backwash velocities, helping create a shoreline that was more effective at dissipating incoming wave energy. Fine roots increased the mechanical strength of sediment, making it more resistant to shearing forces and preventing sediment from slumping into incoming waves. In concept, increasing the quantity of fine roots would create a dune system more resistant to erosive forces. Future research on this topic could expand to larger length and temporal scales, with the aim of guiding coastal dune management and restoration techniques.
The original contributions presented in the study are included in the article/Supplementary Material, further inquiries can be directed to the corresponding author.
JF: Experiment design, methodology, supervision, resources and funding, data collection, data analysis, writing, review, editing. JS: Data collection, data analysis, writing. RF: Methodology, review and editing. AA: Resources, methodology, review and editing.
This research was supported in part by the Texas A&M University at Galveston Research and Development Fund. JF was supported in part by National Science Foundation Grant No. OISE-1545837 and an Institutional Grant (NA14OAR4170102) to the Texas Sea Grant College Program from the National Sea Grant Office, National Oceanic and Atmospheric Administration, U.S. Department of Commerce. Rusty Feagin was supported in part by National Science Foundation Grant No. PO-1756477 and the Texas A&M University T3 Fund.
The authors declare that the research was conducted in the absence of any commercial or financial relationships that could be construed as a potential conflict of interest.
All claims expressed in this article are solely those of the authors and do not necessarily represent those of their affiliated organizations, or those of the publisher, the editors and the reviewers. Any product that may be evaluated in this article, or claim that may be made by its manufacturer, is not guaranteed or endorsed by the publisher.
The work presented here is adapted and synthesized from Chapter 2 of the Ph.D. dissertation by co-author Jacob M. Sigren (2017) and has not been previously published in peer-reviewed journal form. Furthermore, the authors would like to thank Robert C. Tyler, Taylor Hennessy, and Melissa D’Amore for their help conducting the wave flume experiments.
The Supplementary Material for this article can be found online at: https://www.frontiersin.org/articles/10.3389/fbuil.2022.904837/full#supplementary-material
Augustin, L. N., Irish, J. L., and Lynett, P. (2009). Laboratory and Numerical Studies of Wave Damping by Emergent and Near-Emergent Wetland Vegetation. Coast. Eng. 56 (3), 332–340. doi:10.1016/j.coastaleng.2008.09.004
Bouma, T. J., Vries, M. B. D., and Herman, P. M. J. (2010). Comparing Ecosystem Engineering Efficiency of Two Plant Species with Contrasting Growth Strategies. Ecology 91 (9), 2696–2704. doi:10.1890/09-0690.1
Coops, H., Geilen, N., Verheij, H. J., Boeters, R., and Velde, G. (1996). Interactions between Waves, Bank Erosion and Emergent Vegetation: an Experimental Study in a Wave Tank. Aquat. Bot. 53 (3-4), 187–198. doi:10.1016/0304-3770(96)01027-3
De Baets, S., Poesen, J., Reubens, B., Wemans, K., De Baerdemaeker, J., and Muys, B. (2008). Root Tensile Strength and Root Distribution of Typical Mediterranean Plant Species and Their Contribution to Soil Shear Strength. Plant Soil 305 (1-2), 207–226.
Fan, C.-C., and Su, C.-F. (2008). Role of Roots in the Shear Strength of Root-Reinforced Soils with High Moisture Content. Ecol. Eng. 33 (2), 157–166. doi:10.1016/j.ecoleng.2008.02.013
Feagin, R. A., Figlus, J., Zinnert, J. C., Sigren, J., Martínez, M. L., Silva, R., et al. (2015). Going with the Flow or against the Grain? the Promise of Vegetation for Protecting Beaches, Dunes, and Barrier Islands from Erosion. Front. Ecol. Environ. 13 (4), 203–210. doi:10.1890/140218
Feagin, R. A., Furman, M., Salgado, K., Martinez, M. L., Innocenti, R. A., Eubanks, K., et al. (2019). The Role of Beach and Sand Dune Vegetation in Mediating Wave Run up Erosion. Estuar. Coast. Shelf Sci. 219, 97–106. doi:10.1016/j.ecss.2019.01.018
Forster, S. M., and Nicolson, T. H. (1981). Microbial Aggregation of Sand in a Maritime Dune Succession. Soil Biol. Biochem. 13 (3), 205–208. doi:10.1016/0038-0717(81)90021-3
Gedan, K. B., Kirwan, M. L., Wolanski, E., Barbier, E. B., and Silliman, B. R. (2011). The Present and Future Role of Coastal Wetland Vegetation in Protecting Shorelines: Answering Recent Challenges to the Paradigm. Clim. Change 106 (1), 7–29.
Genet, M., Stokes, A., Salin, F., Mickovski, S. B., Fourcaud, T., Dumail, J. F., et al. (2007). The Influence of Cellulose Content on Tensile Strength in Tree Roots. Plant Soil 103, 3–11.
Innocenti, R. A., Feagin, R. A., Charbonneau, B. R., Figlus, J., Lomonaco, P., Wengrove, M., et al. (2021). The Effects of Plant Structure and Flow Properties on the Physical Response of Coastal Dune Plants to Wind and Wave Run-Up. Estuar. Coast. Shelf Sci. 261, 107556. doi:10.1016/j.ecss.2021.107556
Innocenti, R. A., Feagin, R. A., and Huff, T. P. (2018). The Role of Sargassum Macroalgal Wrack in Reducing Coastal Erosion. Estuar. Coast. Shelf Sci. 214, 82–88. doi:10.1016/j.ecss.2018.09.021
Kobayashi, N., Gralher, C., and Do, K. (2013). Effects of Woody Plants on Dune Erosion and over Wash. J. Waterw. Port, Coast. Ocean Eng. 139 (6). doi:10.1061/(asce)ww.1943-5460.0000200
Leonard, L. A., and Luther, M. E. (1995). Flow Hydrodynamics in Tidal Marsh Canopies. Limnol. Oceanogr. 40 (8), 1474–1484. doi:10.4319/lo.1995.40.8.1474
Mansard, E. P. D., and Funke, E. R. (1980). The Measurement of Incident and Reflected Spectra Using a Least Squares Method. Proc. Int. Conf. Coast. Eng., 154–172. doi:10.1061/9780872622647.008
Maximiliano-Cordova, C., Martínez, M. L., Silva, R., Hesp, P. A., Guevara, R., and Landgrave, R. (2021). Assessing the Impact of a Winter Storm on the Beach and Dune Systems and Erosion Mitigation by Plants. Front. Mar. Sci. 8, 734036. doi:10.3389/fmars.2021.734036
Maximiliano-Cordova, C., Salgado, K., Martínez, M. L., Mendoza, E., Silva, R., Guevara, R., et al. (2019). Does the Functional Richness of Plants Reduce Wave Erosion on Embryo Coastal Dunes? Estuaries Coasts 42, 1730–1741. doi:10.1007/s12237-019-00537-x
Mendoza, E., Odériz, I., Martínez, M. L., and Silva, R. (2017). Measurements and Modelling of Small Scale Processes of Vegetation Preventing Dune Erosion. J. Coast. Res. 77 (10077), 19–27. doi:10.2112/si77-003.1
Miller, R. M., and Jastrow, J. D. (1990). Hierarchy of Root and Mycorrhizal Fungal Interactions with Soil Aggregation. Soil Biol. Biochem. 22 (5), 579–584. doi:10.1016/0038-0717(90)90001-g
Morton, J. B., and Amarasinghe, R. (2006). “Plant and Mycorrhizal Root Lengths. Technical Report,” in International Culture Collection of Vesicular-Arbuscular Mycorrhizal Fungi (Morgantown, WV: West Virginia University).
Odériz, I., Knöchelmann, N., Silva, R., Feagin, R. A., Martínez, M. L., and Mendoza, E. (2020). Reinforcement of Vegetated and Unvegetated Dunes by a Rocky Core: A Viable Alternative for Dissipating Waves and Providing Protection? Coast. Eng. 158, 103675.
Roelvink, D., Reniers, A., van Dongeren, A., van Thiel de Vries, J., McCall, R., and Lescinski, J. (2009). Modeling Storm Impacts on Beaches, Dunes and Barrier Islands. Coast. Eng. 56 (11-12), 1133–1152. doi:10.1142/9789814277426_0140
Sigren, J. M. (2017). Coastal Dunes and Dune Vegetation: Interdisciplinary Research on Storm Protection, Erosion, and Ecosystem Restoration. Galveston, TX: Ph.D. Dissertation. Texas A&M University.
Sigren, J. M., Figlus, J., and Armitage, A. R. (2014). Coastal Sand Dunes and Dune Vegetation: Restoration, Erosion, and Storm Protection. Shore Beach 82 (4), 5–12.
Sigren, J. M., Figlus, J., Highfield, W., Feagin, R. A., and Armitage, A. R. (2016). The Effects of Coastal Dune Volume and Vegetation on Storm-Induced Property Damage: Analysis from Hurricane Ike. J. Coast. Res. 34 (1), 164–173.
Silva, R., Martínez, M. L., Odériz, I., Mendoza, E., and Feagin, R. A. (2016). Response of Vegetated Dune-Beach Systems to Storm Conditions. Coast. Eng. 109, 53–62. doi:10.1016/j.coastaleng.2015.12.007
Thampanya, U., Vermaat, J., Sinsakul, S., and Panapitukkul, N. (2006). Coastal Erosion and Mangrove Progradation of Southern thailand. Estuar. Coast. Shelf Sci. 68 (1&2), 75–85. doi:10.1016/j.ecss.2006.01.011
Yang, S. L., Shi, B. W., Bouma, T. J., Ysebaert, T., and Luo, X. X. (2012). Wave Attenuation at a Salt Marsh Margin: a Case Study of an Exposed Coast on the Yangtze Estuary. Estuaries Coasts 35 (1), 169–182. doi:10.1007/s12237-011-9424-4
Keywords: dune, erosion, vegetation, physical model, mycorrhizal fungi, multivariate statistics
Citation: Figlus J, Sigren JM, Feagin RA and Armitage AR (2022) The Unique Ability of Fine Roots to Reduce Vegetated Coastal Dune Erosion During Wave Collision. Front. Built Environ. 8:904837. doi: 10.3389/fbuil.2022.904837
Received: 25 March 2022; Accepted: 22 June 2022;
Published: 12 July 2022.
Edited by:
Rodolfo Silva, National Autonomous University of Mexico, MexicoReviewed by:
Itxaso Odériz, Environmental Hydraulics Institute (IHCantabria), SpainCopyright © 2022 Figlus, Sigren, Feagin and Armitage. This is an open-access article distributed under the terms of the Creative Commons Attribution License (CC BY). The use, distribution or reproduction in other forums is permitted, provided the original author(s) and the copyright owner(s) are credited and that the original publication in this journal is cited, in accordance with accepted academic practice. No use, distribution or reproduction is permitted which does not comply with these terms.
*Correspondence: Jens Figlus, ZmlnbHVzakB0YW11LmVkdQ==
Disclaimer: All claims expressed in this article are solely those of the authors and do not necessarily represent those of their affiliated organizations, or those of the publisher, the editors and the reviewers. Any product that may be evaluated in this article or claim that may be made by its manufacturer is not guaranteed or endorsed by the publisher.
Research integrity at Frontiers
Learn more about the work of our research integrity team to safeguard the quality of each article we publish.