 Scott Baker
 Enda Murphy
 Andrew Cornett
 Paul Knox1
94% of researchers rate our articles as excellent or good
Learn more about the work of our research integrity team to safeguard the quality of each article we publish.
Find out more
ORIGINAL RESEARCH article
Front. Built Environ., 08 June 2022
Sec. Coastal and Offshore Engineering
Volume 8 - 2022 | https://doi.org/10.3389/fbuil.2022.893664
This article is part of the Research TopicNatural and Nature-Based Features for Flood Risk ManagementView all 17 articles
Scaled laboratory experiments were conducted to investigate the effectiveness of marsh vegetation in dissipating wave energy and reducing wave overtopping discharges at the crest of a dyke located immediately landward of the marsh. Model dyke and marsh platform features, loosely based on archetypes found in Atlantic Canada, were constructed in a wave basin at 1:20 scale and exposed to a broad range of waves and water level conditions. The 2D experiments were conducted using idealized surrogate vegetation (both rigid and flexible), and the model setup featured four parallel flumes which enabled four alternative configurations to be investigated simultaneously. The experiments investigated the sensitivity of wave attenuation and overtopping to the length of the vegetation field, vegetation characteristics (stem density, height, and flexibility) and varying water levels and wave conditions. The study outputs have helped to address knowledge gaps and provide evidence to support and inform broader use of hybrid marsh-dyke systems and managed dyke realignment to help manage flood and erosion risk and improve coastal resilience in Canada and internationally. This research confirmed the benefit of tidal flats hosting coastal marshes for attenuating waves, reducing overtopping volumes and lessening damage to dyke structures. As expected, taller and denser marshes were more effective in attenuating wave energy for a given marsh width.
The global risk associated with coastal flooding and erosion has increased substantially over the past several decades, as a consequence of population growth, development in coastal zones and climate change effects including sea-level rise (Jongman, 2018). Projections for the 21st century suggest that these trends will continue (Muis et al., 2020), and, in the absence of intervention or adaptation, the exposure of people and valued assets to episodic coastal flooding could increase by nearly half (Kirezci et al., 2020). There is a large and growing body of evidence surrounding the benefits of natural and nature-based solutions (NBS) as viable alternatives or complements to conventional (hard) engineering shore protection measures (Browder et al., 2019; Bridges et al., 2014; Spalding et al., 2014; Sutton-Grier et al., 2015; Moudrak et al., 2018; Sutton-Grier et al., 2018; Bridges et al., 2021). In particular, the value provided by coastal wetlands or marshes in supporting flood and erosion risk management objectives has been well demonstrated (Costanza et al., 2008; Arkema et al., 2013; Narayan et al., 2017; Piercy et al., 2021).
Coastal marsh systems deliver flood and erosion risk management benefits by attenuating waves and storm surges (Barbier et al., 2011), attracting and retaining sediment (Shepard et al., 2011), and by providing hydraulic storage (Barbier et al., 2011; Shepard et al., 2011; Webb et al., 2018); while at the same time providing a host of co-benefits (Spalding et al., 2014; Pontee et al., 2016; Piercy et al., 2021). Unlike hard structures, coastal marshes can self-adapt to rising sea levels under the right settings (Spalding et al., 2014; Piercy et al., 2021). For example, if sediment supply and accretion rates exceed sediment losses caused by erosion or other mechanisms, marsh growth can offset relative sea-level rise (Barbier et al., 2011; Pontee et al., 2016). Nature-based solutions for coastal hazard risk management that incorporate marsh systems can be implemented through conservation and restoration of existing or degraded marsh systems, landward realignment of hard defences resulting in restoration or generation of new marshes (e.g., managed dyke realignment), and construction of new wetland features (Piercy et al., 2021). The latter two forms of intervention (managed realignment and marsh construction) typically involve hybrid solutions (Spalding et al., 2014; Sutton-Grier et al., 2015; Pontee et al., 2016; Vuik et al., 2016; Jongman, 2018; Vuik et al., 2018), whereby hard structures are integrated with marsh and other vegetation features to provide flood and erosion risk management function. In the case of hybrid dyke-marsh systems, the presence of a foreshore salt marsh can reduce the failure probability of a landside dyke (Vuik et al., 2018), and reduce the costs of dyke maintenance and upgrades (Jongman, 2018). However, the lack of data and rigorous analyses demonstrating the performance and limitations of such hybrid NBS under a variety of environmental settings and metocean conditions remains a barrier to uptake (Sutton-Grier et al., 2015; Morris et al., 2018).
Coastal communities and infrastructure in Canada are vulnerable to flooding and erosion caused by water level and wave extremes (Lemmen et al., 2016), and the risks are expected to increase over the coming decades due to urbanization, rising sea levels, declining sea ice cover, and shifting weather patterns associated with climate change (Bush and Lemmen, 2019). The risk to coastal communities, including damage to infrastructure, is one of the top climate change risks facing Canada (Council of Canadian Academies, 2019). Some coastal regions of Canada have a legacy of dyke construction, which has facilitated settlement, population growth and agricultural activities in low-lying coastal regions (van Proosdij et al., 2013; Sherren et al., 2019). Many of these older dykes now provide a certain level of protection to communities, valued land and assets from coastal hazards (Barron et al., 2012; van Proosdij et al., 2013; Doberstein et al., 2019), although many have been poorly maintained and are in need of repair (van Proosdij et al., 2013). The resources demanded to maintain and upgrade this ageing infrastructure stock are substantial (Barron et al., 2012; Doberstein et al., 2019; Sherren et al., 2019), particularly in the face of rising relative sea levels. In some places, the dykes have contributed to loss of valued salt marsh ecosystems (Virgin et al., 2020). Over-reliance on dykes as a sole flood protection strategy can also introduce vulnerabilities, for example by creating a false perception of risk and encouraging development in flood-prone areas, or leading to catastrophic consequences in the event of a dyke breach or failure (Jongman, 2018). Natural or nature-based features, such as marshes and barrier islands, can act in concert with dykes as part of multiple-lines-of-defence strategies to increase engineering redundancy, enhance the level of flood protection provided, and reduce the costs of dyke maintenance or upgrades (Barron et al., 2012; Jongman, 2018). Empirical field evidence of the effectiveness of hybrid dyke-marsh systems is being developed for a number of managed realignment pilot projects in Atlantic Canada, which were typically implemented by: (i) constructing new dykes landward of legacy agricultural dykes, and (ii) breaching the old dykes to restore tidal flows and facilitate marsh restoration (Sherren et al., 2019; Virgin et al., 2020). Although managed dyke realignment and hybrid-dyke marsh systems are common approaches to flood and erosion risk management in many of the world’s coastal regions, such solutions still pose some risk in the Canadian context. This is due, in part, to uncertainty surrounding the performance of these nature-based solutions in diverse Canadian coastal environmental settings, which are characterized by extreme variability in regional climates, tidal ranges, rates of relative sea-level rise, and exposure to wave energy. An improved understanding of the performance of hybrid dyke-marsh systems under a broad range of conditions is needed to guide applications in Canada, and in other regions where uptake has been relatively low.
This paper describes a series of scaled laboratory experiments conducted to investigate the hydraulic performance of hybrid marsh-dyke systems, and in particular examine the effectiveness of coastal marshes in dissipating wave energy and reducing wave overtopping under a broad range of wave and water level conditions representative of Canadian coastal regions. The experiments used physical modelling to investigate dyke and marsh platform features typically found in the Tantramar Marsh on the Chignecto Isthmus in the upper Bay of Fundy, shared by the Canadian provinces of New Brunswick and Nova Scotia, which features Spartina alterniflora (smooth cordgrass) vegetation. It is worth noting that the upper Chignecto Bay can be characterized as a macro-tidal environment where high tide typically reaches from 9.5 to 14 m above chart datum. In these experiments, the marsh vegetation was represented using both rigid and flexible artificial or surrogate vegetation designed to approximate the effect of real vegetation on wave attenuation. The experimental study is unique in several respects:
• Testing was conducted with identical wave conditions in four identical flumes arranged side-by-side, so that the effect of controlled changes in various marsh properties including surrogate plant density, stem height, stem flexibility and marsh width (in the direction of wave propagation) could be directly assessed by comparing data and observations obtained at the same time from neighbouring flumes.
• In contrast with many previous studies which focused on wave-plant interaction at full scale or near full scale, this study focused on assessing the changes in wave properties across a 4.75 m wide (95 m wide at full scale) artificial coastal marsh and their interaction with a dyke located immediately landward of the marsh. The effect of various marsh properties and characteristics on the wave attenuation, the volume of wave overtopping and extent of damage (to the dyke) was assessed.
• The artificial marsh’s effect on wave attenuation was investigated over a broad range of significant wave height (Hm0), peak period (Tp) and local water depth (h) or plant submergence.
• Although the experiments were conducted at 1/20 scale, the wave conditions included significant wave heights and periods up to 0.15 m and 3.35 s, representing full scale conditions with Hm0 = 3 m and Tp = 15 s, which are believed to be more energetic than those considered in previous experimental research involving coastal marshes.
This study used an artificial marsh to provide new information on the performance of marsh-dyke systems in a broad range of wave and water level conditions, and the sensitivity of wave attenuation, wave overtopping and damage to variables such as plant density, plant height (submergence), stem flexibility, marsh width, significant wave height, peak period and local water depth. The methods and results described in the paper may be useful to others interested in representing coastal marshes in physical or numerical models of coastal processes and shoreline developments incorporating natural and nature-based features.
Section 2 summarizes the results from a literature review on how marsh vegetation has been represented in past laboratory experiments, while Section 3 introduces the existing theory and formulae for predicting wave attenuation by marsh vegetation. New 2D experiments conducted at 1/20 scale with coastal marshes comprised of surrogate vegetation fronting dyke structures are described in Section 4. Section 5 presents an analysis and discussion of the new experimental data, in which many of the formulae presented in Section 3 are used, while the main conclusions from this work are summarized in Section 6.
The experiments discussed in the present work were conducted using idealized surrogate vegetation representing S. alterniflora. The stem densities, heights and diameters of the model vegetation were selected based on findings in literature (Percy, 2000; Lightbody and Nepf, 2006; Cranford et al., 2008; Anderson and Smith, 2014; Nepf et al., 2017; Feagin et al., 2019; Pinsky et al., 2021). For this study, the average stem diameter and height of S. alterniflora was taken as 8.7 mm and 1.80 m respectively, though these values depend on the season, the geographic location, and a number of environmental factors.
Some species of vegetation may be successfully represented using rigid elements such as aluminum rods (mangroves) or wooden dowels (salt marsh), despite demonstrating some degree of flexibility in reality (Wu et al., 2011; Arkema et al., 2013; Maza et al., 2019; van Veelen et al., 2020). A combined field-numerical study demonstrated that S. alterniflora can be reasonably modelled as a rigid cylinder (Jadhav et al., 2013). Similarly, Augustin et al. (2009) modelled S. alterniflora using both rigid and flexible elements and found that the two models produced similar attenuation effects for the tested flow conditions. Thus, the appropriate selection of rigid versus flexible elements may depend on the experimental hydrodynamic conditions.
These elements are often selected to mimic the geometric parameters of the target vegetation, including stem/blade length, width, diameter and planting density (Arkema et al., 2013; Anderson and Smith, 2014; Ozeren et al., 2014; Maza et al., 2019). For small-scale physical models with surrogate vegetation, stem diameters should only be downscaled if flows remain in the rough-turbulent range, as overly small stem diameters can lead to overly small stem Reynolds numbers and significant distortions in drag coefficient (Blackmar et al., 2012).
Table 1 presents a concise summary of previous experimental studies conducted with both real and surrogate marsh vegetation.
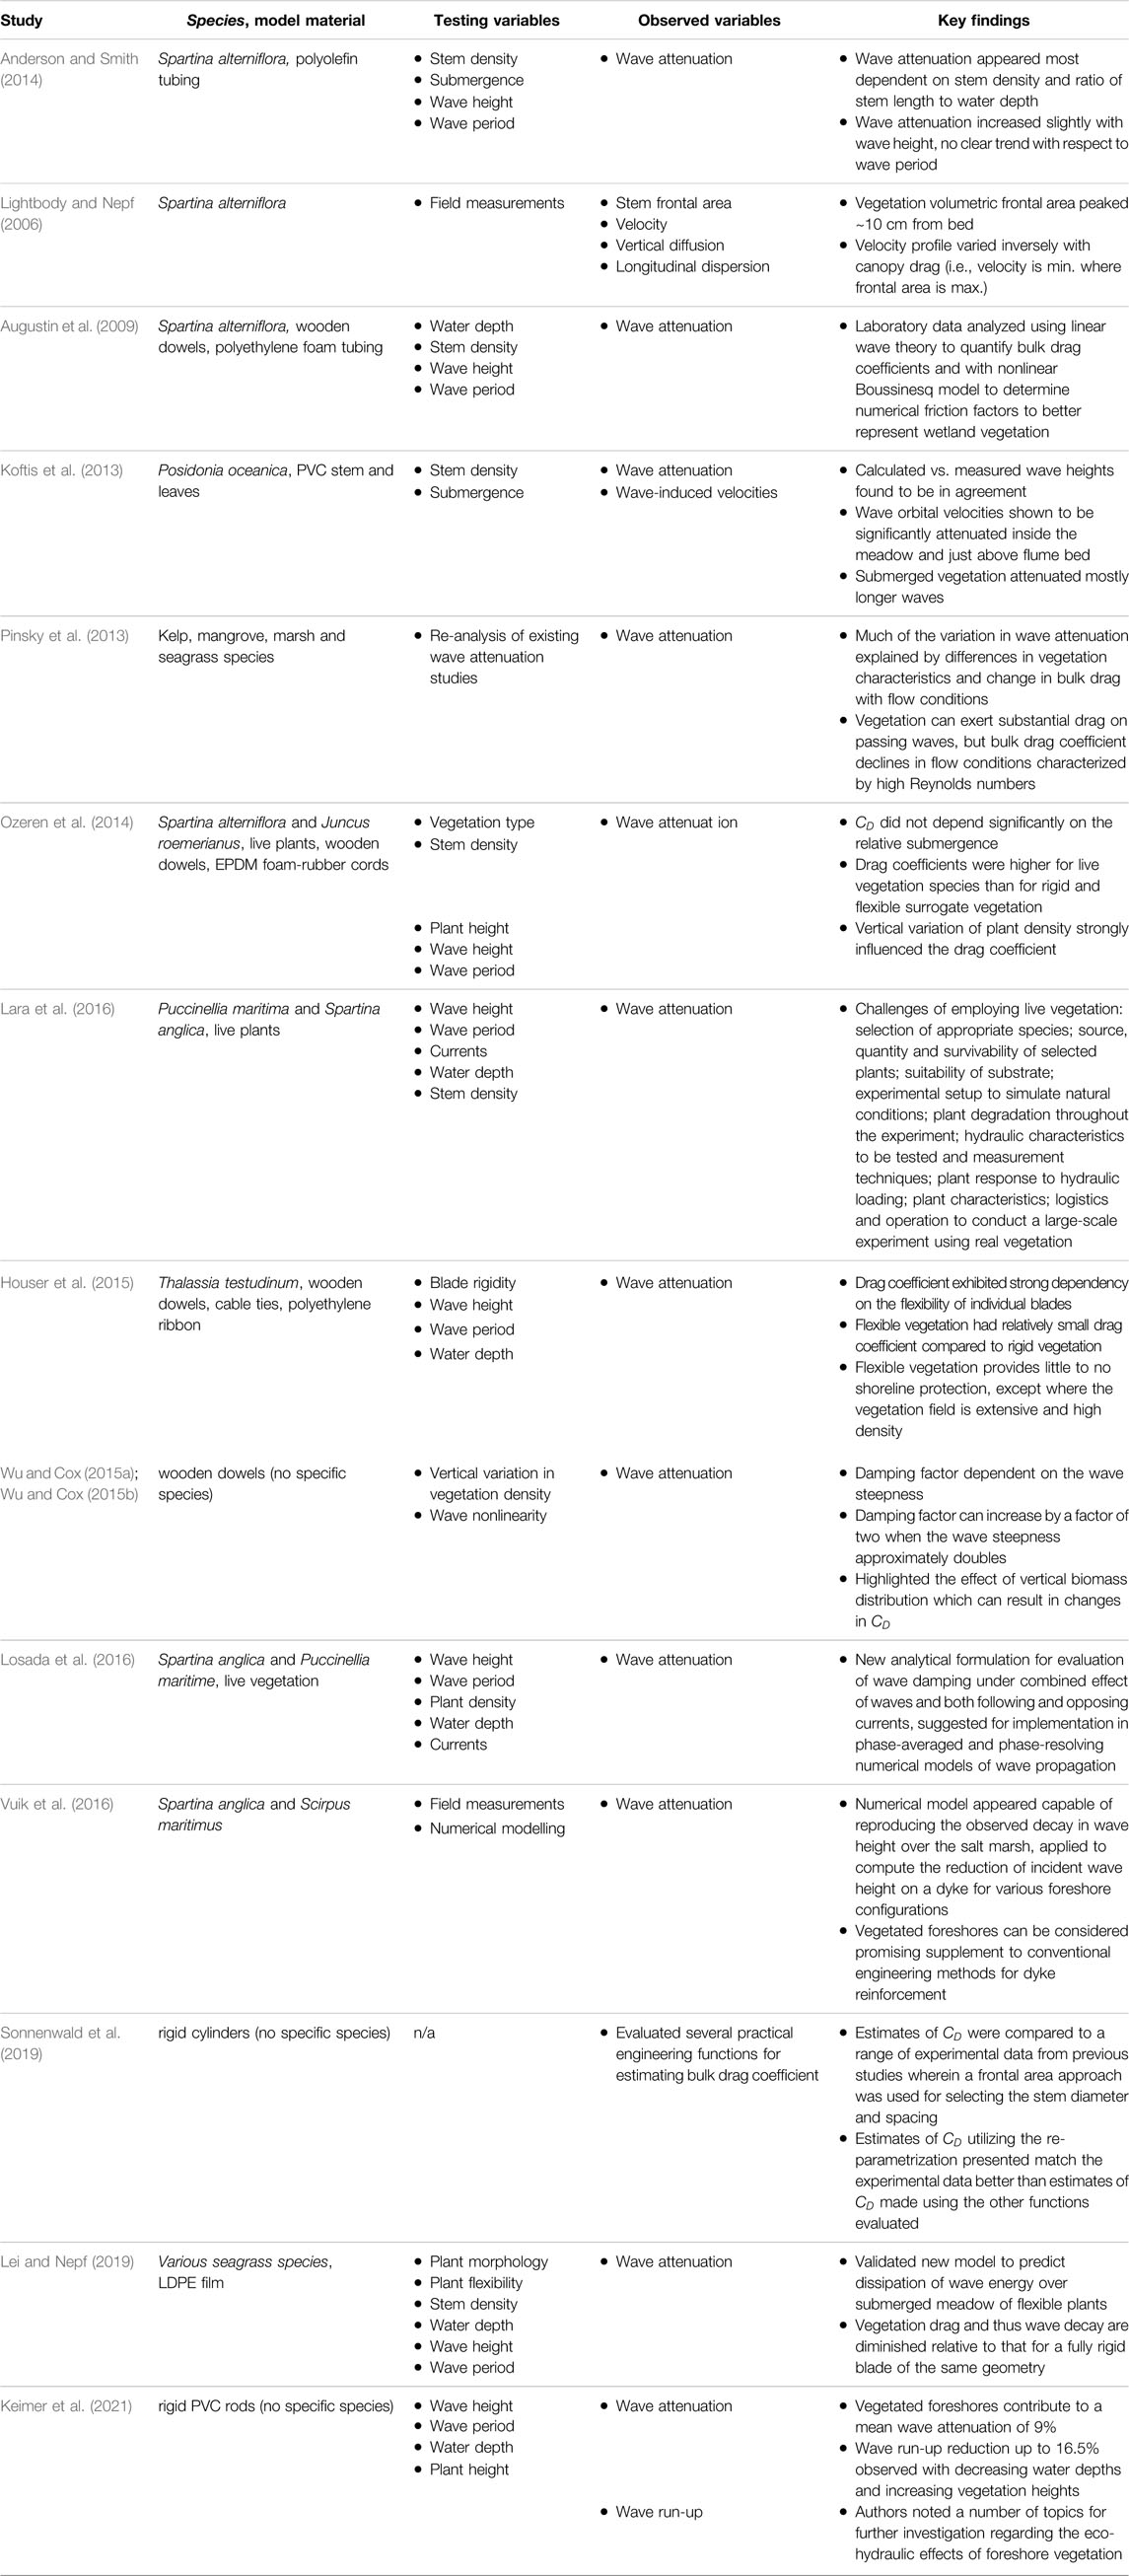
TABLE 1. Summary of previous experimental studies with marsh vegetation.
Markov (2021) conducted an extensive review of state-of-the-art physical and numerical modelling research in the use of vegetation for coastal protection. Based on the reviewed body of literature, a number of knowledge gaps and recommendations for future research were identified, in particular: developing knowledge of species-specific attenuation capacity considering seasonal variation in biomass and plant characteristics; comparing small- and large-scale models to quantify scaling effects, addressing uncertainties associated with modelling NBS at a small-scale and thus allowing practitioners to better interpret the results of small-scale testing for the design of NBS; testing a wider ranger range of hydrodynamic conditions to determine the impact of wave period on attenuation capacity, with the aim to address presently conflicting results from previous experimental works; perform further testing on stem density and arrangement.
In summary, although there have been numerous previous experimental studies of wave-vegetation interaction, the majority of studies were conducted at prototype or near-prototype scale, and therefore considered processes over a rather limited spatial extent and with a narrow range of conditions (waves and water levels). In addition, much of the previous work dealt only with the effect of vegetation itself, without looking at the broader application of combined systems (e.g., vegetation fronting coastal dykes). While this approach limits or eliminates model scaling effects, knowledge gaps remain surrounding application of the results to real-world situations and larger spatial extents. The absence of studies covering a broad range of environmental conditions and longer sections of marsh is a barrier to understanding how salt marsh creation or restoration can be practically implemented to provide optimal flood and erosion risk management function. As described above, a number of challenges exist for using live vegetation in experimental studies. Real vegetation cannot be used for assessing performance at model scale, whereas the use of surrogate vegetation provides the ability to change the model scale as needed and study processes over larger areas. In this work, a scaled physical modelling approach in a large wave basin facility is used to address some of these gaps and better inform design of hybrid marsh-dyke systems.
As described in many previous studies [e.g., 1,35,44], the prediction of wave attenuation over a coastal marsh can be based on the energy conservation equation. Assuming a flat bed, linear wave theory, invariant quantities with depth, and rigid vegetation (no swaying motion), the regular wave height profile along the vegetation field can be written as (Dalrymple et al., 1984):
where
And
where
Drag coefficients, energy dissipation and wave attenuation are a strong function of Reynolds number and Keulegan–Carpenter number (Keulegan and Carpenter, 1958). The stem Reynolds number is calculated as :
where
where
The Keulegan–Carpenter number :
Describes the relative importance of drag forces versus inertia forces for objects in an oscillatory fluid flow. For relatively small values of
where
The present study was conducted in the National Research Council of Canada’s (NRC) 63 m long by 14 m wide by 1.5 m tall Coastal Wave Basin (CWB). The CWB is equipped with a computer-controlled wave machine capable of generating irregular long-crested waves with significant wave heights up to ∼0.35 m (at model scale). The active wave absorption feature was not enabled during this study.
A length scale of 1/20 was adopted for the experiments, and Froude scaling was used to relate most (but not all) conditions in the model to corresponding conditions at full scale. The 1/20 scale factor, together with the chosen wave conditions and the fact that the surrogate plant stems in the model were purposely over-sized, ensured that the wave-driven flows around the model vegetation and model armour stones on the dyke surface remained rough-turbulent at all times, as in nature. Preserving rough-turbulent flow in the model was essential to minimizing scale effects and preserving the realism of the wave-plant and wave-structure interactions in the physical model.
The 14 m wide CWB was subdivided into four separate 1.22 m wide flumes by erecting parallel masonry block walls (see Figure 1). This setup created four identical test flumes and allowed four different marshes to be built and evaluated at the same time, one per flume, with identical incident wave conditions in front of each marsh. Each flume included an identical scaled reproduction of the typical sloping foreshore along the edge of the Tantramar Marsh on the Chignecto Isthmus, as well as an idealized model dyke structure (see Figure 2). A ∼1V:11H foreshore slope followed by a 4.75 m long (95 m at full scale) horizontal tidal flat was created by rigidly securing thick plywood sheets to the flume walls.
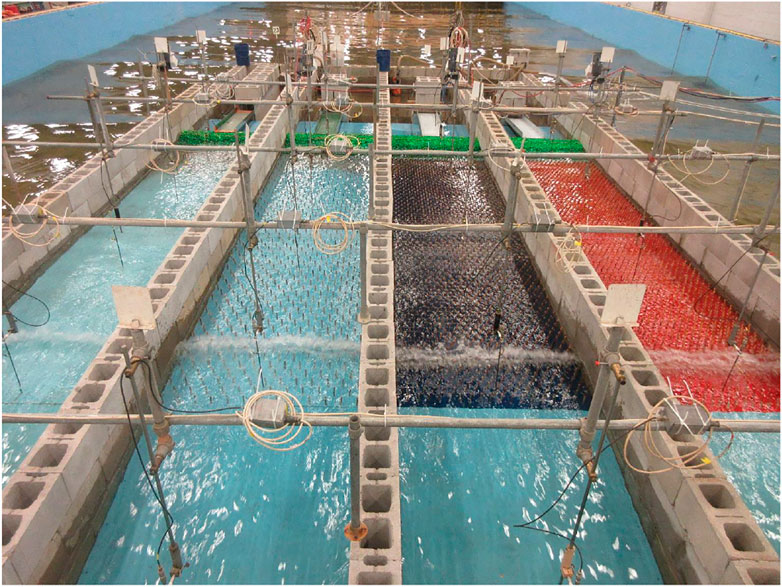
FIGURE 1. Simultaneous parallel testing of wave attenuation across four coastal marshes with different densities of surrogate vegetation (onshore view).
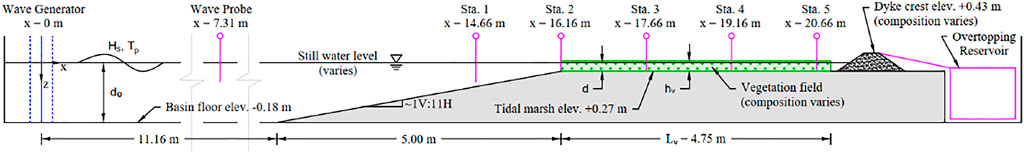
FIGURE 2. Definition sketch of the experimental setup (Scale 1V:0.5H).
The floor of the wave basin at the toe of the sloping foreshore was assigned an elevation of −0.18 m (corresponding to −3.50 m at full scale), while the tidal flat elevation was +0.27 m (+5.40 m at full scale). Water depths on the tidal flat in this study ranged from 0.05 to 0.12 m (1.0–2.4 m at full scale). The bathymetry helped to ensure that wave conditions at the edge of the marsh in the physical model, including the distribution of wave heights and the percentage of breaking and broken waves, was similar to head-on wave conditions at the edge of typical marshes in upper Chignecto Bay.
Marshes comprised of S. alterniflora were simulated on the 4.75 m long tidal flat using idealized surrogate vegetation fixed to the plywood. During the study, several different marshes with different plant characteristics could be modelled in each flume by swapping the vegetated plywood panels between tests. The sensitivity to plant density, plant height (and submergence), stem stiffness and marsh cross-shore width were investigated in this way.
These experiments were conducted using idealized surrogate vegetation representing S. alterniflora. Several configurations of rigid (cylindrical birch dowels) and flexible (Tygon polymer tubing) model vegetation were used during the experiments. The birch dowels were 3/8 inch (9.5 mm) in diameter, while the flexible tubing had outer and inner diameters of 5/16 inch (7.9 mm) and 1/4 inch (6.4 mm) respectively. It should be noted that vertical variability in stem diameter (tapering) or frontal area was not captured in this study. A tensile strength test indicated that Young’s modulus of the Tygon tubing was approximately 4.5 MPa, equivalent to ∼90 MPa at full scale.
Vegetated meadows were constructed by inserting dowels or tubing into 19 mm thick plywood sheets following a staggered arrangement. These vegetated panels were pre-constructed and easily interchangeable so that different vegetation conditions could be investigated during the experiments. The staggered arrangement of model plant stems shown in Figure 3 corresponds to the following relationship between stem spacing,
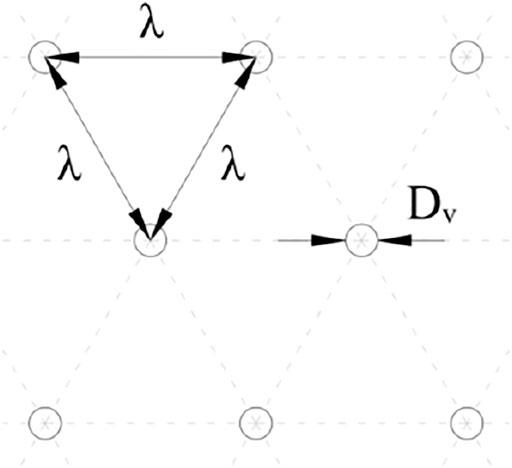
FIGURE 3. Arrangement of vegetation stems.
Scaling the stem diameter according to the model length scale was impractical since it would involve replicating hundreds of thousands of wire-thin stems. Moreover, this approach would cause the stem Reynolds number in the model to be significantly smaller than in prototype. Previous studies suggest wave attenuation is predominately associated with vegetation drag, which is proportional to the vegetation frontal area. Therefore the stems were scaled to maintain an equivalent solid volume fraction,

FIGURE 4. Comparative 1 m2 sections of surrogate meadows with 125, 295, and 450 stems/m2.
The performance of four different dyke designs located at the leeward end of the model test flumes was examined in these experiments (see Figure 5). The first design was considered typical for dykes throughout Atlantic Canada and featured an impermeable dyke core with two layers of riprap on the seaside only (herein referred to as a simply reinforced dyke). Three additional designs, representing various potential methods for upgrading the simply reinforced dyke, were also studied. The second design (armoured dyke) was created by adding two layers of riprap on the crest and leeside of the structure while maintaining the same crest elevation. The third design (widened reinforced dyke) was created by doubling the thickness of the seaside armour layer. The fourth design (simply reinforced dyke with berm) was created by adding a berm of armour stone on the seaside that was half the height of the structure and four armour stones in thickness. All four model dyke designs featured a crest elevation of +0.43 m (corresponding to +8.6 m above mean sea level at full scale), a typical crest elevation of older dykes in the Tantramar area (Lieske and Bornemann, 2012).
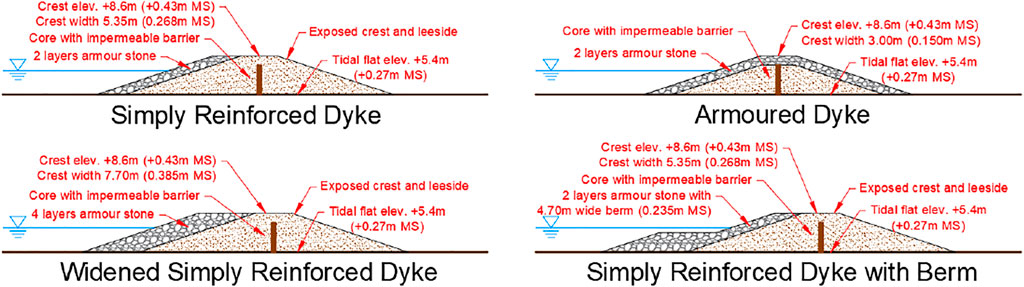
FIGURE 5. Cross-section drawings for the four dyke structures investigated.
Each model dyke was constructed using carefully prepared stone materials and construction methods. The dyke cores were constructed using a fine gravel with low permeability, but also included impermeable wooden barriers which prevented water from seeping through the dykes into the inland areas. Furthermore, a thin, flexible plastic membrane was placed between the core and armour materials to prevent water from flowing into the core. This method of construction allowed overtopping flows to pass through or above the armour stone on the dyke crest as would occur in the prototype situation. The landward end of each test flume was sealed off so that the water level behind each model structure could be kept lower (using submersible pumps), thereby simulating the situation where the inland area behind the dyke structure is not flooded, which is expected to be the most critical condition for rear slope stability.
The sizing of armour stone was based on Hudson formula calculations and also informed by Nova Scotia Department of Transportation Guidelines. The required armour stone mass
Particulars of the marsh-dyke system in each test flume during each test series are given in Table 2. Each setup was chosen in order to obtain results needed to independently assess the influence of key variables including: vegetation density, vegetation (stem) height, cross-shore marsh width, type of vegetation (rigid or flexible), and dyke structure type. For Test Series 2, the dyke structures were replaced with gently sloping gravel beaches featuring less than 5% wave reflectance, so that wave conditions across the artificial marshes could be measured with minimal influence of reflected waves. Hence, much of the analysis concerning wave attenuation presented in the following Section is based on data gathered during Test Series 2.
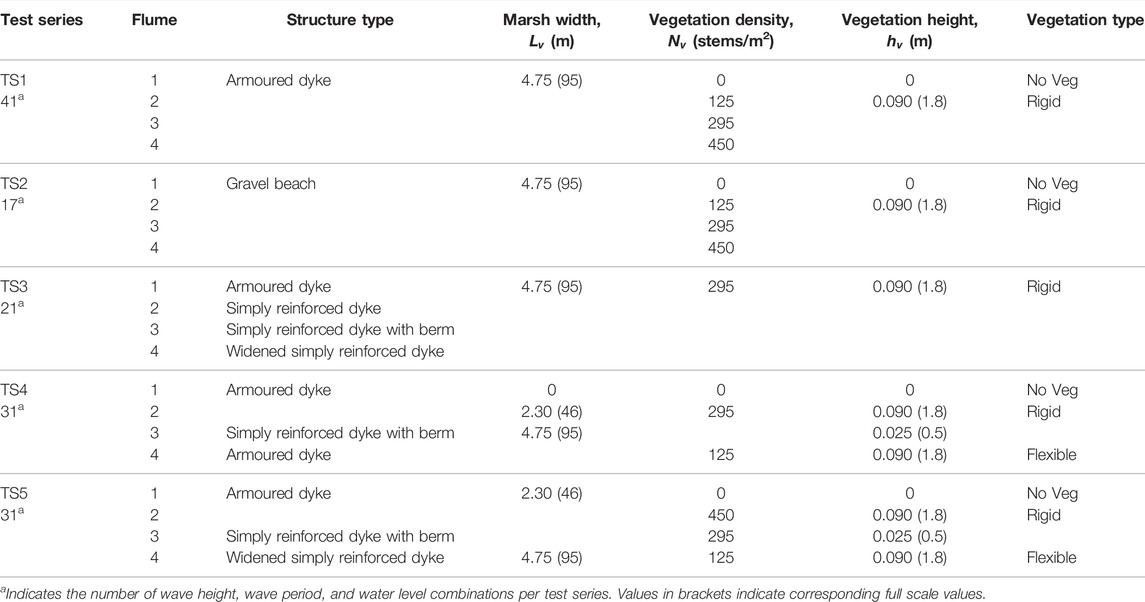
TABLE 2. Experiment setup for Test Series 1–5.
The wave conditions and water levels selected for testing were generally representative of conditions along the Canadian Atlantic coast where marsh-dyke systems exist (see Table 3), with a particular focus on storm conditions (higher water levels and energetic waves) that could overtop and/or damage the dykes. Table 2 specifies the number of wave height, wave period, and water level combinations investigated in each test series. Overall, the testing program consisted of 141 unique tests.
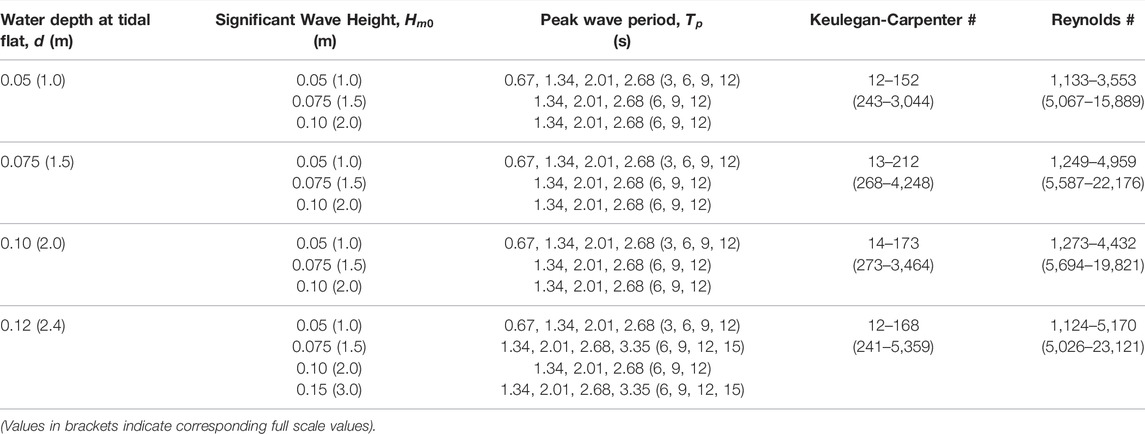
TABLE 3. Range of irregular wave parameters.
The wave signals for tests with irregular waves were synthesized from a family of JONSWAP-type spectra with a 3.3 peak enhancement factor approaching from a single direction. However, due to the shallow water conditions in the CWB and the natural growth of sub- and super-harmonics, the spectral shapes, and the distribution of energy with frequency in the experiments were typical of shallow water conditions. The test program included significant wave heights (Hm0) ranging from 0.05 to 0.15 m (corresponding to 1.0–3.0 m at full scale) and peak wave periods (Tp) ranging from 0.63 to 3.35 s (corresponding to 3–15 s at full scale). These conditions respect the guidance of Hughes (1993) and Heller (2011) for minimizing scale effects on wave propagation caused by surface tension. Water depths on the tidal flat ranged from 0.05 to 0.12 m (corresponding to 1.0–2.4 m at full scale). Each wave signal featured a non-repeating sequence of approximately 1,000 irregular waves, thus the duration of each wave signal and test varied depending on the peak wave period, ranging from ∼10.9 to 38.9 min long (corresponding to ∼0.8–2.9 h at full scale). One-thousand waves was selected to ensure that each signal included a statistically representative distribution of larger wave heights and crest elevations, since wave overtopping and armour stone stability are typically sensitive to the few largest waves in a sea state. Water levels were adjusted in the model by filling or draining the basin until the desired level was reached.
Twenty-two capacitance-type probes were used to measure water surface displacement at several locations of interest in each test flume. Two probes were located in deeper water near the wave generator to measure offshore wave conditions, while the others were positioned such that five probes were deployed inside each flume as shown in Figure 2 (one above the sloping foreshore and the other four distributed across the artificial marsh). The probes were configured to record water levels at a sampling frequency of 50 Hz and were (re)calibrated before each test series by changing their elevation with respect to a fixed (known) water level. The wave probes featured a highly linear and stable response, with calibration errors typically less than 0.5% over their calibration range. Comprehensive time-domain and frequency-domain analysis algorithms were applied to analyze the wave conditions measured in the model in detail.
Four simple, accurate and reliable overtopping measurement systems were deployed, one in each test flume. Each overtopping measurement system consisted of a collection tray positioned to collect water passing over the dyke crest and convey it to a water storage reservoir fitted with a capacitance water level gauge located on the leeside of the dyke. Wave overtopping was quantified as a volumetric flow rate per unit width passing over the top of the dyke crest. This overtopping measurement system was best suited for measuring moderate-to-heavy overtopping flows (e.g., greater than 1 L/s/m at full scale); measuring smaller volumes of splash and spray was less precise. The overtopping collection trays were positioned at the rear slope break of the dyke crest atop nominally two layers of armour stone. Small overtopping events in which the wave runup reached the crest elevation, generating overtopping flows through the armour stone on the dyke crest, were not captured by the overtopping measurement system. It is noted that typical dykes have a drainage ditch along their leeside which can handle some degree of overtopping flow. Only larger overtopping events featuring green water flowing over the crest and reaching the rear slope break were captured by the overtopping measurement systems in these experiments.
A photographic damage analysis system comprising four remotely-operated digital cameras was used to monitor the stability of the armour stones on each of the four dyke structures. Since each camera remained fixed throughout a test series, by comparing photographs taken before and after each test segment, damage could be assessed and quantified based on the number of individual stones that were displaced during each test segment. The effect of marsh vegetation on armour stone stability will be discussed briefly in the next section.
Previous research has identified a strong correlation between vegetation density and wave damping, and this correlation was further confirmed in these experiments. Not only did the rate of wave attenuation increase with increasing vegetation density, but the amount of wave overtopping recorded at the dyke, and the damage to the dyke itself was reduced as well. Figure 6 shows relative wave heights (wave height with vegetation normalized by corresponding wave height without vegetation) measured across the tidal flat comprised of medium-density vegetation for a range of wave conditions and water levels. Measurement locations are shown in Figure 2. This normalization of wave height is necessary to isolate the effects of vegetation, since the wave conditions across the artificial marshes in these experiments were generally strongly influenced by the effects of shoaling and depth-limited wave breaking, and, to a lesser extent, flume friction effects (Maza et al., 2019). For test flumes with vegetation, measured significant wave heights at each probe were normalized by Hm0 values measured at corresponding locations in the flume with no vegetation (i.e., Flume 1 in Test Series 2; refer to Table 2). Figure 6 shows the spread of observed wave attenuation for individual tests spanning a broad range of significant wave heights, peak wave periods, and water depths. For each test, the damping coefficient

FIGURE 6. Wave attenuation across the artificial marsh for medium-density vegetation only. Data is normalized by the case with no vegetation to remove the effects of wave transformation and breaking due to the sloping foreshore and shallow depths, and highlight the role of vegetation in wave attenuation. Open symbols (◇) show the observed attenuation across a wide range of wave heights, periods, and water depths, while filled symbols (◆) denotes the average with fitted damping coefficient
Similarly, Figure 7 shows relative wave heights (wave height with vegetation normalized by corresponding wave height without vegetation) measured across the tidal flat as a function of vegetation density. Average
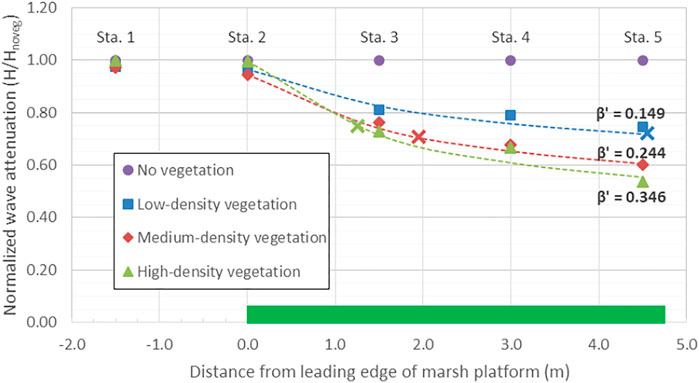
FIGURE 7. Wave attenuation across the artificial marsh for different vegetation densities. Data is normalized by the case with no vegetation to remove the effects of wave transformation and breaking due to the sloping foreshore and shallow depths, and highlight the role of vegetation in wave attenuation. Data points denote average measurements across a wide range of wave heights, periods, and water depths. Dashed lines denote predicted (fitted) curves and corresponding β′ values. The bold X denotes the distance from the leading edge of the model vegetation canopy encompassing 700 surrogate stems for each vegetation density. Refer to Figure 2 for the location of the measurement stations.
As shown in Figure 7, significant wave heights in the low-density, medium-density and high-density vegetation were 28, 40 and 46% lower (respectively) than those in the flume with no vegetation for the same test conditions. Therefore, higher vegetation density does lead to increased wave attenuation, as expected, but there appears to be a diminishing return on additional bio-mass leading to additional wave attenuation, at least for the range of densities tested in this study.
Looking at the data points along each individual curve in Figure 7, the majority of the wave damping occurs in the first third of the marsh (i.e., between Stations 2 and 3). Averaging over the full range of water level and sea state conditions investigated, there was a 19% reduction in significant wave height across the first 1.5 m of the low-density marsh, compared to a further 9% reduction across the following 3.25 m of marsh. For the high-density marsh, there was a 27% reduction across the first 1.5 m long section versus a further 19% reduction across the remainder.
Stakeholders looking to make use of vegetated tidal flats to augment shore protection should consider creating expansive marshes wherever possible, not only from a wave attenuation and flood risk reduction perspective but also for the environmental co-benefits they bring. Where expansive marshes are not possible, this data suggests that denser vegetation is preferred from a wave attenuation perspective, as opposed to sparser vegetation. Figure 7 shows that narrower denser marshes can be considered roughly equivalent to wider marshes with sparser vegetation. For example, 700 dowels placed in the low-density configuration (denoted by the blue ✕ in Figure 7) spans X = 4.55 m and yields ∼28% wave attenuation on average. However, 700 dowels placed in the medium-density configuration (denoted by the red ✕) occupies X = 1.95 m of horizontal distance and yields ∼29% attenuation on average across a broad range of wave conditions and water depths, while the same number of dowels in the high-density configuration (denoted by the green ✕) spans X = 1.25 m and yields ∼25% attenuation on average.
Figure 8 shows the observed variation in wave attenuation factor
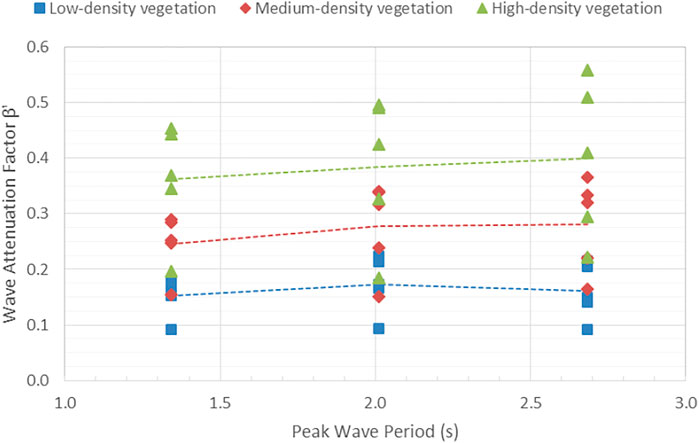
FIGURE 8. Variation in wave attenuation factor
Contrary to the findings of Wu and Cox (2015b), no significant correlation between wave steepness and wave attenuation was observed across the range of conditions investigated in this study.
Based on a study by Maza et al. (2019), damping coefficients determined for various water depths, wave heights and wave periods indicated that, in general, higher damping coefficients are associated with higher wave heights and shorter wave lengths (i.e., smaller wave periods). In addition, higher correlations were found between the damping coefficient and wave height than with wave steepness, indicating that wave height has greater control than wave period in terms of attenuation capacity.
Figure 9 shows the variation in wave attenuation factor (
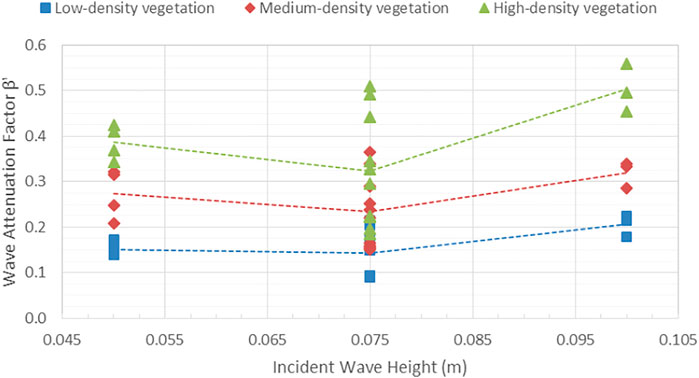
FIGURE 9. Variation in wave attenuation factor
The relationship between wave attenuation factor (
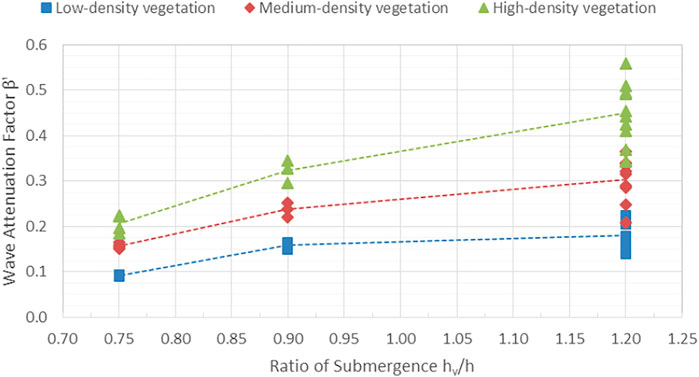
FIGURE 10. Variation in wave attenuation factor with submergence ratio for artificial marshes with different vegetation densities. Symbols denote results from individual tests spanning a range of wave conditions. Dashed lines connect average values for each submergence ratio.
Using data from Test Series 2, the bulk drag coefficient,
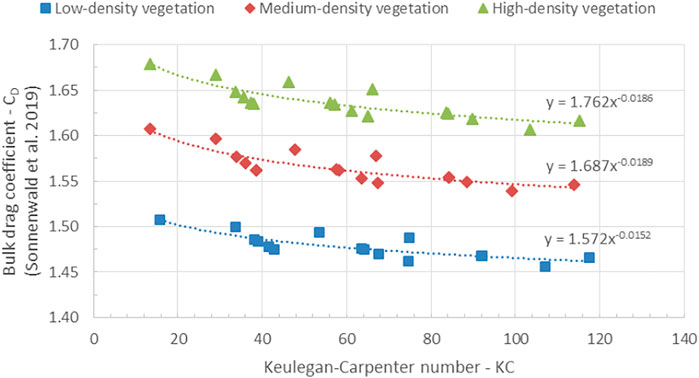
FIGURE 11. Bulk drag coefficient versus Keulegan-Carpenter number for artificial marshes with low, medium, and high vegetation densities.
Test Series 4 was conducted to investigate the effects of vegetation height (or submergence ratio) and stem flexibility on the resulting wave attenuation. Figure 12 compares wave attenuation across the model marsh for otherwise identical marshes comprised of rigid and flexible vegetation. In this figure, the wave height attenuation across the marsh platform for the no vegetation (NoVeg) case is primarily due to depth-limited wave breaking. Across the wide range of significant wave heights, peak wave periods and water depths investigated, the additional wave attenuation due to flexible vegetation is roughly 90% of the additional attenuation due to comparable rigid vegetation. Although plant stiffness was not the main focus of these tests, and plant flexibility was not modelled with strict parametric specificity, these results are consistent with the findings of Maza et al. (2015), where increased plant rigidity was shown to correlate with increased wave attenuation.
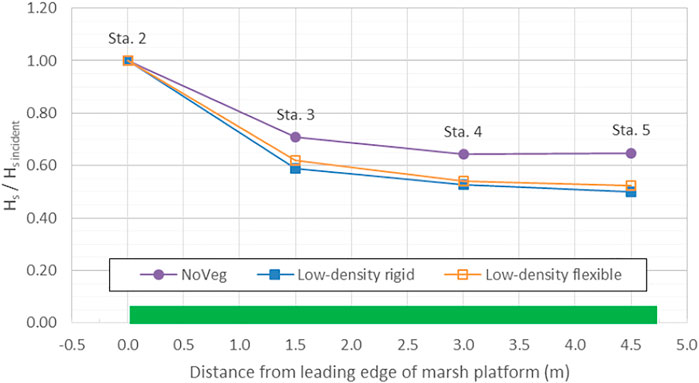
FIGURE 12. Wave attenuation across similar artificial marshes comprised of rigid and flexible vegetation. Data is normalized by the incident wave height at the edge of the marsh (@ Station 2). Note that this figure includes wave height attenuation due to depth-limited breaking.
The influence of plant submergence ratio on wave height attenuation is plotted in Figure 10 and discussed briefly in the previous section, where it is shown that wave attenuation capacity increases with increasing submergence ratio. In a similar vein, Figure 13 shows the effect of plant submergence (or height) on wave attenuation across otherwise similar model marshes. As in Figure 12, the wave height attenuation curves in this figure are based on averaging results from several tests with different wave conditions, and include the effects of depth-limited wave breaking. Stems in the tall marsh were simulated using 0.09 m tall rigid dowels, whereas 0.025 m tall dowels were used in the short marsh (28% of the tall plant height). Figure 13 shows that the additional wave height attenuation due to the short stems (relative to the NoVeg case) was roughly 1/3rd of the additional attenuation due to the taller ones. These results are consistent with the results shown in Figure 10 and the findings by other authors (Arkema et al., 2013; Anderson and Smith, 2014) who investigated the effect of water depth on wave attenuation capacity and found a significant influence on wave height decay, specifically that emergent conditions led to higher amounts of wave attenuation. Wave attenuation due to shorter, broken stems is an important topic, particularly for higher latitude regions where marsh plants tend to die off following the summer growing season, thus reducing their capacity to dissipate wave energy and limit flood risk.
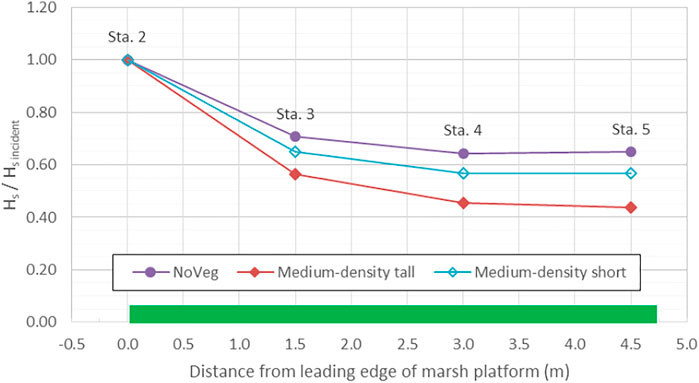
FIGURE 13. Wave attenuation across similar artificial marshes featuring different vegetation heights. Data is normalized by the incident wave height at the edge of the marsh (@ Station 2). Note that this figure includes the effect of wave transformation and breaking due to the sloping foreshore.
The presence (or absence) of vegetation was a strong function of dyke performance. Figure 14 shows a comparison of two identical dykes built in the lee of salt marsh platforms subject to the same series of increasingly harsh sea states and water levels. At the end of the test series, the dyke without protective vegetation (shown on the left) suffered significant damage, exposing the core at the seaside crest and causing significant scouring on the leeside. In stark contrast, the dyke fronted by a 4.75 m length of low-density marsh (shown on the right) sustained only minor damage to the leeside crest. Identical dykes protected by medium-density and high-density marshes (not pictured) showed effectively no damage following exposure to identical test conditions. Figure 15 shows a comparison of the overtopping measured at four identical dykes fronted by varying vegetation fields. Out of the 41 sea states examined in Test Series 1, the dykes typically only experienced overtopping as a result of the largest wave heights in combination with extreme water levels. From Figure 15, it is clear that the NoVeg case not only saw overtopping in a greater number of these sea states, but that the overtopping volumes were also significantly larger. It is noted that these overtopping results are notably smaller than predicted by Equation 5.11 from EurOtop (Van der Meer et al., 2018), however this formula likely does not consider a dyke fronted by a long tidal flat. These results emphasizes the potential effectiveness of coastal salt marshes in dissipating wave energy, lessening overtopping and reducing damage of adjacent coastal infrastructure in storm conditions, provided that the marsh itself is able to survive the storm without being damaged.
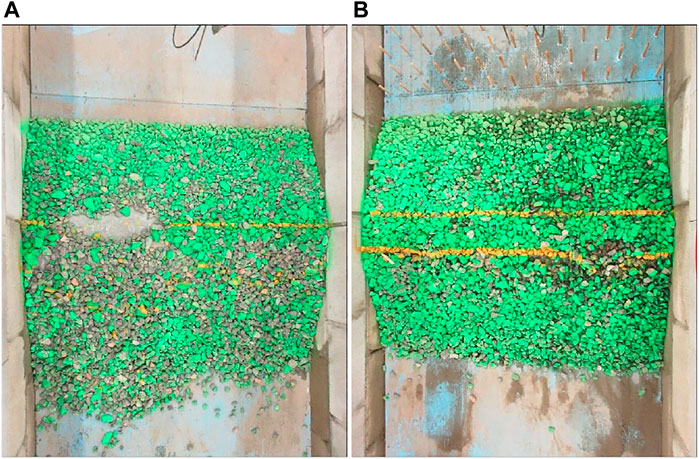
FIGURE 14. Comparison of damage to identical dykes built behind a salt marsh platform; without vegetation (A) and with vegetation (B). Waves approached from the top in these images.
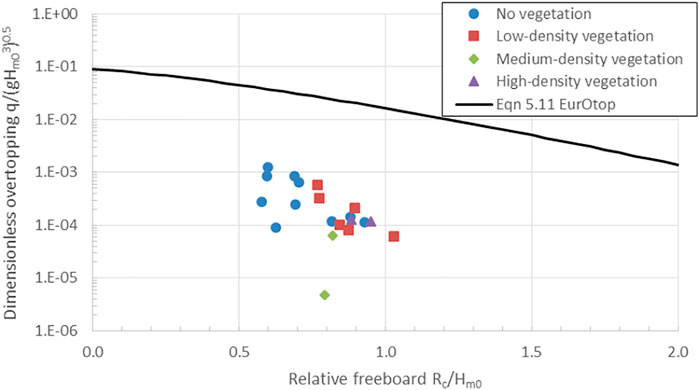
FIGURE 15. Wave overtopping at four identical dykes for different vegetation densities.
A detailed investigation of wave overtopping and damage to the dyke structures was not the primary focus of this study; however, some general commentary based on observations made during the testing program is presented herein. Four different dyke structure designs (see Figure 5) were modelled and investigated in Test Series 3 with identical foreshore marshes to help inform decisions concerning potential upgrading of older dyke structures. Analysis of the wave data measured on the tidal flats suggests that the level of wave reflection was similar in each flume, and that the degree of wave attenuation across the model marsh was also similar in each flume.
However, clear differences in overtopping flowrates (and damage) were measured in each flume, depending on the dyke design (see Figure 16). The armoured dyke (requiring a rock armour volume of 15.4 m3 per linear metre of full-scale structure), will be considered as a base case for comparison. The mean overtopping discharge for the armoured dyke, averaged across a broad range of test conditions, was 1 L/s/m. Despite this overtopping, the armour on the leeside crest and slope sustained negligible damage. In comparison, the simply reinforced dyke, with a slightly wider crest but requiring only 7.5 m3/m of rock armouring, saw a 36% reduction in overtopping discharge. However the unprotected leeside crest and slope saw comparatively greater damage, though not serious enough to jeopardize the overall integrity of the dyke.
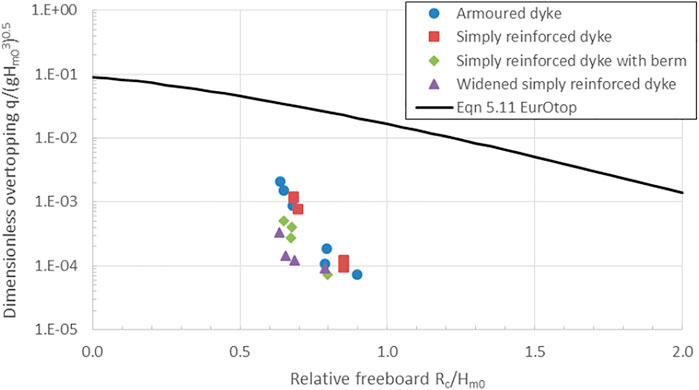
FIGURE 16. Wave overtopping at four different dyke structures with identical marsh platforms.
In comparison, significantly fewer overtopping events and smaller flowrates were measured at the simply reinforced dyke with berm and the widened simply reinforced dyke (74 and 86% reductions in mean overtopping discharge, respectively). Each of these dyke designs requires 15.0 m3 of armour stone per linear metre of structure. The berm was observed to trigger earlier wave breaking, and the additional volume of porous rock in the widened dyke was effective at reducing run-up and overtopping. In both cases, despite the lower overtopping volumes, damage to the leeside crest and slope was similar to that observed on the simply reinforced dyke (without berm), which may point to the high mobility of the impermeable core material under the conditions tested. Overall, the widened simply reinforced dyke was most effective in reducing mean overtopping discharge, however the armoured dyke provided the best protection in terms of leeside stability.
In all four cases, the seaside armouring saw only minor damage, in the form of rocking and/or small displacements. It should be noted that all four dykes saw effectively zero overtopping (or damage to the leeside) in all but the most energetic test conditions featuring the highest water levels combined with the largest wave heights. These results provide information on the relative ability of the upgraded structures to reduce overtopping and limit damage in extreme conditions. The relative benefits of each potential dyke upgrade must be balanced against the relative cost of implementation, which can be assumed to be roughly proportional to the volume of armour stone required.
A series of scaled laboratory experiments were conducted to investigate the function of coastal salt marshes as part of a coastal marsh and dyke system, and to determine the effectiveness of marsh vegetation in dissipating wave energy and reducing wave overtopping and damage under a broad range of wave and water level conditions, including harsh conditions, representative of Canadian coastal regions. A secondary goal was to assess the feasibility and efficacy of using simple, low-cost scale model surrogates to represent salt marsh vegetation in scale model testing. The model dyke and marsh platform features investigated in this study were based on archetypes found in Atlantic Canada, in particular the Tantramar Marsh on the Chignecto Isthmus between New Brunswick and Nova Scotia where Spartina alterniflora (smooth cordgrass) dominates.
This study addressed several of the research knowledge gaps highlighted by Markov (2021). In particular, two different plant heights were investigated as a proxy to the seasonal variation in marsh plant posture and stature typical of higher latitude regions, and tests were conducted across a much broader range of wave heights, periods, and water levels than previously seen in full scale (or near full scale) experiments using live or surrogate vegetation.
This research confirmed the benefit of tidal flats hosting coastal marshes for attenuating waves, reducing overtopping volumes and lessening damage to dyke structures. As expected, taller and denser marshes were more effective in attenuating wave energy for a given marsh width. From a wave attenuation perspective, the study results show that narrow, densely vegetated marshes (i.e., 25 m wide marsh with ∼450 stems/m2) provide similar wave attenuation capacity as wider marshes with sparser vegetation (i.e., ∼90 m wide marsh with ∼150 stems/m2). Of course, stakeholders looking to make use of vegetated tidal flats to augment shore protection should consider creating expansive marshes wherever possible, not only from a wave attenuation perspective but also for the ancillary environmental co-benefits they bring.
This study is certainly limited by the use of artificial plants to represent coastal marshes. As noted by Tinoco et al. (2019), several authors have shown that simplifications in experimental setup, such as the use of rigid elements, a single stem diameter, a single element height, and a regular or staggered layout, can bias study outcomes, by either hiding or amplifying some of the relevant physical processes found in natural conditions. However, representing coastal marshes in a simple manner at reduced scale made it possible to study wave interaction with entire marsh-dyke systems in controlled laboratory conditions, efficiently study the effect of numerous changes in marsh properties and dyke characteristics, and study relatively high-energy wave conditions; investigations that would be impractical or highly demanding and expensive using live plants at full scale. Despite its limitations, it is believed that the present study contributes useful new information leading to greater understanding of the behaviour of marsh-dyke systems, the wave attenuation over wide marshes in a broad range of depths and wave conditions, and the sensitivity of these processes to various marsh characteristics and properties, such as plant density, plant height (submergence), stem flexibility and marsh width. Moreover, results from the present study can be used to inform the representation of coastal marshes in physical and numerical models.
It is noted that Webb et al. (2018) highlighted that S. alterniflora marsh vegetation in southern Alabama was stable when significant wave heights are less than 0.2 m 80 percent of the time and less than 0.3 m 95 percent of the time. In comparison, some of the wave heights investigated in this study were considerably larger (up to Hs = 3 m at full scale) and may have been sufficient to cause erosion and/or damage in natural settings. In reality, it is likely that at least the seaward edge of the marsh may have experienced some erosion as a result of these energetic conditions, though conceivably some sort of soil stabilization measures could be applied to reduce erosion in vulnerable areas. When reviewing the results of this study and assessing the performance and efficacy of salt marshes, it is important to consider the potential for soil erosion, plant damage and loss of wave attenuation capacity in high-energy conditions, although these processes were not included in the present study.
Although several researchers have conducted experiments with live plants in test facilities, further research is required to better understand wave attenuation caused by vegetation. Topics where further research is needed include examining wave attenuation capacity over the plant life cycle (spring growth, summer, and winter dormancy periods), understanding erosion and plant damage processes in high-energy wave conditions, and understanding how to best protect and establish young plants early in their life cycle or in more exposed locations. Additional research, especially in connection with field studies, is recommended and encouraged. Future work by the authors will focus on extending the analysis of the data obtained in the current study (particularly with respect to overtopping and stability of the dyke structures), developing and validating improved approaches for representing other types of coastal vegetation in scale model studies and investigating the behaviour and performance of other types of nature-based coastal infrastructure.
The raw data supporting the conclusions of this article will be made available by the authors, without undue reservation.
SB designed and led the experiments described in the paper and is the primary author of this paper. EM, AC, and PK acted in an advisory role before and during the experiments, and are secondary authors of this paper.
This research was supported by the Climate-Resilient Buildings and Core Public Infrastructure Initiative through Infrastructure Canada and by the Nature-Based Infrastructure for Coastal Resilience and Risk Reduction project through the Canadian Safety and Security Program (CSSP-2019-CP-2444).
The authors declare that the research was conducted in the absence of any commercial or financial relationships that could be construed as a potential conflict of interest.
All claims expressed in this article are solely those of the authors and do not necessarily represent those of their affiliated organizations, or those of the publisher, the editors and the reviewers. Any product that may be evaluated in this article, or claim that may be made by its manufacturer, is not guaranteed or endorsed by the publisher.
The NRC-OCRE technical staff, in particular Alistair Rayner, are recognized for their efforts in model construction and testing.
Anderson, M. E., and Smith, J. M. (2014). Wave Attenuation by Flexible, Idealized Salt Marsh Vegetation. Coast. Eng. 83, 82–92. doi:10.1016/j.coastaleng.2013.10.004
Arkema, K. K., Guannel, G., Verutes, G., Wood, S. A., Guerry, A., Ruckelshaus, M., et al. (2013). Coastal Habitats Shield People and Property from Sea-Level Rise and Storms. Nat. Clim. Change 3 (10), 913–918. doi:10.1038/nclimate1944
Augustin, L. N., Irish, J. L., and Lynett, P. (2009). Laboratory and Numerical Studies of Wave Damping by Emergent and Near-Emergent Wetland Vegetation. Coast. Eng. 56, 332–340. doi:10.1016/j.coastaleng.2008.09.004
Barbier, E. B., Hacker, S. D., Kennedy, C., Koch, E. W., Stier, A. C., and Silliman, B. R. (2011). The Value of Estuarine and Coastal Ecosystem Services. Ecol. Monogr. 81 (2), 169–193. doi:10.1890/10-1510.1
Barron, S., Canete, G., Carmichael, J., Flanders, D., Pond, E., Sheppard, S., et al. (2012). A Climate Change Adaptation Planning Process for Low-Lying, Communities Vulnerable to Sea Level Rise. Sustainability 4 (9), 2176–2208. doi:10.3390/su4092176
Blackmar, P. J., Cox, D. T., and Wu, W.-C. (2014). Laboratory Observations and Numerical Simulations of Wave Height Attenuation in Heterogeneous Vegetation. J. Waterw. Port. Coast. Ocean. Eng. 140 (1), 56–65. doi:10.1061/(asce)ww.1943-5460.0000215
Bridges T. S., King J. K., Simm J. D., Beck M.W., Collins G., Lodder Q.et al. (Editors) (2021). International Guidelines on Natural and Nature-Based Features for Flood Risk Management (Vicksburg, MS: U.S. Army Engineer Research and Development Center).
Bridges, T. S., Wagner, P. W., Burks-Copes, K. A., Bates, E. M., and Collier, Z. (2014). Use of Natural and Nature-Based Features (NNBF) for Coastal Resilience. Vicksburg: U.S. Army Engineer Research and Development Center. Report ERDC SR-15-1.
Browder, G., Ozment, S., Rehberger Bescos, I., Gartner, T., and Lange, G. M. (2019). Integrating Green and Gray: Creating Next Generation Infrastructure. Washington: World Bank and World Resources Institute.https://openknowledge.worldbank.org/handle/10986/31430.
Costanza, R., Pérez-Maqueo, O., Martinez, M. L., Sutton, P., Anderson, S. J., and Mulder, K. (2008). The Value of Coastal Wetlands for Hurricane Protection. AMBIO A J. Hum. Environ. 37 (4), 241–248. doi:10.1579/0044-7447(2008)37[241:tvocwf]2.0.co;2
Council of Canadian Academies (2019). Canada’s Top Climate Change Risks: the Expert Panel on Climate Change Risks and Adaptation Potential. Ottawa: Council of Canadian Academie.
Cranford, P. J., Gordon, D. C., and Jarvis, C. M. (1989). Measurement of Cordgrass, Spartina Alterniflora, Production in a Macrotidal Estuary, Bay of Fundy. Estuaries 12 (1), 27–34. doi:10.2307/1351447
Dalrymple, R. A., Kirby, J. T., and Hwang, P. A. (1984). Wave Diffraction Due to Areas of Energy Dissipation. J. Waterw. Port, Coast. Ocean Eng. 110 (1), 67–79. doi:10.1061/(asce)0733-950x(1984)110:1(67)
Doberstein, B., Fitzgibbons, J., and Mitchell, C. (2019). Protect, Accommodate, Retreat or Avoid (PARA): Canadian Community Options for Flood Disaster Risk Reduction and Flood Resilience. Nat. Hazards 98 (1), 31–50. doi:10.1007/s11069-018-3529-z
Feagin, R. A., Irish, J. L., Möller, I., Williams, A. M., Colón-Rivera, R. J., and Mousavi, M. E. (2011). Short Communication: Engineering Properties of Wetland Plants with Application to Wave Attenuation. Coast. Eng. 58, 251–255. doi:10.1016/j.coastaleng.2010.10.003
Heller, V. (2011). Scale Effects in Physical Hydraulic Engineering Models. J. Hydraulic Res. 49 (3), 293–306. doi:10.1080/00221686.2011.578914
Houser, C., Trimble, S., and Morales, B. (2015). Influence of Blade Flexibility on the Drag Coefficient of Aquatic Vegetation. Estuaries Coasts 38, 569–577. doi:10.1007/s12237-014-9840-3
Hughes, S. (1993). Physical Models and Laboratory Techniques in Coastal Engineering. Singapore: World Scientific.
Jadhav, R. S., Chen, Q., and Smith, J. M. (2013). Spectral Distribution of Wave Energy Dissipation by Salt Marsh Vegetation. Coast. Eng. 77, 99–107. doi:10.1016/j.coastaleng.2013.02.013
Jongman, B. (2018). Effective Adaptation to Rising Flood Risk. Nat. Commun. 9 (1), 1986. doi:10.1038/s41467-018-04396-1
Keimer, K., Schürenkamp, D., Miescke, F., Kosmalla, V., Lojek, O., and Goseberg, N. (2021). Ecohydraulics of Surrogate Salt Marshes for Coastal Protection: Wave–Vegetation Interaction and Related Hydrodynamics on Vegetated Foreshores at Sea Dikes. J. Waterw. Port. Coast. Ocean. Eng. 147 (6). doi:10.1061/(asce)ww.1943-5460.0000667
Keulegan, G. H., and Carpenter, L. H. (1958). Forces on Cylinders and Plates in an Oscillating Fluid. J. Res. Natl. Bur. Stan. 60 (5), 423–440. doi:10.6028/jres.060.043
Kirezci, E., Young, I. R., Ranasinghe, R., Muis, S., Nicholls, R. J., Lincke, D., et al. (2020). Projections of Global-Scale Extreme Sea Levels and Resulting Episodic Coastal Flooding over the 21st Century. Sci. Rep. 10 (1), 11629. doi:10.1038/s41598-020-67736-6
Koftis, T., Prinos, P., and Stratigaki, V. (2013). Wave Damping over Artificial Posidonia Oceanica Meadow: a Large-Scale Experimental Study. Coast. Eng. 73, 71–83. doi:10.1016/j.coastaleng.2012.10.007
Lara, J. L., Maza, M., Ondiviela, B., Trinogga, J., Losada, I. J., Bouma, T. J., et al. (2016). Large-scale 3-D Experiments of Wave and Current Interaction with Real Vegetation. Part 1: Guidelines for Physical Modeling. Coast. Eng. 107, 70–83. doi:10.1016/j.coastaleng.2015.09.012
Lei, J., and Nepf, H. (2019). Wave Damping by Flexible Vegetation: Connecting Individual Blade Dynamics to the Meadow Scale. Coast. Eng. 147, 138–148. doi:10.1016/j.coastaleng.2019.01.008
Lemmen, D. S., Warren, F. J., James, T. S., and Mercer Clarke, C. S. L. (2016). Canada’s Marine Coasts in a Changing Climate. Ottawa: Government of Canada.
Lieske, D. J., and Bornemann, J. (2012). Coastal Dykelands in the Tantramar Area: Impacts of Climate Change on Dyke Erosion and Flood Risk. Canada: Mount Allison University.
Lightbody, A. F., and Nepf, H. M. (2006). Prediction of Velocity Profiles and Longitudinal Dispersion in Salt Marsh Vegetation. Limnol. Oceanogr. 51 (1), 218–228. doi:10.4319/lo.2006.51.1.0218
Losada, I. J., Maza, M., and Lara, J. L. (2016). A New Formulation for Vegetation-Induced Damping under Combined Waves and Currents. Coast. Eng. 107, 1–13. doi:10.1016/j.coastaleng.2015.09.011
Markov, A. (2021). Nature-based Solutions for Coastal Erosion ProtectionLiterature Review. Ottawa, Canada: University of Ottawa.
Maza, M., Lara, J. L., and Losada, I. J. (2019). Experimental Analysis of Wave Attenuation and Drag Forces in a Realistic Fringe Rhizophora Mangrove Forest. J. Adv. Water. Resour. 131, 103376. doi:10.1016/j.advwatres.2019.07.006
Maza, M., Lara, J. L., Losada, I. J., Ondiviela, B., Trinogga, J., and Bouma, T. J. (2015). Large-scale 3-D Experiments of Wave and Current Interaction with Real Vegetation. Part 2: Experimental Analysis. Coast. Eng. 106, 73–86. doi:10.1016/j.coastaleng.2015.09.010
Mendez, F. J., and Losada, I. J. (2004). An Empirical Model to Estimate the Propagation of Random Breaking and Nonbreaking Waves over Vegetation Fields. Coast. Eng. 51, 103–118. doi:10.1016/j.coastaleng.2003.11.003
Morris, R. L., Konlechner, T. M., Ghisalberti, M., and Swearer, S. E. (2018). From Grey to Green: Efficacy of Eco-Engineering Solutions for Nature-Based Coastal Defence. Glob. Change Biol. 24 (5), 1827–1842. doi:10.1111/gcb.14063
Moudrak, N., Feltmate, B., Venema, H., and Osman, H. (2018). “Combating Canada’s Rising Flood Costs: Natural Infrastructure Is an Underutilized Option,” in Intact Centre on Climate Adaptation (Canada: University of Waterloo).
Muis, S., Apecechea, M. I., Dullaart, J., de Lima Rego, J., Madsen, K. S., Su, J., et al. (2020). A High-Resolution Global Dataset of Extreme Sea Levels, Tides, and Storm Surges, Including Future Projections. Front. Mar. Sci. 7, 263. doi:10.3389/fmars.2020.00263
Narayan, S., Beck, M. W., Wilson, P., Thomas, C. J., Guerrero, A., Shepard, C. C., et al. (2017). The Value of Coastal Wetlands for Flood Damage Reduction in the Northeastern USA. Sci. Rep. 7 (1), 9463. doi:10.1038/s41598-017-09269-z
Nepf, H. M. (1999). Drag, Turbulence, and Diffusion in Flow through Emergent Vegetation. Water Resour. Res. 35 (2), 479–489. doi:10.1029/1998wr900069
Ozeren, Y., Wren, D. G., and Wu, W. (2014). Experimental Investigation of Wave Attenuation through Model and Live Vegetation. J. Waterw. Port. Coast. Ocean. Eng. 140 (5). doi:10.1061/(asce)ww.1943-5460.0000251
Percy, J. A. (2000). Salt Marsh Saga: Conserving Fundy’s Marine Meadows. Canada: Bay of Fundy Ecosystem Partnership.
Piercy, C. D., Pontee, N., Narayan, S., Davis, J., and Meckley, T. (2021). “Chapter 10: Coastal Wetlands and Tidal Flats,” in International Guidelines on Natural and Nature-Based Features for Flood Risk Management. Editors T. S. Bridges, J. K. King, J. D. Simm, M. W. Beck, G. Collins, Q. Lodderet al. (Vicksburg, Mississippi, United States: U.S. Army Engineer Research and Development Center). MS.
Pinsky, M. L., Guannel, G., and Arkema, K. K. (2013). Quantifying Wave Attenuation to Inform Coastal Habitat Conservation. Ecosphere 4 (8), 95. doi:10.1890/es13-00080.1
Pontee, N., Narayan, S., Beck, M. W., and Hosking, A. H. (2016). Nature-based Solutions: Lessons from Around the World. Proc. Institution Civ. Eng. - Marit. Eng. 169 (1), 29–36. doi:10.1680/jmaen.15.00027
Shepard, C. C., Crain, C. M., and Beck, M. W. (2011). The Protective Role of Coastal Marshes: A Systematic Review and Meta-Analysis. PLoS One 6 (11), e27374. doi:10.1371/journal.pone.0027374
Sherren, K., Bowron, T., Graham, J. M., Rahman, H. M. T., and van Proosdij, D. (2019). “Coastal Infrastructure Realignment and Salt Marsh Restoration in Nova Scotia, Canada,” in Responding to Rising Seas: Comparing OECD Countries' Approach to Coastal Adaptation (Paris, France: Organization for Economic Collaboration and Development), 75–108.
Sonnenwald, F., Stovin, V., and Guymer, I. (2019). Estimating Drag Coefficient for Arrays of Rigid Cylinders Representing Emergent Vegetation. J. Hydraulic Res. 57 (4), 591–597. doi:10.1080/00221686.2018.1494050
Spalding, M. D., McIvor, A. L., Beck, M. W., Koch, E. W., Möller, I., Reed, D. J., et al. (2014). Coastal Ecosystems: a Critical Element of Risk Reduction. Conserv. Lett. 7 (3), 293–301. doi:10.1111/conl.12074
Sutton-Grier, A. E., Wowk, K., and Bamford, H. (2015). Future of Our Coasts: the Potential for Natural and Hybrid Infrastructure to Enhance the Resilience of Our Coastal Communities, Economies and Ecosystems. Environ. Sci. Policy 51, 137–148. doi:10.1016/j.envsci.2015.04.006
Sutton-Grier, A., Gittman, R., Arkema, K., Bennett, R., Benoit, J., Blitch, S., et al. (2018). Investing in Natural and Nature-Based Infrastructure: Building Better along Our Coasts. Sustainability 10 (2), 523. doi:10.3390/su10020523
Tinoco, R. O., San Juan, J. E., and Mullarney, J. C. (2019). Simplification Bias: Lessons from Laboratory and Field Experiments on Flow through Aquatic Vegetation. J. Earth Surf. Process. Landforms 45, 121–143. doi:10.1002/esp.4743
Van der Meer, J. W., Allsop, N. W. H., Bruce, T., De Rouck, J., Kortenhaus, A., Pullen, T., et al. (2018). EurOtopManual on Wave Overtopping of Sea Defences and Related Structures. An Overtopping Manual Largely Based on European Research, but for Worldwide Application. EurOtop. www.overtopping-manual.com.
van Proosdij, D., Perrott, B., and Carrol, K. (2013). Development and Application of a Geo-Temporal Atlas for Climate Change Adaptation in Bay of Fundy Dykelands. J. Coast. Res. 65, 1069–1074. doi:10.2112/si65-181.1
van Veelen, T. J., Fairchild, T. P., Reeve, D. E., and Karunarathna, H. (2020). Experimental Study on Vegetation Flexibility as Control Parameter for Wave Damping and Velocity Structure. J. Coast. Eng. 157, 103648. doi:10.1016/j.coastaleng.2020.103648
Virgin, S. D., Beck, A. D., Boone, L. K., Dykstra, A. K., Ollerhead, J., Barbeau, M. A., et al. (2020). A Managed Realignment in the Upper Bay of Fundy: Community Dynamics during Salt Marsh Restoration over 8 Years in a Megatidal, Ice-Influenced Environment. J. Ecol. Eng. 149, 105713. doi:10.1016/j.ecoleng.2020.105713
Vuik, V., Jonkman, S. N., Borsje, B. W., and Suzuki, T. (2016). Nature-based Flood Protection: the Efficiency of Vegetated Foreshores for Reducing Wave Loads on Coastal Dikes. Coast. Eng. 116, 42–56. doi:10.1016/j.coastaleng.2016.06.001
Vuik, V., Van Vuren, S., Borsje, B. W., van Wesenbeeck, B. K., and Jonkman, S. N. (2018). Assessing Safety of Nature-Based Flood Defenses: Dealing with Extremes and Uncertainties. Coast. Eng. 139, 47–64. doi:10.1016/j.coastaleng.2018.05.002
Webb, B., Douglass, S., Dix, B., and Asam, S. (2018). Nature-based Solutions for Coastal Highway Resilience. Report FHWA-HEP-18-037. Washington, DC: U.S. Federal Highway Administration (Accessed February 13, 2018).
Wu, W.-C., and Cox, D. T. (2015). Effects of Vertical Variation in Vegetation Density on Wave Attenuation. J. Waterw. Port. Coast. Ocean. Eng. 142 (2). doi:10.1061/(ASCE)WW.1943-5460.0000326
Wu, W.-C., and Cox, D. T. (2015). Effects of Wave Steepness and Relative Water Depth on Wave Attenuation by Emergent Vegetation. Estuar. Coast. Shelf Sci. 164, 443–450. doi:10.1016/j.ecss.2015.08.009
Keywords: wave attenuation by vegetation, salt marsh, physical modelling, artificial vegetation, flood and erosion risk
Citation: Baker S, Murphy E, Cornett A and Knox P (2022) Experimental Study of Wave Attenuation Across an Artificial Salt Marsh. Front. Built Environ. 8:893664. doi: 10.3389/fbuil.2022.893664
Received: 10 March 2022; Accepted: 17 May 2022;
Published: 08 June 2022.
Edited by:
Tori Tomiczek, United States Naval Academy, United StatesReviewed by:
M. Luisa Martinez, Instituto de Ecología (INECOL), MexicoCopyright © 2022 Baker, Murphy, Cornett and Knox. This is an open-access article distributed under the terms of the Creative Commons Attribution License (CC BY). The use, distribution or reproduction in other forums is permitted, provided the original author(s) and the copyright owner(s) are credited and that the original publication in this journal is cited, in accordance with accepted academic practice. No use, distribution or reproduction is permitted which does not comply with these terms.
*Correspondence: Scott Baker, c2NvdHQuYmFrZXJAbnJjLWNucmMuZ2MuY2E=
Disclaimer: All claims expressed in this article are solely those of the authors and do not necessarily represent those of their affiliated organizations, or those of the publisher, the editors and the reviewers. Any product that may be evaluated in this article or claim that may be made by its manufacturer is not guaranteed or endorsed by the publisher.
Research integrity at Frontiers
Learn more about the work of our research integrity team to safeguard the quality of each article we publish.