 Amy L. Bredes
 Jon K. Miller
 Laura Kerr
 Dana Rose Brown
- Department of Civil, Environmental and Ocean Engineering, Coastal Engineering Research Group (CERG), Stevens Institute of Technology, Hoboken, NJ, United States
This study reports findings of an analysis of modifications to the incident wave field caused by constructed Oyster Castle® breakwater systems at Gandys Beach Preserve in Downe Township, NJ. The Nature Conservancy’s (TNC) Gandys Beach Preserve is a one-mile stretch of beach located along with intertidal mud flats, sandy beaches, tidal creeks, and salt marshes. Gandys Beach can be classified as a high-energy environment, with open water fetches exceeding 30 miles, and a tidal range on the order of 2 m. The Gandys Beach living shoreline project was designed and constructed by TNC in partnership with the United States Fish and Wildlife Service (USFWS) to investigate the effectiveness of various natural and nature-based features (NNBFs) in protecting and enhancing salt marshes and beaches in high (er) energy environments. Many of the NNBF techniques used at Gandys Beach, such as Oyster Castle® block breakwaters (Oyster Castles), had only been implemented at smaller scales in New Jersey prior to the project. Stevens was contracted by USFWS/TNC to evaluate the impact of the breakwater systems on incident waves. Four breakwater sections along the beach were selected to monitor wave attenuation. Month-long deployments of wave staffs and pressure sensors occurred in the summer and winter of 2019. Analysis of the data indicates that when crests of the Oyster Castles are exposed the breakwater system effectively attenuates waves. However, when the structures are submerged, wave height attenuation decreases, and under certain conditions wave heights behind Oyster Castles can be amplified more than 80%. These results are troubling, especially in areas experiencing sea level rise where the frequency of submergence will likely increase in the future. Due to the complex nature of Gandys Beach, exact mechanisms causing this amplification remain uncertain. Furthermore, transmission coefficients (Kt) above 1 are not typically modeled in existing empirical equations. Seabrook and Hall (Coast. Eng. Proc., 1998, 1 (26), 2000) is the only studied empirical formula that indicated an amplification of the Hs as observed during these field deployments and therefore was used to model Kt. However, poor agreement between the modeled and observed Kt was found and a better predictive tool is needed.
Introduction
The coastal areas of New Jersey are highly exposed to waves and storm surge during extreme weather events such as hurricanes or Nor’easters. Erosion is a large component of storm-related damage to both natural and built environments. Storm surges, tides, and heightened water levels can impact coastal marshlands by the uprooting and removal of vegetation, scouring and erosion, and folding, tearing, and compression of the marsh (Guntenspergen et al., 1995). Coastal marshes provide important ecosystem services such as buffering the negative impact of storms by protecting inland areas from erosion and storm surge, making their degradation problematic (Costanza et al., 2006). In fact, coastal wetlands prevented approximately $625 million in direct flood damage alone during Hurricane Sandy (Narayan et al., 2017). However, marshes require large extents to achieve flood and storm protection in inland areas, and marsh edge erosion can reduce marsh size and thus the protectiveness of the marsh (Koch et al., 2009; Gedan et al., 2011).
Delaware Bay wetlands are thought to be more resilient to sea level rise due to their large tidal and plant growth range, sediment supply, low slope, and the availability of open space to migrate inland. At the same time, the Delaware Bay marsh edges are eroding and converting to open water with marsh loss rates of 1.1%–1.9% per decade (Weis et al., 2021). This marsh edge erosion appears to be worsening with sea level rise. An increase of storm frequency and intensity in conjunction with increased water levels will subject marsh edges to increased attack by wave action; in extreme cases this may result in erosion rates of 5–20 m per year (Elsey-Quirk et al., 2019). Given the inland protection and habitat provided by these marshes, it is imperative to reduce the erosion of marshes and the sand areas within them (Niles et al., 2013). Living shoreline projects can provide a more ecologically sensitive approach to reducing marsh edge erosion compared to traditional coastal shoreline protection.
Living shoreline projects, or natural and nature-based features (NNBF), have become an increasingly popular method of shoreline stabilization throughout the United States. Living shoreline projects provide the same protection benefits as traditional coastal protection (i.e., wave attenuation, storm surge, and wave action buffering), maintain natural coastal processes, and provide valuable ecosystem services, while having reduced initial and maintenance costs (O’Donnell, 2017). In some cases, living shoreline projects are more protective than traditional shoreline protection (Gittman et al., 2014; Smith et al., 2018) while enhancing ecosystem services such as carbon sequestration, wave attenuation, and fish nursey habitat (Scyphers et al., 2011; Davis et al., 2015; Gittman et al., 2016).
Oyster reefs and oyster reef structures like Oyster Castles have increasingly been the target of research for use in living shoreline projects. It has been long known that oyster reefs stabilize intertidal sediment and influence hydrodynamics within estuaries (Dame and Patten, 1981). The primary appeal of oyster reefs are their wave attenuation and erosion reduction characteristics. Oyster reefs are currently being investigated for their ability to protect both natural habitat and human infrastructure from wave action. An Oyster Castle installation in Alabama effectively attenuated waves, as well as provided additional ecological benefit including the appearance of some economically important species such as blue crabs; further, it was found that at one of the study locations vegetation retreat was mitigated by more than 40% over two years (Scyphers et al., 2011). Another study on oyster reefs in Virginia found that they can be effective at reducing wave energy, and thusly marsh edge erosion, however; their effectiveness is a function of freeboard (Wiberg et al., 2019).
While some engineering guidance exists for the design of living shoreline projects (Miller et al., 2015; Hardaway et al., 2017) more research is necessary to improve upon this guidance. Living shorelines projects are often designed with minimal budgets so simple empirical formulas are often used in lieu of complex physical or numerical modeling. For this reason, it is crucial that these simple formulas be as robust as possible to ensure adequate design. Adding to the complexity of the problem, even where design formulas exist the variability in the way living shorelines are constructed makes evaluating these formulas in a field setting difficult. Table 1 shows a selection of laboratory and mathematically derived equations for submerged and low-crested breakwater structures along with applicable ranges for various parameters of each equation which might be expected to apply to living shorelines. Numerous publications exist describing design criteria or installations of living shoreline projects, yet there is seldom long-term monitoring data collection associated with these projects; this monitoring data is needed to evaluate the effectiveness of each design.
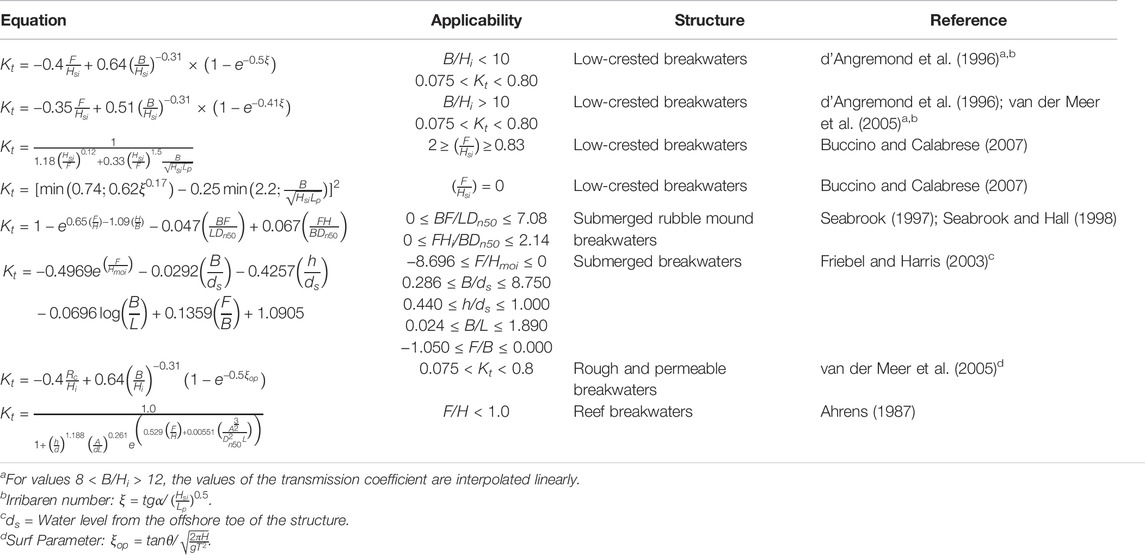
TABLE 1. Empirical equations to describe the transmission coefficient for waves over low-crested or submerged breakwater structures and the ranges these equations are valid.
Site Description
TNC’s Gandys Beach Preserve (Gandys Beach) is located on Delaware Bay on the Southwestern coast of New Jersey and has been experiencing loss of marsh through edge erosion since measurement began in 1930 (Conrad, 2015; Weis et al., 2021). The site has large intertidal mud flats, sandy beaches, tidal creeks, and salt marshes. Gandys Beach is a relatively high-energy environment, with recorded wave heights in excess of 0.6 m and a tidal range of 1.72 m (Conrad, 2015). The site is located relatively close to the mouth of the Delaware Bay and is exposed to both wind-wave generated across the local fetch and to ocean waves propagating into and through the bay (Kukulka et al., 2017). Field observations and historic images at the Gandys Beach Preserve indicate significant shoreline erosion with reduced acreage of beach and salt marshes (Conrad, 2015; Weis et al., 2021). Marsh edges have sharp scarps at this site, another indicator of marsh retreat (Mariotti and Fagherazzi, 2010). Estimated shoreline retreat at Gandys Beach is about 500 feet between 1930 and 2007 (Conrad, 2015; Weis et al., 2021). Superstorm Sandy accelerated marsh edge erosion in 2012 causing significant loss of wetlands and shoreline regression in this area (Walling et al., 2017).
The Gandys Beach Preserve living shoreline project (Figure 1) was designed and constructed by The Nature Conservancy (TNC) in collaboration with the United States Fish and Wildlife Service (USFWS) to mitigate the effects of marsh edge erosion at the preserve. TNC installed a variety of living shoreline structures paralleling the marsh line along an approximately half-mile stretch of shoreline. These techniques include shell bag breakwaters, coir logs, spartina alterniflora plantings, and Oyster Castle® breakwaters constructed of interlocking blocks to encourage oyster growth (Figure 2). The Gandys Beach living shoreline project originated as a trial or “living laboratory” project to test the use of large-scale living shoreline projects in New Jersey after the marsh was damaged during Superstorm Sandy. At the time of its conception, few of the techniques implemented had ever been attempted in New Jersey or were used infrequently or at much smaller scales and typically at lower energy sites (Conrad, 2015).
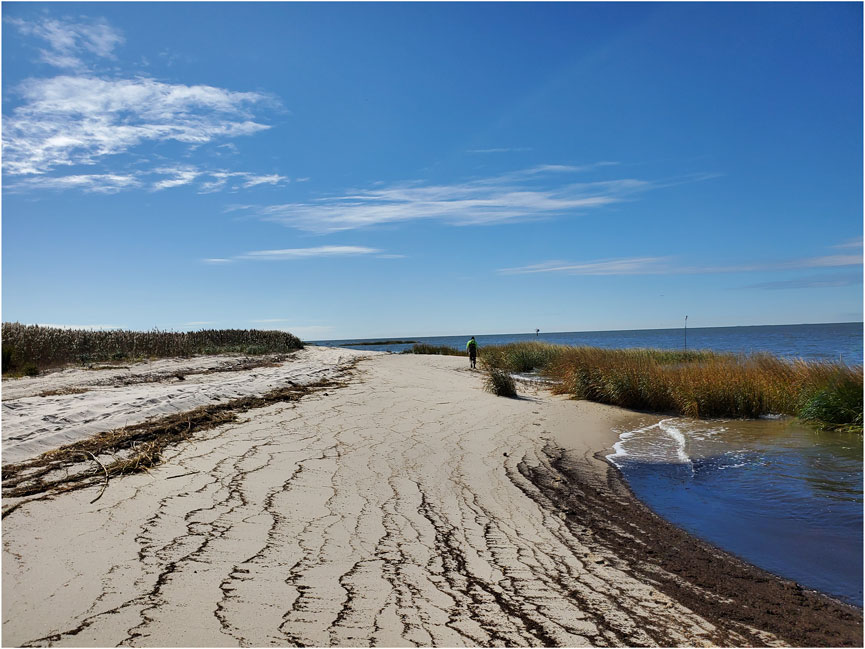
FIGURE 1. Photograph of Gandys Beach preserve near Site A, October 2019.
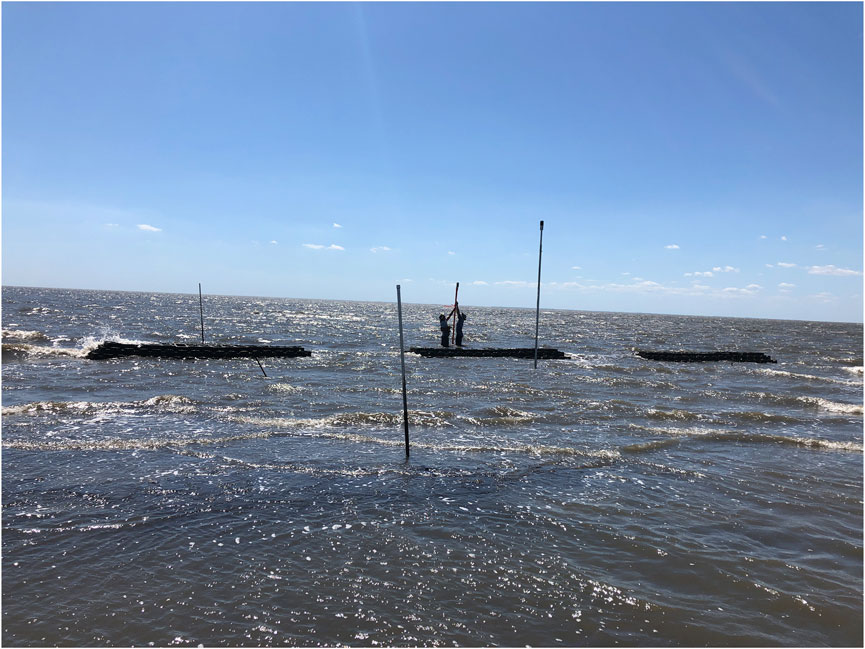
FIGURE 2. Photograph of Oyster Castle® breakwaters, August 2019.
Sites A, B, C, and D were selected as areas of study as they represent the variety of shoreline at Gandys Beach and are depicted in the orthomosaic in Figure 3. Each site has several Oyster Castles constructed of 30 cm (1 foot) rough hollow blocks with a variety of crest heights and crest widths of 60 cm (2 feet) with gaps ranging from 2 to 5 m between each structure. Each structure was designed to be seven blocks high (3.66 feet from bottom) with the offshore toe along the mean low water line (−3.1 feet NAVD88). However, the oyster castles were largely built by volunteers, so the structures may have settled unevenly or not have been placed exactly where designed. It should be noted that Sites A and D were constructed parallel to the marsh while Sites B and C run parallel to a tombolo. By summer 2019 deployment (S19) the tombolo was mostly eroded; however during the winter 2019 deployment (W19) adaptive management occurred to attempt to reduce erosion. During higher water levels, the tombolo is completely submerged and depending on wave direction, waves can approach breakwaters from both sides.
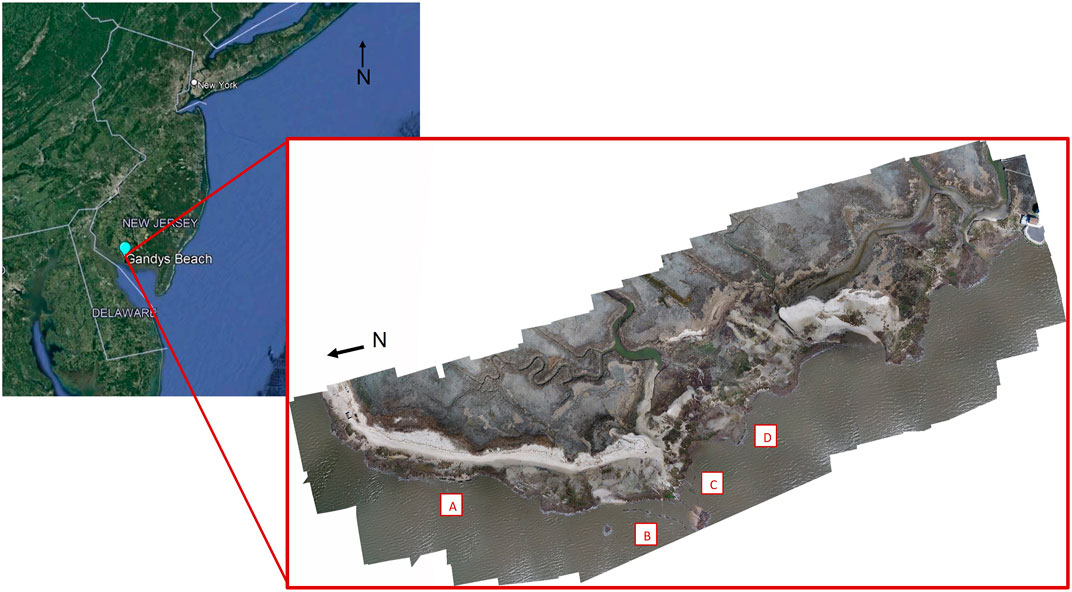
FIGURE 3. Orthomosaic created from drone imagery of Gandys Beach Preserve with Sites A, B, C, and D labelled, April 2020.
The Oyster Castle breakwaters are the primary focus of technical studies at this site, most specifically wave attenuation. In 2018 the USGS deployed wave gages and current meters at Gandys Beach along a profile which crossed one of the constructed breakwaters (Stevens’ Site D). During their deployment four Nor’easters occurred. It was observed that wave attenuation initiated by the breakwater was strongly dependent on the ratio between the freeboard of the structure and the offshore wave heights (Wang et al., 2021). This is consistent with laboratory experiments relating breakwaters and the wave attenuation coefficient (Ahrens, 1987; d’Angremond et al., 1996; Seabrook, 1997; Seabrook and Hall, 1998; van der Meer et al., 2005; Buccino and Calabrese, 2007). Swell waves were not found to be dampened effectively by the Oyster Castle breakwaters but wind waves were effectively reduced in height, although occasionally waves were amplified on the leeward side of the breakwaters (Zhu et al., 2020; Wang et al., 2021). Numerous studies have demonstrated the relationship between wind waves and marsh edge erosion, leading to a focus on reducing wind wave heights rather than swell for erosion control (Marani et al., 2011; Leonardi et al., 2016). Overall USGS observed less marsh edge erosion in the area protected by Oyster Castles compared to the control area (Wang et al., 2021).
Data collected from Stevens’ initial wave attenuation studies in 2019 indicate that the Oyster Castle breakwaters were effective at dissipating waves in both summer and winter; the majority of the wave heights were reduced by over 50% on the leeward side of the breakwaters (Kerr and Miller, 2020). However, it was also found that under certain conditions waves were amplified, indicating that the relationship between breakwaters and wave height reduction is not as simple as the relationship between structure freeboard and wave heights as was initially expected (Kerr and Miller, 2020). The current work focuses on identifying the conditions during which these amplification events occur and comparing the observed field data to existing empirical formulations which are based primarily on laboratory data.
Field Methods and Data Processing
Stevens deployed instruments at Gandys Beach twice in 2019 as part of this study; the first deployment was in summer 2019 (S19) (August 29 thru 3 October 2019) and the second in winter 2019 (W19) (November 21 thru 20 December 2019). Each deployment included four 4-m Ocean Sensor Systems Wave Logger III (WL3) capacitance wave staffs, four RBRsolo3 D wave16 high-frequency pressure sensors (RBR), and a 1,200 kHz Teledyne Workhorse Sentinel Acoustic Doppler Current Profiler (ADCP). The ADCP was deployed approximately 170 m offshore of the Preserve in 3–5 m of water depending on tide and the RBR and WL3 sensors were deployed in pairs at each of four breakwater locations designated Sites A, B, C, and D (Figure 3). WL3 sensors were placed 2–3 m inshore of the Oyster Castles to measure transmitted wave characteristics and the RBR sensors were placed 2–3 m offshore of the structures to measure incident wave characteristics. Two-meter WL3 were deployed as data quality checks collocated with RBRs at Site A in W19 and Site D in S19 and W19 to ensure measurement consistency.
Wave data were sampled hourly on the hour by the WL3s, RBRs, and ADCP. The ADCP combines pressure data readings with acoustically measured water velocities to extract directional wave climate data. This data was collected using standard 17-min wave bursts. The WL3s measured and recorded water levels at 10 Hz for 20-min bursts. The RBRs measured and recorded pressure at 16 Hz for 17.1-min bursts. The data from the WL3s and RBRs are the basis of this wave data analysis. A real-time kinematic global positioning system (RTK GPS) was used to measure the crest elevation and extent of each Oyster Castle breakwater in NAVD88.
During the S19 deployment some data was lost due to several disruptions to data collection. The RBR at Site A had a firmware issue resulting in data loss between August 29 and 19 September 2019; simultaneously, the WL3 at Site A also experienced intermittent dropouts. Therefore, S19 Site A is completely excluded from analysis due minimal data overlap. At Site B, the WL3 was knocked over on 10 September 2019, resulting in a partial dataset for S19. Data loss was minimal, so this dataset is included in this analysis.
These data collection efforts are part of a four-year study for TNC which includes additional winter and summer deployments in 2021 and 2022. In addition to water level, wave data, and breakwater crest elevations, bathymetric and topographic datasets were collected during the 2019 deployments and will be collected again during the 2021/2022 deployments. Analysis of temporal trends will continue as additional data is collected and processed.
WL3 data were processed using a moving average filter in MATLAB to remove tidal variations (detrend) from the water level data. A zero up-crossing wave analysis was performed using the MACE toolbox to determine individual wave heights and periods (Barker et al., 2012) of the detrended data; significant wave height and mean period were then calculated for each resultant 17-min burst of detrended water level. RSKtools, provided by RBR Ltd., was used to extract wave statistics from the raw RBR datasets; this software uses a similar zero-crossing methodology for analysis and accounts for pressure attenuation with depth. For both RBR and WL3 data, significant wave heights less than 5 cm were considered “too small” to be reliably compared and removed from further analysis. Bulk statistics comparing RBR and WL3 data sets were then calculated over a 20-min period. Additionally, reflected waves were not separated in this analysis due to the limited number of gauges (Grønbech et al., 1997). The ADCP data was initially processed using Teledyne’s WaveMons software and then extracted to MATLAB for further analysis.
The effectiveness of the Oyster Castles at reducing wave heights was evaluated in terms of a wave transmission coefficient (Kt) calculated using the following formula:
where Ht is the transmitted wave height as measured by the WL3 inside the Oyster Castle structure and Hi is the incident wave height as measured by the RBR outside of the Oyster Castle. A Kt value greater than 1 indicates that the transmitted wave height is larger than the incident wave height.
As discussed previously, wave transmission can also be related to the freeboard of the structure. Freeboard is calculated using the crest height of each structure and the water level as measured by the WL3 and is adjusted to account for the height of the instrument. Freeboard (F) is calculated as follows:
where h is the Oyster Castle crest height and d is the water depth at the Oyster Castle. Negative freeboard values indicate breakwater submergence while positive values indicate that the breakwater crest is exposed.
Wave steepness (S) is known to indicate the potential for a wave to be erosional or accretional and is calculated as follows:
where Hi is incident significant wave height, and L is wavelength. Limited research on wave steepness erosion thresholds exist in marsh environment; the majority of wave steepness erosion research is along sandy coastlines with a steepness threshold ranging from 0.01 to 0.03, and a typical value of 0.025 (King and Williams, 1949; Kana, 1977; Masselink et al., 2010; Lemke and Miller, 2020). Due to the lack of literature on erosional wave steepness for marshes, a wave steepness threshold of 0.017 was selected by averaging the wave steepness of the measured incident waves associated with transmission coefficients > 1. This value does not reflect true erosional conditions in marshes; however, it does provide a basis for beginning to analyze the erosional or accretional behavior of waves at a marsh edge.
Observed wave transmission coefficients were compared to the wave transmission coefficient modeled with Seabrook and Hall (1998). The Seabrook and Hall formula was selected because of all the formulas presented in Table 1, the Seabrook and Hall formula is the only one that produces instances of Kt > 1 and that was tested under 3-D conditions. The Seabrook and Hall (1998) formula is as follows:
where F is freeboard, H is incident significant wave height, B is crest width, L is wavelength, and Dn50 is nominal stone diameter. For all sites, Dn50 is 30 cm and the constructed crest width is 0.5 m. The Seabrook and Hall formula is most sensitive to relative freeboard (F/Hi) and relative crest width (B/Hi), the dimensionless ratios of freeboard and crest width, respectively, with incident significant wave height.
Results
Wave data were collected during two seasonal deployments at Gandys Beach. During S19 and W19 conditions varied, with larger incident wave heights and shorter periods being measured in W19 as summarized in Table 2. This reflects differences in seasonal storminess typical in the area. No storms occurred during the S19 deployment, while a large storm and multiple smaller storms occurred during W19, as seen in the elevated water levels depicted in Figure 4.
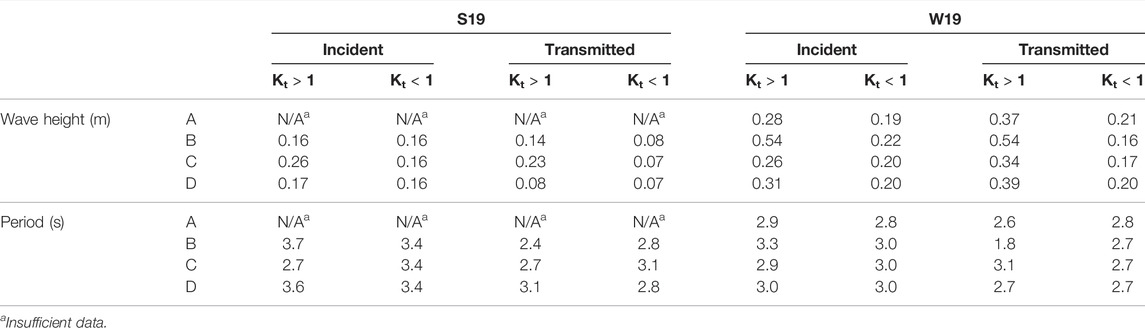
TABLE 2. Average significant wave height and period during S19 and W19 for both incident and transmitted waves during instances of amplification (Kt > 1) and reduction (Kt < 1).
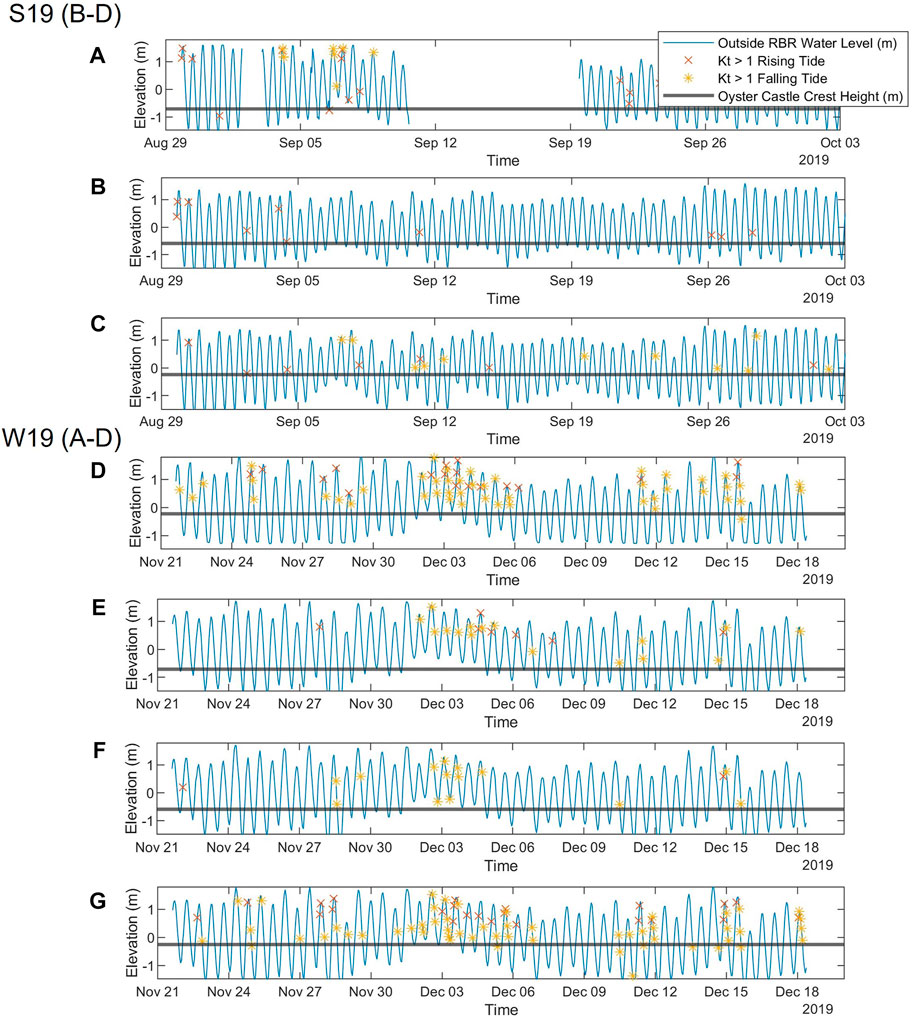
FIGURE 4. Water levels during S19 (A–C) and W19 (D–G) at Site A (D), B (A,E), C (B,F), and D (C,G). Amplificated wave height (Kt > 1) is indicated by stars and x’s. Yellow stars and red x’s indicate if amplification is on the falling or rising tide, respectively. The bold horizontal line indicates the Oyster Castle crest elevation at that Site.
The hourly, 20-min burst sampled wave gauge data collected during S19 and W19 were analyzed to determine the significant wave height, mean wave period (period), and mean water level. These data were then used to calculate wave steepness and wave transmission coefficients. Significant wave heights ranged from 0.05 to 0.7 m over the two deployments, with the average significant wave height higher during the W19 deployment (0.20 m) than during the S19 deployment (0.15 m). Wave periods ranged from around 2 s to just over 6 s over the deployments; average wave period longer in the S19 deployment (3.4 s) than in the W19 deployment (2.9 s). Variations in significant wave height and wave period were observed between the four sites. It should be noted that Sites B and C are separated by a predominantly submerged tombolo while Sites A and D both front the marsh. The average calculated Kt value was also slightly larger during the W19 deployment (0.7) than during the S19 deployment (0.6).
Regardless of season, structure orientation relative to the incident wave field was found to have minimal impact on the transmission coefficient. In Figure 5, the direction of wave approach (degrees from North) is plotted against Kt and Hi. Structure perpendicular is indicated by a bold vertical line with a 45° buffer indicated by dashed vertical lines on each side to indicate the wave directions that are considered “directly approaching” each structure. Transmission coefficient displayed similar behavior at each breakwater site, independent of incident wave direction.
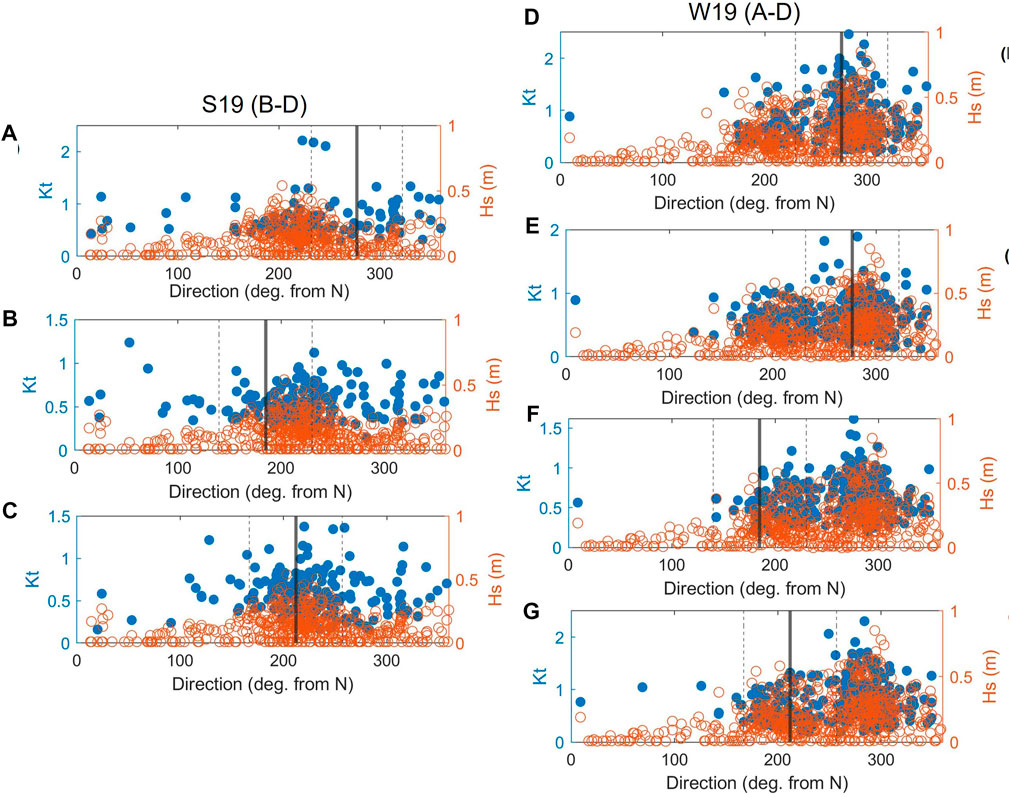
FIGURE 5. Incident wave direction and significant wave height (open red circle) from offshore ADCP and transmission coefficient (Kt) (filled blue circle) during S19 (A–C) and W19 (D–G) and at Site A (D), B (A,E), C (B,F), and D (C,G). Direction of structure perpendicular is indicated with vertical lines and have a ± 45o range. Direction of approach does not appear to have a meaningful impact on transmission coefficient.
While the majority of waves appear to be attenuated by the structures, periods of wave height amplification were observed in both seasonal datasets. In the S19 data, amplification events were more limited, and tended to occur during a small number of individual events. On the contrary, in the W19 dataset, wave amplification occurred throughout the record with amplification events more clustered during storms (Figure 4). Incident wave heights tended to be larger during cases of amplification during W19, but not necessarily during S19. Incident wave periods were relatively similar regardless of wave transmission coefficient, however transmitted mean wave periods tended to be shorter than incident mean periods (Table 2). This observed decrease in mean period is likely due to the variety of complex processes occurring at this site; waves transmitting over, around, and through structures, waves breaking or shoaling on structures, waves reflecting off the marsh, and the influence of currents.
The significant wave height and mean wave period of the incident waves, along with the freeboard were examined during instances of wave amplification (Kt > 1) (Figure 6). Overall, for Kt > 1, mean wave heights ranged from 0.05 to 0.6 m, mean wave periods ranged from 2 s to 4 s, and freeboard ranged from −2.5 to 0.5 m. The most frequent amplification events occurred when wave heights were between 0.1 and 0.3 m, periods were between 2.5 and 3.5 s, and freeboard was between −1.5 m and −0.5 m. In 8 out of 240 recorded instances of amplification, structures were emergent. These occurrences may be due to waves transmitting through the gaps between structures, waves reflecting off the marsh edge, waves interacting with strong localized currents as the marsh drains and fills, or a combination of the above.
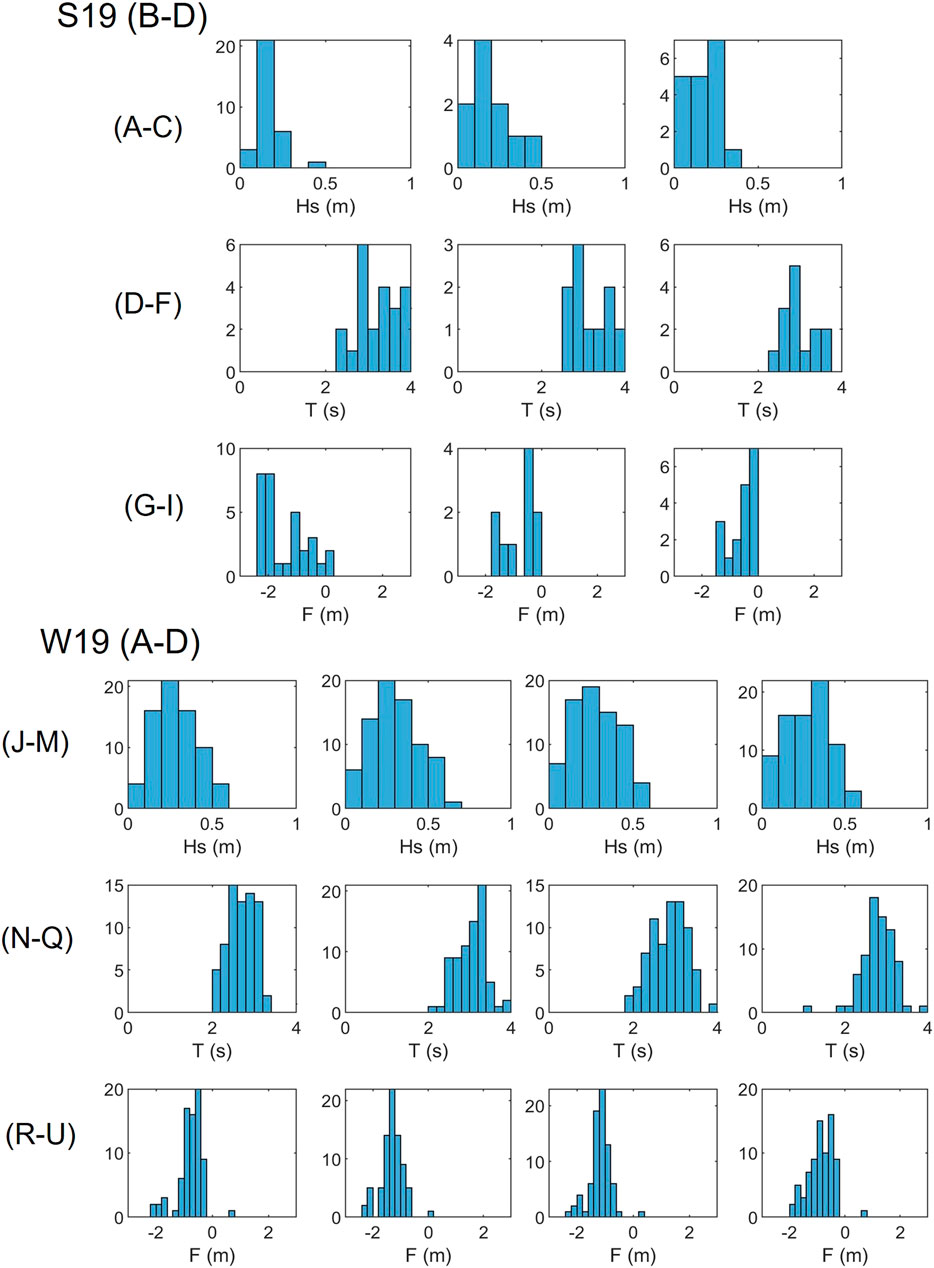
FIGURE 6. Histograms of incident significant wave height (A–C,J–M), period (D–F,N–P), and freeboard (G–I,Q–T) during S19 (A–I) and W19 (J–T) for cases of Kt > 1 at Site A (J,N,R), B (A,D,G,K,O,S), C (B,E,H,L,P,T), D (C,F,I,M,Q,U). Each histogram represents the entire deployment at the corresponding location.
The percent change in wave height between the incident and transmitted waves was found to be consistent between W19 and S19. During periods of amplification, average transmitted wave height was 14%–42% greater than incident wave height, while during times of wave reduction the average transmitted wave height was 38%–46% less than the incident wave height (Table 3). Amplification occurred when the structures were submerged, with eight exceptions (Figure 4). During the W19 deployment, amplification events occurred during falling tides 72% of the time and were clustered near storm events, possibly due to interactions with currents during marsh drainage. Conversely, during the S19 deployment, amplification events occurred during rising tides 66% of the time and no large storm events occurred (Table 4).
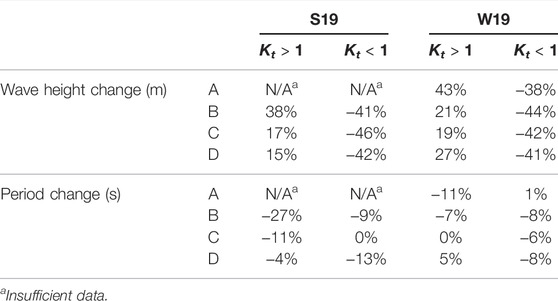
TABLE 3. Average change in significant wave height and wave period between the incident and transmitted wave heights at Sites A, B, C, and D. Negative percentages indicate a decrease of period or wave height of the transmitted wave as compared to the incident wave.
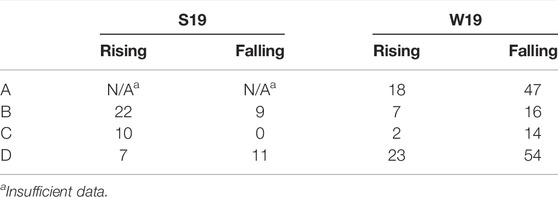
TABLE 4. Occurrences of amplification during each 20-min calculated bulk statistic at each site during rising or falling tides.
There are many possible physical explanations for this wave amplification that further research will attempt to uncover in order to provide more thorough guidance on oyster castle design. The large tidal range at Gandys Beach provides a unique opportunity to analyze wave attenuation of structures front such a marsh. The tidal range and fetch at Gandys Beach in combination with the relatively small oyster castle breakwaters and complex geography of the area provide a rich set of results for analysis.
Discussion
This study was not the first to document increased wave heights behind one of the Oyster Castle breakwaters at Gandys Beach. In a 2021 study, USGS observed both wave height amplification and reduction associated with Oyster Castle breakwaters at Site D (the only site in their study) (Wang et al., 2021). This is consistent with the observations made during S19 and W19 at all four oyster castle breakwaters studied; however, the USGS study noted that wave height amplification mostly occurred during small wave heights. This result is inconsistent with the findings of this study, where wave height amplification was observed over a range of incident wave conditions. In fact, many of the observed wave amplification events during W19 and S19 correlate with storm conditions during which elevated water levels and large wave heights were recorded. Most notably, a large storm event occurred during the W19 deployment from December 1–5, 2019. During these storm events, the wave heights were large, the wave periods remained consistent, and wave amplification was more frequent, particularly during falling tides (Figure 4). When storm surge fills the marsh, large volumes of water can drain from marsh behind the structures during falling tides, interacting with the incoming wave field, likely contributing to the observed wave amplification during some falling tides.
The ability to model wave transmission across a living shoreline structure designed for wave attenuation is tantamount for designing and constructing successful projects that provide desired outcomes at a site. As briefly discussed, several empirical models exist for predicting wave attenuation across low-crested/submerged structures (Table 1). While formulas differ, all contain freeboard, crest width, and wave height, highlighting the importance of these structure and wave field characteristics. Nearly all of these models were tested in simplified laboratory conditions and largely have not been validated by field data. Notably, only Seabrook and Hall, Friebel and Harris, and Ahrens specifically describe submerged structures, and only Seabrook is capable of producing transmission coefficient was greater than one. Field data collected at Gandys Beach provides the opportunity to evaluate the applicability of these models during more complicated, real-world conditions.
USGS compared their observations to the empirical models of (d’Angremond et.al.,1996; van der Meer et.al.,2005) but found that the modeled amplification was considerably lower than the observed amplification during emergent structure conditions. We hypothesize that this was potentially due to the gaps between the individual Oyster Castles reducing the effectiveness of the structures. USGS also identified periods during which the measured transmission coefficient was >1. Neither of the empirical equations selected by USGS can reproduce this result as they predict maximum transmission coefficients below 1.
In the current study, the observed transmission coefficients were compared against the empirical model by Seabrook and Hall (1998). Of the models considered (listed in Table 2), Seabrook and Hall is the only one capable of producing Kt > 1 and was one of the few tested in oblique wave conditions. In our analysis, the transmission coefficient was calculated with field observations and modeled using Seabrook and Hall and incident wave data. Results of the W19 and S19 deployments are plotted in Figure 7 along with the transmission coefficient predicted by the Seabrook and Hall equation. While there is significant scatter in the data, a similar relative freeboard region of amplification was produced in the modeled and observed Kt. In cases of Kt < 1 Seabrook and Hall (1998) does not perform well compared to measured Kt. This scatter is not unexpected as there are significant differences and poor agreement between the continuous low-crested breakwater structure modeled by Seabrook and Hall under controlled laboratory conditions and the highly irregular non-continuous structures and varied wave conditions observed in the field, making Seabrook and Hall (1998) an inadequate predictive tool for structures and conditions such as those at Gandys Beach. Living shorelines structures are often constructed of non-traditional materials, irregular, non-continuous, and change significantly over time with shellfish colonization or vegetation growth, and as habitat created by the living shoreline becomes more developed. These changes will alter porosity, roughness, effective stone size, dimensions of structures, relative crest width, and relative freeboard. Formulas that only represent the structures at the state of construction are inadequate to describe living shorelines and novel empirical formulas need to be developed that can estimate living shoreline wave transmission over the life of the structure.
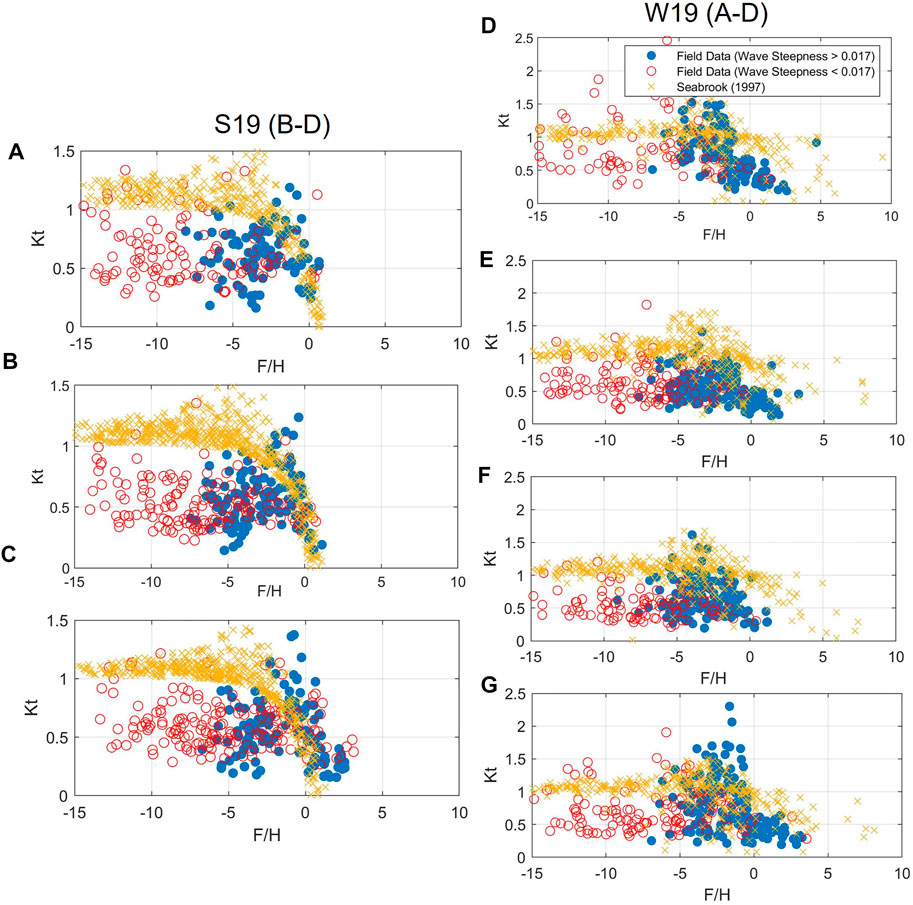
FIGURE 7. Wave transmission coefficient (Kt) vs. relative freeboard (F/Hi) as observed in field data and modeled by Seabrook and Hall (1998) during S19 (A–C) and W19 (D–G) and at Site A (D), B (A,E), C (B,F), and D (C,G). F/Hi values greater than 0 indicate structure emergence and values less than 0 indicate submergence. Observed data is grouped by incident wave steepness threshold of greater than 0.017. Waves with a steepness greater than the threshold are more likely to be erosional and potentially contribute more to marsh edge erosion.
Relative freeboard (F/Hi) and relative crest width (B/Hi) are parameters that appear in many of the empirical equations for wave transmission coefficient over submerged breakwaters, including Seabrook and Hall (1998) (d’Angremond et al., 1996; Seabrook, 1997; Seabrook and Hall, 1998; van der Meer et al., 2005; Buccino and Calabrese, 2007) (Table 1). Relative freeboard and relative crest width were examined for all observed amplification events in the W19 and S19 field data and it was found that most of these events occur when the relative freeboard is between −1 and −6 (submerged) (Figure 8), with very few events occurring when the relative freeboard was above −1 (minorly submerged to emergent). One possible explanation for wave amplification when the relative freeboard is between −1 and −6 (submerged) is wave shoaling. The waves “feel the bottom” (in this case, the oyster castle structure) and begin to shoal, but do not break, leading to an increase in transmitted height. When the relative freeboard is > −1 (minorly submerged to emergent) the depth over the structures becomes shallow enough that the waves begin to break, leading to wave height reduction in this region. Wave amplification and reduction observed when the structure is submerged (relative freeboard less than −6), may be the result of waves reflecting off the marsh or interacting with water draining from the marsh.
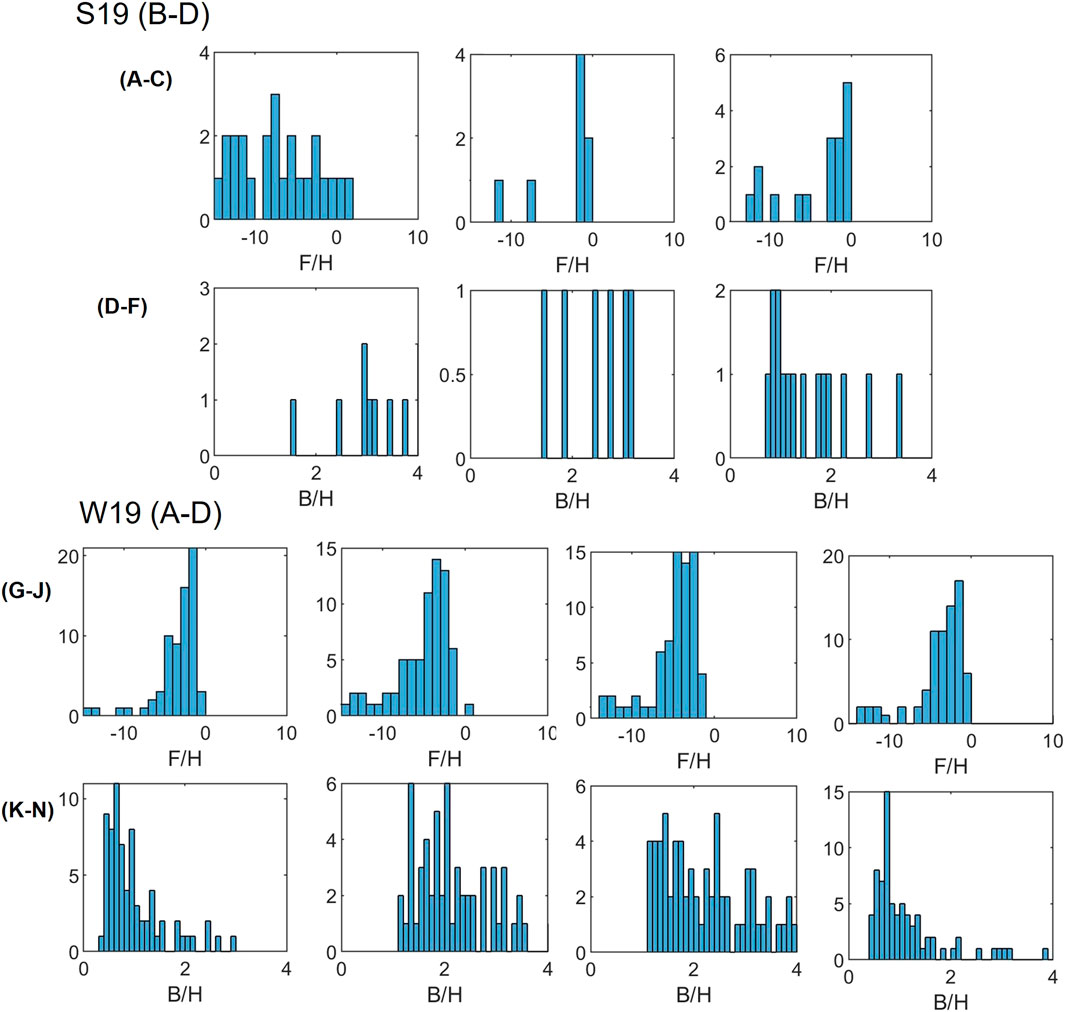
FIGURE 8. Histograms of relative freeboard (F/Hi) and relative crest width (F/B) during S19 (A–F) and W19 (G–N) at Site A (G,K), B (A,D,H,L), C (B,E,I,M), and D (C,F,J,N).
The majority of waves where relative freeboard was between −1 and −6 (submerged) have an incident wave steepness above 0.017, the basis wave steepness threshold applied in this analysis (Figure 7). Several wave amplification events occurred when relative freeboard was less than −6 (significantly submerged) and waves in this range tended to be below the wave steepness threshold. There is no clear correlation between wave steepness and wave amplification in the data collected at Gandys Beach. However, steeper waves are more likely to erode shorelines in sandy areas, some of which are present at Gandys Beach (Figure 2) and may also be a factor in marsh edge erosion and worth investigating in future research.
The Seabrook and Hall equation, consistent with most submerged breakwater relationships, suggests that wave transmission decreases as the relative crest width increases and increases as relative freeboard decreases when structures are submerged. When modeling wave transmission using Seabrook and Hall and relative freeboard is between −1 and −6 (submerged), the amplification events are very sensitive to decreases in crest width. Most amplification events at Sites A and D were clustered around relative crest widths between 0.4 and 1.5 and were skewed to the right. It is clear from this analysis that at Sites A and D relative crest width is a predictor of wave amplification. At Sites B and C, the observed amplification events occurred more evenly across a range of relative crest widths. This may be related to the position of the breakwaters, as noted in the site description. Increasing crest width during structure design may mitigate the likelihood of wave amplification. Designing to minimize instances where relative crest width is less than 0.4–1.5 may reduce these events. Additional considerations should be taken when considering future adaptability of structures to ensure that crest width remains sufficiently large when inevitable structure modifications are made to maintain structure effectiveness with sea level rise.
It is clear that wave heights are more likely to amplify at Gandys Beach Preserve when structures are submerged, relative crest width is 0.4–1.5, and relative freeboard is −1 to −6 (submerged). These results are troubling especially in areas experiencing sea level rise where the frequency of submergence is likely to increase in the future. However, the field data collected at Gandys Beach does not create a clear picture of mechanisms causing wave height amplification due to the complexity of the site. Reflection of waves off the marsh edge, wave shoaling on structure crests during certain relative crest width and relative freeboard conditions, wave transmission through gaps between Oyster Castles, and currents resulting from marsh drainage during falling tides are all possible mechanisms amplifying wave heights at the sites studied. All of these factors complicate the identification of the most appropriate empirical formula to aid design of Oyster Castle breakwaters. Additional datasets are being collected at Gandys Beach that aim to resolve some of the hypotheses and questions identified in this analysis regarding wave amplification to help inform robust guidance on living shoreline design.
Data Availability Statement
The raw data supporting the conclusions of this article will be made available by the authors, without undue reservation.
Author Contributions
Conceptualization, AB; field deployment, DB, LK, and JM; formal analysis, AB and DB; data curation, AB; writing—original draft preparation, AB; writing—review and editing, JM. and LK.; visualization, AB; supervision, JM and LK; project administration, JM. All authors have read and agreed to the published version of the manuscript.
Funding
This research was funded by National Fish and Wildlife Foundation and the Nature Conservancy. Amy Bredes work on this project was supported by a Provost’s Doctoral Fellowship awarded by Stevens Institute of Technology. A portion of DanaRose Brown’s work on the project was supported by the New Jersey Department of Environmental Protection (NJDEP) through the New Jersey Coastal Protection Technical Assistance Service (N.J.S.A. 18A:64L-1).
Conflict of Interest
The authors declare that the research was conducted in the absence of any commercial or financial relationships that could be construed as a potential conflict of interest.
Publisher’s Note
All claims expressed in this article are solely those of the authors and do not necessarily represent those of their affiliated organizations, or those of the publisher, the editors and the reviewers. Any product that may be evaluated in this article, or claim that may be made by its manufacturer, is not guaranteed or endorsed by the publisher.
Acknowledgments
The writers wish to gratefully acknowledge the contributions of The Nature Conservancy (TNC) and United States. Fish and Wildlife Service (USFWS), with special thanks to Adrianna Zito-Livingston (TNC) and Danielle McCulloch (USFWS).
References
Ahrens, J. (1987). Characteristics of Reef Breakwaters. Vicksburg, MS: Coastal Engineering Research Center. [Preprint].
Barker, C., Day, C. M., Johnson, D., Liu, P., Brennan, M., Martinez, G. R., et al. (2012). MACE. Kyoto, Japan: Kyoto University. Available at: http://www.oceanwave.jp/softwares/mace/index.php?MACE%20is.
Buccino, M., and Calabrese, M. (2007). Conceptual Approach for Prediction of Wave Transmission at Low-Crested Breakwaters. J. Waterw. Port. Coast. Ocean. Eng. 133 (3), 213–224. doi:10.1061/(asce)0733-950x(2007)133:3(213)
Conrad, K. (2015). Final Environmental Assessment for the Gandys Beach/Money Island Living Shoreline Project. Pleasantville, N.J.: U.S. Fish and Wildlife Service. Available at: https://www.fws.gov/hurricane/sandy/pdf/GandysBeachEA.pdf.
Costanza, R., Wilson, M., Troy, A., Voinov, A., Liu, S., and Agostino, J. (2006). ‘The Value of New Jersey’s Ecosystem Services and Natural Capital’. Trenton, NJ: New Jersey Department of Environmental Protection. [Preprint].
d'Angremond, K., Van Der Meer, J. W., and De Jong, R. J. (1997). “Wave Transmission at Low-Crested Structures,” in Coastal Engineering. 25th International Conference on Coastal Engineering (Orlando, Florida, United States: American Society of Civil Engineers), 2418–2427. doi:10.1061/9780784402429.187
Dame, R., and Patten, B. (1981). Analysis of Energy Flows in an Lntertidal Oyster Reef. Mar. Ecol. Prog. Ser. 5, 115–124. doi:10.3354/meps005115
Davis, J. L., Currin, C. A., O’Brien, C., Raffenburg, C., and Davis, A. (2015). Living Shorelines: Coastal Resilience with a Blue Carbon Benefit. PLoS ONE 10 (11), e0142595. doi:10.1371/journal.pone.0142595
Elsey-Quirk, T., Mariotti, G., Valentine, K., and Raper, K. (2019). Retreating Marsh Shoreline Creates Hotspots of High-Marsh Plant Diversity. Sci. Rep. 9 (1), 5795. doi:10.1038/s41598-019-42119-8
Friebel, H. C., and Harris, L. E. (2003). Re-evaluation of Wave Transmission Coefficient Formulae from Submerged Breakwater Physical Models. Melbourne, Fl 32901, USA: Department of Marine and Environmental Systems, Florida Institute of Technology.
Gedan, K. B., Kirwan, M. L., Wolanski, E., Barbier, E. B., and Silliman, B. R. (2011). The Present and Future Role of Coastal Wetland Vegetation in Protecting Shorelines: Answering Recent Challenges to the Paradigm. Clim. Change 106 (1), 7–29. doi:10.1007/s10584-010-0003-7
Gittman, R. K., Peterson, C. H., Currin, C. A., Joel Fodrie, F., Piehler, M. F., and Bruno, J. F. (2016). Living Shorelines Can Enhance the Nursery Role of Threatened Estuarine Habitats. Ecol. Appl. 26 (1), 249–263. doi:10.1890/14-0716
Gittman, R. K., Popowich, A. M., Bruno, J. F., and Peterson, C. H. (2014). Marshes with and Without Sills Protect Estuarine Shorelines from Erosion Better Than Bulkheads During a Category 1 Hurricane. Ocean Coast. Manag. 102, 94–102. doi:10.1016/j.ocecoaman.2014.09.016
Grønbech, J., Jensen, T., and Andersen, H. (1997). “Reflection Analysis with Separation of Cross Modes,” in Coastal Engineering 1996. 25th International Conference on Coastal Engineering (Orlando, Florida, United States: American Society of Civil Engineers), 968–980. doi:10.1061/9780784402429.076
Guntenspergen, G. R., Cahoon, D. R., Grace, J. B., Steyer, G. D., Fournet, S., Townson, M. A., et al. (1995). Disturbance and Recovery of the Louisiana Coastal Marsh Landscape from the Impacts of Hurricane Andrew. J. Coast. Res. 21, 324–339.
Hardaway, C. S., Milligan, D. A., Duhring, K., and Wilcox, C. A. (2017). Living Shoreline Design Guidelines for Shore Protection in Virginia’s Estuarine Environments. Gloucester Point, VA: Virginia Institute of Marine Science.
Kana, T. W. (1977). Beach Erosion During Minor Storm. J. Wtrwy., Port, Coast., Oc. Div. 103 (4), 505–518. doi:10.1061/JWPCDX.0000056
Kerr, L., and Miller, J. K. (2020). ‘Gandy’s Beach Living Shoreline Project, Wave Attenuation Monitoring Interim Report’. Hoboken, NJ: Stevens Institute of Technology, Davidson Labroratory. [Preprint], (TR SIT-DL-20-9-CV1).
King, C. A. M., and Williams, W. W. (1949). The Formation and Movement of Sand Bars by Wave Action. Geogr. J. 113, 70. doi:10.2307/1788907
Koch, E. W., Barbier, E. B., Silliman, B. R., Reed, D. J., Perillo, G. M., Hacker, S. D., et al. (2009). Non-Linearity in Ecosystem Services: Temporal and Spatial Variability in Coastal Protection. Front. Ecol. Environ. 7 (1), 29–37. doi:10.1890/080126
Kukulka, T., Jenkins, R. L., Kirby, J. T., Shi, F., and Scarborough, R. W. (2017). Surface Wave Dynamics in Delaware Bay and its Adjacent Coastal Shelf. J. Geophys. Res. Oceans 122 (11), 8683–8706. doi:10.1002/2017JC013370
Lemke, L., and Miller, J. K. (2020). Evaluation of Storms Through the Lens of Erosion Potential Along the New Jersey, USA Coast. Coast. Eng. 158, 103699. doi:10.1016/j.coastaleng.2020.103699
Leonardi, N., Ganju, N. K., and Fagherazzi, S. (2016). A Linear Relationship Between Wave Power and Erosion Determines Salt-Marsh Resilience to Violent Storms and Hurricanes. Proc. Natl. Acad. Sci. U.S.A. 113 (1), 64–68. doi:10.1073/pnas.1510095112
Marani, M., D’Alpaos, A., Lanzoni, S., and Santalucia, M. (2011). Understanding and Predicting Wave Erosion of Marsh Edges: Marsh Edge Erosion. Geophys. Res. Lett. 38 (21), L21401. doi:10.1029/2011gl048995
Mariotti, G., and Fagherazzi, S. (2010). A Numerical Model for the Coupled Long-Term Evolution of Salt Marshes and Tidal Flats. J. Geophys. Res. 115 (F1), F01004. doi:10.1029/2009JF001326
Masselink, G., Russell, P., Blenkinsopp, C., and Turner, I. (2010). Swash Zone Sediment Transport, Step Dynamics and Morphological Response on a Gravel Beach. Mar. Geol. 274 (1–4), 50–68. doi:10.1016/j.margeo.2010.03.005
Miller, J. K., Rella, A., Williams, A., and Sproule, E. (2015). Living Shorelines Engineering Guidelines. Hoboken, NJ: Stevens Institute of Technology. SIT-DL-14-9-2942.
Narayan, S., Beck, M. W., Wilson, P., Thomas, C. J., Guerrero, A., Shepard, C. C., et al. (2017). The Value of Coastal Wetlands for Flood Damage Reduction in the Northeastern USA. Sci. Rep. 7 (1), 9463. doi:10.1038/s41598-017-09269-z
Niles, L. J., Smith, J. A., Daly, D. F., Dillingham, T., Shadel, W., Danihel, M. S., et al. (2013). Restoration of Horseshoe Crab and Migratory Shorebird Habitat on Five Delaware Bay Beaches Damaged by Superstorm Sandy. Bordentown: L.J. Niles Associates.
O’Donnell, J. E. D. (2017). Living Shorelines: A Review of Literature Relevant to New England Coasts. J. Coast. Res. 33 (2), 435–451. doi:10.2112/JCOASTRES-D-15-00184.1
Scyphers, S. B., Powers, S. P., Heck, K. L., and Byron, D. (2011). Oyster Reefs as Natural Breakwaters Mitigate Shoreline Loss and Facilitate Fisheries. PLoS ONE 6 (8), e22396. doi:10.1371/journal.pone.0022396
Seabrook, S. R., and Hall, K. R. (1998). Wave Transmission at Submerged Rubblemound Breakwaters. Coast. Eng. Proc. 1 (26), 2000.
Seabrook, S. R. (1997). Investigation of the Performance of Submerged Rubblemound Breakwaters. Ontario, Canada: Queen’s University.
Smith, C. S., Puckett, B., Gittman, R. K., and Peterson, C. H. (2018). Living Shorelines Enhanced the Resilience of Saltmarshes to Hurricane Matthew (2016). Dryad Morehead City, NC: Dryad. doi:10.5061/DRYAD.NH71T5C
van der Meer, J. W., Briganti, R., Zanuttigh, B., and Wang, B. (2005). Wave Transmission and Reflection at Low-Crested Structures: Design Formulae, Oblique Wave Attack and Spectral Change. Coast. Eng. 52 (10–11), 915–929. doi:10.1016/j.coastaleng.2005.09.005
Walling, K., Gaffney, D., and Moses, K. (2017). Wave Attenuation and Sediment Transport Monitoring of Living Shorelines in the Delware Bay. U.S.: Mott MacDonald.
Wang, H., Capurso, W., Chen, Q., Zhu, L., Niemoczynski, L., and Snedden, G. (2021). Assessment of Wave Attenuation, Current Patterns, and Sediment Deposition and Erosion During Winter Storms by Living Shoreline Structures in Gandys Beach, New Jersey. Reston, Virginia: U.S. Geological Survey, 37. [Preprint].
Weis, J. S., Watson, E. B., Ravit, B., Harman, C., and Yepsen, M. (2021). The Status and Future of Tidal Marshes in New Jersey Faced with Sea Level Rise. Anthr. Coasts 4 (1), 168–192. doi:10.1139/anc-2020-0020
Wiberg, P. L., Taube, S. R., Ferguson, A. E., Kremer, M. R., and Reidenbach, M. A. (2019). Wave Attenuation by Oyster Reefs in Shallow Coastal Bays. Estuaries Coasts 42 (2), 331–347. doi:10.1007/s12237-018-0463-y
Keywords: living shorelines, NNBF, oyster castle, breakwater, wave amplification, wave transmission
Citation: Bredes AL, Miller JK, Kerr L and Brown DR (2022) Observations of Wave Height Amplification Behind an Oyster Castle Breakwater System in a High-Energy Environment: Gandys Beach, NJ. Front. Built Environ. 8:884795. doi: 10.3389/fbuil.2022.884795
Received: 27 February 2022; Accepted: 23 May 2022;
Published: 22 June 2022.
Edited by:
Tori Tomiczek, United States Naval Academy, United StatesReviewed by:
Qin Chen, Northeastern University, United StatesMeagan Wengrove, Oregon State University, United States
Copyright © 2022 Bredes, Miller, Kerr and Brown. This is an open-access article distributed under the terms of the Creative Commons Attribution License (CC BY). The use, distribution or reproduction in other forums is permitted, provided the original author(s) and the copyright owner(s) are credited and that the original publication in this journal is cited, in accordance with accepted academic practice. No use, distribution or reproduction is permitted which does not comply with these terms.
*Correspondence: Amy L. Bredes, YWJyZWRlczFAc3RldmVucy5lZHU=