 Zohreh Ghafori fard1
- 1Department of Civil Engineering, Yazd University, Yazd, Iran
- 2Faculty of Civil Engineering, Budapest University of Technology and Economics, Budapest, Hungary
Today, with the expaansion of cities and the growth of urbanization, followed by climate change, it is crucial to prevent the occurrence of floods and control it in cities. Porous pavement, including porous asphalt, is known as one of the best methods for urban flood control due to its two properties of evaporation and permeability. The purpose of this study is to modify the gradation of porous asphalt in order to optimize its permeability and evaporation for low-traffic urban passages. For this purpose, permeability, evaporation, and Cantabro tests were performed on samples with different gradations and percentages of bitumen; then, using Design Expert software, the gradation and percentage of optimal bitumen were determined. Finally, the performance of the asphalt gradation and optimal bitumen percentage were evaluated by performing empty space percentage, modified Latman, Marshall, and psychological strength tests and Cantabro tests. The results show that with finer gradation, the permeability, evaporation, and minimum bitumen percentage are reduced by about 55%, 82%, and 60%, respectively. Also, the gradation is medium with 4% bitumen gradation and the percentage of bitumen is optimal, which has a good performance in low-traffic urban passages.
1 Introduction
Today, the increase in urbanization has made cities less able to provide services to citizens, which reduces the quality of urban life. One of the basic issues in serving citizens is solving the physical problems of cities. One of the most important physical problems of cities that severely affects urban life every year is the problem of flooding of public roads during rain and floods (Borana et al., 2016; Rode et al., 2018). Figure 1 shows an example of flooding of urban passages.
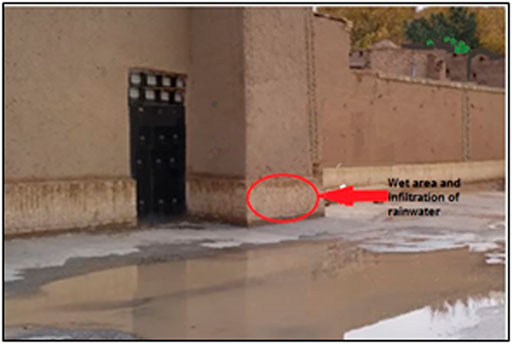
FIGURE 1. Flooding of urban passages, infiltration of water into the body of mud structures.
One of the best flood control strategies is porous pavement (Mohammed et al., 2021), because when it rains and snows, the surface of streets and sidewalks are often covered with impermeable asphalt mixture and concrete, which prevents water from penetrating into the ground and causes inundation in urban passages, but permeable surfaces allow rainwater to seep into the subsoil (Jusić et al., 2019a), which can be filtered and reused before being stored in the ground or be transmitted by drainage systems. Porous pavements include a mixture of porous asphalt (PA) and porous concrete and permeable block surfaces where porous asphalt is mostly used in urban roads (Jusić et al., 2019b), However, most developed countries of the world are trying to correct the existing unsuitable pavement or replace it with a suitable pavement according to the project conditions (Almássy and Joó, 2009).
Porous asphalt mixture is in fact the same as ordinary asphalt mixture, which has less fine-aggregated and more uniform gradation and therefore more void percentage (Xu et al., 2018; Praticò et al., 2020; Ma et al., 2021); so, the mixture of porous asphalt mixture contains more than 70% is the volume of coarse-aggregates. The original idea of porous asphalt mixture was to reduce the height and intensity of runoff on the pavement of airports and thus reduce the phenomenon of slippery and aircraft landslides, but was originally developed in the 1970s and was also used for parking lots and landscaping and till now has performed well in reducing runoff (Raspati et al., 2017). In fact, this type of asphalt mixture has been designed and built throughout history, to be used as storage systems and for runoff permeability. The structure of this asphalt mixture is designed to maximize water permeability (Adams and Cahill, 2003).
Porous asphalt mixture pavements are either applied in the form of a full-depth permeable pavement (FDPP) that includes several permeable layers for runoff management or as a thin layer (5–8 cm) of porous asphalt mixture on ordinary asphalt mixture, which is also called porous friction courses (PFC) and to reduce runoff and increase safety in rainy conditions and to reduce noise pollution (Hu et al., 2017).
The asphalt mechanical properties of porous asphalt are also suitable for comparison with traditional conventional asphalt concrete hounds. An international research project on several types of asphalt wearers (Poulikakos et al., 2006; Gáspár, 2016) found that PA (porous asphalt) showed a permanent deformation of less than that of the other types of asphalt mixtures tested. The reason for this was found that the frame of the PA additive is resistant to traffic loads to an increased extent.
In the case of porous asphalt, the excellent slip friction factor and the lower rolling noise can be highlighted. According to Poulikakos, porous asphalt wear layers have better slip resistance than those made of solid asphalt mixtures (Poulikakos et al., 2006; Gáspár, 2016). This difference is significant on a particularly wet road. It has also been found that during the operating life, the slip resistance of PA covers increases, while that of conventional, compact asphalt remains unchanged.
A Norwegian research has compared the rolling noise levels of asphalt concrete, mastix asphalt, and leek asphalt layers, and the measured lower noise levels on the PA layer compared to asphalt concrete and mastix asphalt, especially at speeds of 80 km/h, even on worn roads (Aksnes, 2009; Gáspár, 2016).
The most common type of deterioration of porous asphalt pavements is according to a research report by the Federal Department of Transportation of the U.S. state of Minnesota (Lebens, 2012; Gáspár, 2016) and an Iranian university (Hamzah and Hardiman, 2004; Gáspár, 2016), that is the scorching of crushes, which is typically triggered by the aging of bitumen.
Numerous studies have proven the positive performance of permeable pavements in reducing runoff volume. For example, research by Hu et al. showed that the implementation of a porous pavement at the level of 50% and 70% of hazardous areas reduced floods by 50% and 70%, respectively (Ahiablame et al., 2012). Also, according to the results of various researches from 1999 to 2011, the average runoff reduction from porous pavements varied between 50 and 93% (Cheng et al., 2019).
Nadeem Akhtar et al. also investigated the systematic behavior of porous asphalt pavements in traffic conditions. By determining the permeability of porous asphalt in the laboratory by the falling head method, they found that the maximum permeability for a fresh sample was 0.394 cm/s and after 1 year of environmental exposure was 0.245 cm/s. Therefore, the use of porous asphalt in urban passages and roads reduces the risk of floods and increases the protection of drivers in adverse weather conditions. They also state that achieving the desired permeability and strength (depending on the weather conditions and type of road) can be achieved only by modifying the gradation of porous asphalt (Akhtar et al., 2021). Also, according to Kumar Suman and Kumar studies, porous asphalt is an efficient way to control storm water runoff that is commonly used in developed countries. The cost of a permeable pavement is 15–80% lower than other storm water management measures, and since increasing the amount of drainage and filtered runoff by porous asphalt can reduce the flow rate after flood events, its use is highly recommended for runoff control (Suman and Kumar, 2022).
Permeable pavements are useful, in addition to permeability with using the evaporation mechanism, especially when the lower layers do not have much permeability, repel runoff, and prevent flooding. Research has shown that the high capacity of permeable pavements to retain water in the road body and connect it through the voids to the surface, leads to a higher evaporation rate than impermeable surfaces. Comparison of an impermeable pavement with a permeable pavement shows a 16% increase in the evaporation of permeable pavements. The cooling effects of evaporation can improve the climate of the city even a few days after the rain. With this type of pavement, even on a large scale, unfavorable weather conditions such as hot and dry weather can be prevented (Brown and Borst, 2015). Explaining that quantitative studies of permeability of permeable pavement systems are limited to a few laboratory studies and an application, Brun and Borst conducted a study to measure the evaporation of three types of permeable pavements including permeable interlocking concrete paves (PICP), permeable concrete (PC), and porous asphalt mixture (PA) and the results showed that if the goal is to maximize evaporation from a region, permeable pavement should be implemented in the area and the average annual evaporation level, permeability level of the pavement surface in the same climate as 8%, 12%, or 7% annual rainfall is for PICP, PC, or PA (Hu et al., 2020).
In fact, two important parameters in a porous asphalt mixture are permeability and evaporation, which determine the performance of the porous asphalt mixture in reducing runoff. Factors affecting the permeability of the porous asphalt mixture include the maximum size of rock materials, aggregate shape, aggregate dimension ratio, and arrays of aggregates, so that, increasing the maximum size of the rock materials increases permeability and the more uniform the aggregate size and smaller the fine aggregates, the greater the porosity, also, the more cube-shaped and uniform the aggregates are, the more air void there will be, however, the ratio of aggregate dimensions and the use of uniform aggregates and the removal of fine aggregates have a greater effect on permeability than the shape of aggregates (Król et al., 2018). On the other hand, the high capacity of permeable pavements in holding water in the road body and connecting it through voids with the surface, environmental conditions such as temperature, air flow, humidity, solar radiation, and internal properties of porous pavements such as surface layer and subsurface profile, void, void size distribution, and surface water availability, affect the rate of evaporation in the porous pavement (Ahiablame et al., 2012; Cheng et al., 2019). In fact, what affects the performance of the porous asphalt mixture in reducing runoff (amount of permeability and evaporation) is the type of grading of the porous asphalt mixture (Yu et al., 2020).
To investigate evaporation and permeability, one must have information about the fluid flow in the permeable pavement; because porous asphalt mixture drains raindrops quickly and prevents runoff in the passages (Figure 2A) (Tziampou et al., 2020), water flow is important in this type of asphalt mixture. Thus, research on the flow of liquid through porous media dates back to 1856, when Henry Darcy experimentally determined the velocity of a liquid flowing through sand columns and introduced the Darcy Law. Until now, Darcy’s law has been widely used in hydrology to model groundwater flow. Multidirectional flow through a porous medium involves different processes, depending on the phase of the fluid (liquid or gas). In the liquid phase, the fluid flow is driven by gravitational forces, capillary forces, and pressure, and temperature gradients, while in the gas phase, the diffused current depends on the vapor density gradient (Aboufoul et al., 2019). On the other hand, in a study conducted by Abolfol et al., it was stated that evaporation in a porous asphalt mixture environment is done in two stages according to Figure 2B and formulas have been presented for these two stages. The first stage is drying the porous asphalt mixture surface (Eq. 1)and surface water evaporation asphalt mixture and the second stage is water droplets rising through the voids with the help of a capillary phenomenon (Eq. 2), and finally, the total evaporation rate will be the sum of these two values (Eq. 3) (Peng et al., 2021).
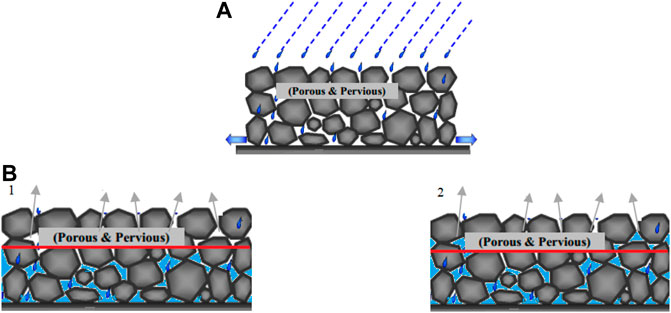
FIGURE 2. (A) Permeability of rain drops in the porous asphalt mixture (B) Evaporation stages in the porous asphalt mixture pavement.
where
A = evaporation level.
D = outdoor steam release coefficient (0.00166
Csat = saturated water vapor density.
C∞ = water vapor density above the surface
δ = thin layers of air above the asphalt mixture.
Deff = effective vapor diffusion coefficient in porous medium
ϑ = the distance between the dry surface and the saturation surface.
Despite extensive research on fluid transfer processes in porous media, such processes are rarely applied to permeable structures and are not sufficiently felt in urban drainages (Yu et al., 2020).
So far, limited research has been done on gradation modification. In this research, in order to achieve a specific goal, the gradation of porous asphalt is modified. For example, Hamzeh et al. stated that porous asphalt is an effective way to reduce accidents due to its ability to drain surface runoff. They tried to improve the gradation of porous asphalt in Korea for use in Malaysia, but this was done by balancing the permeability of the porous asphalt mixture and the proposed gradation for Malaysia was achieved by removing 12.6% of fine granules from the Korea gradation, which had good drainage properties (Hamzah et al., 2004). We can also refer to the research of Ren and his colleagues. In this study, Ren et al., stating that the aggregate structure plays an important role in the pavement performance of porous asphalt mixtures, investigated the effects of aggregates of different sizes on air gap ratio and macroscopic load-bearing capacity of aggregates to provide an aggregate gradation with a strong aggregate structure. The results of this study show that the proposed gradation (Figure 3) provides a better pavement performance (in terms of porous asphalt pavement resistance) for the porous asphalt mixture (Ren et al., 2021).
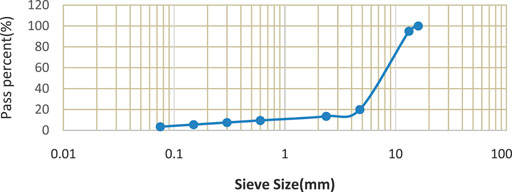
FIGURE 3. Proposed gradation to increase the resistance of porous asphalt.
The aim of this study was to modify the gradation of porous asphalt in order to optimize its evaporation and permeability in order to gradually release moisture under the streets of low-traffic urban roads due to subsurface evaporation and subsurface drainage, and thus prevent flooding of urban roads. Studies performed on this type of hot asphalt include measuring the evaporation permeability of different porous binder granulations in an innovative and new way and determining the relationship between these properties and effective size
2 Research Methodology
In this study, the first cubic samples were made and then permeability and evaporation tests were performed in an innovative way. Subsequently, 4-inch Marshall samples were made and these samples were tested by the Cantabro test. Finally, with the help of the Cantabro test and the results of evaporation and permeability tests and using the response surface method with the help of Design Expert software, the optimal grain size and percentage of bitumen for using a porous binder in low-traffic urban thoroughfares were determined. At the end, its performance was evaluated. Figure 4 shows the flowchart of the research process.
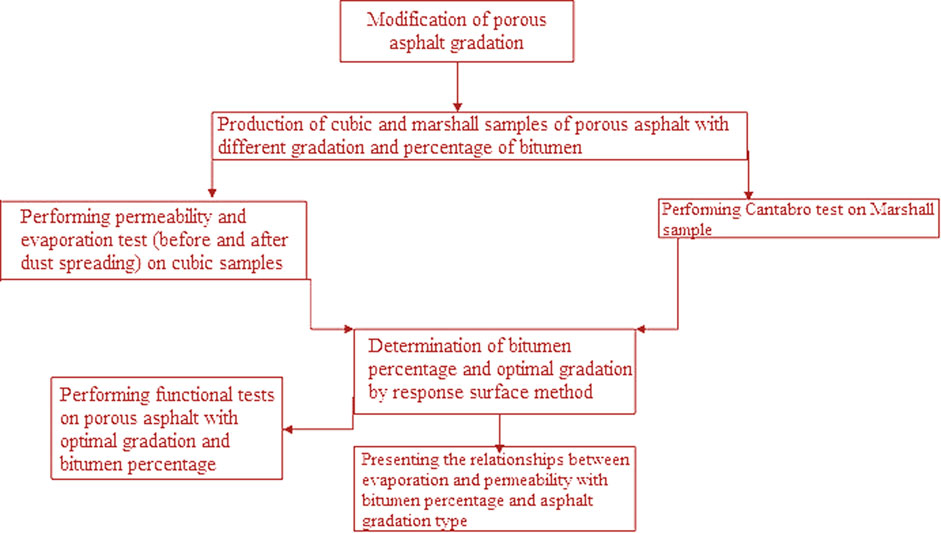
FIGURE 4. Flowchart of the research process.
2.1 Material
Materials used include water and dust collected from traditional texture passages (to measure infiltration and evaporation in the five aggregates of a porous binder layer). PG64-22 stone and bitumen materials (Supplementary Tables S2, 1) are for making samples.
In this study, the binder gradation was modified and a new gradation called porous binder was introduced. In setting up this new grading, an attempt has been made to match the binder grading with the least error to the proposed porous asphalt grading of the porous asphalt structure manual for runoff management. In fact, this gradation was corrected by coarse-graining the interlayer by removing aggregates smaller than 2 mm and changing the passage rate of the sieve by 4.75 and setting a maximum of 25% for this sieve. As a result, porous binder granulation was obtained. The lower limit of the porous interlayer granulation is given in Supplementary Table S3. Also, the diagram of this granulation in comparison with binder granulation and porous asphalt granulation proposed in the porous asphalt structure manual for runoff management is shown in Figure 5 respectively.
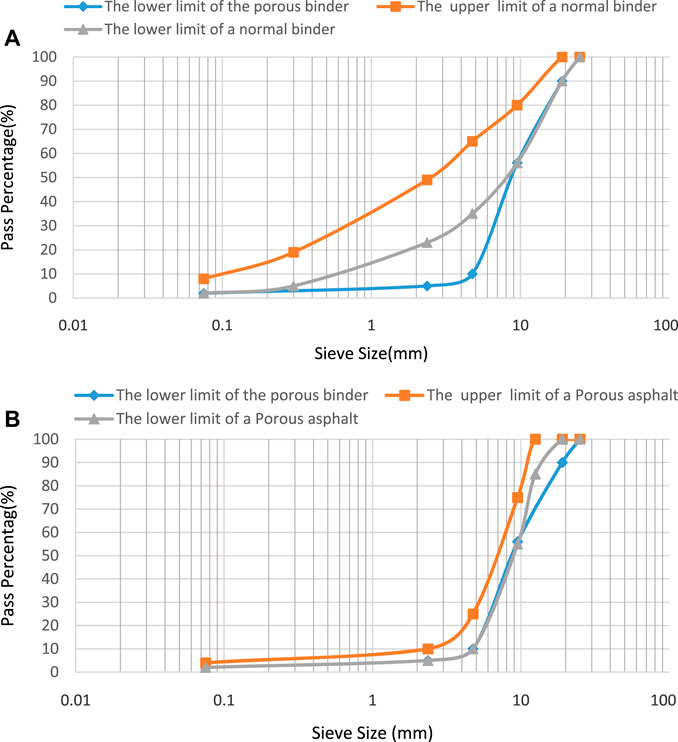
FIGURE 5. (A) Low grain size limit of the porous binder compared to a conventional binder. (B) Low limit of the proposed porous binder gradation compared to the proposed porous asphalt gradation of the porous asphalt structure manual for runoff management.
The upper limit of porous binder granulation is given in Supplementary Table S4. Also, the diagram of this granulation in comparison with the intergranular granulation of the proposed porous asphalt grading of the porous asphalt structure manual for runoff management is shown in Figure 6, respectively.
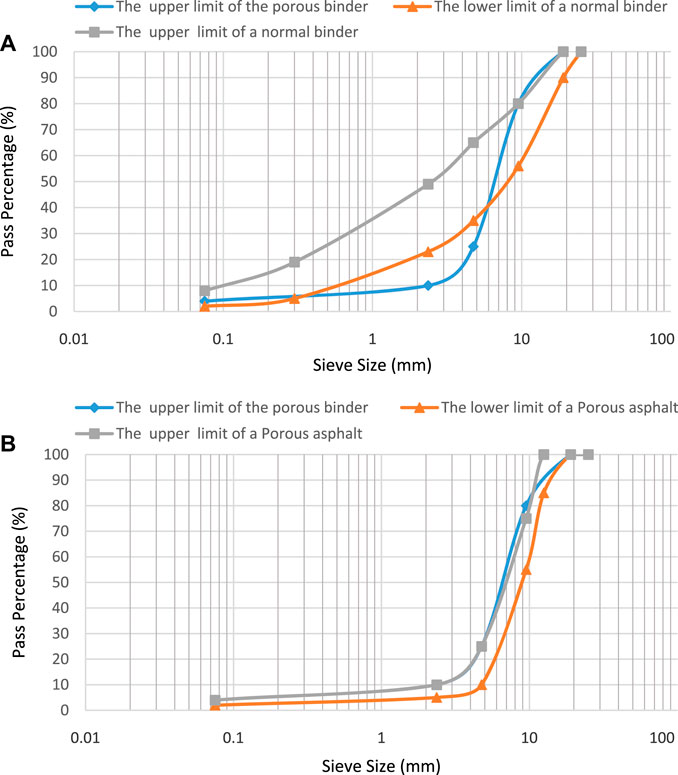
FIGURE 6. (A) Upper limit of proposed grain size of the porous binder compared to a conventional binder. (B) Upper limit of proposed intergranular granulation compared to the proposed porous asphalt aggregation of the porous asphalt structure manual for runoff management.
Finally, this granulation is according to Supplementary Table S5 and Figure 7.
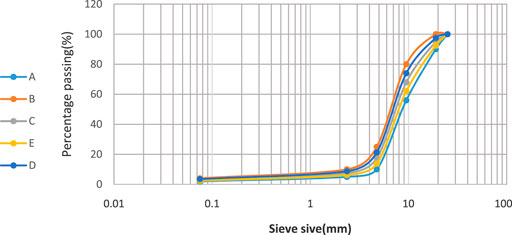
FIGURE 7. Types of gradation studied in this research.
Since after a while of asphalt mixture covering the surface is covered with dust, it is necessary to check the evaporation performance and its permeability under these conditions. For this purpose, from 18 different points in terms of location, traffic, and width of the passage in an area of one square meter of traditional texture passages, dust is collected (Figure 7) and weighed such that the maximum, minimum, and average amounts of dust are 100, 11 and 51.95
2.2 Sample Preparation
The samples made in this research include cube samples with dimensions of 15 cm by 15 cm and 4-inch Marshalls, and their images are shown in Figure 8. Samples are known with different bitumen percentages of 3, 3.5, and 4%. Because the cost of construction and economic issues are important to us, and on the other hand, the amount of bitumen has a significant role in costs, the percentage of bitumen is limited to 4%.
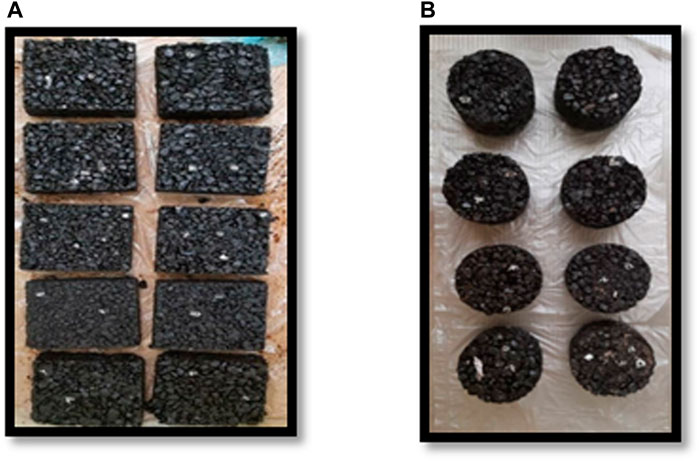
FIGURE 8. (A) Some samples of cubic specimens with dimensions of 15 by 15 cm. (B) Some samples of 4-inch Marshals.
3 Test Method
3.1 Relative Permeability Test
Porous asphalt mixture should be able to drain raindrops quickly to prevent runoff in the passages (Hu et al., 2020), rather than allowing a volume of water to pass through. Laboratory permeability testing devices currently in use measure the degree of permeability when a volume of runoff passes through it, which does not make sense with the explanations provided, so a device was built to allow the permeability of rainwater droplets. Therefore, an innovative device and method was used in this research. Measured by the porous asphalt mixture based on the fixed head method, the image of this device and its three-dimensional shape are shown in Figure 9A.
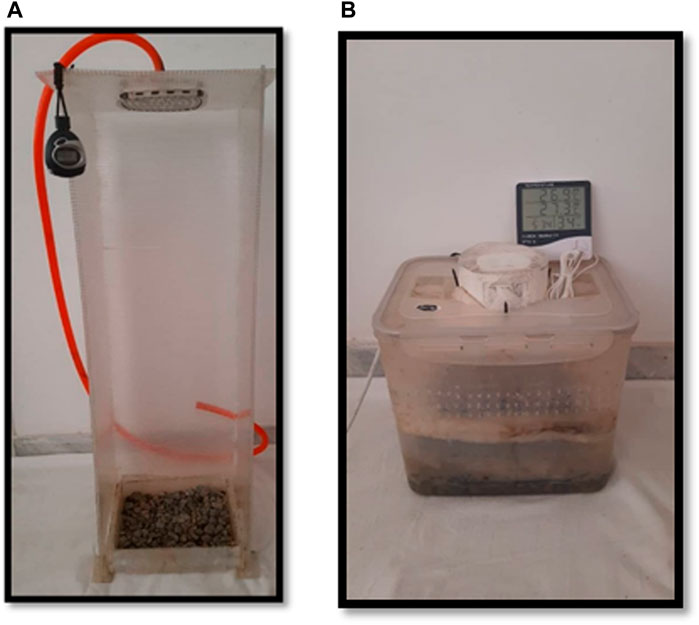
FIGURE 9. (A) Image and three-dimensional shape of the permeable device. (B) Three-dimensional shape of the evaporator device.
The test method is that the sample is placed in a special place under the dripper, then the faucet is opened and the amount of water should be adjusted so that the amount of water entering the sample and the amount of water leaving the sample is the same, in fact, the water on the sample does not penetrate and allow full incoming water. Then, a special container with a certain volume is taken under the dripper and the time it takes for the container to be filled with water is measured and recorded with a stopwatch and the amount of flow and then the discharge is calculated using Eqs. 4, 5.
Q = discharge in cubic meters per second.
V = container volume in cubic meters.
t = container filling time in seconds.
K = permeability in meters per second.
A = sample area of asphalt mixture that passes water in square meters.
It should be noted that this is a fast, low cost, easy, and accurate method to obtain relative permeability and compare the permeability of different types of porous asphalt samples. In fact, this method is not for measuring absolute permeability but for the purpose of measuring relative permeability.
3.2 Evaporation Test
The amount of evaporation is strongly influenced by environmental factors such as temperature, humidity, wind intensity, and the amount of sunlight and since the environmental conditions are very different in different regions, it is not possible to provide a constant value for the evaporation of each asphalt mixture sample and only its values can be compared for different samples under the same conditions (Aboufoul et al., 2019). Therefore, an innovative device and method was used in this research. For this reason, to compare the good value of different samples, the samples are placed in a container with a certain amount of water in the same conditions and after at least 1 day by calculating the difference between the weight of the container with the sample and water before the test and the container with the sample and the remaining water after 1 day, the amount of evaporated water is obtained (Tziampou et al., 2020). For this purpose, a device was developed to perform the evaporation test based on these principles, which is shown in Figure 9B and its 3D shape. The process of performing this test with an evaporator is as follows: put the sample in its special place and then seal it with the help of a special foam around the sample. Then, close the lid and weigh and record the whole device, and then place the device in a suitable place and turn on the fan. After 24 h, the whole device should be weighed again and the maximum and minimum amounts of hygrometer and thermometer should be checked and recorded. Using Eq. 6, the amount of evaporation per day is calculated. For the same environmental conditions, especially humidity and temperature, the device should be placed in a suitable place, and for other samples, the location of the device should be fixed.
E = evaporation rate in grams per day.
This test was performed both in the initial state (for all samples) and after the dust dispersal (for the optimal sample).
3.3 Determination of Grading and Optimal Bitumen Percentage by Response Surface Methodology
Response Surface Methodology (or RSM for short) introduced by Box and Wilson in 1951: A set of statistical methods and applied mathematics to build experimental models and aims to optimize the response (output variable) which is affected by several independent variables (input variables) that in each experiment changes are made in the input variables in order to determine the causes of changes in the response variable (Pereira et al., 2021).
In this study, the response surface methodology was used to determine the optimal grading and percentage of bitumen. For this purpose, Design Expert software was used to perform the statistical analysis and optimization and to provide a mathematical model between independent and dependent parameters, and independent variables including bitumen percentage and the type of grading is expressed by the effective size parameter and the dependent variables or response are the amount of permeability and evaporation of the porous asphalt mixture and the results of the Cantabro test.
Since in this study, runoff reduction in traditional texture passages with the lowest percentage of bitumen (economics of the project) and the target passages have a light and limited volume of motor traffic (even without traffic) and the issue of resistance is not raised, therefore, the porous binder layer with high permeability and evaporation rate, and at the same time with a minimum percentage of bitumen, the separation rate of aggregates in the Cantabro test is a maximum of 25%, which is the optimal asphalt mixture to reduce runoff in a traditional texture. For this purpose, to determine this optimal gradation, Design Expert software and the average results of evaporation, conformance, and the Cantabro tests were used. And since to determine the degree of permeability and evaporation of the porous binder layer, related tests must be performed and performing these tests is both time consuming and requires a special device, with the help of Design Expert software, the relationship between the percentage of bitumen and the effective size parameter or d10 (as a representative of gradation) with the rate of evaporation and infiltration was obtained, which can be estimated without testing (Figure 10).
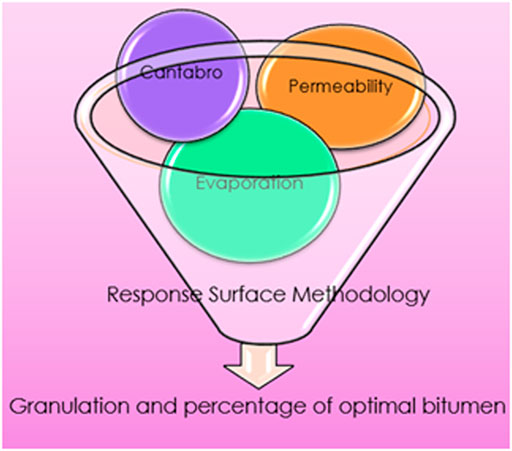
FIGURE 10. Determination of the grain size and percentage of optimal bitumen by using the response surface method.
3.3.1 Cantabro Test
One of the problems of the porous asphalt mixture is the rapid separation of its constituent particles. The Cantabro test is used to measure the decay rate of a porous asphalt mixture sample. Also, the result of this test can be used to check the adhesion of the mixture. In this experiment, Marshall samples are placed inside the drum of a Los Angeles test machine (without a metal ball) and the percentage of weight lost (separated) from the prototype after 300 rotations of the machine drum at 30 rpm with Eq. 7 is gained (Figure 11). The ambient temperature should be 25°C and the sample should remain at this temperature for 4 h. At this temperature, the weight loss of the sample should not exceed 25% (Isenring et al., 1990).
where P = percentage of wear,
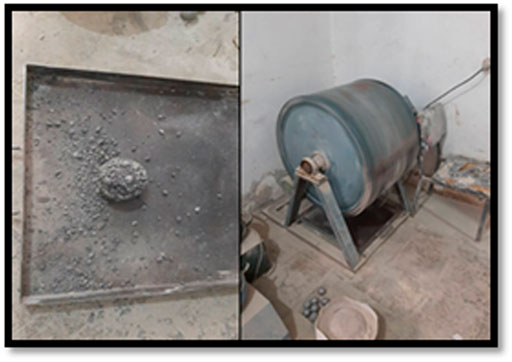
FIGURE 11. Los Angeles test and demolished sample of asphalt mixture.
3.4 Performance Tests of Porous Asphalt With Grain Size and Optimal Bitumen Percentage
3.4.1 Test to Determine the Percentage of Empty Space
Empty space in a compacted sample refers to the air bubbles inside the sample, which is expressed as a volume percentage of the volume of the compressed sample. In the case of porous asphalt, the percentage of empty space is used to determine the upper limit of the bitumen. It is recommended that the percentage of empty space for porous asphalt mixture should not be less than 20%, but the minimum amount is 18% (Management and Program Organization of the country, 2022). To obtain the percentage of empty space of the asphalt sample, the true specific weight of the hot asphalt mixture
3.4.2 Modified Latman Test 5
Modified Latman test according to the ASTM D 4867 standard was performed to evaluate the moisture resistance of compacted asphalt mixtures under saturated conditions or water melting and ice cycles.
3.4.3 Marshall and Psychological Compressive Strength Test
In the case of porous asphalt, compressive strength is often not considered and the load factor of this type of asphalt is considered zero. If in fact this is not the case, the porous asphalt proposed in this study has been studied for use in areas with low-vehicle traffic or even narrow crossings without traffic or only for pedestrians. Therefore, it is necessary that this porous binder has the minimum necessary resistance against pedestrian crossing or low-traffic load. For this purpose, the Marshall compressive strength test was performed on a porous asphalt sample with granulation and optimal bitumen percentage in accordance with theASTM D6927 standard.
3.4.4 Aged Cantabro Test
In order to evaluate the sensitivity of the porous asphalt mixture to premature oxidation, the Cantabro test was used on aged samples. In this experiment, 2 Marshall samples were placed at 60°C for 7 days and then the samples were cooled to ambient temperature. Finally, the Cantabro test on these samples (aged samples) is performed according to the young sample. The average amount of weight loss in this experiment should not be more than 30% (Montes et al., 2005; Lyons and Putman, 2013).
4 Results and Discussion
4.1 Permeability Test Results
4.1.1 Initial Permeability Test Results
A permeability test with three repetitions for each sample was performed according to the method mentioned in section 3–1 and the average permeability for each grading was calculated and its values are presented in Figure 12A.
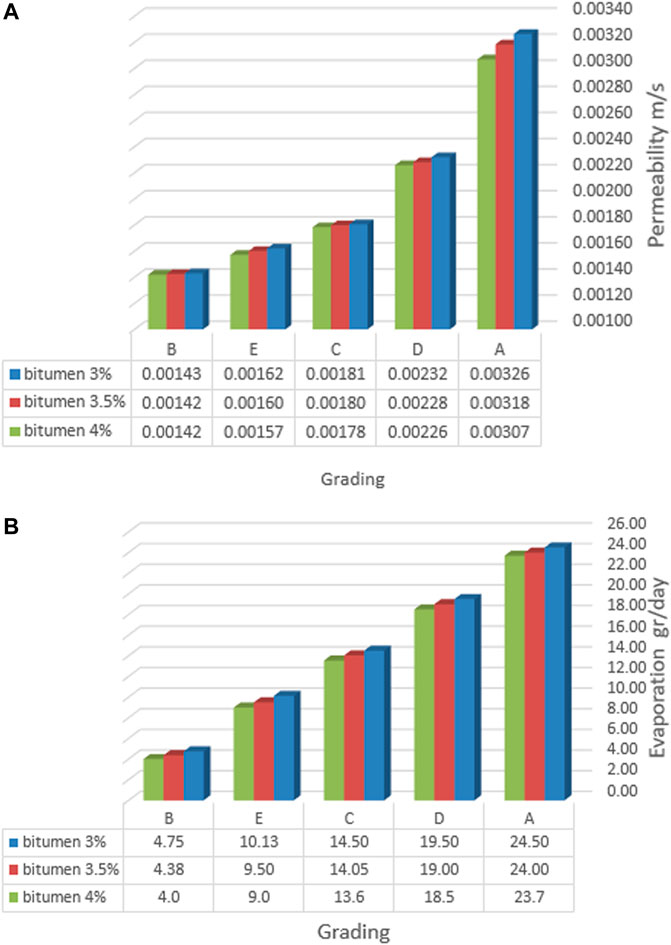
FIGURE 12. (A) Graph of average permeability in m/s. (B) Evaporation test results in gr/day.
As shown in Figure 12A, with a constant percentage of bitumen, the coarser the grading, the higher the permeability.
Grading A due to being coarser and having more cavities and porosity, water passage ducts are more than the other aggregates and therefore has more permeability and also grading B due to being more fine and as a result of cavities and porosity has less permeability than the other aggregates. On the other hand, with increasing the amount of bitumen due to filling some cavities with bitumen, the amount of permeability decreases so that the amount of permeability of samples with 4% bitumen has decreased compared to the permeability of samples with 3% of bitumen by 2.72% from 3% bitumen to 4% bitumen percentage, the amount of permeability reduction is not significant; because increasing the amount of bitumen is small.
According to Zhou et al.'s research in 2021, the main factor in creating permeability in a porous asphalt mixture is air void, so the degree of permeability strongly depends on the air void. Reducing the amount of air void also reduces the permeability (Zhu et al., 2021) which is consistent with the results of this study.
4.1.2 Results of Permeability Test After Dust Spreading on the Optimal Sample
Due to the fact that the first rains are muddy and accompanied by fine dust, the permeability test was performed after dust distribution (dust collected from the surface of traditional texture passages) for the optimal sample in two stages: first the maximum, minimum, and average dust values were spread on the samples and then the permeability test for each amount of contamination with three repetitions was performed and in the second stage, with the maximum amount of contamination, the infiltration test was repeated ten times, assuming that 10 years had passed. In both stages, the amount of infiltration did not change from the initial permeability (without dust) because the dust particles were very fine and after mixing with water, they easily passed through voids of the asphalt mixture. Figure 13 shows the asphalt mixture after dust dispersal.
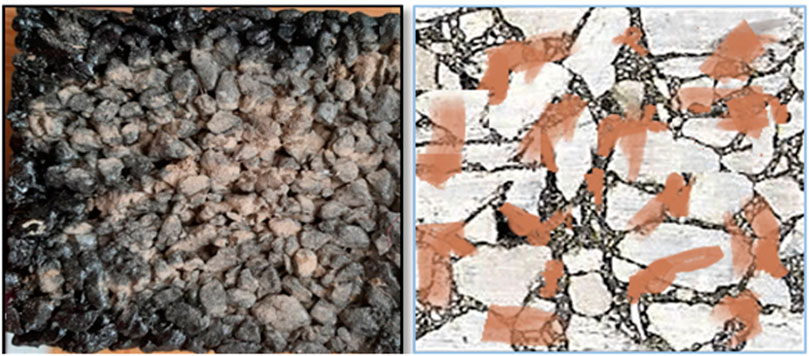
FIGURE 13. Dust spread sample on the asphalt mixture sample, realistic and schematic images.
In a study of clogged porous asphalt mixture voids, Xu et al. found that because dust particles were smaller than the porous asphalt mixture voids, they were often pushed deeper and did not clog the voids (Xu et al., 2020). On the other hand, according to the results of Anders et al.’s research, washing results from raindrops restoring the permeability capacity of the pavement (Andrés-Valeri et al., 2016), which is consistent with the results of permeability testing after dust dispersion of this research.
4.2 Evaporation Test Results
4.2.1 Evaporation Test Results in the Initial State
An evaporation test for each sample was performed according to the method mentioned in sections 3–2 and the average evaporation for each aggregate was calculated and its values are presented in Figure 12B.
As shown in Figure 12B, the amount of evaporation decreases with increasing bitumen percentage and finer grading due to reduced air void and porosity of the porous binder layer.
According to the results of Abofol et al.'s research in 2019, air voids, or in other words, the percentage of voids, have the most fundamental role in the rate of evaporation of the porous asphalt mixture, and since the grading of the air void, or in other words, the percentage of void of porous asphalt mixture increases, the rate of evaporation also increases (Aboufoul et al., 2019). On the other hand, because with the increase of the percentage of bitumen, some voids are filled with bitumen and the percentage of void decreases, the amount of evaporation decreases.
4.2.2 Evaporation Test Results After Dust Dispersal
The evaporation test was performed after spreading the dust (dust collected from the surface of traditional texture passages) for the optimal sample in two stages: first the maximum, minimum, and average dust values were spread on the sample and then the evaporation test was performed for each amount of contamination. With the maximum amount of contamination, the evaporation test was repeated ten times with the assumption of 10 years without rain and washing. The percentage decreased according to Figure 14.
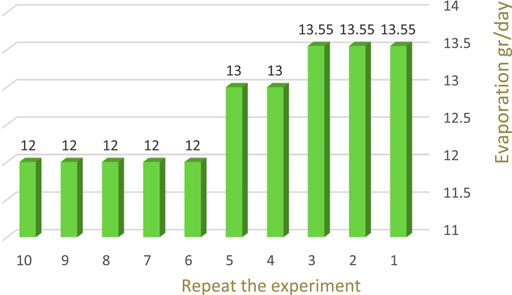
FIGURE 14. The average of the optimal sample evaporation after dust distribution in gr/day.
As the results show, in the early years, dust has no effect on the rate of evaporation, but after 4 years, the rate of evaporation begins to decrease, and after 10 years, the amount of evaporation decreases by about 11%.
The reason that the amount of evaporation does not decrease in the early years is because the dust particles are very fine and pass through voids of the porous asphalt mixture or sit on the surface of the asphalt mixture aggregate and have no effect on the voids, so it has no effect on the rate of evaporation. For 4 years, due to the accumulation of dust and blockage of small cavities, the rate of evaporation has decreased and after a time, the amount of evaporation has been fixed because dust particles are only effective on small cavities and as mentioned, these particles have passed through large cavities and it does not block them.
According to the results of Abofol et al.'s research in 2019, air voids play the most fundamental role in the rate of evaporation of a porous asphalt mixture (Aboufoul et al., 2019), so anything that reduces air void in the porous asphalt mixture will cause evaporation.
4.3 Determining the Optimal Sample (Optimal Bitumen and Granulation)
4.3.1 Cantabro Test Results
The Cantabro test results are presented in Supplementary Table S6.
It should be noted that the maximum weight loss in this experiment at 25°C is 25% (Isenring et al., 1990).
4.3.2 Results of the Response Level Method
After performing the permeability, evaporation, and Cantabro tests, by entering the average results of these tests in the Design Expert software and limiting the Cantabro results between 0 and 25%, grading with d10 = 3.005 bitumen 4.055 or the same C grading or 4% bitumen is one of the answers for grading and optimal bitumen percentage. Supplementary Table S7 lists the input data to the software and Supplementary Table S8 lists the conditions defined for the software.
In addition to determining, with the help of this software, the relationship between grading and the percentage of bitumen, the rate of evaporation and permeability was also determined. The relationship between permeability and independent variables is shown in Eq. 8. Also, Supplementary Table S9 summarizes the statistical information of the model and Figure 15A show the effect of bitumen percentage and gradation on the permeability.
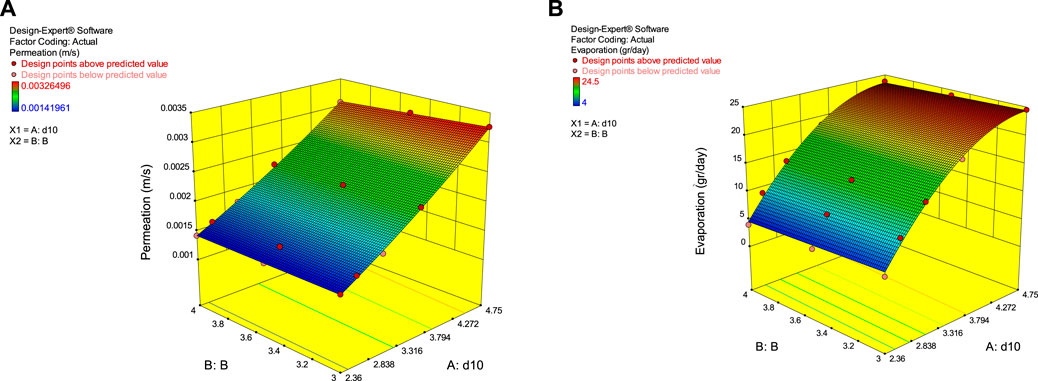
FIGURE 15. (A) Chart of the effect of bitumen percentage and gradation on permeability (B) Chart of the effect of bitumen percentage and gradation on the evaporation rate.
The relationship between the evaporation rate and independent variables is given in Eq. 9. Supplementary Table S9 shows the analysis of variance of the model and Figure 15B shows the effect of bitumen percentage and gradation on the evaporation rate.
It should be noted that these relationships are true for 3%–4% bitumen and for porous binder layer gradation (Supplementary Table S5).
It should be noted that Eqs. 8, 9 help to estimate the permeability and evaporation rate without sample construction and with basic information such as grain size characteristics and bitumen percentage. This reduces sample production and testing and as a result, it will be economically viable.
4.4 Performance Test Results
In order to evaluate the performance of porous asphalt with grain size and optimal bitumen percentage, empty space percentage, modified Latman, compressive and psychological strength, and aged Cantabro tests were performed on the Marshall samples. The results of these experiments are presented in Supplementary Table S11.
According to Supplementary Table S11, the results of the experiments performed on the proposed optimal sample of the response surface method (granulation C with 4% bitumen), show that this sample is acceptable in terms of regulations.
5 Conclusion Additional Requirements
In this study, we first tried to measure and compare the performance of porous binders with different granulations in reducing runoff by means of permeability and evaporation experiments with an innovative and new method. Also, using the porous binder granulation response surface method and the optimal bitumen percentage for performance in traditional texture passages to control runoff was presented. Finally, the grain size performance and the optimal bitumen percentage were evaluated by performing empty space percentage, modified Latman, compressive and psychological strength, and aged Cantabro tests.
1. As the infiltration gradation becomes finer, the evaporation and the minimum percentage of bitumen are reduced by about 55%, 82%, and about 60%, respectively.
2. Intermediate gradation with 4% bitumen is suitable and optimal for use in traditional texture passages, because according to the results of the Design Expert software, it has a good rate of evaporation and penetration and a lower percentage of bitumen.
3. After 10 years of porous binder application and dust on the surface, the penetration rate does not change.
4. After 10 years (assuming no rain and washing) from the application of the porous binder and the placement of dust on its surface, the rate of evaporation is reduced by about 11%.
5. With the percentage of bitumen and the effective size
6. The results of the tests performed on the optimal sample proposed by the response surface method (gradation C with 4% bitumen), show that this sample is acceptable in terms of regulations.
7. In general, the granulations provided for porous binders can be used in paving parking lots and freeways and other urban thoroughfares and bitumen, and even landscaping. However, it is necessary to determine the optimal grain size and percentage of bitumen according to the project conditions, including traffic conditions and weather conditions.
Data Availability Statement
The raw data supporting the conclusions of this article will be made available by the authors, without undue reservation.
Author Contributions
All authors contributed to the study’s conception and design. Material preparation, performing tests, data collection, and analysis were performed by ZG as Master Thesis in Yazd University. The first draft of the manuscript was written by ZG, and all authors commented on all manuscript versions. All authors have read and approved the published version of the manuscript.
Conflict of Interest
The authors declare that the research was conducted in the absence of any commercial or financial relationships that could be construed as a potential conflict of interest.
Publisher’s Note
All claims expressed in this article are solely those of the authors and do not necessarily represent those of their affiliated organizations, or those of the publisher, the editors, and the reviewers. Any product that may be evaluated in this article, or claim that may be made by its manufacturer, is not guaranteed or endorsed by the publisher.
Supplementary Material
The Supplementary Material for this article can be found online at: https://www.frontiersin.org/articles/10.3389/fbuil.2022.862583/full#supplementary-material
Supplementary Table S1 | General characteristics of sandy soil samples used in the research.
Supplementary Table S2 | Specifications of used bitumen.
Supplementary Table S3 | Low limit gradation of the proposed porous binder gradation.
Supplementary Table S4 | Upper limit gradation of the proposed granular binder gradation.
Supplementary Table S5 | Types of granulation studied in this research.
Supplementary Table S6 | Percentage of weight loss of the sample.
Supplementary Table S7 | Input data in software.
Supplementary Table S8 | Terms defined for the application.
Supplementary Table S9 | Summary of statistical information of the model.
Supplementary Table S10 | Summary of statistical information of the model.
Supplementary Table S11 | Performance test results.
References
Aboufoul, M., Shokri, N., Saleh, E., Tuck, C., and Garcia, A. (2019). Dynamics of Water Evaporation from Porous Asphalt. Constr. Build. Mater. 202, 406–414. doi:10.1016/j.conbuildmat.2019.01.043
Adams, M. C., and Cahill, T. H. (2003). “Infiltration BMPs—Porous Asphalt Pavement and beyond,” in World Water & Environmental Resources Congress 2003, 1–13. doi:10.1061/40685(2003)332
Ahiablame, L. M., Engel, B. A., and Chaubey, I. (2012). Effectiveness of Low Impact Development Practices: Literature Review and Suggestions for Future Research. Water Air Soil Pollut. 223 (7), 4253–4273. doi:10.1007/s11270-012-1189-2
Akhtar, M. N., Al-Shamrani, A. M., Jameel, M., Khan, N. A., Ibrahim, Z., and Akhtar, J. N. (2021). Stability and Permeability Characteristics of Porous Asphalt Pavement: An Experimental Case Study. Case Stud. Constr. Mater. 15, e00591. doi:10.1016/j.cscm.2021.e00591
Almássy, K., and Joó, A. L. (2009). Special Materials in the Road Building--Grids and Netts Application Terms for Improving the Pavement Structures. Epitoanyag-Journal Silic. Based Compos. Mater. 2, 55–59.
Andrés-Valeri, V. C., Marchioni, M., Sañudo-Fontaneda, L. A., Giustozzi, F., and Becciu, G. (2016). Laboratory Assessment of the Infiltration Capacity Reduction in Clogged Porous Mixture Surfaces. Sustainability 8 (8), 751. doi:10.3390/su8080751
Borana, L., Yin, J.-H., Singh, D. N., and Shukla, S. K. (2016). Interface Behavior from Suction-Controlled Direct Shear Test on Completely Decomposed Granitic Soil and Steel Surfaces. Int. J. Geomech. 16 (6), D4016008. doi:10.1061/(ASCE)GM.1943-5622.0000658
Brown, R. A., and Borst, M. (2015). Quantifying Evaporation in a Permeable Pavement System. Hydrol. Process. 29 (9), 2100–2111. doi:10.1002/hyp.10359
Cheng, Y.-Y., Lo, S.-L., Ho, C.-C., Lin, J.-Y., and Yu, S. (2019). Field Testing of Porous Pavement Performance on Runoff and Temperature Control in Taipei City. Water 11 (12), 2635. doi:10.3390/w11122635
Gáspár, B. Z. L. (2016). Literature Review for the Selection of the ‘optimal’ Type of Asphalt Wear Layer for High-Traffic Roads. Útügyi Lapok 4.
Hamzah, D., and Hardiman, M. O. (2004). Effect of Maximum Aggregate Size on Single Layer Porous Asphalt Properties and a Proposal for Double Layer to Resist Clogging.
Hamzah, M. O., Samat, M. M., Joon, K. H., Muniandy, R., Tech, D., and Bangwha2-dong, G. (2004). Modification of Aggregate Grading for Porous Asphalt.
Hu, J., Qian, Z., Liu, P., Wang, D., and Oeser, M. (2020). Investigation on the Permeability of Porous Asphalt Concrete Based on Microstructure Analysis. Int. J. Pavement Eng. 21 (13), 1683–1693. doi:10.1080/10298436.2018.1563785
Hu, M., Sayama, T., Zhang, X., Tanaka, K., Takara, K., and Yang, H. (2017). Evaluation of Low Impact Development Approach for Mitigating Flood Inundation at a Watershed Scale in China. J. Environ. Manag. 193, 430–438. doi:10.1016/j.jenvman.2017.02.020
Isenring, T., Koster, H., and Scazziga, I. (1990). Experiences with Porous Asphalt in Switzerland. Transp. Res. Rec. 1265.
Jusić, S., Hadžić, E., and Milišić, H. (2019). Stormwater Management by Green Roof. ACTA Sci. Agric. 3, 57–62.
Jusić, S., Hadžić, E., and Milišić, H. (2019). “Urban Stormwater Management - New Technologies,” in International Conference “New Technologies, Development and Applications”, 790–797. doi:10.1007/978-3-030-18072-0_90
Król, J. B., Khan, R., and Collop, A. C. (2018). The Study of the Effect of Internal Structure on Permeability of Porous Asphalt. Road. Mat. Pavement Des. 19 (4), 935–951.
Lyons, K. R., and Putman, B. J. (2013). Laboratory Evaluation of Stabilizing Methods for Porous Asphalt Mixtures. Constr. Build. Mater. 49, 772–780. doi:10.1016/j.conbuildmat.2013.08.076
Ma, X., Jiang, J., Zhao, Y., and Wang, H. (2021). Characterization of the Interconnected Pore and its Relationship to the Directional Permeability of Porous Asphalt Mixture. Constr. Build. Mater. 269, 121233. doi:10.1016/j.conbuildmat.2020.121233
Management and Program Organization of the Country (2022). 1394 Instructions for Design, Implementation and Maintenance of Porous Asphalt, Issue No. 384- 1. Tehran, Iran: Management and Program Organization of the Country.
Mohammed, S. A., Hamouda, M. A., and El-Hassan, H. (2021). A Meta-Analysis of Contaminant Removal from Urban Stormwater by Permeable Pavements.
Montes, F., Valavala, S., and Haselbach, L. M. (2005). A New Test Method for Porosity Measurements of Portland Cement Pervious Concrete. J. ASTM Int. 2 (1), 1–13.
Peng, B., Han, S., Han, X., and Zhang, H. (2021). Laboratory and Field Evaluation of Noise Characteristics of Porous Asphalt Pavement. Int. J. Pavement Eng. 2021, 1–14. doi:10.1080/10298436.2021.1893319
Pereira, L. M. S., Milan, T. M., and Tapia-Blácido, D. R. (2021). Using Response Surface Methodology (RSM) to Optimize 2G Bioethanol Production: a Review. Biomass Bioenergy 151, 106166. doi:10.1016/j.biombioe.2021.106166
Poulikakos, M., Takahashi, L., and Partl, S. (2006). Evaluation of Improved Porous Asphalt by Various Test Methods. Dübendorf, Switzerland: Rilem Publications.
Praticò, F. G., Briante, P. G., Colicchio, G., and Fedele, R. (2020). An Experimental Method to Design Porous Asphalts to Account for Surface Requirements. J. Traffic Transp. Eng. Engl. Ed. 8 (3), 439–452. doi:10.1016/j.jtte.2019.05.006
Raspati, G. S., Azrague, K., and Jotte, L. (2017). Review of Stormwater Management Practices. Berlin, Germany: Klima 2050 Rep.
Ren, J., Xu, Y., Huang, J., Wang, Y., and Jia, Z. (2021). Gradation Optimization and Strength Mechanism of Aggregate Structure Considering Macroscopic and Mesoscopic Aggregate Mechanical Behaviour in Porous Asphalt Mixture. Constr. Build. Mater. 300, 124262. doi:10.1016/j.conbuildmat.2021.124262
Rode, S., Guevara, S., and Bonnefond, M. (2018). Resilience in Urban Development Projects in Flood-Prone Areas: a Challenge to Urban Design Professionals. Town Plan. Rev. 89 (2), 167–190. doi:10.3828/tpr.2018.10
Suman, S. K., and Kumar, R. (2022). “Hydraulic Design of Reservoir in Permeable Pavement for Mitigating Urban Stormwater,” in River Hydraulics (Berlin, Germany: Springer), 1–11. doi:10.1007/978-3-030-81768-8_1
Tziampou, N., Coupe, S. J., Sañudo-Fontaneda, L. A., Newman, A. P., and Castro-Fresno, D. (2020). Fluid Transport within Permeable Pavement Systems: A Review of Evaporation Processes, Moisture Loss Measurement and the Current State of Knowledge. Constr. Build. Mater. 243, 118179. doi:10.1016/j.conbuildmat.2020.118179
Xu, B., Li, M., Liu, S., Fang, J., Ding, R., and Cao, D. (2018). Performance Analysis of Different Type Preventive Maintenance Materials for Porous Asphalt Based on High Viscosity Modified Asphalt. Constr. Build. Mater. 191, 320–329. doi:10.1016/j.conbuildmat.2018.10.004
Xu, S., Lu, G., Hong, B., Jiang, X., Peng, G., Wang, D., et al. (2020). Experimental Investigation on the Development of Pore Clogging in Novel Porous Pavement Based on Polyurethane. Constr. Build. Mater. 258, 120378. doi:10.1016/j.conbuildmat.2020.120378
Yu, T., Zhang, H., and Wang, Y. (2020). Interaction of Asphalt and Water between Porous Asphalt Pavement Voids with Different Aging Stage and its Significance to Drainage. Constr. Build. Mater. 252, 119085. doi:10.1016/j.conbuildmat.2020.119085
Keywords: porous asphalt layer, and optimal bitumen percentage, traditional texture, protection, runoff control
Citation: Ghafori fard Z, Khabiri MM and Kornél Tamás A (2022) Modification of Aggregate Gradation for Simultaneous Optimization of Evaporation and Permeability of Porous Asphalt Mixtures. Front. Built Environ. 8:862583. doi: 10.3389/fbuil.2022.862583
Received: 26 January 2022; Accepted: 03 May 2022;
Published: 11 July 2022.
Edited by:
Lalit Borana, Indian Institute of Technology Indore, IndiaReviewed by:
K. Ravi, Indian Institute of Technology Guwahati, IndiaDao-Yuan Tan, Hong Kong Polytechnic University, Hong Kong SAR, China
Priyansh Singh, Indian Institute of Technology Indore, India
Copyright © 2022 Ghafori fard, Khabiri and Kornél Tamás. This is an open-access article distributed under the terms of the Creative Commons Attribution License (CC BY). The use, distribution or reproduction in other forums is permitted, provided the original author(s) and the copyright owner(s) are credited and that the original publication in this journal is cited, in accordance with accepted academic practice. No use, distribution or reproduction is permitted which does not comply with these terms.
*Correspondence: Mohamad Mehdi Khabiri, mkhabiri@yazd.ac.ir